chemical and physical characteristics of …
TRANSCRIPT

CHEMICAL AND PHYSICAL CHARACTERISTICS OF PRECIPITATION AT SELECTED SITES IN FLORIDA
* L A 8 A
U.S. GEOLOGICAL SURVEY WATER-RESOURCES INVESTIGATIONS 80-81
4
Prepared in cooperation with the
FLORIDA DEPARTMENT OF ENVIRONMENTAL REGULATION
50272-101_______________
REPORT DOCUMENTATION PAGE
1. REPORT NO. 3. Recipient's Accession No.
4. Title and Subtitle
CHEMICAL AND PHYSICAL CHARACTERISTICS OF PRECIPITATION AT SELECTED SITES IN FLORIDA
5. Report Date
September 1980
7. Author(s)
G. A. Irwin and R. T. Kirkland8. Performing Organization Rept. No.
USGS WRI 80-819. Performing Organization Name and Address
U.S. Geological Survey Water Resources Division Suite F-240, 325 John Knox Road Tallahassee, Florida 32303
10. Project/Task/Work Unit No.
11. Contract(C) or Grant(G) No.
(C)
(G)
12. Sponsoring Organization Name and Address
U.S. Geological Survey Water Resources Division Suite F-240, 325 John Knox Road Tallahassee, Florida 32303
13. Type of Report & Period Covered
14.
15. Supplementary Notes
Prepared in cooperation with the Florida Department of Environmental Regulation.
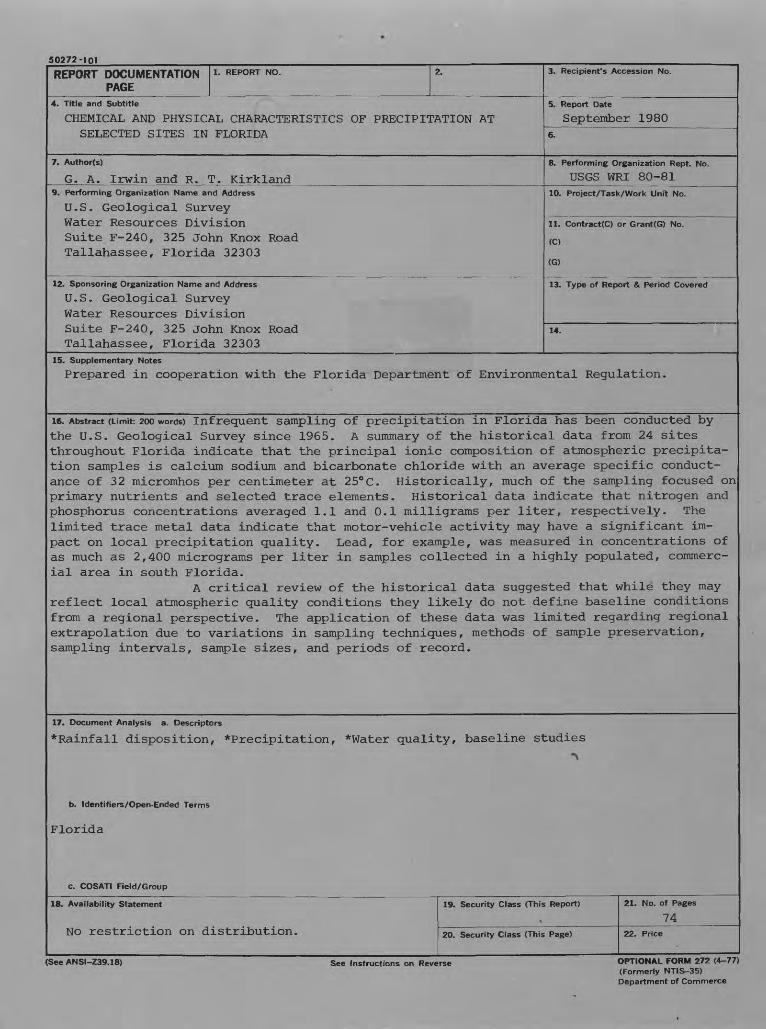
16. Abstract (Limit: 200 words) Infrequent sampling of precipitation in Florida has been conducted by the U.S. Geological Survey since 1965. A summary of the historical data from 24 sites throughout Florida indicate that the principal ionic composition of atmospheric precipita tion samples is calcium sodium and bicarbonate chloride with an average specific conduct ance of 32 micromhos per centimeter at 25°C. Historically, much of the sampling focused on primary nutrients and selected trace elements. Historical data indicate that nitrogen and phosphorus concentrations averaged 1.1 and 0.1 milligrams per liter, respectively. The limited trace metal data indicate that motor-vehicle activity may have a significant im pact on local precipitation quality. Lead, for example, was measured in concentrations of as much as 2,400 micrograms per liter in samples collected in a highly populated, commerc ial area in south Florida.
A critical review of the historical data suggested that while they mayreflect local atmospheric quality conditions they likely do not define baseline conditions from a regional perspective. The application of these data was limited regarding regional extrapolation due to variations in sampling techniques, methods of sample preservation, sampling intervals, sample sizes, and periods of record.
17. Document Analysis a. Descriptors
*Rainfall disposition, *Precipitation, *Water quality, baseline studies-\
b. Identifiers/Open-Ended Terms
Florida
c. COSATI Field/Group
18. Availability Statement
No restriction on distribution.
19. Security Class (This Report)
20. Security Class (This Page)
21. No. of Pages
7422. Price
(See ANSI-Z39.18) See /nstruct/ons on Reverse OPTIONAL FORM 272 (4-77) (Formerly NTIS-35) Department of Commerce

CHEMICAL AND PHYSICAL CHARACTERISTICS OF PRECIPITATION
AT SELECTED SITES IN FLORIDA
By G. A. Irwin and R. T. Kirkland
U.S. GEOLOGICAL SURVEY
Water-Resources Investigations 80-81
Prepared in cooperation with theFLORIDA DEPARTMENT OF ENVIRONMENTAL REGULATION
1980
UNITED STATES DEPARTMENT OF THE INTERIOR
CECIL D. ANDRUS, Secretary
GEOLOGICAL SURVEY
H. William Menard, Director
For additional information write to:
U.S. Geological Survey Suite F-240 325 John Knox Road Tallahassee, FL 32303
CONTENTSPage
Abstract-- -- ----------- _________________ ___ -____ ____ jIntroduction- - ------ - ________________ _______ ____ _ 2Literature review------------ ------------------------ --------- 3Factors controlling precipitation data collection and analysis---- 5Overview of historical precipitation-quality data collection
in Florida---- -------- __________________________ _____ __ 5Scope of past monitoring programs-------- ------- - ------ \\
Methods and procedures----- -------- ----- -___ __ _--_ 13Sample collection and preservation-- -- ----------- ----- 13Analytical methods-- 14
Results-- ---- ---------_-_____--_____- _ _____________ _____ 14Major inorganic chemical composition-------------- --------- 14
Specific conductance-- - -- ------------ --------- 15Selected major chemical constituents--------- --- ---- 16pH 19
Selected primary nutrients- ---------------- - ______ _ 19Nitrogen----- ------ - - ----- _______ _ _____ 19Phosphorus-- ---- ---- __-__ ----- -- _ _ 19
Selected trace metals 19Discussion------------- -- - - - --------- - -- ---- 24Summary -- - -- - - - ---- - __________ ______ _ 25References cited- ----- - ----- __________ __-__ -_ 26Data compilation 29
ILLUSTRATIONSPage
Figure 1. Map showing locations of precipitation samplingsites-------- - --- ------- -- _-_______------- 7
2. Map showing average chemical composition of precipita tion samples at selected sites ---------- -- - 15
3. Graph of distribution of mean specific conductance atselected precipitation sampling sites---- - - --- 17
4. Graph of distribution of mean calcium, sodium, and chloride concentrations at selected precipitation sampling sites------ ---- - - - ________ ____ ig
5. Graph of distribution of mean total nitrogen concen trations at selected precipitation sites- ------ - 20
6. Graph of distribution of mean total phosphorus concen trations at selected precipitation sites- - ------ 21
TABLESPage
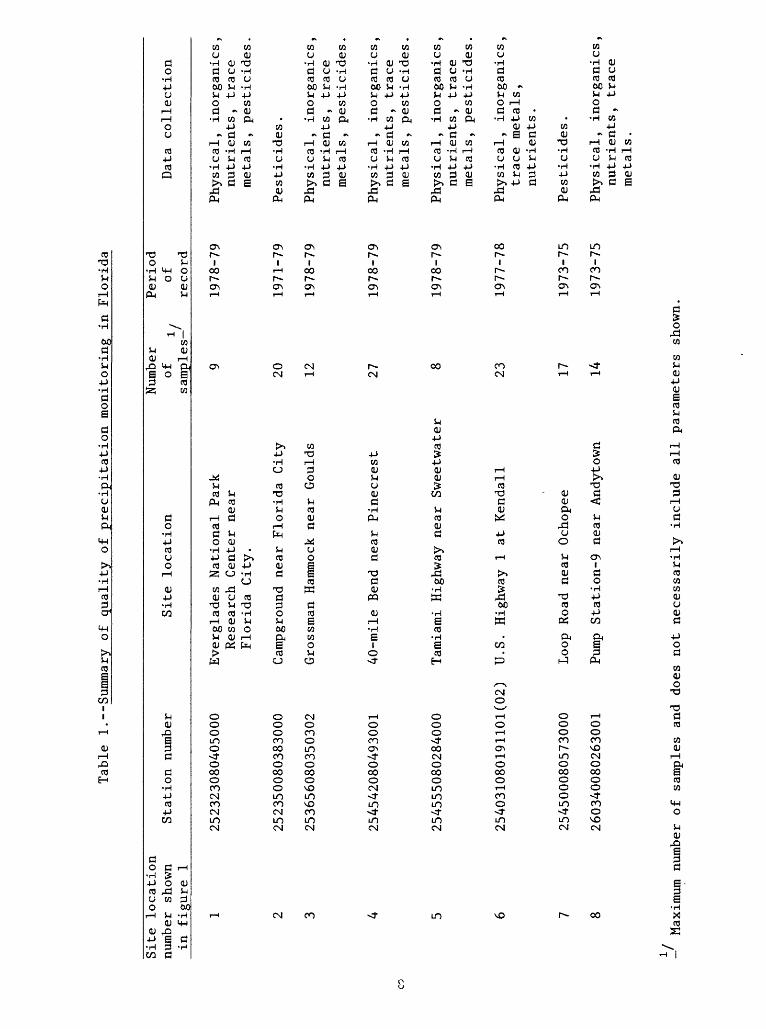
Table 1. Summary of quality of precipitation monitoringin Florida--------- --- - ------ - --- ---- g
2. Summary of selected trace element data for selectedprecipitation sampling sites------ ---- __-_---_- 22
III

CHEMICAL AND PHYSICAL CHARACTERISTICS OF PRECIPITATION
AT SELECTED SITES IN FLORIDA
By G. A. Irwin and R. T. Kirkland
ABSTRACT
Infrequent sampling of precipitation in Florida has been conducted by the U.S. Geological Survey since 1965. A summary of the historical data from 24 sites throughout Florida indicate that the principal ionic composition of atmospheric precipitation samples is calcium sodium and bicarbonate chloride with an average specific conductance of 32 micromhos per centimeter at 25°C. Historically, much of the sampling focused on primary nutrients and selected trace elements. Historical data indicate that nitrogen and phosphorus concentrations averaged 1.1 and 0.1 milligrams per liter, respectively. The limited trace metal data indicate that motor-vehicle activity may have a significant impact on local precipitation quality. Lead, for example, was measured in concentrations of as much as 2,400 micrograms per liter in samples collected in a highly populated, commercial area in south Florida. Statistical testing indicated that most major inorganic constituents, primary nutrients, and trace metals were significantly different among the sampling sites. The pH data indicated a range of about 5.0 to 7.0, but only limited pH data were collected and analyzed at the historical sites in such a timely manner as to represent pH conditions of the atmospheric precipitation during active rainfall.
A critical review of the historical data suggested that while they may reflect local atmospheric quality conditions they likely do not define baseline conditions from a regional perspective. The applica tion of these data was limited regarding regional extrapolation due to variations in sampling techniques, methods of sample preservation, sampling intervals, sample sizes, and periods of record.
INTRODUCTION
The chemistry of the atmosphere was largely a neglected topic until the last decade when concern about pollution produced a flurry of activity (Thrush, 1978). Perhaps the most widely publicized area of concern is acid rain. However, other environmental sectors such as aerosol propellants and toxic trace elements also are now recognized as potential hazards to atmospheric quality.
In response to concern about atmospheric pollution at the national level, a Work Group on Precipitation Quality was established by the (Federal) Interagency Advisory Committee on Water Data in September 1976, to determine the present status and future needs in the area of research and monitoring of precipitation (U.S. Department of the Interior, 1978). The work group concluded that one of the major gaps in the understanding of the hydrologic cycle is in the realm of precip itation chemistry. They further concluded that: (1) Long-term data on the quality of precipitation, with few exceptions, are not available in the United States; (2) data have been collected using a wide range of sampling techniques; (3) data have been generated using a wide range of analytical methods varying greatly in accuracy and precision; (4) data lack geographic coverage; and (5) sufficient data are not available nationwide for an analysis of either past trends in precipitation quality or for baseline evaluations.
With the national findings in mind, the purpose of this study was to summarize and evaluate specifically the historical quality of pre cipitation data collected in Florida by the U.S. Geological Survey. This report is intended to serve as a general reference for future quality of precipitation monitoring and project planning. This study and report was conducted in cooperation with the Florida Department of Environmental Regulation as part of the continuing statewide studies of environmental quality.
The scope of this project included: (1) A brief literature review of recent quality of precipitation studies; (2) complilation, technical review, summarization, and evaluation of the historical data collected by the Geological Survey on the quality of precipitation in Florida; (3) summarization of the history, purpose, and scope of most recent Geological Survey investigations conducted in Florida which focused at least in part on the quality of precipitation; (4) summarization of previous methods of collection, sample treatment, and analytical methods and procedures.
LITERATURE REVIEW
A brief review of the recent literature pertaining to the quality of precipitation indicates that much scientific effort is being directed toward the occurrence, processes, and environmental impacts of acid rr. u Other areas of research include atmospheric deposition of toxic trace elements and nutrient materials. The effects of aerosol propellants on the composition of the atmosphere is another area which is currently receiving considerable attention.
It is evident in the literature that acidic rain resulting from increased world use of coal for energy production is causing worldwide concern. As summarized by Summers and Whelpdale (1976) it is predicted that the use of coal for generating electrical power in North America will result in an increase of nitrogen and sulfur emissions which will contribute to increased acidity of atmospheric precipitation. Wright and others (1976) report that acid precipitation occurs over large areas of Scandinavia, and is the result of emissions which originate in the industrialized areas of Great Britain and Central Europe. Henriksen and Wright (1977) report evidence which suggests that acidity of lakes and rivers in southern Scandinavia has increased over past decades, and is probably due to the deposition of acid precipitation which primarily originates from emissions, oxidation, and long-range transportation of sulfur and nitrogen oxides released from burning fossil fuels. Vermuelen (1978) reports that the chemical composition of precipitation in the Netherlands indicate that acids are present in larger quantities than should occur naturally. This increase in pre cipitation acidity is attributed to ever increasing emissions of sulfur and nitrogen oxides. Canadian researchers suggest that acid rain is likely to cause acidification of many lakes and streams in south- central Ontario because of their low buffering capacity (Dillon and others, 1978). In a study of six Swedish lakes, the reduction of decomposer activity by acidification has resulted in an interference with nutrient recycling resulting in a reduction of the species diversity of algal and zooplankton communities (Hendrey and others, 1976).
Environmental contamination from trace-element fallout is another area under study. Recent research indicates that precipitation is likely a significant source of many trace-inorganic constituents. Cambray and others (1975) estimated that the atmosphere is a signifi cant source for certain heavy metals and trace elements found in both the North and Clyde Seas. Atmospheric precipitation which occurs over large areas of Scandinavia contains high concentrations of heavy metals such as copper, zinc, cadmium, and lead that mainly originate in the industrialized areas of Great Britain and central Europe (Wright and others, 1976). Atmospheric fallout was found to be a significant source of nickel and copper entering the watershed of a small Canadian lake (Beamish and Van Loon, 1977). Analysis of core samples of bottom

sediments from Woodhull Lake, Adirondack State Park, N.Y., indicated that atmospheric deposition of 44 metals has increased in recent time; similar results have been found in cores from Honnedaga Lake, N.Y., and Lake of the Clouds, Mount Washington, N.H. (Galloway and Likens, 1977). A recent study of urban California locations conducted by the Sanitary Engineering Research Laboratory of the University of California at Berkeley indicated that wet washout of lead from the atmosphere elevates the lead content of rainwater to a level about 0.05 milligrams per liter the limit recommended for drinking water by the Safe Drinking Water Act (SERL news report in the Johnson Drillers Journal, 1979).
Recent studies have indicated that atmospheric precipitation also contributes synthetic organic substances to the Earth's surface. Wells and Johnstone (1978), for example, found measurable atmospheric input to the North Sea of 4 organochlorine groups (PCB, DDT, HCH, and dieldrin).
In addition to acids, trace elements, and organics, precipitation also contains significant quantities of major inorganic constituents. The literature is growing with evidence that rainfall contributes a large percentage of inorganic-chemical constituents which are common in natural surface and ground waters. For example, in a study of a peat catchment in mid-Wales, Cryer (1976) estimated that the magnesium, sodium, potassium, and chloride loads in bulk precipitation accounted for 51, 62, 63, and 56 percent respectively of the total loads discharged from the catchment. Jordan and Fisher (1977) reported that bulk precipitation is the principal source of minerals in the water of St. Thomas, V.I. Scandinavian researchers have observed that precipi tation loading has increased the specific conductance and hardness of many Norwegian lakes, and atmospheric sulfate has replaced bicarbonate as the major anion (Wright and others, 1976).
Atmospheric loading of nutrients, primarily nitrogen and phosphorus, has been considered an integral component of eutrophication for some time. In his compilation of world literature, Vollenweider (1971) reported that the nitrogen salt content in various parts of the world varies between one and several milligrams per liter. Vollen weider further states that unlike nitrogen, little is known about phosphorus deposition from air. The phosphorus loading may be minimal under normal conditions, but the contribution of phosphorus from the air-to-land surfaces should no longer be disregarded when water eutrophication problems are considered.
The importance of the nutrient input from the atmosphere is further highlighted in a study of the eutrophication of selected lakes in Florida (Brezonik and others, 1969). Results of this investigation indicated that the precipitation falling directly on the surface of Anderson-Cue Lake is the most important natural source of nitrogen. The partial nutrient budget analysis of Anderson-Cue Lake for 1968

indicated that 44 kilograms or 26 percent of the nitrogen load to the lake was contributed by rainfall. During this same period the phos phorus input to the lake from rainfall was estimated at 2.67 kilograms or 20 percent of the partial phosphorus budget of 13.27 kilograms. In a similar study of the nutrient budget for Lake Mendota, Wis., it was estimated that the annual nitrogen and phosphorus load to the lake from rainfall was 17 and 2 percent, respectively, (Lee and others, 1966; Brezonik and Lee, 1968, in Brezonik and others, 1969). More recently, Kuntz (1978) reported that the atmosphere is a significant source of nitrogen for the Lake Erie Basin. Brakke (1977) in a study of Lake Sallie in Minnesota, observed an increase in primary production follow ing rainfall events which were due to nutrient loading from dust contamination transported from a fertile-plains area west of the lake. In a study of stormwater quality of three land-use areas in Broward County, Fla., it was estimated that the atmospheric loads at one study site exceeded the stormwater (surface-water) runoff loads for both total nitrogen and phosphorus (Mattraw, 1978).
FACTORS CONTROLLING PRECIPITATION DATA COLLECTION AND ANALYSIS
The inorganic and organic material that falls to the Earth's surface is transported from the atmosphere by two basic pathways. The material is transported either by aqueous precipitation or by dry fallout. Materials associated with atmospheric dry fallout are in continuous circulation to and from the surface of the Earth. The materials associated with aqueous precipitation are present either in a dissolved or particulate state and are deposited during rainfall events. As summarized by Lewis and Grant (1978), from an analytical viewpoint, total dry and wet precipitation consists of three fractions: (1) Dissolved materials in aqueous precipitation; (2) the water-soluble component of dry precipitation; and (3) the water-insoluble component of either wet or dry precipitation.
Unlike many other facets of hydrologic data collection, there are no commonly accepted, time-tested methods and procedures for the sampling of precipitation quality data. The great disparity that exists in methods of collection often severely limits the utility of precipitation-quality data as an interpretive tool. Lewis and Grant (1978) suggest that the study of precipitation chemistry is obviously subject to a large number of methodological difficulties, some of which can be of sufficient importance to effect interpretation of mass balance data.
Lewis and Grant (1978) suggested seven basic causes of interpreta- tional ambiguity of precipitation-quality data: (1) Dry-fallout leaching usually contributes a significant quantity of many dissolved substances contained in bulk precipitation thus, variable leaching potential and leaching rates of dry fallout may complicate data analysis; (2) particle formation and chemical repartitioning in wet
precipitation samples can be caused by algal and bacterial growth. For example, biological growth may extract either the water-soluble component of dry precipitation or the dissolved materials in aqueous precipitation, thus repartitioning the material into the water- insoluble component which is often not analyzed for many chemical constituents; (3) sample collector height, texture, and surface composition can cause data variability. Samplers near the land surface, for example, will collect material of a very local origin which may greatly bias the data. Also, the surface texture and composition of the sampler may greatly control the amount of dry precipitation that is trapped (collected); (4) surface texture and composition of many sampler designs may often cause undersampling (underestimate); (5) local biota, such as birds, pollen, and flying insects can contaminate samples and greatly affect the reliability of the data if preventive steps are not taken during sample collection; (6) a very significant factor affecting the interpretation of precipitation-quality data is in the storage of samples. The composition of precipitation is very susceptible to chemical, physical, and biological change within the sample collector which can be a function of exposure time that a sample is stored in the collector; (7) often the water-insoluble chemical components of the particles are excluded from analysis and this fraction of precipitation may be a very significant input source. Another area which may cause interpreta- tional ambiguity that was not specifically addressed in Lewis and Grant (1978) is variability in sampling procedures and analytical methods; sampling and analytical variability can be particularly troublesome in the interpretation of long-term data.
OVERVIEW OF HISTORICAL PRECIPITATION-QUALITY DATA COLLECTION IN FLORIDA
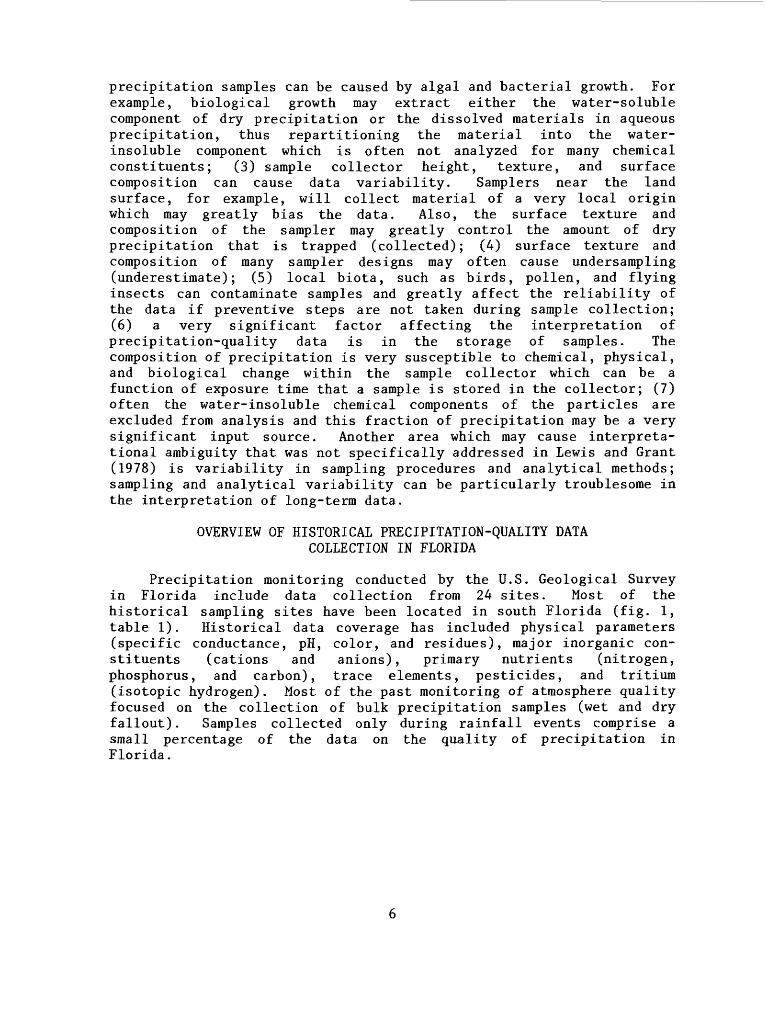
Precipitation monitoring conducted by the U.S. Geological Survey in Florida include data collection from 24 sites. Most of the historical sampling sites have been located in south Florida (fig. 1, table 1). Historical data coverage has included physical parameters (specific conductance, pH, color, and residues), major inorganic con stituents (cations and anions), primary nutrients (nitrogen, phosphorus, and carbon), trace elements, pesticides, and tritium (isotopic hydrogen). Most of the past monitoring of atmosphere quality focused on the collection of bulk precipitation samples (wet and dry fallout). Samples collected only during rainfall events comprise a small percentage of the data on the quality of precipitation in Florida.

20
EXPLANATION
Precipitation sample site- location and number
* ' 'HOLMES / JACKSON
~V _; _o
0 20 40 60 MILES i__j__L_ J
Figure 1.--Locations of precipitation sampling sites
Tabl
e 1.--Summary
of quality
of precipitation
monitoring in Florida
Site lo
cati
on
numb
er shown
in figure 1
Stat
ion
number
Site
lo
cati
onNumber
of
samples
Peri
odof
record
Data collection
252323080405000
2523
5008
0383
000
2536
5608
0350
302
2545
4208
0493
001
254555080284000
Everglades National Pa
rk
Research Ce
nter
ne
ar
Florida
City
.
Campground near Florida
City
Gros
sman
Hammock ne
ar Goulds
40-mile
Bend
near Pi
necr
est
Tamiami
Highway
near Sw
eetw
ater
2540
3108
0191
101(
02)
U.S.
Highway
1 at
Kendall
20 12 27 23
2545
0008
0573
000
Loop
Road near Oc
hope
e 17
2603
4008
0263
001
Pump St
atio
n-9
near Andytown
14
1978-79
Physical,
inorganics,
nutrients, trace
metals,
pest
icid
es.
1971-79
Pesticides.
1978-79
Physical,
inorganics,
nutrients, trace
metals,
pest
icid
es.
1978-79
Physical,
inorganics,
nutrients, trace
meta
ls,
pesticides.
1978
-79
Phys
ical
, inorganics,
nutrients, tr
ace
metals,
pest
icid
es.
1977-78
Physical,
inorganics,
trace
metals,
nutrients.
1973-75
Pest
icid
es.
1973
-75
Phys
ical
, inorganics,
nutr
ient
s, trace
metals.
vMaximum
number of
samples
and
does
no
t necessarily
include
all
para
mete
rs sh
own.
Tabl
e 1.--Summary
of qu
alit
y of pr
ecip
itat
ion
moni
tori
ng in
Flo
rida
--Co
ntin
ued
Site
location
numb
er shown
Stat
ion
numb
er
in figure 1
9 26
0207
0801
1060
0
10
2610
0208
0070
101
11
2616
2908
0072
401
12
2616
1508
0055
901
13
262145080052702
14
2625
5208
2034
301
Site
location
45th Avenue at
Hollywood
U.S. Highway
1 at
Oakland
Park
Samp
le Ro
ad ne
ar Pompano
Beach
U.S.
Hi
ghwa
y 1
at Po
mpan
o Beach
East Water
Plant
at Boca Raton
Sanibel
Isla
nd
Numb
er
Peri
od
of
!-
of
samp
les
record
16 50 54
3 4 4
1973
-75
1975-77
1975
-77
1975
1975-79
1977
Data
co
llec
tion
Pest
icid
es .
Physical,
inor
gani
cs,
nutr
ient
s, trace
metals .
Physical,
inor
gani
cs,
nutr
ient
s, trace
meta
ls .
Phys
ical
, nu
trie
nts.
Pesticides .
Physical,
inorganics.
15 16
264105080221501
2647
1808
1181
50
Pump Station-5
near Lo
xaha
tche
e 14
Orto
na Locks
near La Belle
nutrients, trace
meta
ls.
1973
-75
Phys
ical
, inorganics,
nutrients, trace
metals,
pesticides.
1978-79
Phys
ical
, in
orga
nics
, nu
trie
nts,
tr
ace
metals.
I/ Maximum
numb
er of
samples
and
does not
necessarily
include
all
parameters shown.

Tabl
e 1.--Summary
of quality
of pr
ecip
itat
ion
monitoring in Florida Continued
Site location
numb
er shown
in figure 1
17 18 19 20 21 22 23 24
Station
number
26502908105110
265020081051500
2838
2408
1221
502
290130082365100
2911
1908
2082
100(
01)
2932
4508
1433
600
301735082581800
303314084230304
Site
lo
cati
on
Rim
Cana
l at Mo
ore
Haven
Hurr
ican
e/Ga
te St
ruct
ure
1 at Moore
Have
n.
Lake
Hope at Maitland
Inglis Lock n
ear
Inglis
Federal
Buil
ding
at
Ocala
Buckman
Lock
ne
ar Palatka
Live
Oak
U.S.
Hi
ghwa
y 27 North
near Tallahassee.
Number
of
!,
samp
les
6 11 20 11
227 11 1 5
Period
of
reco
rd
1978
-79
1969
1972-79
1975
1962-79
1975
1979
1977-78
Data
collection
Phys
ical
, inorganics,
nutrients, trace
meta
ls .
Physical,
nutrients.
Physical,
inor
gani
cs,
nutrients, tr
ace
metals.
Physical,
nutrients.
Physical,
inorganic,
tritium.
Physical,
nutrients.
Physical,
nutrients.
Physical,
nutr
ient
s,
trac
e me
tals
.
I/ Maximum
number of samples
and
does
no
t necessarily
incl
ude
all
para
mete
rs shown.
Scope of Past Monitoring Programs
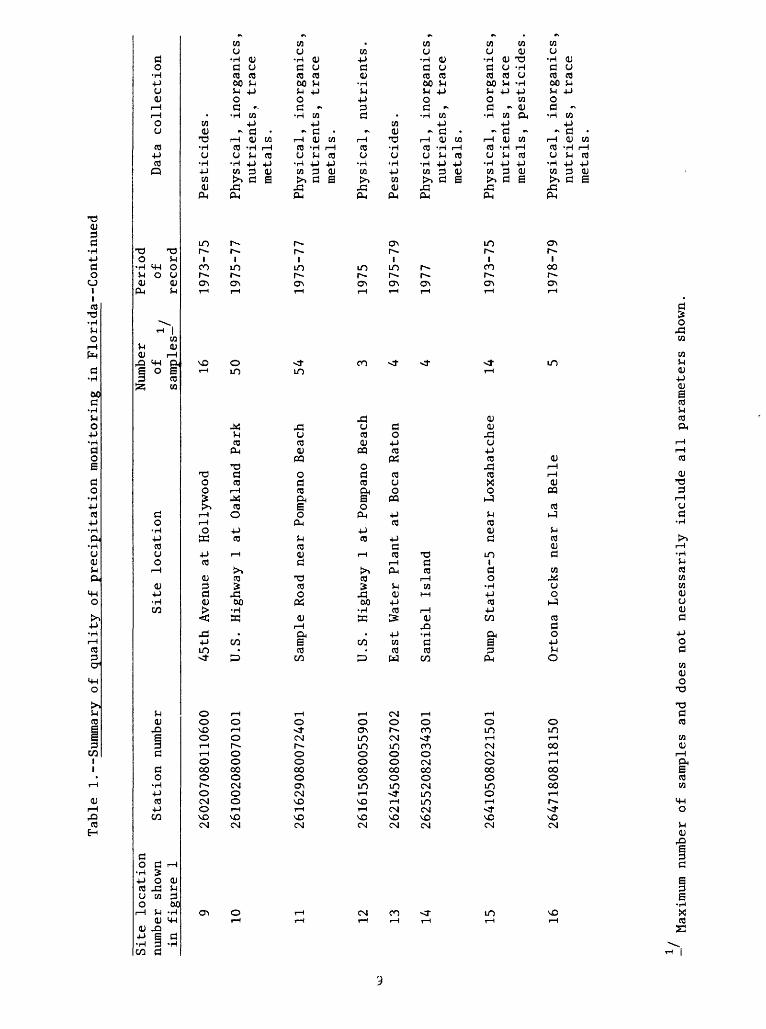
A brief summary of historical precipitation monitoring activities is given below:
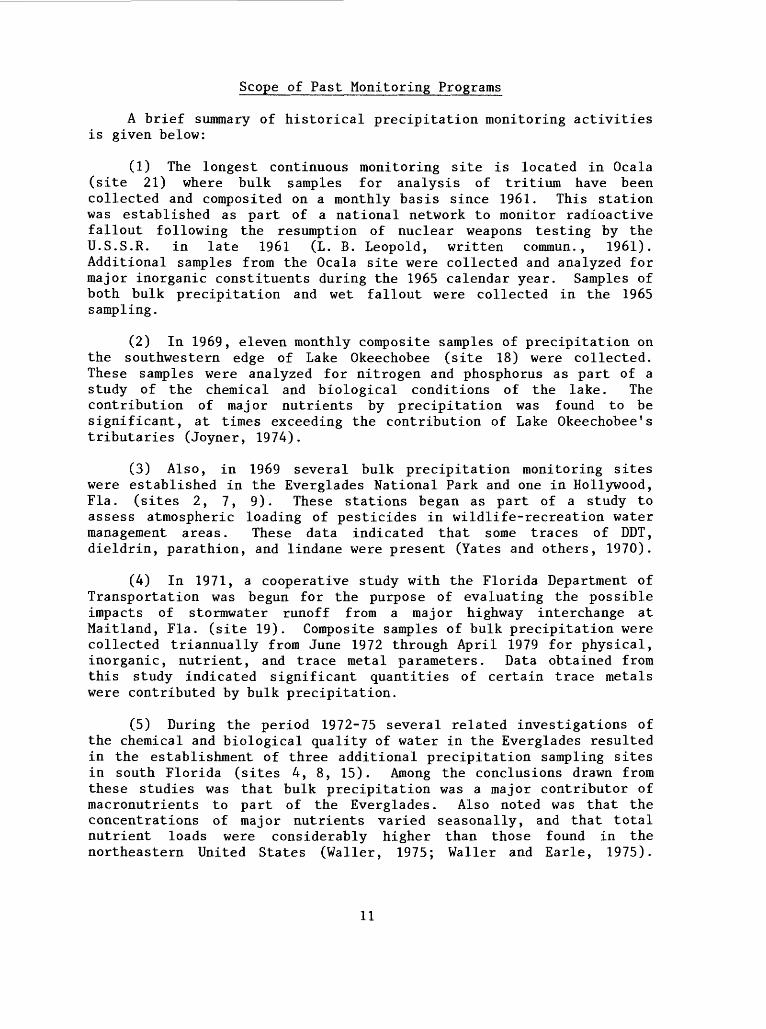
(1) The longest continuous monitoring site is located in Ocala (site 21) where bulk samples for analysis of tritium have been collected and composited on a monthly basis since 1961. This station was established as part of a national network to monitor radioactive fallout following the resumption of nuclear weapons testing by the U.S.S.R. in late 1961 (L. B. Leopold, written commun. , 1961). Additional samples from the Ocala site were collected and analyzed for major inorganic constituents during the 1965 calendar year. Samples of both bulk precipitation and wet fallout were collected in the 1965 sampling.
(2) In 1969, eleven monthly composite samples of precipitation on the southwestern edge of Lake Okeechobee (site 18) were collected. These samples were analyzed for nitrogen and phosphorus as part of a study of the chemical and biological conditions of the lake. The contribution of major nutrients by precipitation was found to be significant, at times exceeding the contribution of Lake Okeechobee's tributaries (Joyner, 1974).
(3) Also, in 1969 several bulk precipitation monitoring sites were established in the Everglades National Park and one in Hollywood, Fla. (sites 2, 7, 9). These stations began as part of a study to assess atmospheric loading of pesticides in wildlife-recreation water management areas. These data indicated that some traces of DDT, dieldrin, parathion, and lindane were present (Yates and others, 1970).
(4) In 1971, a cooperative study with the Florida Department of Transportation was begun for the purpose of evaluating the possible impacts of stormwater runoff from a major highway interchange at Maitland, Fla. (site 19). Composite samples of bulk precipitation were collected triannually from June 1972 through April 1979 for physical, inorganic, nutrient, and trace metal parameters. Data obtained from this study indicated significant quantities of certain trace metals were contributed by bulk precipitation.
(5) During the period 1972-75 several related investigations of the chemical and biological quality of water in the Everglades resulted in the establishment of three additional precipitation sampling sites in south Florida (sites 4, 8, 15). Among the conclusions drawn from these studies was that bulk precipitation was a major contributor of macronutrients to part of the Everglades. Also noted was that the concentrations of major nutrients varied seasonally, and that total nutrient loads were considerably higher than those found in the northeastern United States (Waller, 1975; Waller and Earle, 1975).
11

Sampling at rainfall site 4 was reactivated in 1977 in conjunction with the establishment of another site at the Everglades National Park Research Center (site 1). Data from these stations are used as base line water quality data for the National Park.
(6) During the period 1975-77 four bulk precipitation sampling sites were established in Dade and Broward Counties as part of an urban runoff study (sites 6, 10, 11, 12). Data from the sites were used to assess runoff quality loading from a commercial parking lot (Miller and others, 1979), a major highway (Hardee and others, 1978), a single- family residential area (Mattraw and others, 1979), and a multiple- family residential complex.
(7) In 1975, bulk precipitation data from sites 20 and 22 were collected as part of an environmental impact study of the proposed Cross-Florida Barge Canal. Samples were composited monthly and analyzed for major nutrients. These data, as reported by Lamonds and Merritt (1976), indicated that average concentrations of nitrogen and phosphorus were found to be significant, with levels being slightly lower than those reported by Waller (1975), but slightly higher than those reported by Joyner (1974).
(8) In 1975, sampling of rainfall to monitor atmospheric pest icide contributions was begun at the East Water Plant in Boca Raton, Fla. (site 13). This sampling is a basic data effort and is continuing.
(9) A study to evaluate management of undeveloped wetlands on the eastern edge of the Everglades National Park in Dade County initiated the collection of bulk precipitation at two additional sites in 1978-79 (sites 3, 5). This investigation is designed to assess the effects of agricultural development of the area.
(10) Two sites (16 and 17) on the Caloosahatchee River west of Lake Okeechobee were established in 1978. Data from these bulk precip itation stations will be used in a 3-year investigation of the hydraulic inputs to the river and to provide additional base precipita tion quality data in the area. Except for brief rainfall sampling on Sanibel Island in 1977, no rainfall quality data has been collected west of Lake Okeechobee since 1969 (Joyner, 1974).
(11) Water quality loading of the Ochlockonee River from a rural highway bridge near Tallahassee was the subject of an investigation in cooperation with the Florida Department of Transportation in 1977-78 (site 24). Bulk precipitation samples were collected to estimate
12

atmospheric loading rates. The study noted that nutrient concentra tions were lower than those reported by Waller and Earle (1975) in south Florida and by Lamonds and Merritt (1976) in north-central Florida. Concentrations of selected trace elements were about the same as reported in the earlier studies with the exceptions of lead and zinc (Irwin and Losey, 1978).
(12) The quality of runoff into drainage wells was the subject of a recent reconnaissance in north Florida (site 23). A composite of four sites around Live Oak, Fla., was analyzed to estimate atmospheric contribution to runoff quality (Yurewicz, written commun., 1979).
METHODS AND PROCEDURES
Sample Collection and Preservation
The data included in this report reflect considerable variance in experimental design. Specifically, over the years, the techniques and approaches used for the collection of precipitation samples have not been uniform. For example, the techniques of sample collection have ranged in sophistication from elaborate automated-refrigerated devices to a single 5-gallon jug with a funnel attached. The period of sample collection is another area of high variability for the historical data. At some sites the collection interval for an individual sample was as much as 2 or 3 months; whereas, samples at other sites were collected during discrete storm events lasting perhaps only a few minutes. In addition, some sample compositing was done. For example, the sample collector was emptied perhaps weekly for a period of 2 or 3 months with the analysis being performed on the composite of weekly samples. Techniques of sample collection for specific sites are given in the data compilation beginning on page 29.
The historical data also reflect considerable variability in the techniques and procedures for sample preservation. Before 1970, chemical analysis for most parameters was performed on unfiltered, untreated water samples. Subsequent to that time water samples have been collected and preserved in a variety of ways. For the most part, techniques of sample collection and preservation are standarized as described in Brown and others (1970). Nutrient samples, however, have undergone a rather involved evolution of preservation techniques. Over the past two decades samples collected for nutrient analysis have varied in treatment including no preservation, chilled in ice, treated with chloroform, treated with chloroform and chilled, frozen, treated with sulfuric acid, treated with sulfuric acid and chilled, treated with mercuric chloride, and treated with mercuric chloride and chilled.
13
Analytical Methods
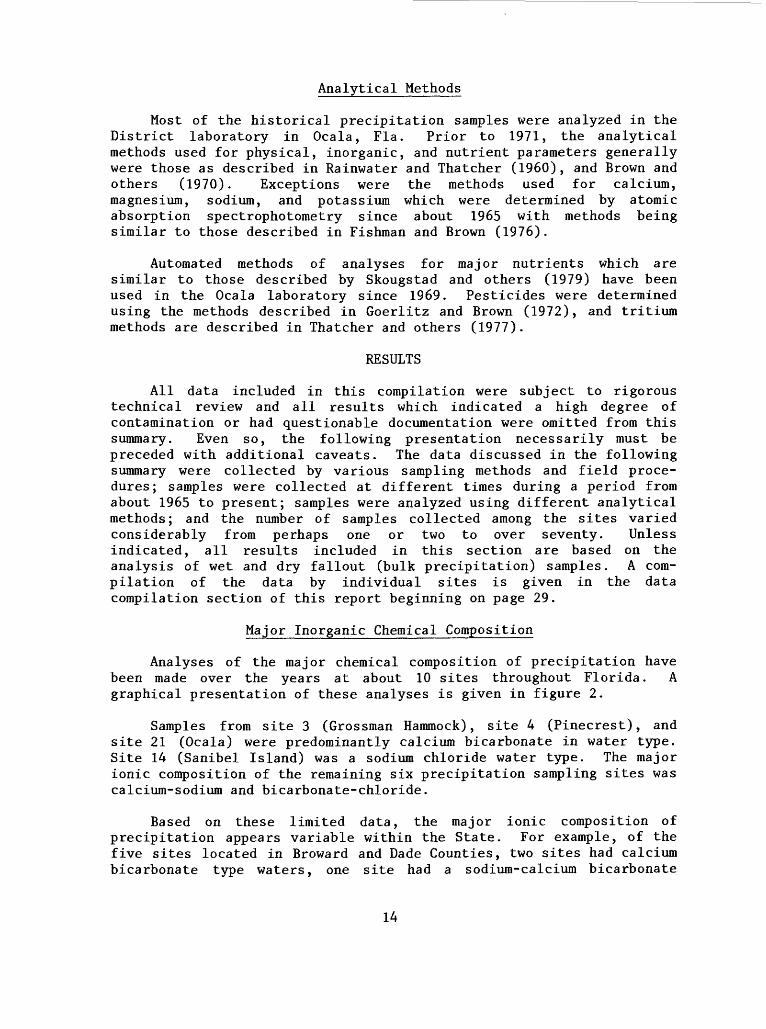
Most of the historical precipitation samples were analyzed in the District laboratory in Ocala, Fla. Prior to 1971, the analytical methods used for physical, inorganic, and nutrient parameters generally were those as described in Rainwater and Thatcher (1960), and Brown and others (1970). Exceptions were the methods used for calcium, magnesium, sodium, and potassium which were determined by atomic absorption spectrophotometry since about 1965 with methods being similar to those described in Fishman and Brown (1976).
Automated methods of analyses for major nutrients which are similar to those described by Skougstad and others (1979) have been used in the Ocala laboratory since 1969. Pesticides were determined using the methods described in Goerlitz and Brown (1972), and tritium methods are described in Thatcher and others (1977).
RESULTS
All data included in this compilation were subject to rigorous technical review and all results which indicated a high degree of contamination or had questionable documentation were omitted from this summary. Even so, the following presentation necessarily must be preceded with additional caveats. The data discussed in the following summary were collected by various sampling methods and field proce dures; samples were collected at different times during a period from about 1965 to present; samples were analyzed using different analytical methods; and the number of samples collected among the sites varied considerably from perhaps one or two to over seventy. Unless indicated, all results included in this section are based on the analysis of wet and dry fallout (bulk precipitation) samples. A com pilation of the data by individual sites is given in the data compilation section of this report beginning on page 29.
Major Inorganic Chemical Composition
Analyses of the major chemical composition of precipitation have been made over the years at about 10 sites throughout Florida. A graphical presentation of these analyses is given in figure 2.
Samples from site 3 (Grossman Hammock), site 4 (Pinecrest), and site 21 (Ocala) were predominantly calcium bicarbonate in water type. Site 14 (Sanibel Island) was a sodium chloride water type. The major ionic composition of the remaining six precipitation sampling sites was calcium-sodium and bicarbonate-chloride.
Based on these limited data, the major ionic composition of precipitation appears variable within the State. For example, of the five sites located in Broward and Dade Counties, two sites had calcium bicarbonate type waters, one site had a sodium-calcium bicarbonate
14

A L
,. . STATION LOCATION AND 14 NUMBER
Na + K
EXPLANATION
MILLIEQUIVALENTS PER LITER
_._. I _ __| V -^: " " ! HIGHLANDS S <<
Diagrams show general chemical character of bulk precipita tion. The ionic concentra tions are plotted for sodium and potassium (Na+K), calcium (Ca), magnesium (Mg), chloride (Cl), bicarbonate (HC03 ), and sulfate (804). Anions are plotted to the right of the centerline and cations to the left. The area of a diagram is an indication of the dis- solved-solids concentration larger areas reflect greater dissolved solids concentra tion.
0 20 40 60 MILES
N
A
Figure 2. Average chemical composition of precipitation samples at selected sites
15
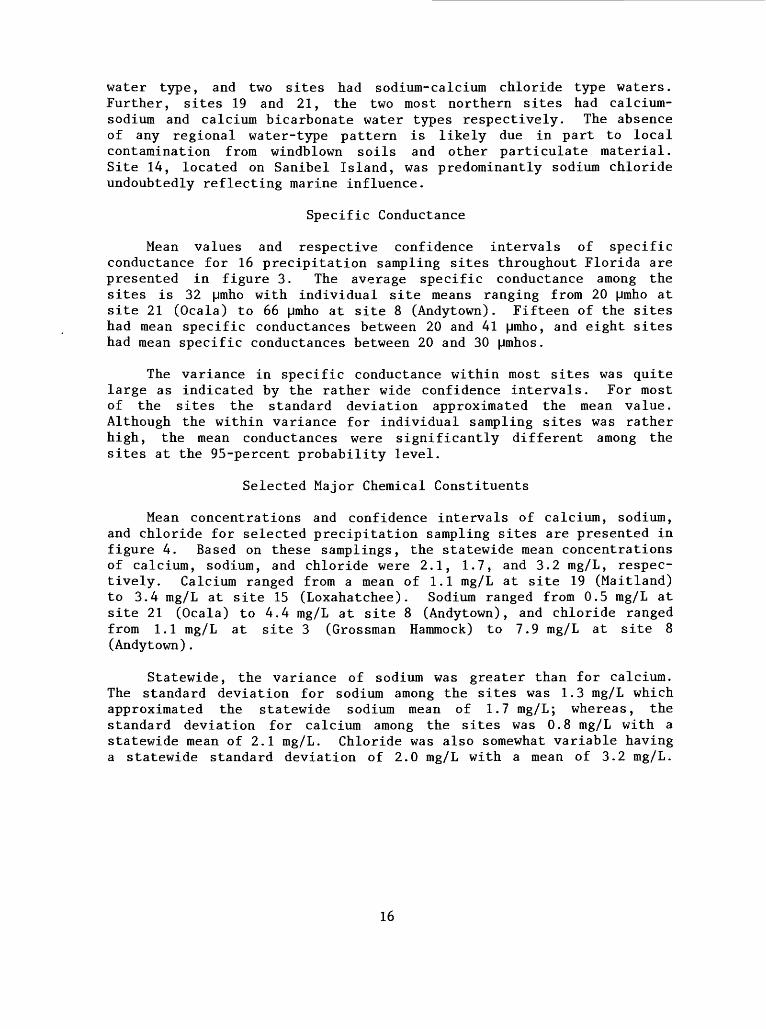
water type, and two sites had sodium-calcium chloride type waters. Further, sites 19 and 21, the two most northern sites had calcium- sodium and calcium bicarbonate water types respectively. The absence of any regional water-type pattern is likely due in part to local contamination from windblown soils and other particulate material. Site 14, located on Sanibel Island, was predominantly sodium chloride undoubtedly reflecting marine influence.
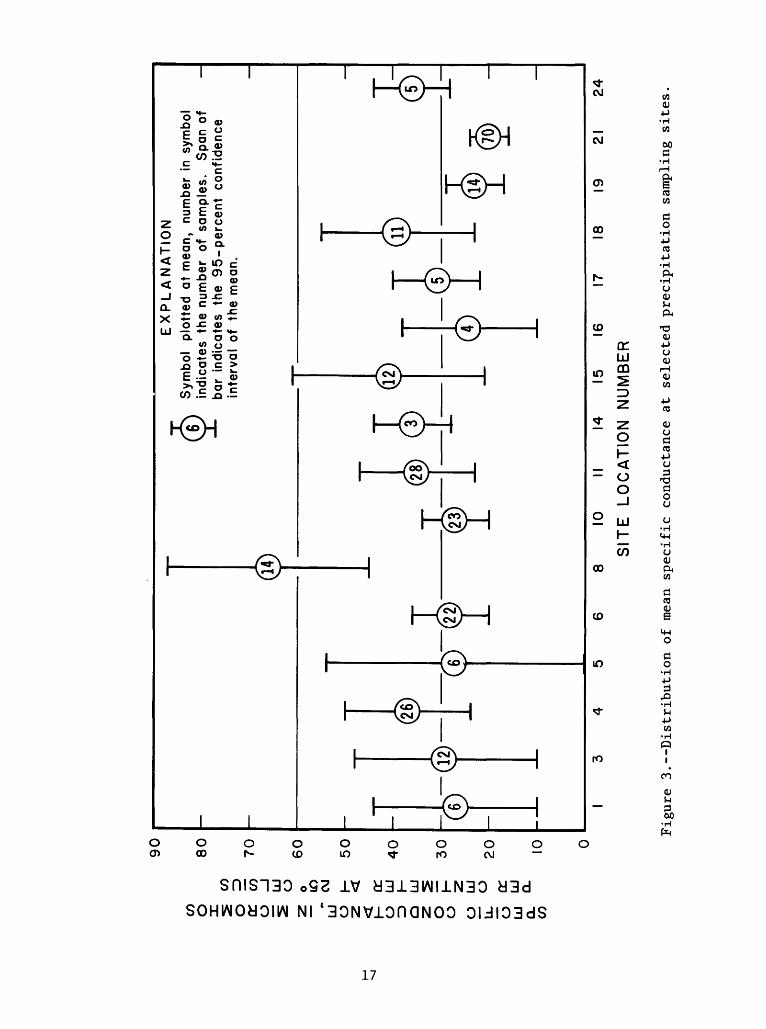
Specific Conductance
Mean values and respective confidence intervals of specific conductance for 16 precipitation sampling sites throughout Florida are presented in figure 3. The average specific conductance among the sites is 32 [Jmho with individual site means ranging from 20 [Jmho at site 21 (Ocala) to 66 [Jmho at site 8 (Andytown). Fifteen of the sites had mean specific conductances between 20 and 41 (Jmho, and eight sites had mean specific conductances between 20 and 30 [Jmhos.
The variance in specific conductance within most sites was quite large as indicated by the rather wide confidence intervals. For most of the sites the standard deviation approximated the mean value. Although the within variance for individual sampling sites was rather high, the mean conductances were significantly different among the sites at the 95-percent probability level.
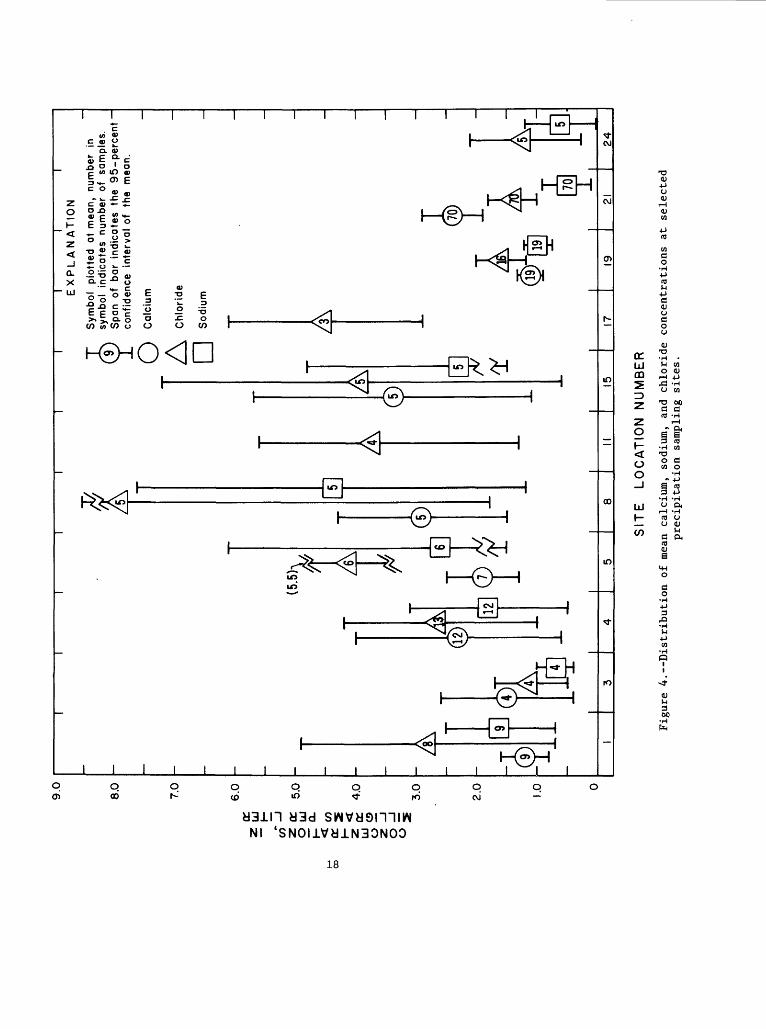
Selected Major Chemical Constituents
Mean concentrations and confidence intervals of calcium, sodium, and chloride for selected precipitation sampling sites are presented in figure 4. Based on these samplings, the statewide mean concentrations of calcium, sodium, and chloride were 2.1, 1.7, and 3.2 mg/L, respec tively. Calcium ranged from a mean of 1.1 mg/L at site 19 (Maitland) to 3.4 mg/L at site 15 (Loxahatchee). Sodium ranged from 0.5 mg/L at site 21 (Ocala) to 4.4 mg/L at site 8 (Andytown), and chloride ranged from 1.1 mg/L at site 3 (Grossman Hammock) to 7.9 mg/L at site 8 (Andytown).
Statewide, the variance of sodium was greater than for calcium. The standard deviation for sodium among the sites was 1.3 mg/L which approximated the statewide sodium mean of 1.7 mg/L; whereas, the standard deviation for calcium among the sites was 0.8 mg/L with a statewide mean of 2.1 mg/L. Chloride was also somewhat variable having a statewide standard deviation of 2.0 mg/L with a mean of 3.2 mg/L.
16
C/5
O X s
uo
5a:
c/)
o
_iE
u
^
oZ
o
if)
J "
O
h-
Z
<
< H
trO
LU
ID
HO
LU
O
UJ
o UJ a_
EX
PL
AN
AT
ION
Sym
bol
plot
ted
at m
ean,
nu
mbe
r in
sym
bol
indi
cate
s th
e nu
mbe
r of
sam
ples
. S
pan
of
bar
indi
cate
s th
e 95-p
erc
ent
conf
iden
ce
inte
rval
of
the
mea
n.
8 10
II
14
15
16
SIT
E
LO
CA
TIO
N
NU
MB
ER
24
Figure 3.
--Di
stri
buti
on of m
ean
spec
ific
co
nduc
tanc
e at
se
lect
ed pr
ecip
itat
ion
sampling si
tes.
81
CONCENTRATIONS, IN MILLIGRAMS PER LITER
Figure
r+ ifH- &er+H-opoHi3 n> w
w pnn> oO 0) H- h-1
*T3 O H- H-*+ EB) gr+ -H-o co P o
we Z!
SITE
oo
^J
P P OQ CL
w oH- ffr+ t fD OW hj H-
CLfD
elected
NUMBERCJ>
(O
PH
The pH of precipitation samples collected at 12 sites ranged from 4.7 to 8.8 or about 4 pH units. With few exceptions, the data reflect pH levels after a considerable period of sample exposure, and thus the pH values are only approximate. The bulk and wet precipitation samples collected at Ocala (site 21) were analyzed soon after rainfall events ranged between 5.0 and 7.0 and perhaps reflected timely local atmos pheric pH levels.
Selected Primary Nutrients
Nitrogen
The mean concentrations and data variability of total nitrogen at 16-precipitation sampling sites are portrayed in figure 5. Mean concentrations of total nitrogen ranged from a minimum of 0.50 mg/L at site 24 (Tallahassee) to a maximum of 2.4 mg/L at site 8 (Andytown). About half of the sites had mean concentrations of less than 1 mg/L. Statewide, the variance among the sites was not excessive in that the standard deviation was 0.52 mg/L with a 16-site mean of 1.1 mg/L. However, a statistical test of the means indicated that there was a significant difference among the sites at the 95-percent probability level.
Phosphorus
Total phosphorus ranged from 0.03 mg/L at sites 10, 20, and 24 to 0.30 mg/L at site 3 (fig. 6). Statewide, the mean phosphorus concen tration among the sites was 0.10 mg/L, and was somewhat variable with a standard deviation of 0.08 mg/L. Mean phosphorus concentrations among the sites were significantly different at the 95-percent probability level. In addition to the among site concentration differences, there were noticeable within site concentration differences as can be seen by the rather wide confidence intervals. For example, at sites 1 and 3 the standard deviations exceeded the sample mean concentrations.
Selected Trace Metals
A summary of selected trace metal data for 8 precipitation sites is given in table 2. Although the sample numbers and areal coverage are somewhat limited, the data do indicate that there are concentration differences within the State. Of the four metals given in table 2, iron and lead are the most variable, both within and among sites. Mean concentrations of iron ranged from 40 Mg/L at site 15 (Loxahatchee) to 340 pg/L at site 10 (Oakland Park). Lead means ranged from 7 Mg/L at site 4 (Pinecrest) to 440 MS/L at site 10 (Oakland Park). Concentra tions of both iron and lead indicated significant differences among sites at the 95-percent probability level. Within-site sample variance for iron was also quite evident as the standard deviations were of the
19

<r
LJ
UJ CD
<rO
Ld
t
w2
S
^
tt^
2
0
I I
I
810
I I
I I
I I
I E
XP
LA
NA
TIO
NS
ymbo
l pl
otte
d at
th
e m
ean,
num
ber
in
sym
bol
indi
cate
s th
e nu
mbe
r o
f sa
mpl
es.
Spa
n of
bar
indi
cate
s th
e 95-p
erc
ent
conf
iden
ce
inte
rva
l of
th
e m
ean.
1516
1718
1920
24
SIT
E
LO
CA
TIO
N
NU
MB
ER
Figure 5.
--Di
stri
buti
on of
me
an total
nitr
ogen
concentrations at
selected pr
ecip
itat
ion
sites.

NJ
u.o
a:
0.5
H ac LxJ °-
0.4
CO o: CD j
0.3
i z co
02
ID DC O I GL
CO O I
O.I
QL h- O H
0.0
1 l
EX
PL
AN
AT
O
N
(lO
) S
ymbol
plo
tte
d
at
the
mean;
num
ber
in
^m
- -
(j
^
(l
)A
s
-
""
jT
sym
bol
ind
ica
tes
the
num
ber
of
sam
ples
. _
Spa
n o
f b
ar
indic
ate
s
95
-perc
ent
conf
iden
ce
inte
rval
of
the
mean.
-
j)
" ®""
f
i >J
»v
f+^
(RI
/^\
(12)
f~
°\
(4)
>i^
~
~T
-
" "*
^r
l. ^^ )
^T
*'' 1 1
^ J
^* *^
*^
^ i
@
Z Y
(4
3)^
- 1
..^
(jj)
N^
(46VT
Q^
rv
vr
-^ rT)
J_
V-X
*-
-
- -
^^
V-X
-L.
VyX
3 1
4
5 6
8 10
II
15
16
17
18
19
20
22
24
SIT
E
LO
CA
TIO
N
NU
MB
ER
Figu
re 6.--Distribution of me
an total
phosphorus co
ncen
trat
ions
at
selected pr
ecip
itat
ion
sites

Table 2.--Summary of selected trace element data for selectedprecipitation sampling sites
[Total concentration in micrograms
Site location Site location number shown
in figure 1
40-Mile Bendnear Pinecrest
U.S. Highway 1near Kendall
Pump station-9near Andy town
U.S. Highway 1at Oakland Park
Sample Road atPompano Beach
Pump station-5near Loxahatchee
Lake Hopeat Maitland
U.S. Highway 27near Tallahassee
40-Mile Bendnear Pinecrest
U.S. Highway 1near Kendall
Pump station-9near Andy town
U.S. Highway 1at Oakland Park
Sample Road atPompano Beach
Pump station-5near Loxahatchee
Lake Hopeat Maitland
U.S. Highway 27near Tallahassee
4
6
8
10
11
15
19
24
4
6
8
10
11
15
19
24
Number of
samples
Copper
5
25
5
49
54
5
15
5
Zinc
6
25
5
50
54
5
14
5
Mean
2
5
6
10
4
4
9
4
75
30
90
180
80
130
50
10
per liter]
Standard deviation
2
3
4
18
4
4
7
2
68
20
50
170
50
70
40
10
95-percent confidence
limits
2
1
5
5
1
5
4
2
68
8
57
47
13
80
23
11
22

Table 2. Summary of selected trace element data for selectedprecipitation sampling sites Continued
[Total concentration in micrograms
Site location Site location number shown
in
40-Mile Bendnear Pinecrest
U.S. Highway 1 near Kendall
Pump station-9 near Andy town
U.S. Highway I at Oakland Park
Sample Road at Pompano Beach
Pump station-5 near Loxahatchee
Lake Hope at Maitland
U.S. Highway 27 near Tallahassee
40-Mile Bendnear Pinecrest
U.S. Highway 1 near Kendall
Pump station-9 near Andy town
U.S. Highway 1 at Oakland Park
Sample Road at Pompano Beach
Pump station-5 near Loxahatchee
Lake Hope at Maitland
U.S. Highway 27 near Tallahassee
figure 1
4
6
8
10
11
15
19
24
4
6
8
10
11
15
19
24
Number of
samples
Iron
5
25
5
48
53
5
16
Lead
6
25
5
50
54
5
15
5
Mean
50
171
150
340
90
40
50
7
25
24
440
100
15
19
46
per liter]
Standarddeviation
65
131
160
330
70
40
130
5
15
7
460
69
10
23
18
95-percent confidence
limits
75
54
180
93
19
46
64
5
6
8
130
18
12
13
21
23
same magnitude as the respective mean concentrations for most sites. Lead also was variable, but standard deviations approximated means at only about half the sites.
Total zinc ranged from a maximum mean of 180 JJg/L at site 10 (Oakland Park) to a minimum mean of 10 JJg/L at site 24 (Tallahassee). Mean concentrations of zinc among the sites were found to be signif icantly different at the 95-percent probability level. Within site concentration variance of zinc at individual sites was also high as most sites had standard deviations approximating respective mean concentrations. Concentrations of copper were generally lower than for iron, lead, and zinc, ranging from a mean of 2 jJg/L at site 4 (Pinecrest) to 10 |Jg/L at site 10 (Oakland Park). When tested, the copper concentrations among sites were found not to be significantly different at the 95-percent probability level. Copper was, however, quite variable within sites with the standard deviations approximating respective means at all sites.
DISCUSSION
The primary objective in collecting much of the past data was to estimate atmospheric input of selected chemical and physical parameters to a particular hydrologic system such as a lake or river basin. Most of the past samplings have perhaps been adequate for such purposes. Few of the sampling programs, however, were so designed as to delve greatly into the processes controlling the quality of precipitation.
The most apparent deficiency in much of the historical information pertains to data transferability. Specifically, does the sample represent the area in question or a very limited microcosm? For example, during this present endeavor some consideration was given to regionalizing statewide conditions for selected parameters using the existing data. However, this attempt was abandoned because the historical data herewith are very limited in sample size and were not collected randomly. Most sampling sites were located with the objective of measuring some local phenomena, and thus very likely do not portray regional conditions. For example, the lead concentrations at sites 10 (Oakland Park) and site 11 (Pompano Beach) and to a lesser degree those at site 24 (Tallahassee) were likely influenced greatly by very local activities. These three sites were in part established to estimate localized impacts resulting from the emission from motor vehicles. While the data indicate significant levels of lead, the data represent only an extremely localized condition.
A second area which complicates the regionalization of much of the historical data is that the samples included both the dry and wet fallout (bulk precipitation) and were collected under relatively uncontrolled conditions. As a result, samples at the time of retrieval commonly contained obvious quantities of debris of local origin such as soil particles and partly decomposed organic matter. For any given
24

sample, data very likely reflect several local conditions such as those discussed in an early section of this report. Further, the historical samples were collected over a considerable time interval and thus likely reflect to some degree such processes as leaching, particle formation, chemical repartitioning, and biochemical activity. Consideration of the above data generally precludes its use for estimating regional phenomena.
While the interpretational value of the historical data is somewhat limited, this situation is not particularly unique to Florida. As pointed out by the Federal Interagency Work Group on Precipitation Quality in 1978, the data base throughout the country is also quite restricted. Until such time when sampling and network design are more throughly researched and standardized, the utility of much of the atmospheric-quality data will be highly restricted. However, with sagacious application, the historical data can serve as estimates for baseline orders of magnitude.
SUMMARY
Based on data collected infrequently since about 1965, the major ionic composition of precipitation is predominantly calcium-sodium and bicarbonate-chloride. The statewide average specific conductance based on 16 sites is 32 pmho and ranged from 20 |Jmho at Ocala (site 21) to 66 |Jmho at Andytown (site 8). Fifteen of the sites had specific conductance between 20 and 41 |jmho. Specific conductance values among the sites were significantly different at the 95-percent probability level.
Mean concentrations of nitrogen and phosphorus statewide were 1.1 mg/L and 0.1 mg/L respectively. While both nitrogen and phosphorus exhibited some within site variance, they were found to be signif icantly different among the sites at the 95-percent probability level. Historical trace element data were quite limited, but those available suggested significant differences among sites in addition to a rather high variance within individual sites. Additionally, notable concen trations of lead and iron, attributable to motor vehicle activity, were detected in precipitation samples collected in south Florida.
This report and data supplement present the majority of data on the quality of precipitation which have been collected by the Geological Survey in Florida and should be useful as a starting point for future studies of the quality of precipitation. However, the data mainly reflect the composite quality of wet and dry fallout for selected sites and for selected periods and are generally not adequate to describe with high confidence past or present baseline conditions of the precipitation quality in Florida.
25
To reiterate, findings of the Federal Work Group on Precipitation Quality, other studies, and this brief compilation strongly suggest that standardization of analytical methods, sampling techniques, and network design are required to obtain meaningful regional monitoring of precipitation quality.
REFERENCES CITED
Beamish, R. J. , and Van Loon, J. C. , 1977, Precipitation loading of acid and heavy metals to a small acid lake near Sudbury (Ontario): Journal of the Fisheries Research Board of Canada, v. 34, no. 5, p. 649-658.
Brakke, D. F., 1977, Rainwater: Nutrient additions to a hypereutrophic lake: Hydrobiological, v. 52, no. 2-3, p. 159-163.
Brezonik, P. L. , Morgan, W. H. , Shannon, E. E., and Putnam, H. D. , 1969, Eutrophication factors in north central Florida lakes: Bulletin Series no. 134, Water Resources Research Center Publication no. 5, University of Florida, Gainesville, 101 p.
Brown, E., Skougstad, M. W., and Fishman, M. J., 1970, Methods for collection and analysis of water samples for dissolved minerals and gases; U.S. Geological Survey Techniques of Water Resources Investigations, Book 5, Chapter Al, 160 p.
Cambray, R. S., Jefferies, D. F., and Topping, G., 1975, An estimate of the input of atmospheric trace elements into the North Sea and the Clyde Sea (1972-73): Atomic Energy Research Establishment-1733, Harwell, England, 30 p.
Cryer, R., 1976, The significance and variation of atmospheric nutrient inputs in a small catchment system: Journal of Hydrology, v. 29, no. 1-2, p. 121-137.
Dillon, P. J., Jefferies, D. S., Snyder, W., Reid, R., and Yan, N. D., 1978, Journal of the Fisheries Research Board of Canada, v, 35, no. 6, p. 809-815.
Fishman, M. J., and Brown, Eugene, 1976, Selected methods of the U.S. Geological Survey for the analysis of waste water: U.S. Geolog ical Survey Open-File Report 76-177, 87 p.
Gaggiani, N. G. and Lamonds, A. G., 1978, Chemical and biological quality of Lakes Faith, Hope, and Charity at Maitland, Florida, with emphasis on the effects of storm runoff and bulk precipita tion, 1971-74. U.S. Geological Survey Open-File Report, 94 p.
Galloway, S. N. , and Likens, G. E. , 1977, Atmospheric enhancement of metal deposition in Adirondack lake sediments: Technical Report, Cornell University Center for Environmental Research, Ithaca, N.Y., 40 p.
Goerlitz, D. F., and Brown, Eugene, 1972, Methods for analysis of organic substances in water: U.S. Geological Survey Techniques of Water-Resources Investigations, Book 5, Chapter A3, 40 p.
Hardee, Jack, Miller, R. A., and Mattraw, H. C. Jr., 1978, Stormwater runoff data for a highway area, Broward County, Florida; U.S. Geological Survey Open-File Report 78-612, 166 p.
26
Hendrey, G. R., Baalsrud, K., Traaen, T. S., Laake, M., and Raddum, G., 1976, Acid precipitation: Some hydrobiological changes: AMBIO, v. 5, no. 5-6, p. 224-227.
Henriksen, A., and Wright, R. F., 1977, Effects of acid precipitation on a small acid lake in southern Norway: Nordic Hydrology, v. 8, no. 1, p. 1-10.
Irwin, G. A., and Losey, G. T., 1978, Water quality assessment of runoff from a rural highway bridge near Tallahassee, Florida: U.S. Geological Survey Water-Resources Investigations 79-1, 27 p.
Jordan, D. G. , and Fisher, D. W., 1977, Relation of bulk precipitation and evapotranspiration to water quality and water resources, St. Thomas, Virgin Islands: U.S. Geological Water-Supply Paper 1663-1, 130 p.
Joyner, B. F., 1974, Chemical and biological conditions of Lake Okee- chobee, Florida, 1969-72: State of Florida Department of Natural Resources Report of Investigations no. 71, 94 p.
Kuntz, K. W. , 1978, Atmospheric bulk precipitation in the Lake Erie Basin: Report Series no. 56, Canada Centre for Inland Waters, Burlington, Ontario, 7 p.
Lamonds, A. G., and Merritt, M. L., 1976, Proposed Cross-Florida Barge Canal: Water quality aspects with a section on waste-assimilative capacity: U.S. Geological Survey Water Resources Investigations 76-23, 189 p.
Lewis, W. M., and Grant, M. C., 1978, Sampling and chemical interpreta tion of precipitation for mass balance studies: Water Resources Research, v. 14, no. 6, p. 1089-1104.
Mattraw, H. C., Jr., 1978, Quality and quantity of stormwater runoff from from three land-use areas, Broward County, Florida, in Proceedings, International Symposium on Urban Stormwater Manage ment: Lexington, Ky., July 1978, p. 253-257.
Mattraw, H. C., Jr., Hardee, Jack, and Miller R. A., 1978, Urban storm- water runoff data for a residential area, Pompano Beach, Florida: U.S. Geological Survey Open-File Report 78-324, 108 p.
Miller, R. A., Mattraw, H. C., and Hardee, Jack, 1979, Stormwater runoff data for a commercial area, Broward County, Florida: U.S. Geological Survey Open-File Report 79-982, 127 p.
Rainwater, F. H., and Thatcher, L. L., 1960, Methods for collection and analysis of water samples: U.S. Geological Survey Water Supply Paper 1454, 301 p.
Skougstad, M. W. , Fishman, M. J., Friedman, L. C. , Erdmann, D. E. , and Duncan, S. S., eds., 1979, Methods for analysis of inorganic sub stances in water and fluvial sediments: U.S. Geological Survey Techniques of Water Resources Investigations, Book 5, Chapter Al, 625 p.
Summers, P. W., and Whelpdale, D. M., 1976, Acid precipitation in Canada: Water, air, and soil pollution, v. 6, no. 2-4, Sept.-Nov., p. 448-455.
27

Thatcher, L. L. , Janzer, V. J. , and Edwards, K. W. , 1977, Methods for determination of radioactive substances in water and fluvial sediments: U.S. Geological Survey Techniques of Water Resources Investigations, Book 5, Chapter A5, 95 p.
Thrush, B. A., 1978, Recent developments in atmospheric chemistry: Nature, v. 276, no. 5686 (Climatology Supplement), p. 345-348.
U.S. Department of the Interior, 1978, Research and monitoring of precipitation chemistry in the United States present status and future needs: Prepared by Interagency Work Group on Precipitation Quality. Impaneled by U.S. Department of the Interior, Geological Survey, Office of Water Data Coordination, 64 p.
Vermeulen, A. J., 1978, Acid precipitation in the Netherlands: Envi ronmental Science and Technology, v. 12, no. 9, p. 1016-1021.
Vollenweider, R. A., 1971, Scientific fundamentals of the eutrophi- cation of lakes and flowing waterways with particular reference to nitrogen and phosphorus as factors in eutrophication: Organiza tion for Economic Co-Operation and Development, Paris, 159 p.
Waller, B. G., 1975, Distribution of nitrogen and phosphorus in the conservation areas in south Florida from July 1972 to June 1973: U.S. Geological Survey Water Resources Investigations 5-75, 33 p.
Waller, B. G., and Earle, J. E., 1975, Chemical and biological quality of water in part of the Everglades, Southeastern Florida: U.S. Geological Survey Water-Resources Investigations 56-75, 157 p.
Wells, D. E., and Johnstone, S. J. , 1978, The occurrence of Organo- chlorine residues in rainwater: Water, Air, and Soil Pollution, v. 9, no. 3, p. 271-280.
Wright, R. F., Dale, T. , Gjessing, E. T., Hendrey, G. R. , and Henrik- sen, A., 1976, Impact of acid precipitation on freshwater ecosys tems in Norway: Water, Air, and Soil Pollution, v. 6, no. 2-4, Sept.-Nov., p. 483-499.
Yates, M. L. , Halswade, W., and Higer, A. L., 1970, Presentation at Symposium on environmental sampling, concentration, and sample preservation-159th national meeting, American Chemical Society, Houston, Texas.
28
DATA COMPILATION
29

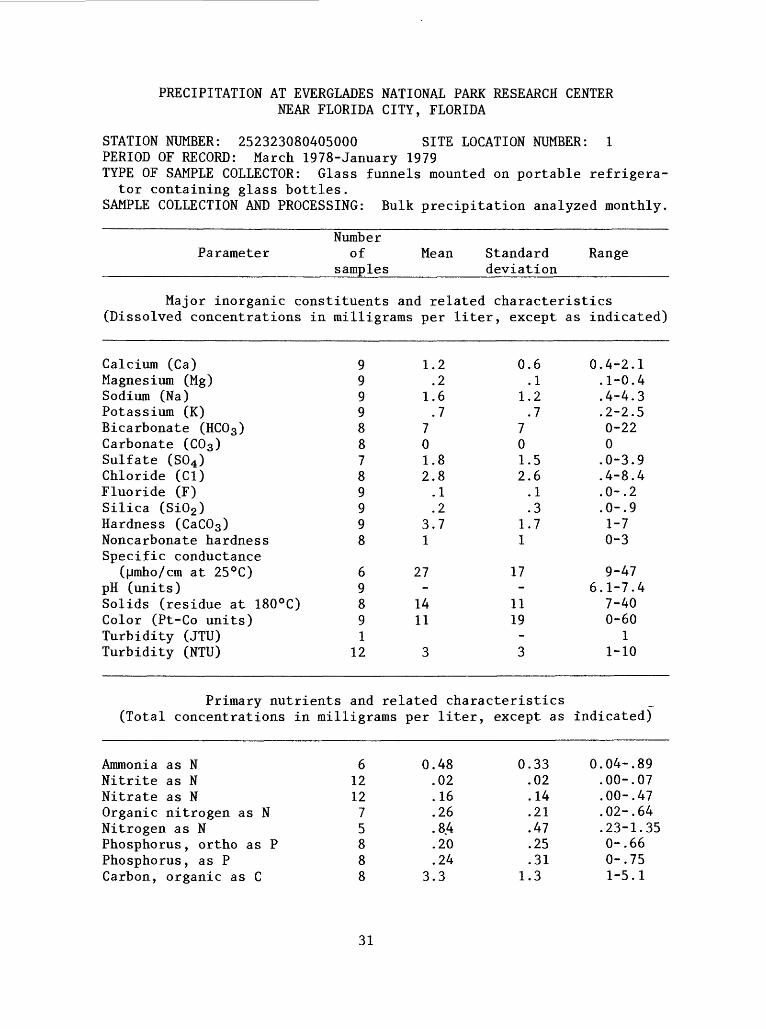
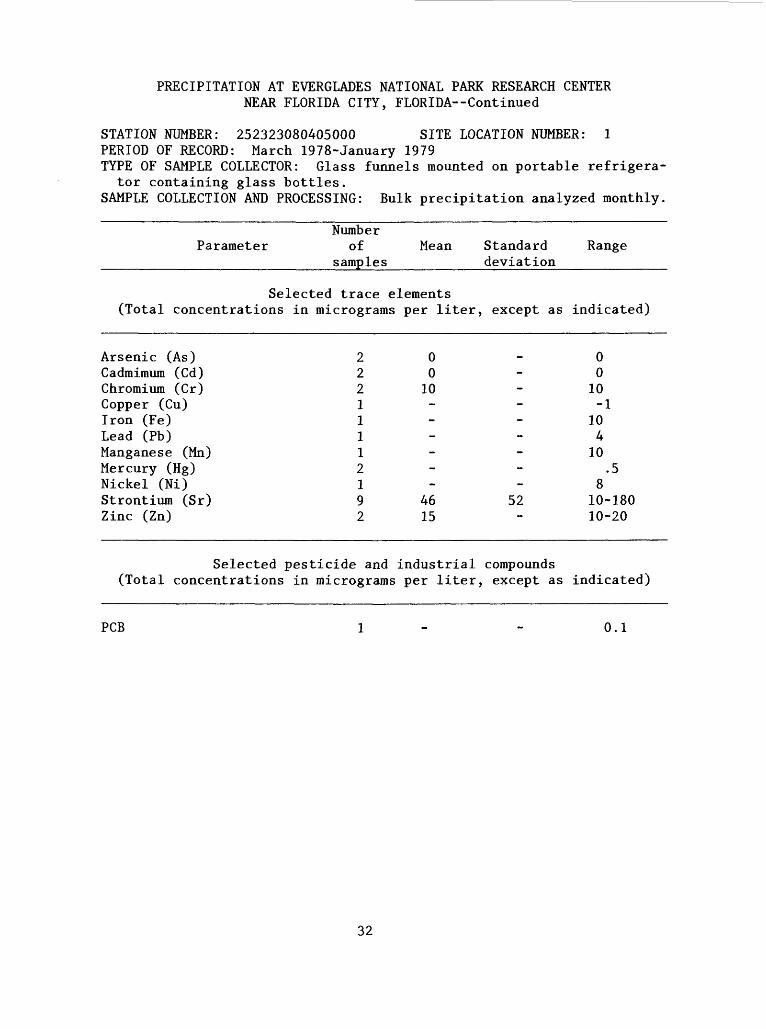
PRECIPITATION AT EVERGLADES NATIONAL PARK RESEARCH CENTER NEAR FLORIDA CITY, FLORIDA
STATION NUMBER: 252323080405000 SITE LOCATION NUMBER: 1 PERIOD OF RECORD: March 1978-January 1979TYPE OF SAMPLE COLLECTOR: Glass funnels mounted on portable refrigera
tor containing glass bottles. SAMPLE COLLECTION AND PROCESSING: Bulk precipitation analyzed monthly.
ParameterNumber
of samples
Mean Standard deviation
Range
Major inorganic constituents and related characteristics (Dissolved concentrations in milligrams per liter, except as indicated)
Calcium (Ca)Magnesium (Mg)Sodium (Na)Potassium (K)Bicarbonate (HC03 )Carbonate (C03 )Sulfate (S04 )Chloride (Cl)Fluoride (F)Silica (Si02 )Hardness (CaC03 )Noncarbonate hardnessSpecific conductance
(|jmho/cm at 25°C)pH (units)Solids (residue at 180°C)Color (Pt-Co units)Turbidity (JTU)Turbidity (NTU)
999988789998
69891
12
1.2.2
1.6.7
701.82.8.1.2
3.71
27-
1411
3
0.6.1
1.2.7
701.52.6.1.3
1.71
17-
1119-3
0.4-2.1.1-0.4.4-4.3.2-2.50-220.0-3.9.4-8.4.0-.2.0-.91-70-3
9-476.1-7.4
7-400-60
11-10
Primary nutrients and related characteristics (Total concentrations in milligrams per liter, except as indicated)
Ammonia as NNitrite as NNitrate as NOrganic nitrogen as NNitrogen as NPhosphorus , ortho as PPhosphorus, as PCarbon, organic as C
6121275888
0.48.02.16.26.84.20.24
3.3
0.33.02.14.21.47.25.31
1.3
0.04-.89.00-. 07.00-. 47.02-. 64.23-1.350-.660-.751-5.1
31
PRECIPITATION AT EVERGLADES NATIONAL PARK RESEARCH CENTER NEAR FLORIDA CITY, FLORIDA Continued
STATION NUMBER: 252323080405000 SITE LOCATION NUMBER: 1 PERIOD OF RECORD: March 1978-January 1979TYPE OF SAMPLE COLLECTOR: Glass funnels mounted on portable refrigera
tor containing glass bottles. SAMPLE COLLECTION AND PROCESSING: Bulk precipitation analyzed monthly,
NumberParameter of Mean Standard Range
_______________________samples_________deviation___________
Selected trace elements (Total concentrations in micrograms per liter, except as indicated)
Arsenic (As)Cadmimum (Cd)Chromium (Cr)Copper (Cu)Iron (Fe)Lead (Pb)Manganese (Mn)Mercury (Hg)Nickel (Ni)Strontium (Sr)Zinc (Zn)
22211112192
00
10------
4615
00
10-1
104
10.5
852 10-180
10-20
Selected pesticide and industrial compounds (Total concentrations in micrograms per liter, except as indicated)
PCB 1 - - 0.1
32
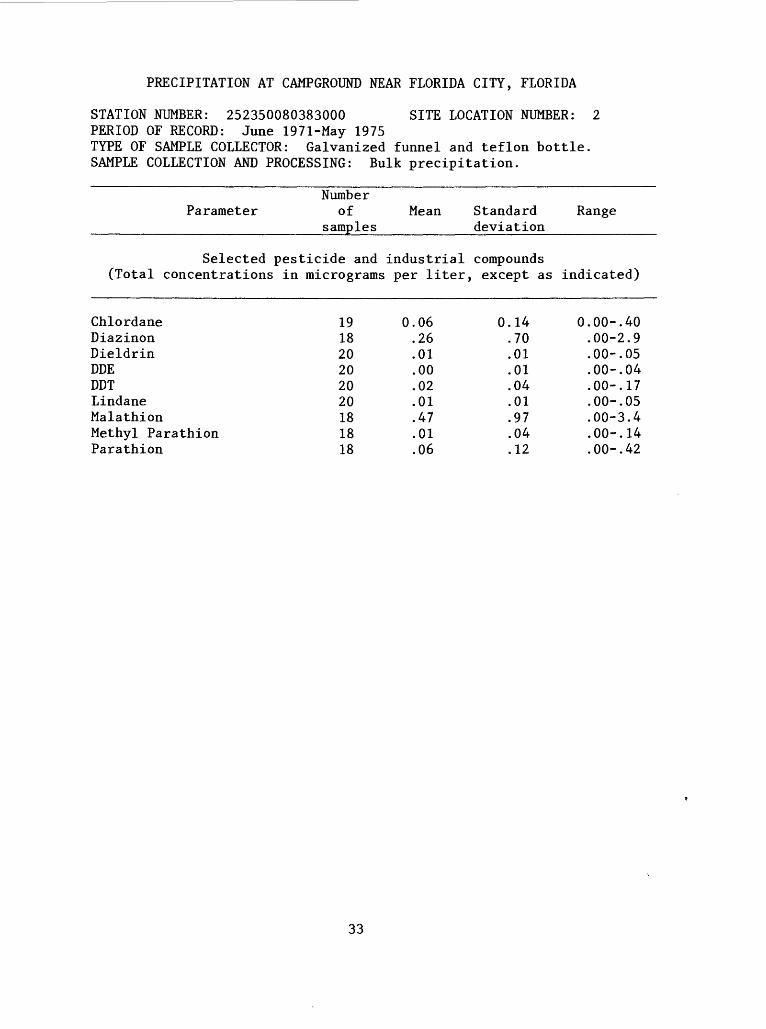
PRECIPITATION AT CAMPGROUND NEAR FLORIDA CITY, FLORIDA
STATION NUMBER: 252350080383000 SITE LOCATION NUMBER: 2 PERIOD OF RECORD: June 1971-May 1975TYPE OF SAMPLE COLLECTOR: Galvanized funnel and teflon bottle. SAMPLE COLLECTION AND PROCESSING: Bulk precipitation.
ParameterNumber
of samples
Mean Standard deviation
Range
Selected pesticide and industrial compounds (Total concentrations in micrograms per liter, except as indicated)
ChlordaneDiazinonDieldrinDDEDOTLindaneMalathionMethyl Parathion Parathion
1918202020201818 18
0.06.26.01.00.02.01.47.01 .06
0.14.70.01.01.04.01.97.04 .12
0.00-.40.00-2.9.00-. 05.00-. 04.00-. 17.00-. 05.00-3.4.00-. 14 .00-. 42
33

PRECIPITATION AT GROSSMAN HAMMOCK NEAR GOULDS, FLORIDA
STATION NUMBER: 253656080350302 SITE LOCATION NUMBER: 3 PERIOD OF RECORD: April 1978-March 1979TYPE OF SAMPLE COLLECTOR: Glass funnels mounted on portable refrigera
tor containing glass bottles. SAMPLE COLLECTION AND PROCESSING: Bulk precipitation analyzed monthly.
ParameterNumber
of samples
Mean Standard deviation
Range
Major inorganic constituents and related characteristics (Dissolved concentrations in milligrams per liter, except as indicated)
Calcium (Ca)Magnesium (Mg)Sodium (Na)Potassium (K)Bicarbonate (HC03 )Carbonate (C03 )Sulfate (S04 )Chloride (Cl)Fluoride (F)Silica (Si02 )Hardness (CaC03 )Noncarbonate hardnessSpecific conductance
(jjmho/cm at 25°C)pH (units)Solids (residue at 180°C)Color (Pt-Co units)Turbidity (NTU)
444533544443
121144
10
1.5.1.7.6
5.70.6
1.1.1.3
4.21
29-
953
0.8.1.2.4
3.80.6.4.1.5
1.91
30-562
0.9-2.6.1-0.2.5-0.9.2-1.2
3.0-100.0-1.4.6-1.4.O-.l.0-1.03-70-2
9-985.2-6.7
5-140-101-8
Primary nutrients and related characteristics (Total concentrations in milligrams per liter, except as indicated)
Ammonia as NNitrite as NNitrate as NOrganic nitrogen as NNitrogen as NPhosphorus, ortho as PPhosphorus , as PCarbon, organic as C
79
107510108
0.38.02.26.60.78.26.30
5.0
0.34.02.12.46.48.27.30
3.2
0.07-.970-.05.10-. 46.16-1.3.34-1.52.01-. 69.02-. 760-8.3
34
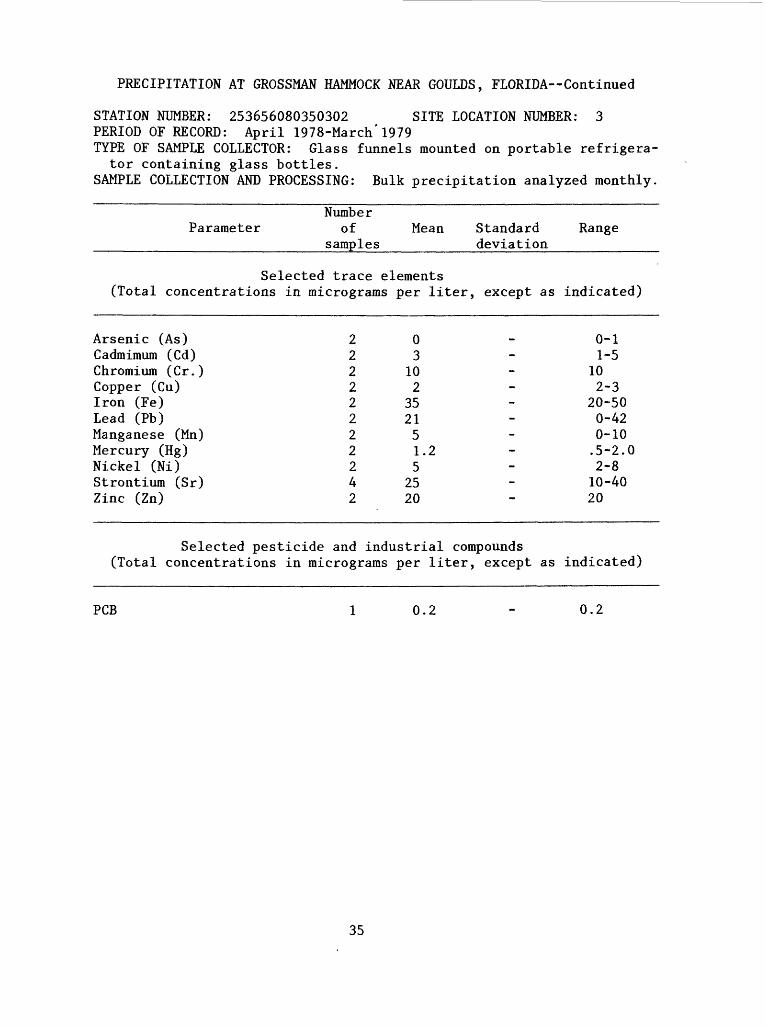
PRECIPITATION AT GROSSMAN HAMMOCK NEAR GOULDS, FLORIDA--Continued
STATION NUMBER: 253656080350302 SITE LOCATION NUMBER: 3 PERIOD OF RECORD: April 1978-March'1979TYPE OF SAMPLE COLLECTOR: Glass funnels mounted on portable refrigera
tor containing glass bottles. SAMPLE COLLECTION AND PROCESSING: Bulk precipitation analyzed monthly,
ParameterNumber
of samples
Mean Standard deviation
Range
Selected trace elements (Total concentrations in micrograms per liter, except as indicated)
Arsenic (As)Cadmimum (Cd)Chromium (Cr.)Copper (Cu)Iron (Fe)Lead (Pb)Manganese (Mn)Mercury (Hg)Nickel (Ni)Strontium (Sr)Zinc (Zn)
22222222242
03
102
352151.25
2520
0-11-5
102-3
20-500-420-10.5-2.02-810-4020
Selected pesticide and industrial compounds (Total concentrations in micrograms per liter, except as indicated)
PCB 1 0.2 - 0.2
35

PRECIPITATION AT 40-MILE BEND NEAR PINECREST, FLORIDA
STATION NUMBER: 254542080493001 SITE LOCATION NUMBER: 4 PERIOD OF RECORD: July 1973-March 1979TYPE OF SAMPLE COLLECTOR: Glass funnels mounted on portable refrigera
tor containing glass and plastic bottles. SAMPLE COLLECTION AND PROCESSING: Bulk precipitation refrigerated.
ParameterNumber
of samples
Mean Standard deviation
Range
Major inorganic constituents and related characteristics (Dissolved concentrations in milligrams per liter, except as indicated)
Calcium (Ca)Magnesium (Mg)Sodium (Na)Potassium (K)Bicarbonate (HC03 )Carbonate (C03 )Sulfate (S04 )Chloride (Cl)Fluoride (F)Silica (Si02 )Hardness (CaC03 )Noncarbonate hardnessSpecific conductance
(|Jmho/cm at 25°C)pH (units)Solids (residue at 180°C)Color (Pt-Co units)Turbidity (JTU)Turbidity (NTU)
121212121210101312111211
261510141412
2.3.4
1.8.2
801.82.6.1.8
82
37-
20441
2.7.6
2.1.2
1001.22.6.1.9
95
31-
18311
0.5-9.3.0-2.0.2-6.7.1-.70-380.0-3.1.2-8.4.O-.l0-2.31-300-17
5-1045.5-8.7
4-530-102-60-3
Primary nutrients and related characteristics (Total concentrations in milligrams per liter, except as indicated)
Ammonia as NNitrite as NNitrate as NOrganic nitrogen as NNitrogen as NPhosphorus, ortho as PPhosphorus, as PCarbon, organic as C
2527262521272725
0.34.02.34.62
1.1.05.07
2.4
0.27.02.24.52.68.04.06
2.1
0-.92O.OO-.ll.10-1.0.03-1.7.22-2.64.00-. 16.01-. 190-8
36

PRECIPITATION AT 40-MILE BEND NEAR PINECREST, FLORIDA Continued
STATION NUMBER: 254542080493001 SITE LOCATION NUMBER: 4 PERIOD OF RECORD: July 1973-March 1979TYPE OF SAMPLE COLLECTOR: Glass funnels mounted on portable refrigera
tor containing glass and plastic bottles. SAMPLE COLLECTION AND PROCESSING: Bulk precipitation refrigerated.
NumberParameter of Mean Standard Range
_______________________samples_________deviation_____________
Selected trace elements (Total concentrations in micrograms per liter, except as indicated)
Arsenic (As)Cadmimum (Cd)Chromium (Cr)Cobalt (Co)Copper (Cu)Iron (Fe)Lead (Pb)Manganese (Mn)Mercury (Hg)Nickel (Ni)Strontium (Sr)Zinc (Zn)
6664556565126
2271022
5074.2
164975
3241012
6555.2
185968
0-70-620-100-30-60-1500-150-100-.50-360-18010-180
Selected pesticide and industrial compounds (Total concentrations in micrograms per liter, except as indicated)
Malathion 5 0.01 0.02 0.00-.04 Diazinon 5 .00 .00 .00-.01
37
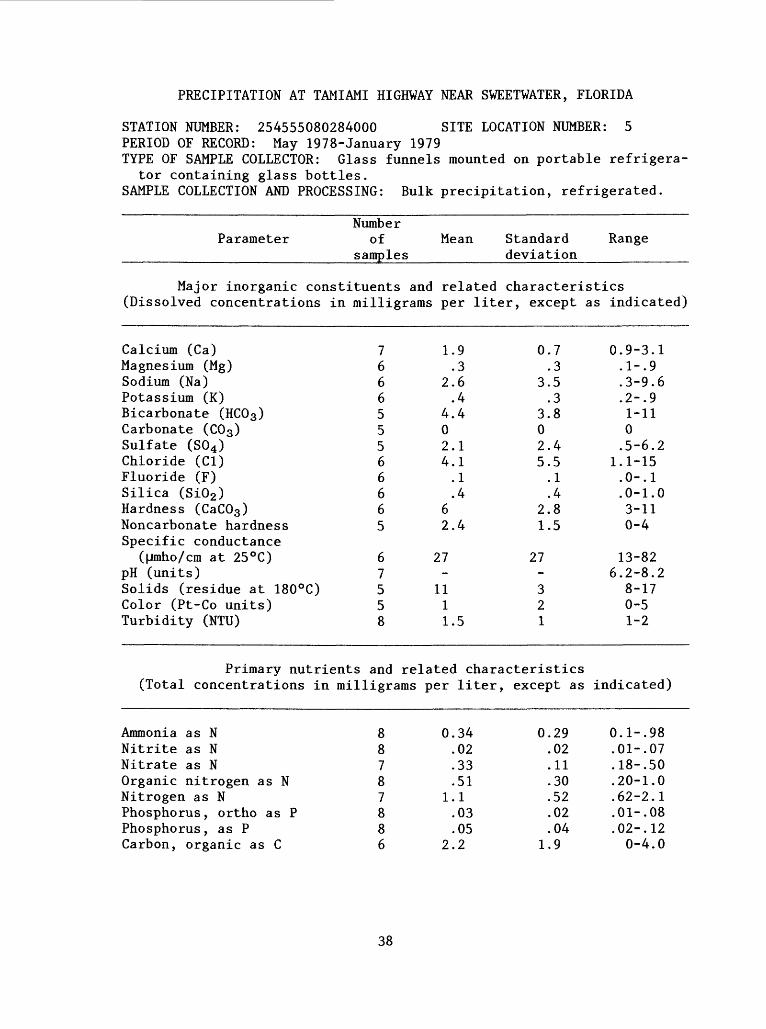
PRECIPITATION AT TAMIAMI HIGHWAY NEAR SWEETWATER, FLORIDA
STATION NUMBER: 254555080284000 SITE LOCATION NUMBER: 5 PERIOD OF RECORD: May 1978-January 1979TYPE OF SAMPLE COLLECTOR: Glass funnels mounted on portable refrigera
tor containing glass bottles. SAMPLE COLLECTION AND PROCESSING: Bulk precipitation, refrigerated.
ParameterNumber
of samples
Mean Standard deviation
Range
Major inorganic constituents and related characteristics (Dissolved concentrations in milligrams per liter, except as indicated)
Calcium (Ca)Magnesium (Mg)Sodium (Na)Potassium (K)Bicarbonate (HC03 )Carbonate (C03 )Sulfate (S04 )Chloride (Cl)Fluoride (F)Silica (Si02 )Hardness (CaC03 )Noncarbonate hardnessSpecific conductance
(|jmho/cm at 25°C)pH (units)Solids (residue at 180°C)Color (Pt-Co units)Turbidity (NTU)
766655566665
67558
1.9.3
2.6.4
4.402.14.1.1.4
62.4
27-
1111.5
0.7.3
3.5.3
3.802.45.5.1.4
2.81.5
27-
321
0.9-3.1.1-.9.3-9.6.2-. 91-110.5-6.2
1.1-15.O-.l.0-1.03-110-4
13-826.2-8.2
8-170-51-2
Primary nutrients and related characteristics (Total concentrations in milligrams per liter, except as indicated)
Ammonia as NNitrite as NNitrate as NOrganic nitrogen as NNitrogen as NPhosphorus, ortho as PPhosphorus , as PCarbon, organic as C
88787886
0.34.02.33.51
1.1.03.05
2.2
0.29.02.11.30.52.02.04
1.9
0.1-.98.01-. 07.18-. 50.20-1.0.62-2.1.01-. 08.02-. 120-4.0
38

PRECIPITATION AT TAMIAMI HIGHWAY NEAR SWEETWATER, FLORIDA Continued
STATION NUMBER: 254555080284000 SITE LOCATION NUMBER: 5 PERIOD OF RECORD: May 1978-January 1979TYPE OF SAMPLE COLLECTOR: Glass funnels mounted on portable refrigera
tor containing glass bottles. SAMPLE COLLECTION AND PROCESSING: Bulk precipitation, refrigerated.
NumberParameter of Mean Standard Range
_______________________samples_________deviation____________
Selected trace elements (Total concentrations in micrograms per liter, except as indicated)
Arsenic (As)Cadmimum (Cd)Chromium (Cf)Copper (Cu)Iron (Fe)Lead (Pb)Manganese (Mn)Mercury (Hg)Nickel (Ni)Strontium (Sr)Zinc (Zn)
22211212162
01
10--
24-.5
-32 1710
00-1
102
106-430.5
610-5010
Selected pesticide and industrial compounds (Total concentrations in micrograms per liter, except as indicated)
Not detected
39

PRECIPITATION AT U.S. HIGHWAY 1 AT KENDALL, FLORIDA
STATION NUMBER: 254031080191101 SITE LOCATION NUMBER: 6PERIOD OF RECORD: June 1977-May 1978TYPE OF SAMPLE COLLECTOR: Two plastic funnels connected to plastic
sample bottles in large refrigerator.SAMPLE COLLECTION AND PROCESSING: Automated sampling of bulk precipi
tation samples collected after each storm.
ParameterNumber
of samples
Mean Standard deviation
Range
Major inorganic constituents and related characteristics (Dissolved concentrations in milligrams per liter, except as indicated)
Potassium (K)Specific conductance
(jjmho/cm at 25°C)Color (Pt-Co units)Turbidity (JTU)Turbidity (NTU)
20
2221167
0.4
28645
0.1
19522
0.2-0.7
6-620-202-73-8
Primary nutrients and related characteristics (Total concentrations in milligrams per liter, except as indicated)
Ammonia as NNitrite as NNitrate as NOrganic nitrogen as NNitrogen as NPhosphorus, ortho as PPhosphorus , as PCarbon, organic as CChemical oxygen demand (COD)
(high level)
2223232122222221
22
0.33.01.20.4.88.04.09
4.4
16
0.25.01.15.37.65.05.08
3.9
16
0.02-.98.00-. 02.02-. 47.00-1.2.04-2.00-.21
.01-. 310-12
0-58
40
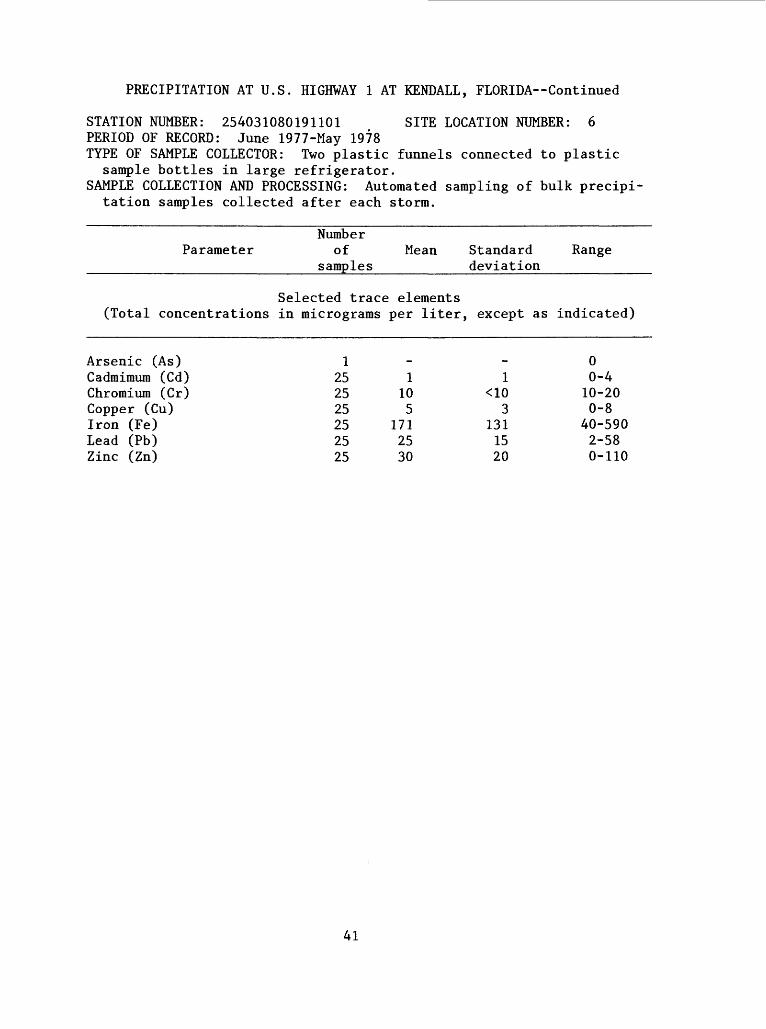
PRECIPITATION AT U.S. HIGHWAY 1 AT KENDALL, FLORIDA Continued
STATION NUMBER: 254031080191101 SITE LOCATION NUMBER: 6PERIOD OF RECORD: June 1977-May 1978TYPE OF SAMPLE COLLECTOR: Two plastic funnels connected to plastic
sample bottles in large refrigerator.SAMPLE COLLECTION AND PROCESSING: Automated sampling of bulk precipi
tation samples collected after each storm.
ParameterNumber
of samples
Mean Standard deviation
Range
Selected trace elements (Total concentrations in micrograms per liter, except as indicated)
Arsenic (As) 1 - - 0Cadmimum (Cd) 25 1 1 0-4Chromium (Cr) 25 10 <10 10-20Copper (Cu) 25 5 3 0-8Iron (Fe) 25 171 131 40-590Lead (Pb) 25 25 15 2-58Zinc (Zn) 25 30 20 0-110
41
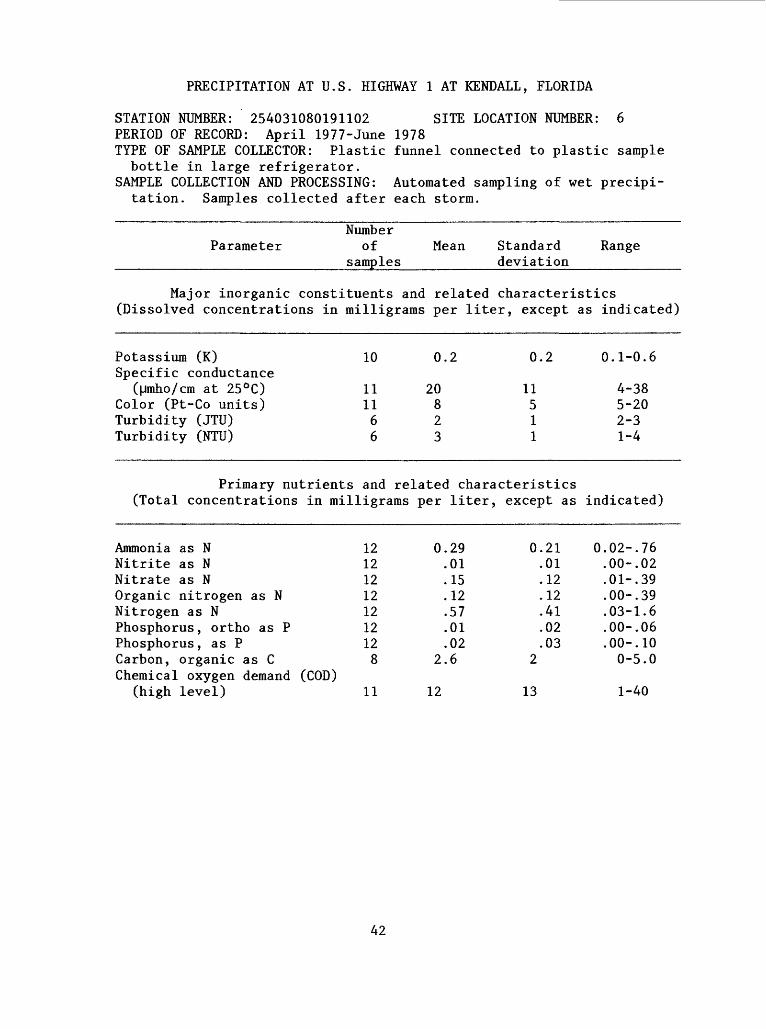
PRECIPITATION AT U.S. HIGHWAY 1 AT KENDALL, FLORIDA
STATION NUMBER: 254031080191102 SITE LOCATION NUMBER: 6PERIOD OF RECORD: April 1977-June 1978TYPE OF SAMPLE COLLECTOR: Plastic funnel connected to plastic sample
bottle in large refrigerator.SAMPLE COLLECTION AND PROCESSING: Automated sampling of wet precipi
tation. Samples collected after each storm.
NumberParameter of Mean Standard Range
______________________samples_________deviation______________
Major inorganic constituents and related characteristics (Dissolved concentrations in milligrams per liter, except as indicated)
Potassium (K)Specific conductance
((jmho/cm at 25°C)Color (Pt-Co units)Turbidity (JTU)Turbidity (NTU)
10
111166
0.2
20823
0.2
11511
0.1-0.6
4-385-202-31-4
Primary nutrients and related characteristics (Total concentrations in milligrams per liter, except as indicated)
Ammonia as NNitrite as NNitrate as NOrganic nitrogen as NNitrogen as NPhosphorus , ortho as PPhosphorus , as PCarbon, organic as CChemical oxygen demand (COD)
(high level)
121212121212128
11
0.29.01.15.12.57.01.02
2.6
12
0.21.01.12.12.41.02.03
2
13
0.02-.76.00-. 02.01-. 39.00-. 39.03-1.6.00-. 06.00-. 100-5.0
1-40
42
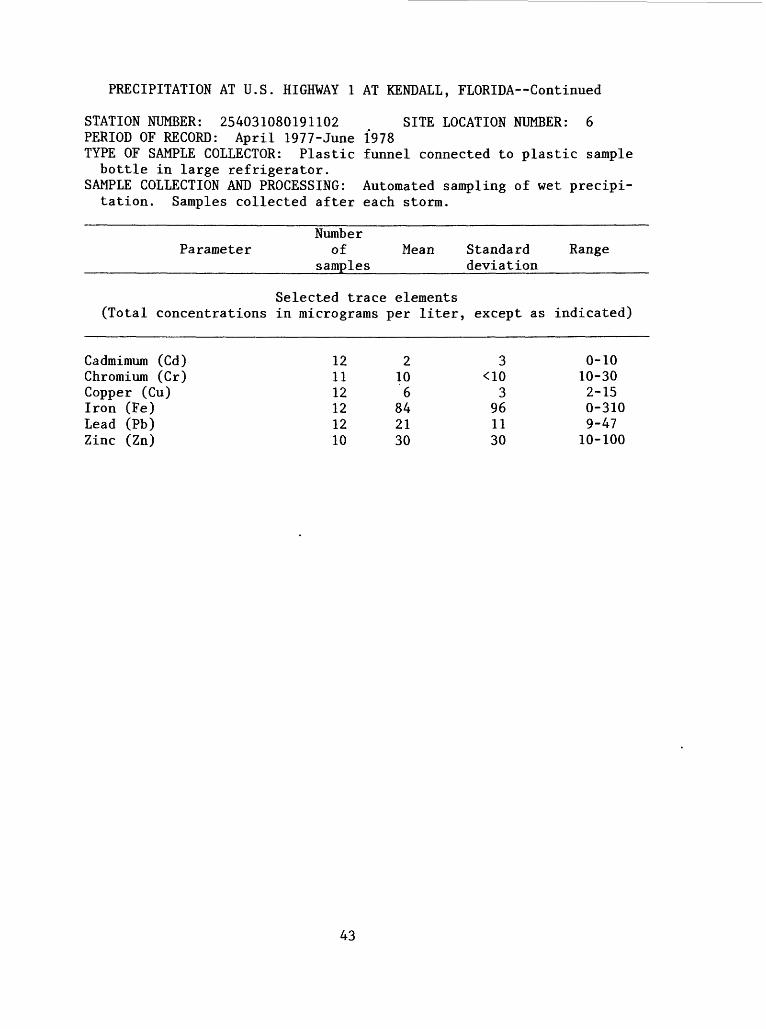
PRECIPITATION AT U.S. HIGHWAY 1 AT KENDALL, FLORIDA Continued
STATION NUMBER: 254031080191102 SITE LOCATION NUMBER: 6PERIOD OF RECORD: April 1977-June 1978TYPE OF SAMPLE COLLECTOR: Plastic funnel connected to plastic sample bottle in large refrigerator.
SAMPLE COLLECTION AND PROCESSING: Automated sampling of wet precipi tation. Samples collected after each storm.
ParameterNumber
of samples
Mean Standard deviation
Range
Selected trace elements (Total concentrations in micrograms per liter, except as indicated)
Cadmimum (Cd)Chromium (Cr)Copper (Cu)Iron (Fe)Lead (Pb)Zinc (Zn)
121112121210
2106
842130
3<10
3961130
0-1010-302-150-3109-4710-100
43
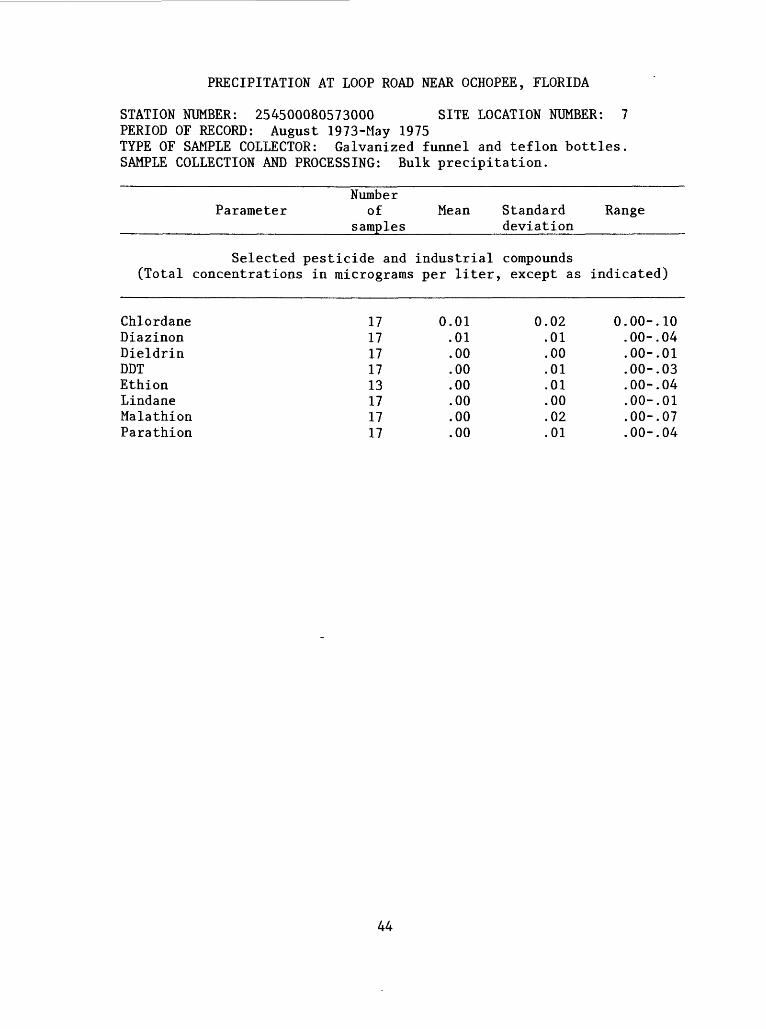
PRECIPITATION AT LOOP ROAD NEAR OCHOPEE, FLORIDA
STATION NUMBER: 254500080573000 SITE LOCATION NUMBER: 7 PERIOD OF RECORD: August 1973-May 1975TYPE OF SAMPLE COLLECTOR: Galvanized funnel and teflon bottles. SAMPLE COLLECTION AND PROCESSING: Bulk precipitation.
ParameterNumber
of samples
Mean Standard deviation
Range
Selected pesticide and industrial compounds (Total concentrations in micrograms per liter, except as indicated)
ChlordaneDiazinonDieldrinDOTEthionLindaneMalathionParathion
1717171713171717
0.01.01.00.00.00.00.00.00
0.02.01.00.01.01.00.02.01
0.00-.10.00-. 04.00-. 01.00-. 03.00-. 04.00-. 01.00-. 07.00-. 04
44
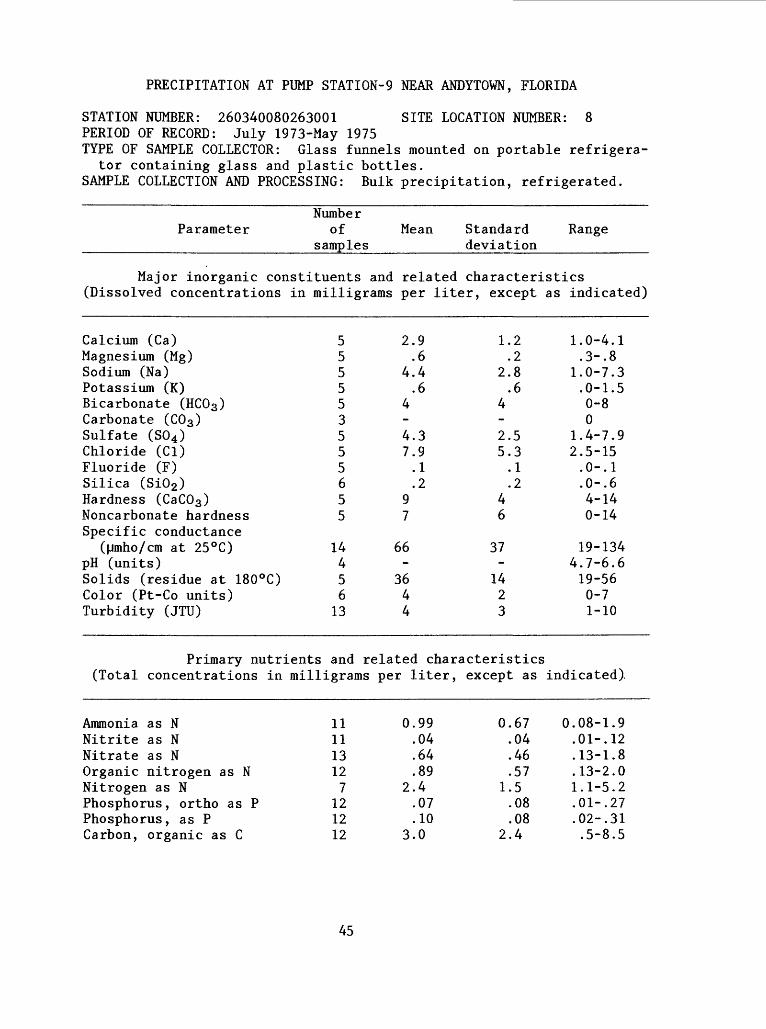
PRECIPITATION AT PUMP STATION-9 NEAR ANDYTOWN, FLORIDA
STATION NUMBER: 260340080263001 SITE LOCATION NUMBER: 8 PERIOD OF RECORD: July 1973-May 1975TYPE OF SAMPLE COLLECTOR: Glass funnels mounted on portable refrigera
tor containing glass and plastic bottles. SAMPLE COLLECTION AND PROCESSING: Bulk precipitation, refrigerated.
ParameterNumber
of samples
Mean Standard deviation
Range
Major inorganic constituents and related characteristics (Dissolved concentrations in milligrams per liter, except as indicated)
Calcium (Ca)Magnesium (Mg)Sodium (Na)Potassium (K)Bicarbonate (HC03 )Carbonate (C03 )Sulfate (S04 )Chloride (Cl)Fluoride (F)Silica (Si02 )Hardness (CaC03 )Noncarbonate hardnessSpecific conductance
(|Jmho/cm at 25 °C)pH (units)Solids (residue at 180°C)Color (Pt-Co units)Turbidity (JTU)
555553555655
14456
13
2.9.6
4.4.6
4-4.37.9.1.2
97
66-
3644
1.2.2
2.8.6
4-2.55.3.1.2
46
37-
1423
1.0-4.1.3-. 8
1.0-7.3.0-1.50-80
1.4-7.92.5-15.O-.l.0-.64-140-14
19-1344.7-6.619-560-71-10
Primary nutrients and related characteristics (Total concentrations in milligrams per liter, except as indicated),
Ammonia as NNitrite as NNitrate as NOrganic nitrogen as NNitrogen as NPhosphorus, ortho as PPhosphorus, as PCarbon, organic as C
111113127
121212
0.99.04.64.89
2.4.07.10
3.0
0.67.04.46.57
1.5.08.08
2.4
0.08-1.9.01-. 12.13-1.8.13-2.01.1-5.2.01-. 27.02-. 31.5-8.5
45
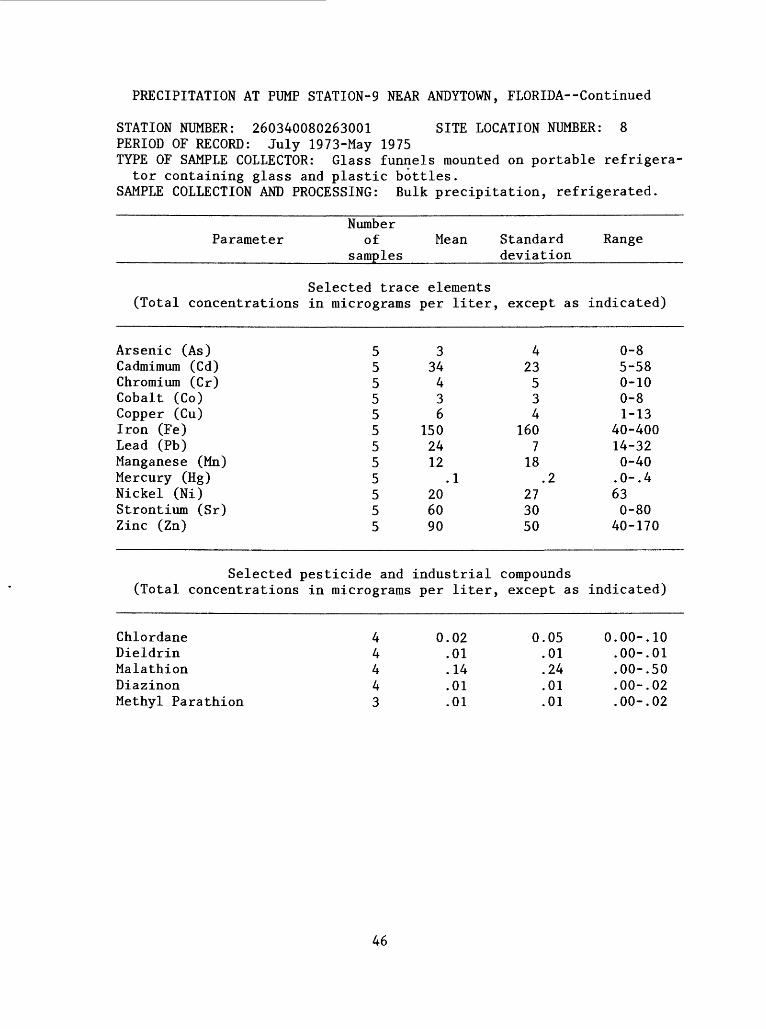
PRECIPITATION AT PUMP STATION-9 NEAR ANDYTOWN, FLORIDA Continued
STATION NUMBER: 260340080263001 SITE LOCATION NUMBER: 8 PERIOD OF RECORD: July 1973-May 1975TYPE OF SAMPLE COLLECTOR: Glass funnels mounted on portable refrigera
tor containing glass and plastic bottles. SAMPLE COLLECTION AND PROCESSING: Bulk precipitation, refrigerated.
NumberParameter of Mean Standard Range
_______________________samples_____________deviation_____________
Selected trace elements (Total concentrations in micrograms per liter, except as indicated)
Arsenic (As)Cadmimum (Cd)Chromium (Cr)Cobalt (Co)Copper (Cu)Iron (Fe)Lead (Pb)Manganese (Mn)Mercury (Hg)Nickel (Ni)Strontium (Sr)Zinc (Zn)
555555555555
334436
1502412
.1206090
423534
1607
18.2
273050
0-85-580-100-81-13
40-40014-320-40.0-.4630-80
40-170
Selected pesticide and industrial compounds (Total concentrations in micrograms per liter, except as indicated)
Chlordane 4 0.02 0.05 0.00-.10Dieldrin 4 .01 .01 .00-.01Malathion 4 .14 .24 .00-.50Diazinon 4 .01 .01 .00-.02Methyl Parathion 3 .01 .01 .00-.02
46

PRECIPITATION AT 45TH AVENUE AT HOLLYWOOD, FLORIDA
STATION NUMBER: 260207080110600 SITE LOCATION NUMBER: 9 PERIOD OF RECORD: January 1973-May 1975TYPE OF SAMPLE COLLECTOR: Galvanized funnel and teflon bottle. SAMPLE COLLECTION AND PROCESSING: Bulk precipitation.
ParameterNumber
of samples
Mean Standard deviation
Range
Selected pesticide and industrial compounds (Total concentrations in micrograms per liter, except as indicated)
Aldrin 16 0.00 0.00 0.00-.01Chlordane 15 .05 .05 .00-.10DOT 16 .00 .00 .00-.01Diazinon 16 .04 .06 .00-.21Dieldrin 16 .00 .01 .00-.01Lindane 16 .00 .00 .00-.01Malathion 16 .04 .06 .00-.18Methyl Parathion 16 .02 .05 .00-.18Parathion 16 .01 .03 .00-.14PCB 16 .01 .03 .00-.10
47
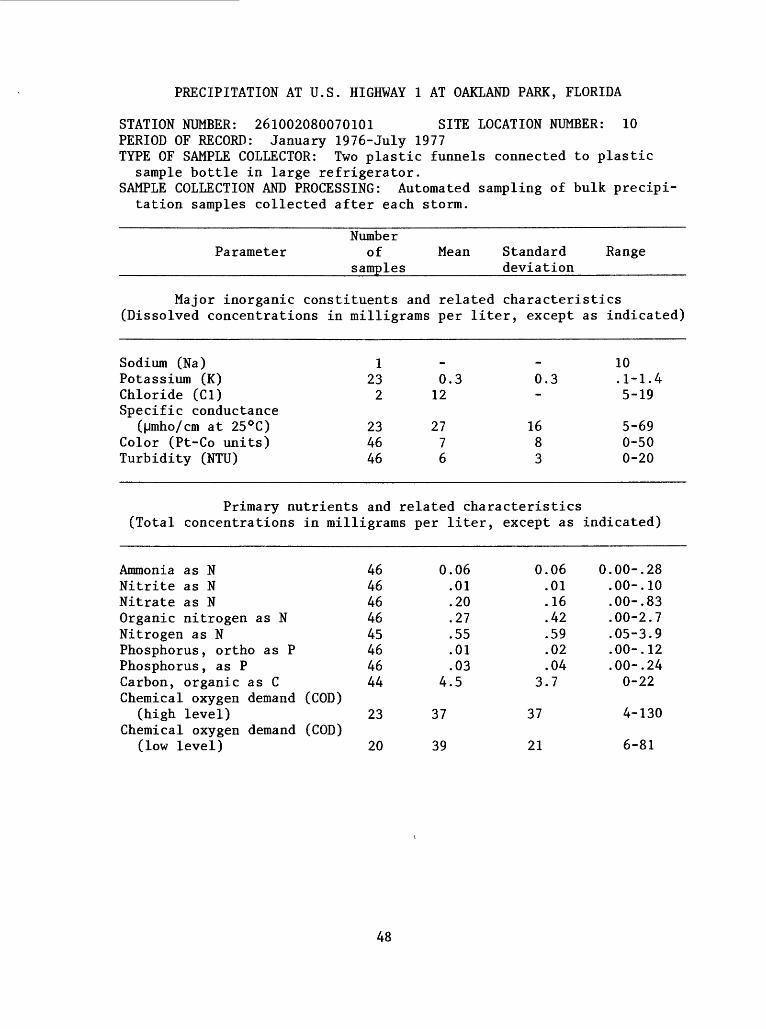
PRECIPITATION AT U.S. HIGHWAY 1 AT OAKLAND PARK, FLORIDA
STATION NUMBER: 261002080070101 SITE LOCATION NUMBER: 10PERIOD OF RECORD: January 1976-July 1977TYPE OF SAMPLE COLLECTOR: Two plastic funnels connected to plastic
sample bottle in large refrigerator.SAMPLE COLLECTION AND PROCESSING: Automated sampling of bulk precipi
tation samples collected after each storm.
ParameterNumber
of samples
Mean Standard deviation
Range
Major inorganic constituents and related characteristics (Dissolved concentrations in milligrams per liter, except as indicated)
Sodium (Na)Potassium (K)Chloride (Cl)Specific conductance
(pmho/cm at 25 °C)Color (Pt-Co units)Turbidity (NTU)
1232
234646
_0.3
12
2776
_
0.3-
1683
10.1-1.45-19
5-690-500-20
Primary nutrients and related characteristics (Total concentrations in milligrams per liter, except as indicated)
Ammonia as NNitrite as NNitrate as NOrganic nitrogen as NNitrogen as NPhosphorus, ortho as PPhosphorus, as PCarbon, organic as CChemical oxygen demand (COD)
(high level)Chemical oxygen demand (COD)
(low level)
4646464645464644
23
20
0.06.01.20.27.55.01.03
4.5
37
39
0.06.01.16.42.59.02.04
3.7
37
21
0.00-.28.00-. 10.00-. 83.00-2.7.05-3.9.00-. 12.00-. 240-22
4-130
6-81
48

PRECIPITATION AT U.S. HIGHWAY 1 AT OAKLAND PARK, FLORIDA Continued
STATION NUMBER: 261002080070101 SITE LOCATION NUMBER: 10PERIOD OF RECORD: January 1976-July 1977TYPE OF SAMPLE COLLECTOR: Two plastic funnels connected to plastic
sample bottle in large refrigerator.SAMPLE COLLECTION AND PROCESSING: Automated sampling of bulk precipi
tation samples collected after each storm.
ParameterNumber
of samples
Mean Standard deviation
Range
Selected trace elements (Total concentrations in micrograms per liter, except as indicated)
Arsenic (As)Cadmimum (Cd)Chromium (Cr)Copper (Cu)Iron (Fe)Lead (Pb)Zinc (Zn)
3494849485050
01
2010
340440180
01
2018
330460170
00-60-900-1200-1,80010-2,40010-1,000
49

PRECIPITATION AT SAMPLE ROAD NEAR POMPANO BEACH, FLORIDA
STATION NUMBER: 261629080072401 SITE LOCATION NUMBER: 11PERIOD OF RECORD: October 1975-June 1977TYPE OF SAMPLE COLLECTOR: Two plastic funnels connected to plastic
bottles in large refrigerator.SAMPLE COLLECTION AND PROCESSING: Automated sampling of bulk precipi
tation. Samples collected after each storm.
ParameterNumber
of samples
Mean Standard deviation
Range
Major inorganic constituents and related characteristics (Dissolved concentrations in milligrams per liter, except as indicated)
Sodium (Na)Potassium (K)Bicarbonate (HC03 )Chloride (Cl)Specific conductance
(pmho/cm at 25°C)pH (units)Color (Pt-Co units)Turbidity (JTU)
12514
281
4951
_
.4-3.7
35
95
_
.5-1.7
32
102
3.9.1-1.818
2.0-6.0
6-1606.2
0-541-10
Primary nutrients and related characteristics (Total concentrations in milligrams per liter, except as indicated)
Ammonia as NNitrite as NNitrate as NOrganic nitrogen as NNitrogen as NPhosphorus, ortho as PPhosphorus, as PCarbon, organic as CChemical oxygen demand (COD)
(high level)Chemical oxygen demand (COD)
(low level)
4851514848484849
34
17
0.14.01.23.36.70.02.05
4.0
21
22
0.14.01.20.39.57.04.05
3.6
23
13
0.01-.56.00-. 08.00-1.10-1.6
.05-2.60-.220-.24.0-17
0-85
4-49
50
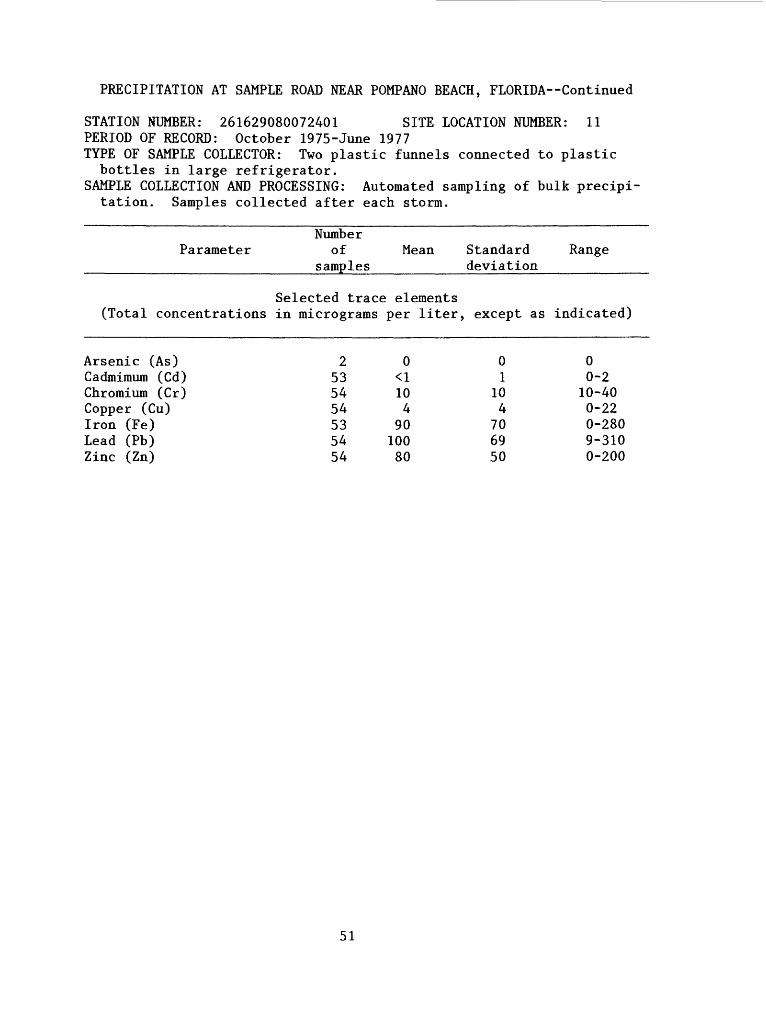
PRECIPITATION AT SAMPLE ROAD NEAR POMPANO BEACH, FLORIDA Continued
STATION NUMBER: 261629080072401 SITE LOCATION NUMBER: 11PERIOD OF RECORD: October 1975-June 1977TYPE OF SAMPLE COLLECTOR: Two plastic funnels connected to plastic
bottles in large refrigerator.SAMPLE COLLECTION AND PROCESSING: Automated sampling of bulk precipi
tation. Samples collected after each storm.
NumberParameter of Mean Standard Range
______________________samples_________deviation___________
Selected trace elements (Total concentrations in micrograms per liter, except as indicated)
Arsenic (As)Cadmimum (Cd)Chromium (Cr)Copper (Cu)Iron (Fe)Lead (Pb)Zinc (Zn)
2535454535454
0<1104
9010080
01
104
706950
00-210-400-220-2809-3100-200
51
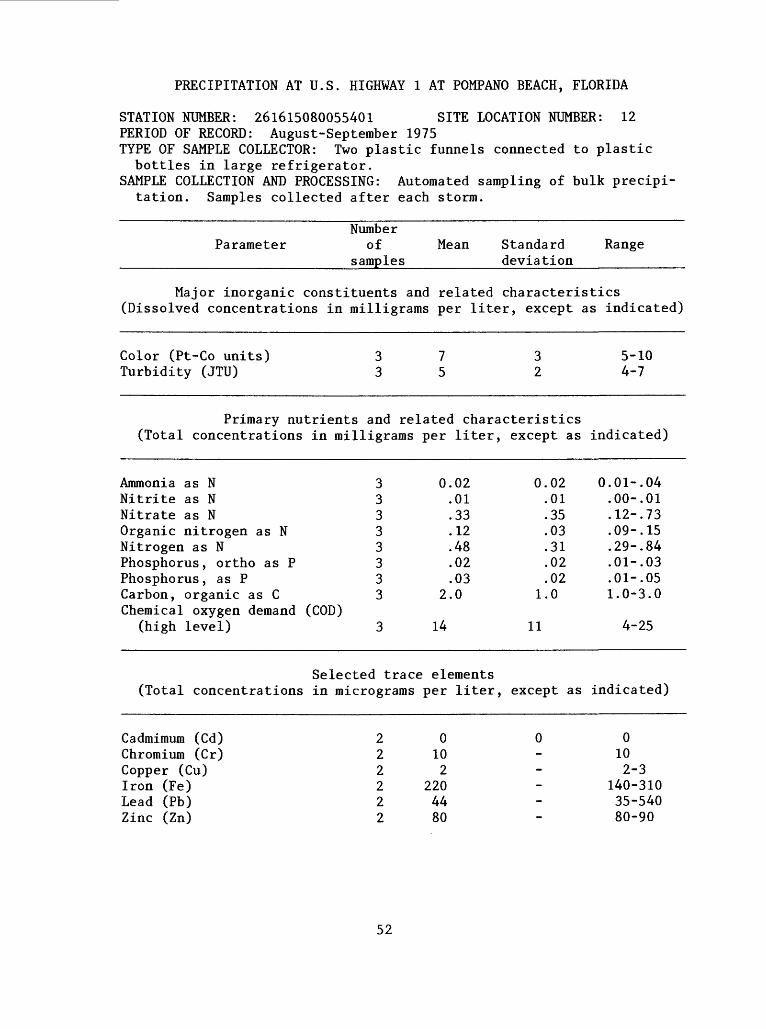
PRECIPITATION AT U.S. HIGHWAY 1 AT POMPANO BEACH, FLORIDA
STATION NUMBER: 261615080055401 SITE LOCATION NUMBER: 12PERIOD OF RECORD: August-September 1975TYPE OF SAMPLE COLLECTOR: Two plastic funnels connected to plastic bottles in large refrigerator.
SAMPLE COLLECTION AND PROCESSING: Automated sampling of bulk precipi tation. Samples collected after each storm.
Number Parameter of Mean Standard Range
____________________________samples____________deviation______________
Major inorganic constituents and related characteristics (Dissolved concentrations in milligrams per liter, except as indicated)
Color (Pt-Co units) 37 3 5-10 Turbidity (JTU) 35 24-7
Primary nutrients and related characteristics (Total concentrations in milligrams per liter, except as indicated)
Ammonia as NNitrite as NNitrate as NOrganic nitrogen as NNitrogen as NPhosphorus , ortho as PPhosphorus, as PCarbon, organic as CChemical oxygen demand (COD)
(high level)
33333333
3
0.02.01.33.12.48.02.03
2.0
14
0.02.01.35.03.31.02.02
1.0
11
0.01-.04.00-. 01.12-. 73.09-. 15.29-. 84.01-. 03.01-. 051.0-3.0
4-25
Selected trace elements (Total concentrations in micrograms per liter, except as indicated)
Cadmimum (Cd)Chromium (Cr)Copper (Cu)Iron (Fe)Lead (Pb)Zinc (Zn)
222222
0102
2204480
0 0102-3
140-31035-54080-90
52

PRECIPITATION AT EAST WATER PLANT AT BOCA RATON, FLORIDA
STATION NUMBER: 262145080052702 SITE LOCATION NUMBER: 13 PERIOD OF RECORD: September 1975-July 1978 TYPE OF SAMPLE COLLECTOR: Plastic funnel and bottles. SAMPLE COLLECTION AND PROCESSING: Bulk precipitation composited for
annual analysis of pesticide.
ParameterNumber
of samples
Mean Standard deviation
Range
Selected pesticide and industrial compounds (Total concentrations in micrograms per liter, except as indicated)
Diazinon 4 0.04 0.06 0.00-.12Malathion 4 .08 .12 .00-.25PCB 4 .07 .15 .00-.30
53

PRECIPITATION AT SANIBEL ISLAND, FLORIDA
STATION NUMBER: 262552082034301 SITE LOCATION NUMBER: 14 PERIOD OF RECORD: June-September 1977 TYPE OF SAMPLE COLLECTOR: Plastic funnel and bottle. SAMPLE COLLECTION AND PROCESSING: Bulk precipitation. Samples not
refrigerated.
ParameterNumber
of samples
Mean Standard deviation
Range
Major inorganic constituents and related characteristics (Dissolved concentrations in milligrams per liter, except as indicated)
Calcium (Ca)Magnesium (Mg)Sodium (Na)Potassium (K)Bicarbonate (HC03 )Carbonate (C03 )Sulfate (S04 )Chloride (Cl)Silica (Si02 )Hardness (CaC03 )Noncarbonate hardnessSpecific conductance
(Mmho/cm at 25°C)pH (units)Color (Pt-Co units)Turbidity (JTU)
22222212222
3411
1.1.2
3.6.8
20-4.51.042
36-53
0.8-1.4.2-. 3
2.8-4.5.3-1.20-60.4
2.9-3.6.3-1.73-40-3
4 32-395.6-7.5
53
Primary nutrients and related characteristics (Total concentrations in milligrams per liter, except as indicated)
Ammonia as NNitrite as NNitrate as NOrganic nitrogen as NNitrogen as NPhosphorus, ortho as PPhosphorus, as P
2221122
0.26.01.11.14.42.22.22
0.12.00.01
--.14.14
0.17-.34.01.10-. 11.14.42.12-. 32.12-. 32
54
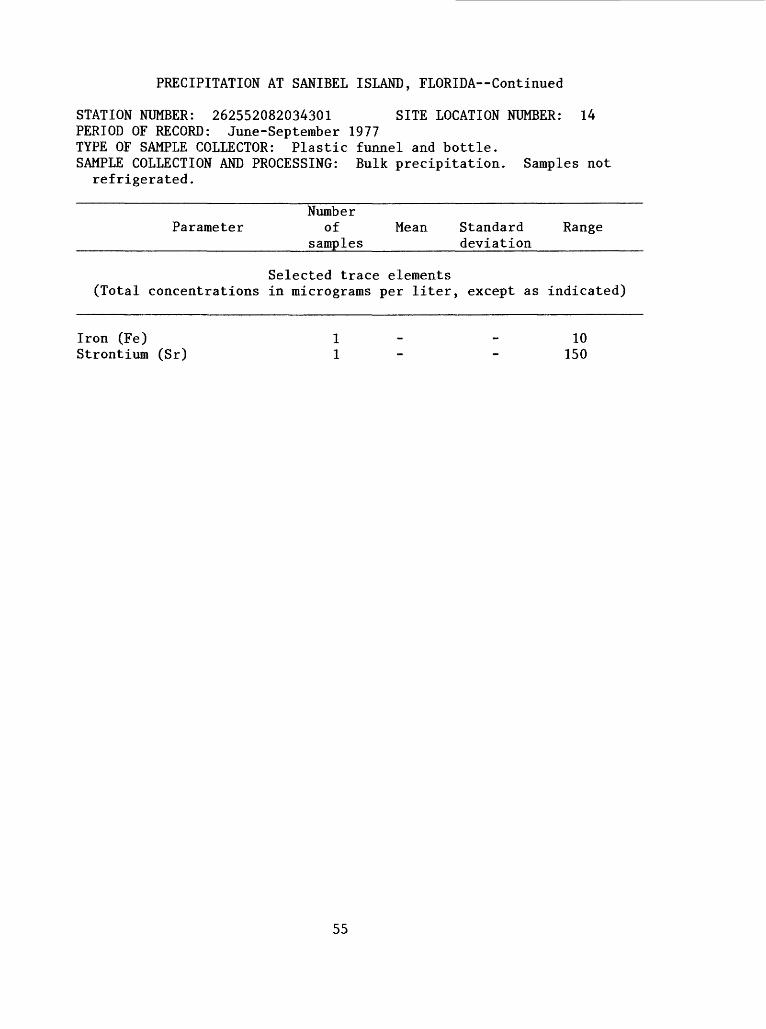
PRECIPITATION AT SANIBEL ISLAND, FLORIDA Continued
STATION NUMBER: 262552082034301 SITE LOCATION NUMBER: 14 PERIOD OF RECORD: June-September 1977 TYPE OF SAMPLE COLLECTOR: Plastic funnel and bottle. SAMPLE COLLECTION AND PROCESSING: Bulk precipitation. Samples not
refrigerated.
NumberParameter of Mean Standard Range
______________________samples_________deviation_____________
Selected trace elements (Total concentrations in micrograms per liter, except as indicated)
Iron (Fe) 1 10 Strontium (Sr) 1 150
55

PRECIPITATION AT PUMP STATION-5 NEAR LOXAHATCHEE, FLORIDA
STATION NUMBER: 264105080221501 SITE LOCATION NUMBER: 15 PERIOD OF RECORD: April 1973-May 1975TYPE OF SAMPLE COLLECTOR: Glass funnels mounted on portable refrigera
tor containing glass and plastic bottles. SAMPLE COLLECTION AND PROCESSING: Bulk precipitation, refrigerated.
ParameterNumber
of samples
Mean Standard deviation
Range
Major inorganic constituents and related characteristics (Dissolved concentrations in milligrams per liter, except as indicated)
Calcium (Ca)Magnesium (Mg)Sodium (Na)Potassium (K)Bicarbonate (HC03 )Carbonate (C03 )Sulfate (S04 )Chloride (Cl)Fluoride (F)Silica (Si02 )Hardness (CaC03 )Noncarbonate hardnessSpecific conductance
(pmho/cm at 25°C)pH (units)Solids (residue at 180°C)Color (Pt-Co units)Turbidity (JTU)
555553555655
1245614
3.4.6
2.3.4
5.603.23.9.1.1
116
41-
3263
2.0.5
2.2.3
4.202.62.9.1.1
62
31-
2071
1.0-5.8.0-1.4.8-6.1.1-.9
3.0-130.9-7.6
1.6-8.5.0-.2.0-.35-203-9
12-975.6-6.413-611-201-5
Primary nutrients and related characteristics (Total concentrations in milligrams per liter, except as indicated)
Ammonia as NNitrite as NNitrate as NOrganic nitrogen as NNitrogen as NPhosphorus, ortho as PPhosphorus, as PCarbon, organic as C
121411149
141413
0.32.03.31.45.97.07.09
2.2
0.24.03.10.41.45.12.13
2.5
0.05-.75.01-. 09.15-. 48.08-1.4.43-1.7.00-. 39.01-. 39.00-8.5
56

PRECIPITATION AT PUMP STATION-5 NEAR LOXAHATCHEE, FLORIDA Continued
STATION NUMBER: 264105080221501 SITE LOCATION NUMBER: 15 PERIOD OF RECORD: April 1973-May 1975TYPE OF SAMPLE COLLECTOR: Glass funnels mounted on portable refrigera
tor containing glass and plastic bottles. SAMPLE COLLECTION AND PROCESSING: Bulk precipitation, refrigerated.
ParameterNumber
of samples
Mean Standard deviation
Range
Selected trace elements (Total concentrations in micrograms per liter, except as indicated)
Arsenic (As)Cadmimum (Cd)Chromium (Cr)Cobalt (Co)Copper (Cu)Iron (Fe)Lead (Pb)Manganese (Mn)Mercury (Hg)Nickel (Ni)Strontium (Sr)Zinc (Zn)
555545555555
34
<1044
40150.2
1922130
33
<1040
40100.4
211670
0-71-80-100-8
100-1002-290.0-.90-440-40
60-230
Selected pesticide and industrial compounds (Total concentrations in micrograms per liter, except as indicated)
Chlordane 4 0.08 0.10 0.00-.20Dieldrin 4 .01 .01 .00-.02Malathion 3 .11 .11 .00-.22Methyl Parathion 3 .01 .02 .00-.03
57
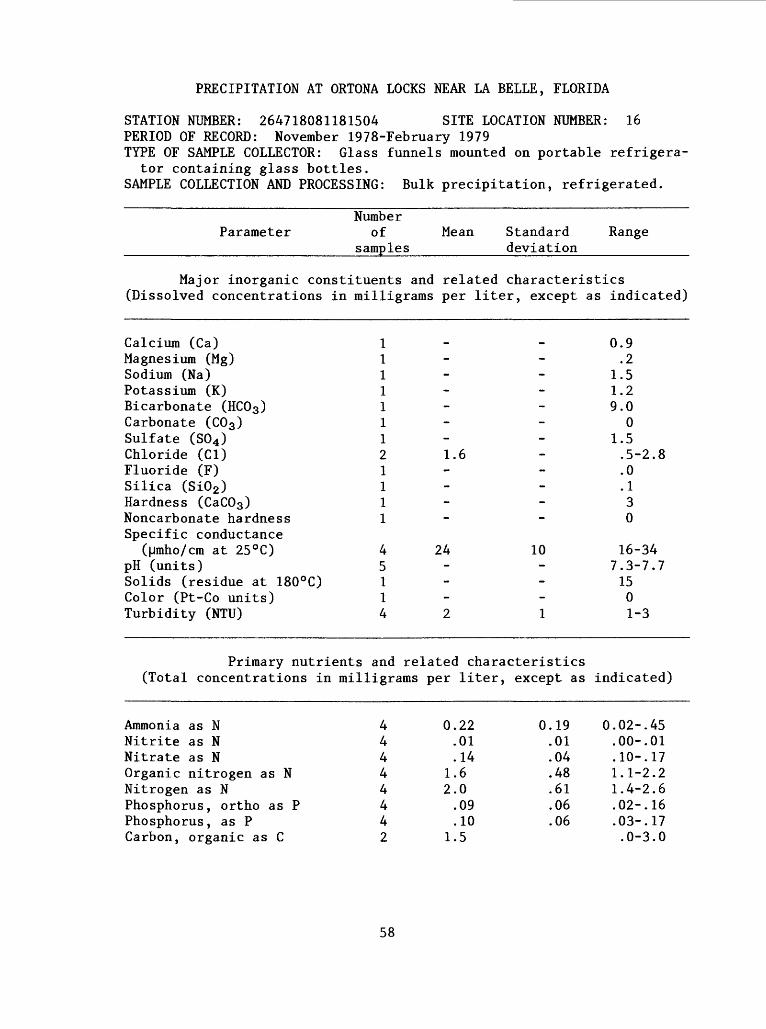
PRECIPITATION AT ORTONA LOCKS NEAR LA BELLE, FLORIDA
STATION NUMBER: 264718081181504 SITE LOCATION NUMBER: 16 PERIOD OF RECORD: November 1978-February 1979TYPE OF SAMPLE COLLECTOR: Glass funnels mounted on portable refrigera
tor containing glass bottles. SAMPLE COLLECTION AND PROCESSING: Bulk precipitation, refrigerated.
ParameterNumber
of samples
Mean Standard deviation
Range
Major inorganic constituents and related characteristics (Dissolved concentrations in milligrams per liter, except as indicated)
Calcium (Ca)Magnesium (Mg)Sodium (Na)Potassium (K)Bicarbonate (HC03 )Carbonate (C03 )Sulfate (S04 )Chloride (Cl)Fluoride (F)Silica (Si02 )Hardness (CaC03 )Noncarbonate hardnessSpecific conductance
(|jmho/cm at 25°C)pH (units)Solids (residue at 180°C)Color (Pt-Co units)Turbidity (NTU)
11111112 1.61111
4 245114 2
0.9.2
1.51.29.0
01.5.5-2.8.0.130
10 16-347.3-7.7150
1 1-3
Primary nutrients and related characteristics (Total concentrations in milligrams per liter, except as indicated)
Ammonia as NNitrite as NNitrate as NOrganic nitrogen as NNitrogen as NPhosphorus , ortho as PPhosphorus, as PCarbon, organic as C
44444442
0.22.01.14
1.62.0.09.10
1.5
0.19.01.04.48.61.06.06
0.02-.45.00-. 01.10-. 171.1-2.21.4-2.6.02-. 16.03-. 17.0-3.0
58

PRECIPITATION AT ORTONA LOCKS NEAR LA BELLE, FLORIDA Continued
STATION NUMBER: 264718081181504 SITE LOCATION NUMBER: 16 PERIOD OF RECORD: November 1978-February 1979TYPE OF SAMPLE COLLECTOR: Glass funnels mounted on portable refrigera
tor containing glass bottles. SAMPLE COLLECTION AND PROCESSING: Bulk precipitation, refrigerated.
NumberParameter of Mean Standard Range
_______________________samples____________deviation_____________
Selected trace elements (Total concentrations in micrograms per liter, except as indicated)
Aluminum (Al)Arsenic (As)Copper (Cu)Iron (Fe)Lead (Pb)Manganese (Mn)Nickel (Ni)Strontium (Sr)Zinc (Zn)
111111111
001
60100
03
5030
59
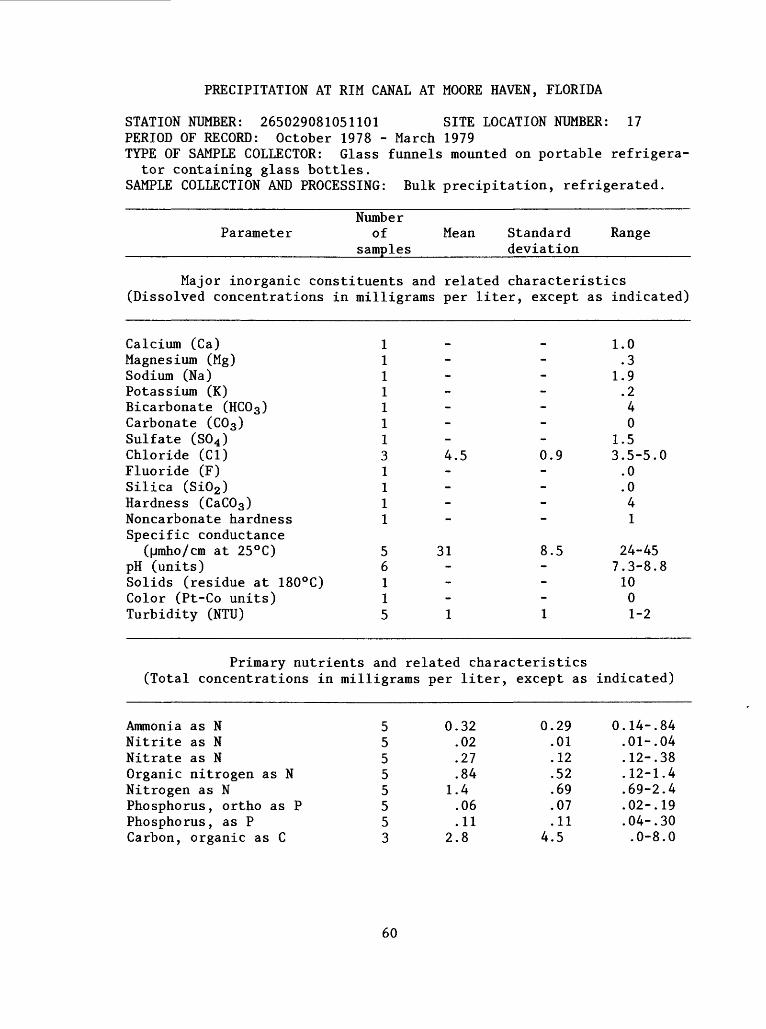
PRECIPITATION AT RIM CANAL AT MOORE HAVEN, FLORIDA
STATION NUMBER: 265029081051101 SITE LOCATION NUMBER: 17 PERIOD OF RECORD: October 1978 - March 1979TYPE OF SAMPLE COLLECTOR: Glass funnels mounted on portable refrigera
tor containing glass bottles. SAMPLE COLLECTION AND PROCESSING: Bulk precipitation, refrigerated.
ParameterNumber
of samples
Mean Standard deviation
Range
Major inorganic constituents and related characteristics (Dissolved concentrations in milligrams per liter, except as indicated)
Calcium (Ca)Magnesium (Mg)Sodium (Na)Potassium (K)Bicarbonate (HC03 )Carbonate (C03 )Sulfate (S04 )Chloride (Cl)Fluoride (F)Silica (Si02 )Hardness (CaC03 )Noncarbonate hardnessSpecific conductance
(jjmho/cm at 25°C)pH (units)Solids (residue at 180°C)Color (Pt-Co units)Turbidity (NTU)
11111113 4.51111
5 316115 1
1.0.3
1.9.240
1.50.9 3.5-5.0
.0
.041
8.5 24-457.3-8.8100
1 1-2
Primary nutrients and related characteristics (Total concentrations in milligrams per liter, except as indicated)
Ammonia as NNitrite as NNitrate as NOrganic nitrogen as NNitrogen as NPhosphorus, ortho as PPhosphorus, as PCarbon, organic as C
55555553
0.32.02.27.84
1.4.06.11
2.8
0.29.01.12.52.69.07.11
4.5
0.14-.84.01-. 04.12-. 38.12-1.4.69-2.4.02-. 19.04-. 30.0-8.0
60
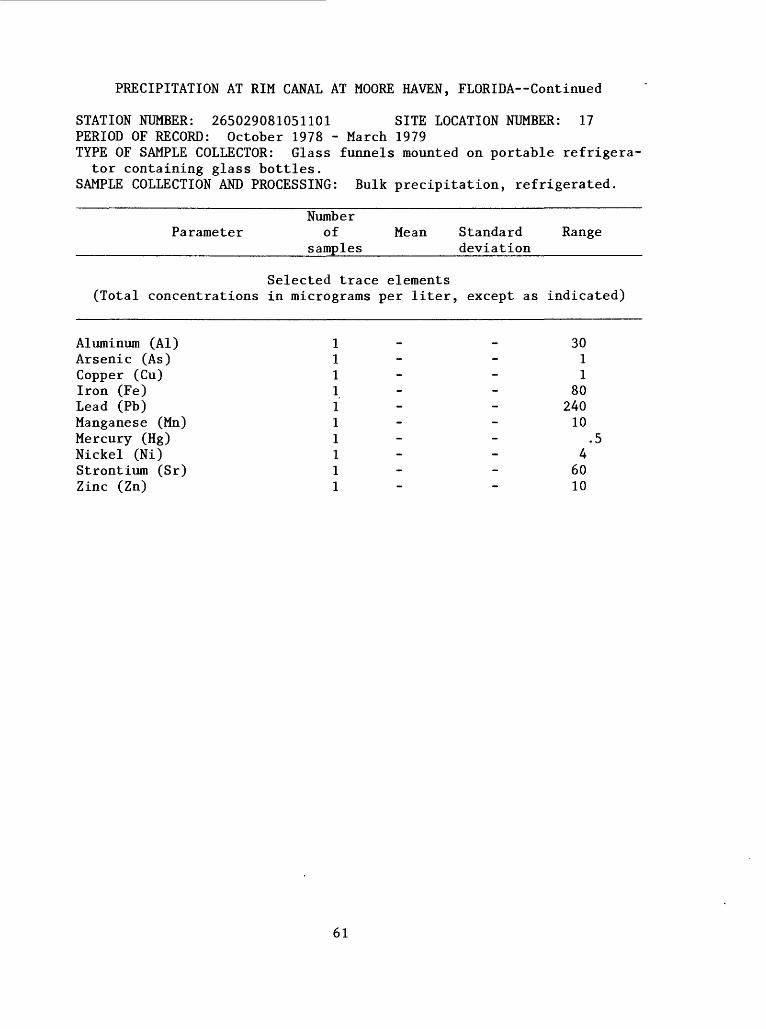
PRECIPITATION AT RIM CANAL AT MOORE HAVEN, FLORIDA Continued
STATION NUMBER: 265029081051101 SITE LOCATION NUMBER: 17 PERIOD OF RECORD: October 1978 - March 1979TYPE OF SAMPLE COLLECTOR: Glass funnels mounted on portable refrigera
tor containing glass bottles. SAMPLE COLLECTION AND PROCESSING: Bulk precipitation, refrigerated.
NumberParameter of Mean Standard Range
_______________________samples_________deviation_____________
Selected trace elements (Total concentrations in micrograms per liter, except as indicated)
Aluminum (Al)Arsenic (As)Copper (Cu)Iron (Fe)Lead (Pb)Manganese (Mn)Mercury (Hg)Nickel (Ni)Strontium (Sr)Zinc (Zn)
1111111111
3011
8024010
.54
6010
61

PRECIPITATION AT HURRICANE GATE STRUCTURE-1 AT MOORE HAVEN, FLORIDA
STATION NUMBER: 265020081051500 SITE LOCATION NUMBER: 18 PERIOD OF RECORD: January-December 1969 TYPE OF SAMPLE COLLECTOR: Plastic bottle and funnel.SAMPLE COLLECTION AND PROCESSING: Composite and single event samples.
Sample refrigerated between collection periods.
ParameterNumber
of samples
Mean Standard deviation
Range
Major inorganic constituents and related characteristics (Dissolved concentrations in milligrams per liter, except as indicated)
Specific conductance (|jmho/cm at 25°C) 11 39 24 17-80
Primary nutrients and related characteristics (Total concentrations in milligrams per liter, except as indicated)
Ammonia as N Nitrite as N Nitrate as N Organic nitrogen as N Nitrogen as N Phosphorus, ortho as P Phosphorus, as P
11111111111111
0.25 .00 .09 .37 .71 .02 .04
0.31 .00 .09 .14 .42 .03 .04
0.00-.85 .00.0-.3
.20-.58
.25-1.6
.00-.11
.01-.13
62
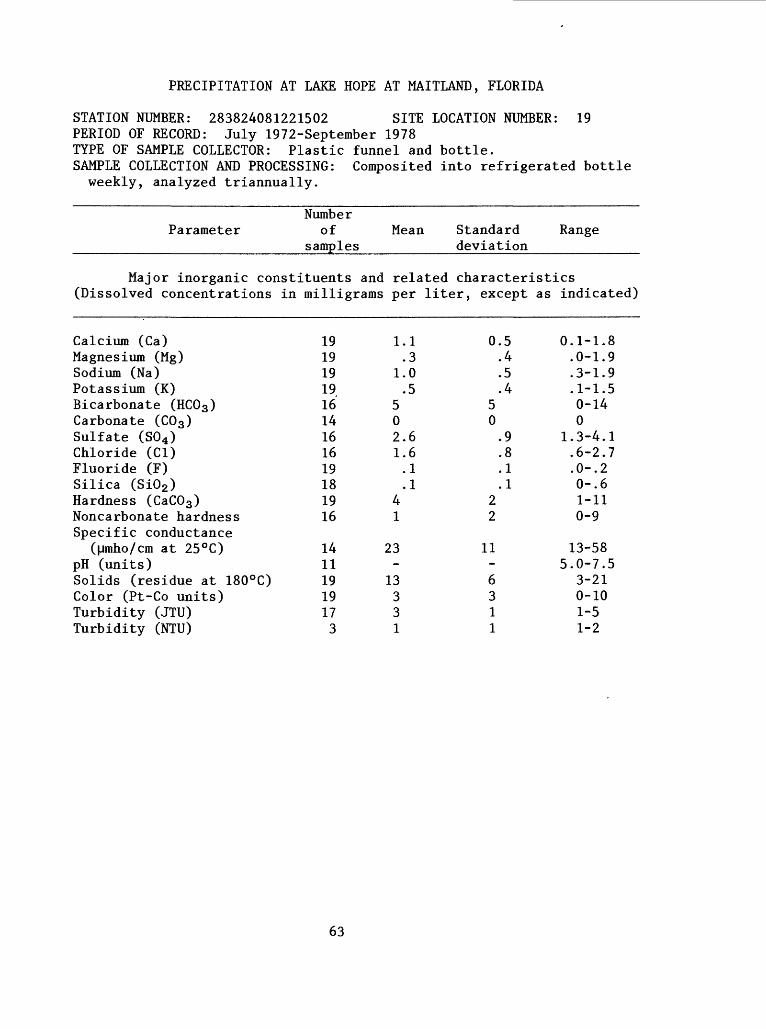
PRECIPITATION AT LAKE HOPE AT MAITLAND, FLORIDA
STATION NUMBER: 283824081221502 SITE LOCATION NUMBER: 19 PERIOD OF RECORD: July 1972-September 1978 TYPE OF SAMPLE COLLECTOR: Plastic funnel and bottle.SAMPLE COLLECTION AND PROCESSING: Composited into refrigerated bottle
weekly, analyzed triannually.
Number Parameter of Mean Standard Range
_________________________samples_________deviation______________
Major inorganic constituents and related characteristics (Dissolved concentrations in milligrams per liter, except as indicated)
Calcium (Ca)Magnesium (Mg)Sodium (Na)Potassium (K)Bicarbonate (HC03 )Carbonate (C03 )Sulfate (S04 )Chloride (Cl)Fluoride (F)Silica (Si02 )Hardness (CaC03 )Noncarbonate hardnessSpecific conductance
(pmho/cm at 25°C)pH (units)Solids (residue at 180°C)Color (Pt-Co units)Turbidity (JTU)Turbidity (NTU)
191919191614161619181916
14111919173
1.1.3
1.0.5
502.61.6.1.1
41
23-
13331
0.5.4.5.4
50.9.8.1.1
22
11-6311
0.1-1.8.0-1.9.3-1.9.1-1.50-140
1.3-4.1.6-2.7.0-.20-.61-110-9
13-585.0-7.5
3-210-101-51-2
63

PRECIPITATION AT LAKE HOPE AT MAITLAND, FLORIDA Continued
STATION NUMBER: 283824081221502 SITE LOCATION NUMBER: 19 PERIOD OF RECORD: July 1972-September 1978 TYPE OF SAMPLE COLLECTOR: Plastic funnel and bottle.SAMPLE COLLECTION AND PROCESSING: Composited into refrigerated bottle
weekly, analyzed triannually.
ParameterNumber
of samples
Mean Standard deviation
Range
Primary nutrients and related characteristics (Total concentrations in milligrams per liter, except as indicated)
Ammonia as NNitrite as NNitrate as NOrganic nitrogen as NNitrogen as NPhosphorus, ortho as PPhosphorus, as PCarbon, organic as CChemical oxygen demand (COD)
(high level)Chemical oxygen demand (COD)
(low level)
202020201420209
6
2
0.78.02.29.48
1.6.15.18
4.0
8
10
0.70.03.25.47
1.6.18.19
6.1
6
*
0.02-3.3.00-. 13.00-1.2.08-2.2.19-6.8.00-. 79.01-. 891.0-20
2-19
4-15
Selected trace elements (Total concentrations in micrograms per liter, except as indicated)
Aluminum (Al)Arsenic (As)Cadmimum (Cd)Copper (Cu)Iron (Fe)Lead (Pb)Manganese (Mn)Mercury (Hg)Nickel (Ni)Strontium (Sr)Zinc (Zn)
16151
1516151514161314
400-9
50195.3.2
74450
501-7
120237.4.2
93340
0-2200-202-290-5002-920-20
0.0-.50-340-11010-150
64

PRECIPITATION AT INGLIS LOCK NEAR INGLIS, FLORIDA
STATION NUMBER: 290130082365100 SITE LOCATION NUMBER: 20 PERIOD OF RECORD: January-November"1975 TYPE OF SAMPLE COLLECTOR: Plastic funnel and bottle. SAMPLE COLLECTION AND PROCESSING: Bulk precipitation, composited monthly.
ParameterNumber
of samples
Mean Standard deviation
Range
Major inorganic constituents and related characteristics (Dissolved concentrations in milligrams per liter, except as indicated)
Chloride (Cl)Hardness (CaC03 )Specific conductance
(pmho/cm at 25°C)Color (Pt-Co units)Turbidity (JTU)
11
11
10 3
29
295
2 1-7
Primary nutrients and related characteristics (Total concentrations in milligrams per liter, except as indicated)
Ammonia as NNitrite as NNitrate as NOrganic nitrogen as NNitrogen as NPhosphorus, ortho as PPhosphorus, as PCarbon, organic as C
101111991092
0.39.01.27.32
1.0.03.03
2.5
0.27.00.14.24.60.04.012.1
0.14-.99.00-. 01.10-. 490-.88
.25-2.29
.01-. 16
.01-. 051.0-4.0
65
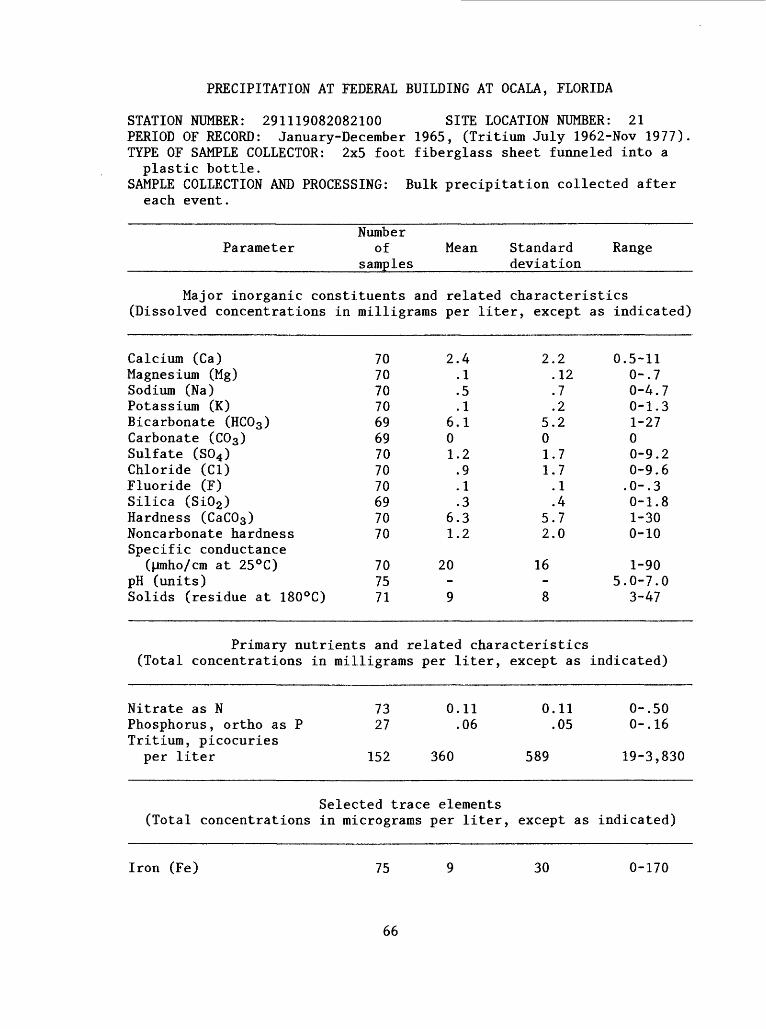
PRECIPITATION AT FEDERAL BUILDING AT OCALA, FLORIDA
STATION NUMBER: 291119082082100 SITE LOCATION NUMBER: 21 PERIOD OF RECORD: January-December 1965, (Tritium July 1962-Nov 1977). TYPE OF SAMPLE COLLECTOR: 2x5 foot fiberglass sheet funneled into aplastic bottle.
SAMPLE COLLECTION AND PROCESSING: Bulk precipitation collected aftereach event.
ParameterNumber
of samples
Mean Standard deviation
Range
Major inorganic constituents and related characteristics (Dissolved concentrations in milligrams per liter, except as indicated)
Calcium (Ca)Magnesium (Mg)Sodium (Na)Potassium (K)Bicarbonate (HC03 )Carbonate (C03 )Sulfate (S04 )Chloride (Cl)Fluoride (F)Silica (Si02 )Hardness (CaC03 )Noncarbonate hardnessSpecific conductance
(Mmho/cm at 25°C)pH (units)Solids (residue at 180°C)
707070706969707070697070
707571
2.4.1.5.1
6.101.2.9.1.3
6.31.2
20-9
2.2.12.7.2
5.201.71.7.1.4
5.72.0
16-8
0.5-110-.70-4.70-1.31-2700-9.20-9.6.0-.30-1.81-300-10
1-905.0-7.0
3-47
Primary nutrients and related characteristics (Total concentrations in milligrams per liter, except as indicated)
Nitrate as NPhosphorus , ortho as PTritium, picocuries
per liter
7327
152
0.11.06
360
0.11.05
589
0-.500-.16
19-3,830
Selected trace elements (Total concentrations in micrograms per liter, except as indicated)
Iron (Fe) 75 30 0-170
66

PRECIPITATION AT FEDERAL BUILDING AT OCALA, FLORIDA
STATION NUMBER: 291119082082101 SITE LOCATION NUMBER: 21PERIOD OF RECORD: February-November 1965TYPE OF SAMPLE COLLECTOR: 2x5 foot friberglass sheet, covered except
for storm event. Funneled into plastic bottle. SAMPLE COLLECTION AND PROCESSING: Wet precipitation, collected aftereach event.
NumberParameter of Mean Standard Range
_______________________samples_________deviation____________
Major inorganic constituents and related characteristics (Dissolved concentrations in milligrams per liter, except as indicated)
Calcium (Ca)Magnesium (Mg)Sodium (Na)Potassium (K)Bicarbonate (HC03 )Carbonate (C03 )Sulfate (S04 )Chloride (Cl)Fluoride (F)Silica (Si02 )Hardness (CaC03 )Noncarbonate hardnessSpecific conductance
(|jmho/cm at 25°C)pH (units)Solids Sum
999999999999
91212
0.9.1.3.1
3.70.5.3.1.1
2.60
11-
11
0.5.1.21.05
1.70.8.4.1.3
1.50
6.1-
11
0.4-1.80-.2.1-.8O-.l1-600-2.40-1.0.0-.30-1.01-50
4-245.6-6.7
2-30
Primary nutrients and related characteristics (Total concentrations in milligrams per liter, except as indicated)
Nitrate as N 12 0.16 0.26 0.00-.84 Phosphorus, ortho as P 4 .08 .10 .00-.21
67

PRECIPITATION AT BUCKMAN LOCK NEAR PALATKA, FLORIDA
STATION NUMBER: 293245081433600 SITE LOCATION NUMBER: 22 PERIOD OF RECORD: January-November 1975 TYPE OF SAMPLE COLLECTOR: Plastic funnel and bottle. SAMPLE COLLECTION AND PROCESSING: Bulk precipitation, composited
monthly.
ParameterNumber
of samples
Mean Standard deviation
Range
Major inorganic constituents and related characteristics (Dissolved concentrations in milligrams per liter, except as indicated)
Chloride (Cl)Hardness (CaC03 )Specific conductance
(|Jmho/cm at 25°C)Color (Pt-Co units)Turbidity (JTU)
11
119 3
0.942
215
1 2-4
Primary nutrients and related characteristics (Total concentrations in milligrams per liter, except as indicated)
Ammonia as NNitrite as NNitrate as NOrganic nitrogen as NNitrogen as NPhosphorus , ortho as PPhosphorus, as PCarbon, organic as C
10111099
11111
0.48.01.26.44
1.2.06.07
-
0.28.01.13.26.47.05.07
-
0.18-1.1.00-. 02.14-. 59.01-. 77.34-1.88.00-. 18.01-. 24
1.0
68
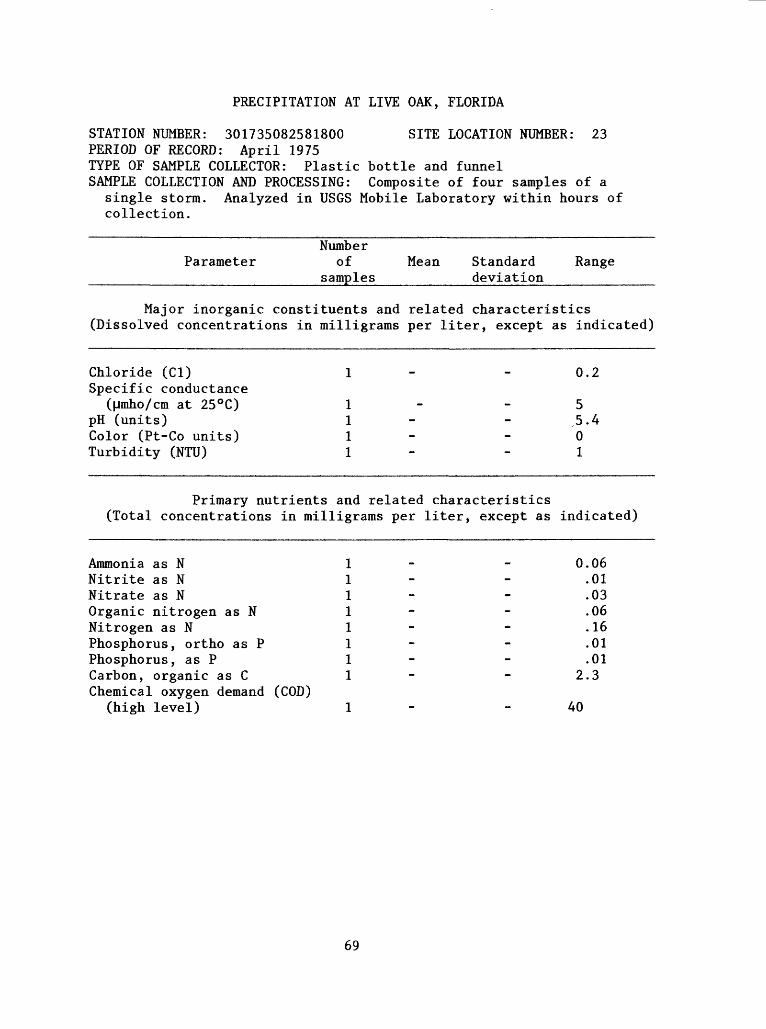
PRECIPITATION AT LIVE OAK, FLORIDA
STATION NUMBER: 301735082581800 SITE LOCATION NUMBER: 23PERIOD OF RECORD: April 1975TYPE OF SAMPLE COLLECTOR: Plastic bottle and funnelSAMPLE COLLECTION AND PROCESSING: Composite of four samples of a
single storm. Analyzed in USGS Mobile Laboratory within hours ofcollection.
ParameterNumber
of samples
Mean Standard deviation
Range
Major inorganic constituents and related characteristics (Dissolved concentrations in milligrams per liter, except as indicated)
Chloride (Cl) 1 - - 0.2 Specific conductance
(pmho/cm at 25°C) 1 5 pH (units) 1 - - ^5.4 Color (Pt-Co units) 1 - 0 Turbidity (NTU) 1 1
Primary nutrients and related characteristics (Total concentrations in milligrams per liter, except as indicated)
Ammonia as NNitrite as NNitrate as NOrganic nitrogen as NNitrogen as NPhosphorus, ortho as PPhosphorus, as PCarbon, organic as CChemical oxygen demand (COD)
(high level)
11111111
1
0.06.01.03.06.16.01.01
2.3
40
69

PRECIPITATION AT U.S. HIGHWAY 27 NORTH NEAR TALLAHASSEE, FLORIDA
STATION NUMBER: 303314084230304 SITE LOCATION NUMBER: 24 PERIOD OF RECORD: December 1977-March 1978 TYPE OF SAMPLE COLLECTOR: Plastic funnel and bottle. SAMPLE COLLECTION AND PROCESSING: Bulk precipitation collected
monthly.
ParameterNumber
of samples
Mean Standard deviation
Range
Major inorganic constituents and related characteristics (Dissolved concentrations in milligrams per liter, except as indicated)
Sodium (Na) 5 0.6 0.5 0.1-1.2 Chloride (Cl) 5 1.2 .8 .1-2.1 Specific conductance
([Jmho/cm at 25°C) 5 22 4 18-25
Primary nutrients and related characteristics (Total concentrations in milligrams per liter, except as indicated)
Ammonia as NNitrite as NNitrate as NOrganic nitrogen as NNitrogen as NPhosphorus, as PCarbon, organic as C
5555555
0.18.01.17.14.50.03.8
0.27.01.09.15.44.02
1.1
0.02-.66.00-. 01.06-. 31.00-. 31.15-1.2.01-. 05.0-2.0
Selected trace elements (Total concentrations in micrograms per liter, except as indicated)
Chromium (Cr) 5 <10 <10 <10-10Copper (Cu) 54 2 1-6Lead (Pb) 5 46 18 27-74Mercury (Hg) 5 <.5 <.5 <.5-.5Nickel (Ni) 55 3 2-10Zinc (Zn) 5 10 10 10-30
70 ftU S GOVERNMENT PRINTING OFFICE 1980-640-353/5