chem, volume 2 - cell.com volume 2 supplemental information synthesis and solution processing of a...
TRANSCRIPT
Chem, Volume 2
Supplemental Information
Synthesis and Solution Processing
of a Hydrogen-Bonded Ladder Polymer
Yang Zou, Xiaozhou Ji, Jizhe Cai, Tianyu Yuan, Daniel J. Stanton, Yen-HaoLin, Mohammad Naraghi, and Lei Fang
Supplemental Information
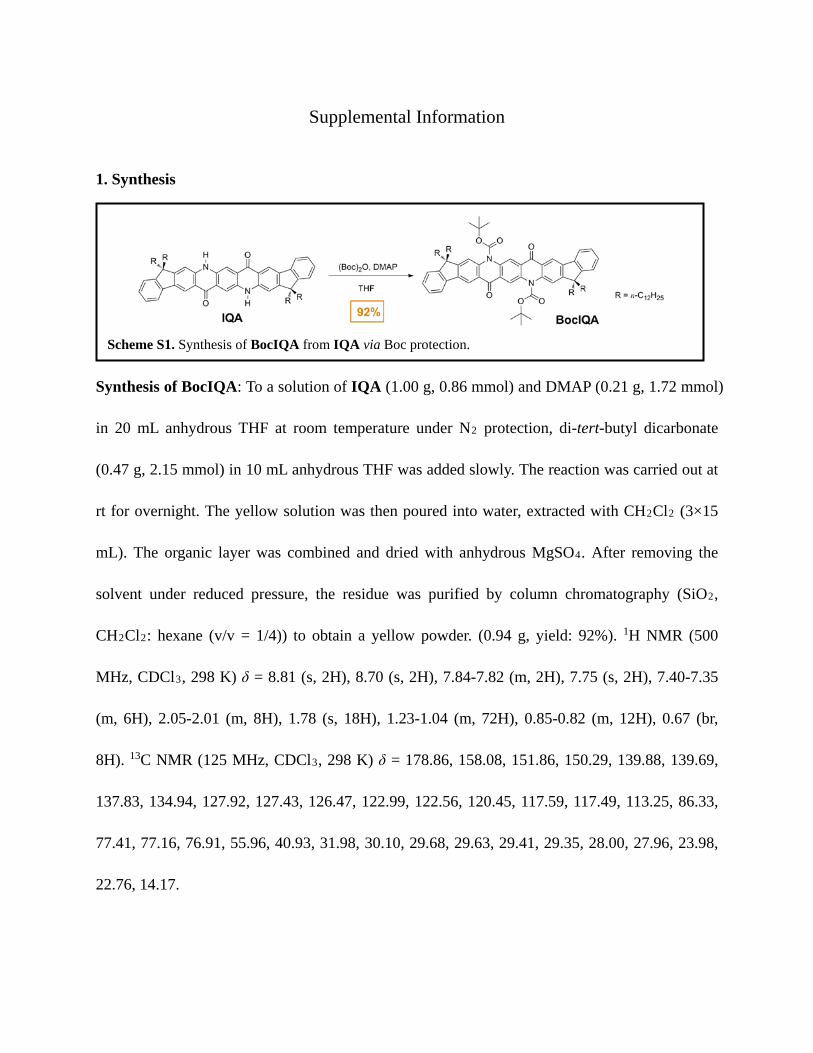
1. Synthesis
Synthesis of BocIQA: To a solution of IQA (1.00 g, 0.86 mmol) and DMAP (0.21 g, 1.72 mmol)
in 20 mL anhydrous THF at room temperature under N2 protection, di-tert-butyl dicarbonate
(0.47 g, 2.15 mmol) in 10 mL anhydrous THF was added slowly. The reaction was carried out at
rt for overnight. The yellow solution was then poured into water, extracted with CH2Cl2 (3×15
mL). The organic layer was combined and dried with anhydrous MgSO4. After removing the
solvent under reduced pressure, the residue was purified by column chromatography (SiO2,
CH2Cl2: hexane (v/v = 1/4)) to obtain a yellow powder. (0.94 g, yield: 92%). 1H NMR (500
MHz, CDCl3, 298 K) δ = 8.81 (s, 2H), 8.70 (s, 2H), 7.84-7.82 (m, 2H), 7.75 (s, 2H), 7.40-7.35
(m, 6H), 2.05-2.01 (m, 8H), 1.78 (s, 18H), 1.23-1.04 (m, 72H), 0.85-0.82 (m, 12H), 0.67 (br,
8H). 13C NMR (125 MHz, CDCl3, 298 K) δ = 178.86, 158.08, 151.86, 150.29, 139.88, 139.69,
137.83, 134.94, 127.92, 127.43, 126.47, 122.99, 122.56, 120.45, 117.59, 117.49, 113.25, 86.33,
77.41, 77.16, 76.91, 55.96, 40.93, 31.98, 30.10, 29.68, 29.63, 29.41, 29.35, 28.00, 27.96, 23.98,
22.76, 14.17.
Scheme S1. Synthesis of BocIQA from IQA via Boc protection.

Synthesis of P2. 2,7- diamino-9,9- didodecylfluorene (1.17 g, 2.20 mM), DMSS (502 mg,
2.20 mM) and p-TsOH·H2O (76 mg, 0.44 mM) were dissolved in 14 mL of dry chloroform in a
100 mL Schlenk tube and degassed with nitrogen. The tube was then sealed and heated to 90 ºC
for 72 hr to form a viscous orange mixture. The reaction mixture was then cooled to room
temperature. After quenching with 20 mL solution of triethylamine/THF (v/v = 1:10), the solvent
was removed under reduced pressure. The resulting orange solid was dissolved in 100 mL THF,
and 0.1 mL of TFA was added. The orange solution was stirred in air at 50 ºC for 24 hr so that
the color changed to deep-red. After removing the solvent under reduced pressure, the resulting
metal-like solid was transferred to a Soxhlet extractor and extracted with acetone for 24 hr to
obtain the product as a deep-red solid. (1.37 g, 84%). 1H NMR (500 MHz, CDCl3, 298 K) δ =
8.96 (s, 2H), 8.09 (s, 2H), 7.60-7.59 (m, 2H), 7.19-7.17 (m, 4H), 3.89 (s, 6H), 1.97-1.67 (m, 4H),
1.20-1.11 (m, 36H), 0.84-0.77 (m, 10H). 13C NMR (125 MHz, CDCl3, 298 K) δ = 168.28,
152.16, 140.41, 138.19, 135.84, 119.83, 118.97, 118.58, 118.24, 114.87, 55.22, 52.41, 40.81,
32.04, 30.52, 29.89, 29.76, 29.62, 29.46, 24.14, 22.82, 14.25. SEC analysis: Mn = 24.0 kg/mol, Ð
= 2.3.
Synthesis of P3. P2 (1.50 g), KOH (2.00 g, 36 mM), THF (40 mL), methanol (20 mL) and
Scheme S3. Synthesis of P3 from P2 via hydrolysis reaction.
Scheme S2. Synthesis of P2 from 2,7-diamino-9,9-dialkylfluorene and DMSS.
H2O (20 mL) were mixed in a 250 mL flask and degassed with N2. The mixture was heated to 80
ºC for 24 hr. After cooling to room temperature, the deep-green solution was transferred to a
beaker in an ice-water bath and acidified drop-wise with 2M HCl. The resulting purple solid was
collected by filtration, and washed with acetone and chloroform (3×10 mL). The product was
obtained as a deep-violet solid after drying. (1.41 g, 98%.) 1H NMR (500 MHz, d8-THF, 298 K)
δ = 9.32 (s, 2H), 8.20 (s, 2H), 7.59-7.57 (m, 2H), 7.28 (s, 2H), 7.14-7.13 (m, 2H), 2.00 (br, 4H),
1.22-1.13 (m, 36H), 0.86-0.79 (m, 10H). 13C NMR (125 MHz, d8-THF, 298 K) δ = 169.12,
151.68, 140.50, 137.97, 135.60, 119.47, 118.44, 118.32, 118.07, 113.72, 54.94, 40.58, 31.88,
29.63, 29.61, 29.43, 29.31, 22.57, 13.50.
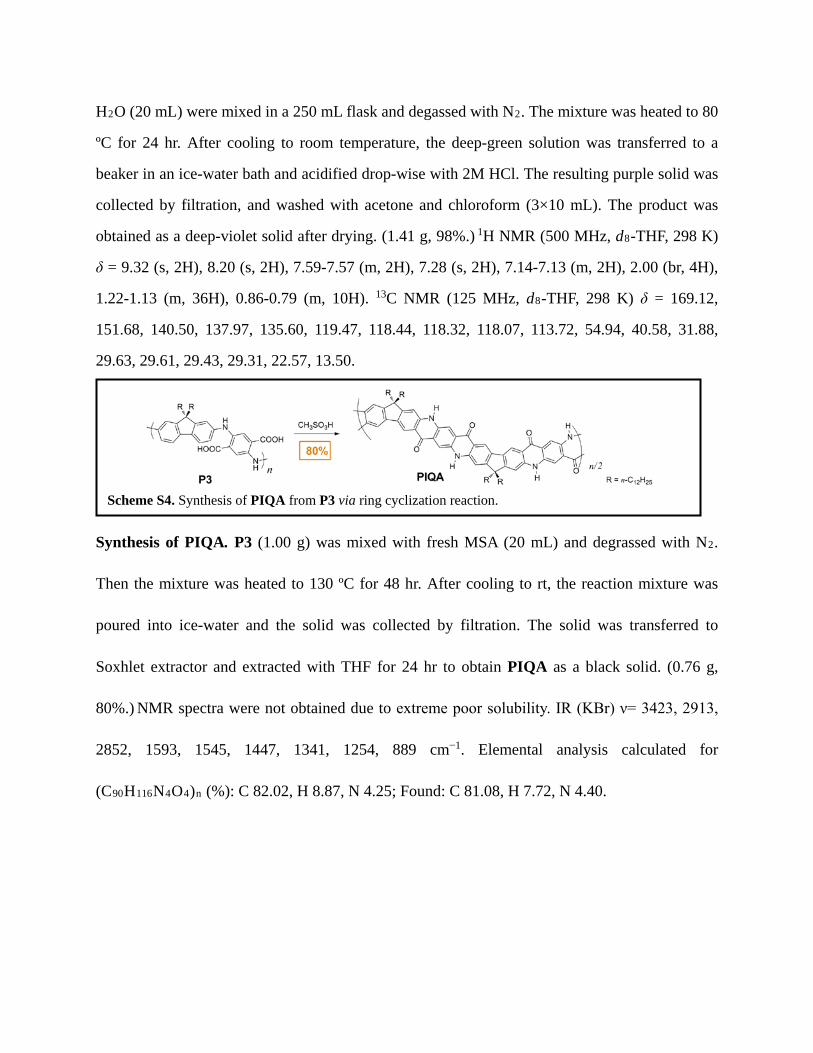
Synthesis of PIQA. P3 (1.00 g) was mixed with fresh MSA (20 mL) and degrassed with N2.
Then the mixture was heated to 130 ºC for 48 hr. After cooling to rt, the reaction mixture was
poured into ice-water and the solid was collected by filtration. The solid was transferred to
Soxhlet extractor and extracted with THF for 24 hr to obtain PIQA as a black solid. (0.76 g,
80%.) NMR spectra were not obtained due to extreme poor solubility. IR (KBr) ν= 3423, 2913,
2852, 1593, 1545, 1447, 1341, 1254, 889 cm−1. Elemental analysis calculated for
(C90H116N4O4)n (%): C 82.02, H 8.87, N 4.25; Found: C 81.08, H 7.72, N 4.40.
Scheme S4. Synthesis of PIQA from P3 via ring cyclization reaction.
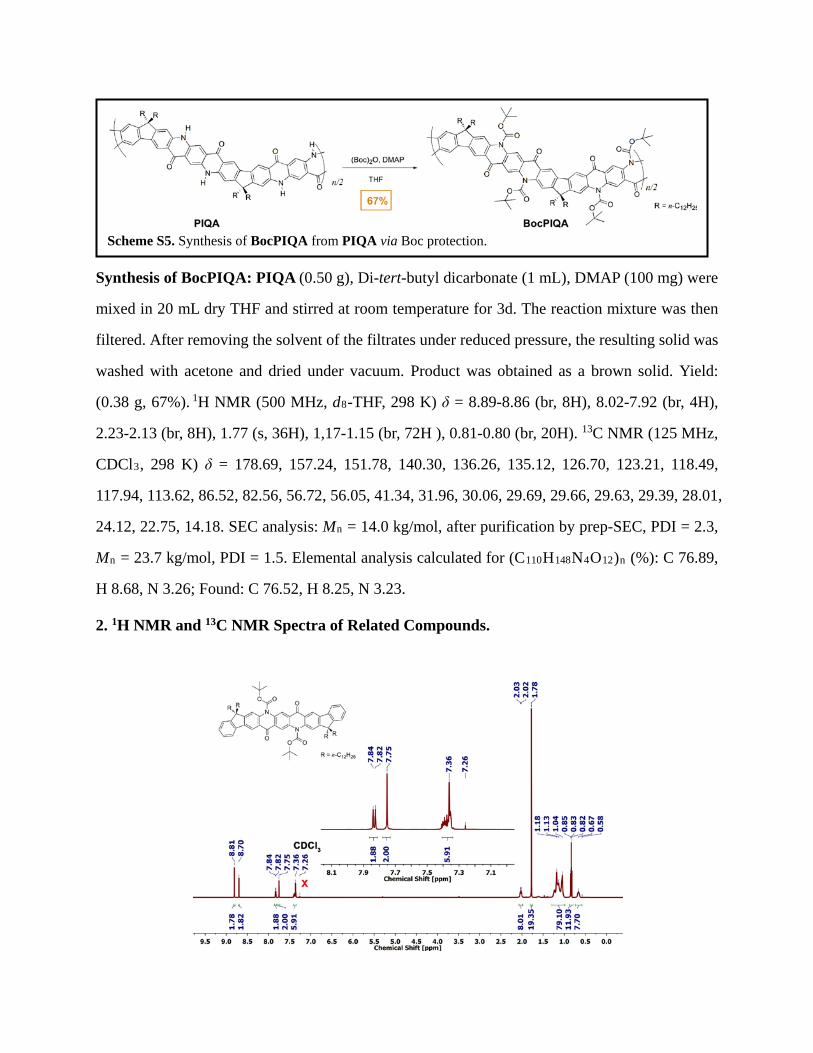
Synthesis of BocPIQA: PIQA (0.50 g), Di-tert-butyl dicarbonate (1 mL), DMAP (100 mg) were
mixed in 20 mL dry THF and stirred at room temperature for 3d. The reaction mixture was then
filtered. After removing the solvent of the filtrates under reduced pressure, the resulting solid was
washed with acetone and dried under vacuum. Product was obtained as a brown solid. Yield:
(0.38 g, 67%). 1H NMR (500 MHz, d8-THF, 298 K) δ = 8.89-8.86 (br, 8H), 8.02-7.92 (br, 4H),
2.23-2.13 (br, 8H), 1.77 (s, 36H), 1,17-1.15 (br, 72H ), 0.81-0.80 (br, 20H). 13C NMR (125 MHz,
CDCl3, 298 K) δ = 178.69, 157.24, 151.78, 140.30, 136.26, 135.12, 126.70, 123.21, 118.49,
117.94, 113.62, 86.52, 82.56, 56.72, 56.05, 41.34, 31.96, 30.06, 29.69, 29.66, 29.63, 29.39, 28.01,
24.12, 22.75, 14.18. SEC analysis: Mn = 14.0 kg/mol, after purification by prep-SEC, PDI = 2.3,
Mn = 23.7 kg/mol, PDI = 1.5. Elemental analysis calculated for (C110H148N4O12)n (%): C 76.89,
H 8.68, N 3.26; Found: C 76.52, H 8.25, N 3.23.
2. 1H NMR and 13C NMR Spectra of Related Compounds.
Scheme S5. Synthesis of BocPIQA from PIQA via Boc protection.
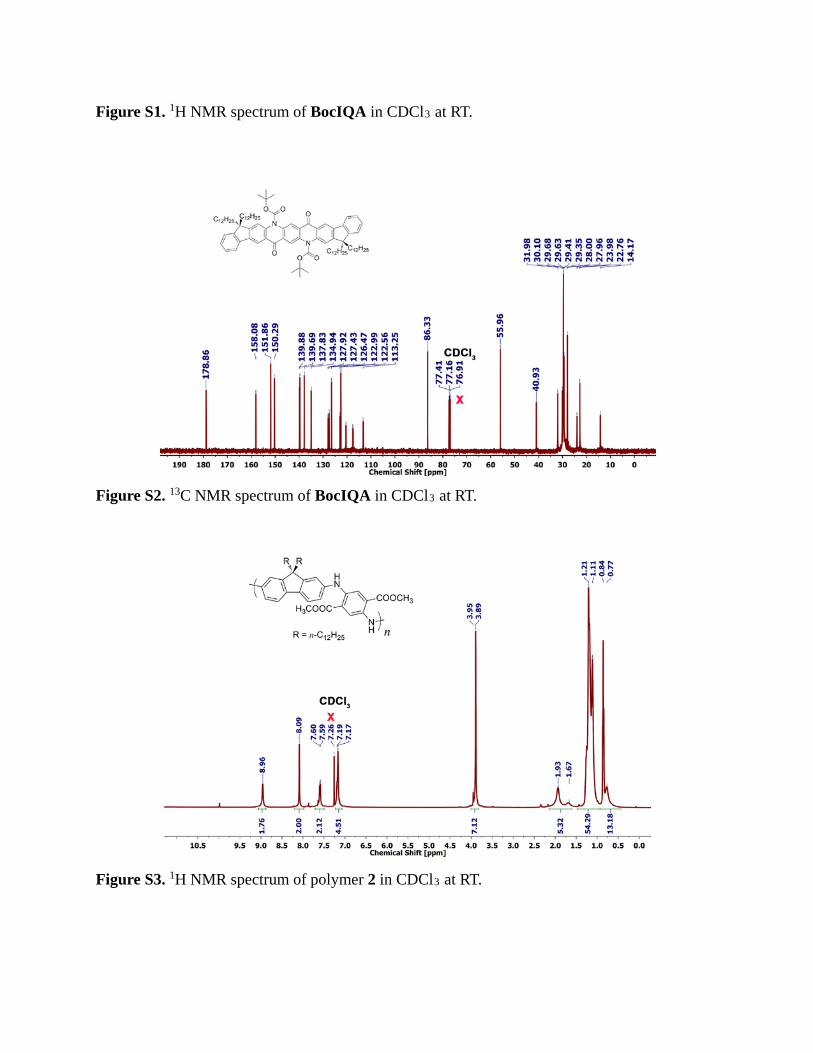
Figure S1. 1H NMR spectrum of BocIQA in CDCl3 at RT.
Figure S2. 13C NMR spectrum of BocIQA in CDCl3 at RT.
Figure S3. 1H NMR spectrum of polymer 2 in CDCl3 at RT.
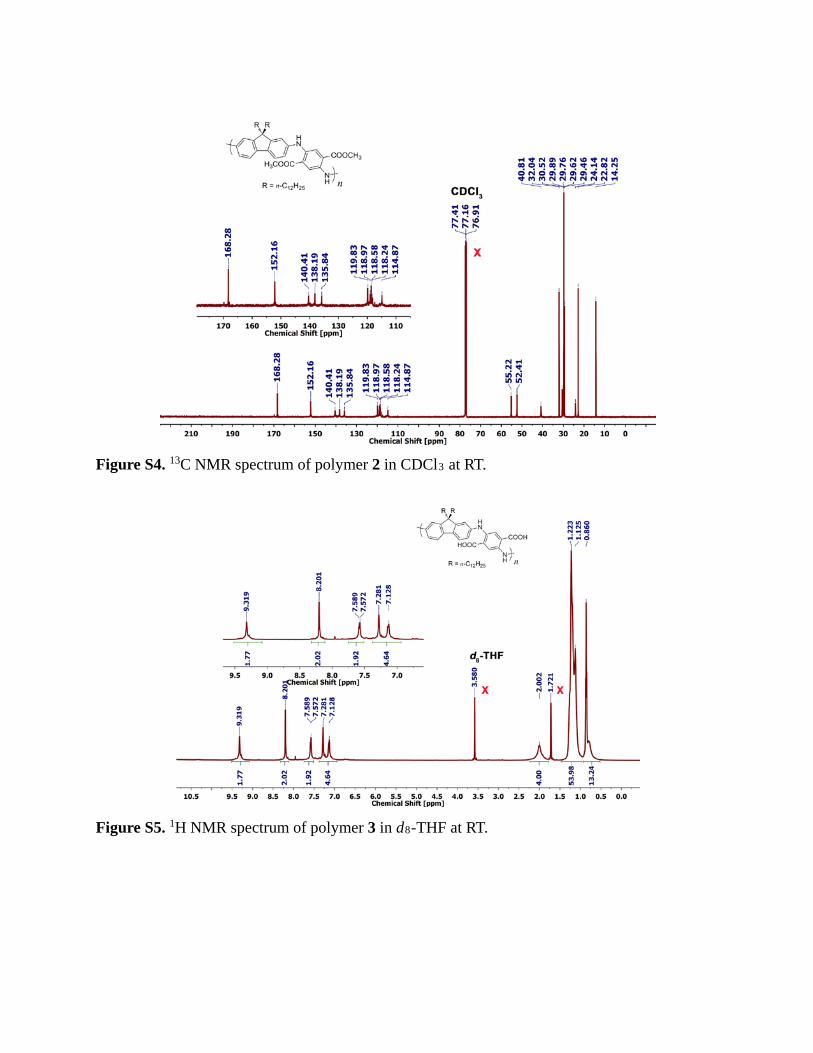
Figure S4. 13C NMR spectrum of polymer 2 in CDCl3 at RT.
Figure S5. 1H NMR spectrum of polymer 3 in d8-THF at RT.
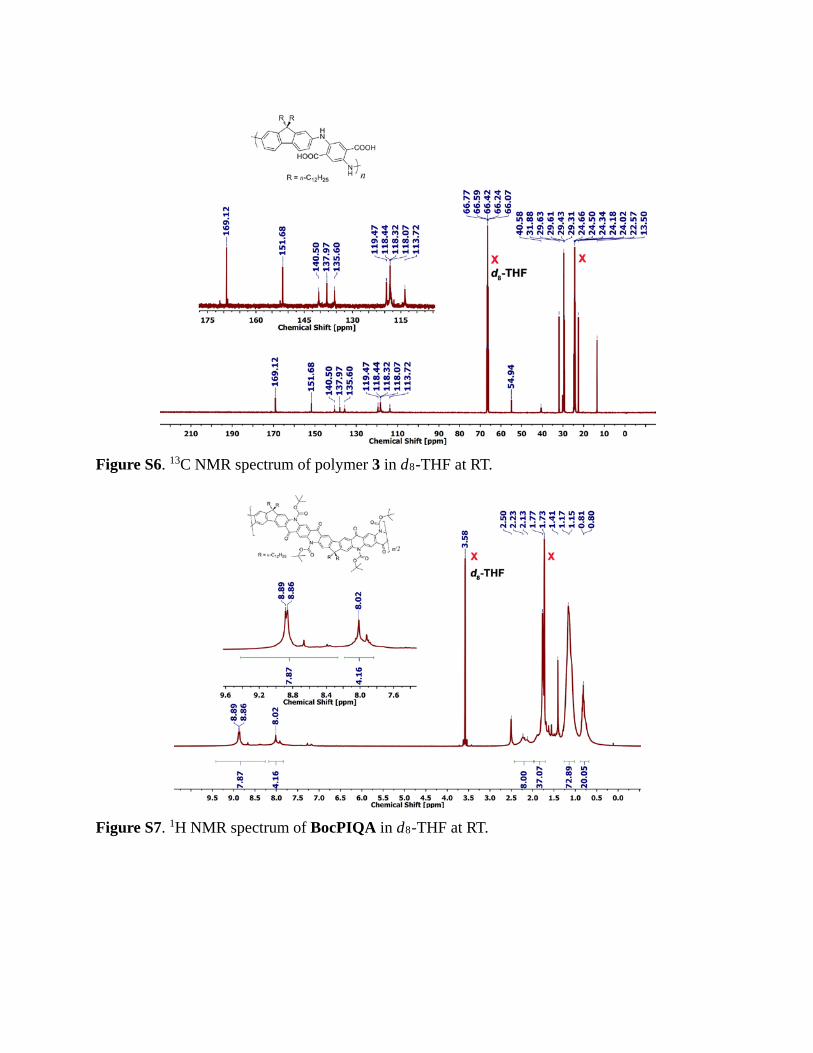
Figure S6. 13C NMR spectrum of polymer 3 in d8-THF at RT.
Figure S7. 1H NMR spectrum of BocPIQA in d8-THF at RT.
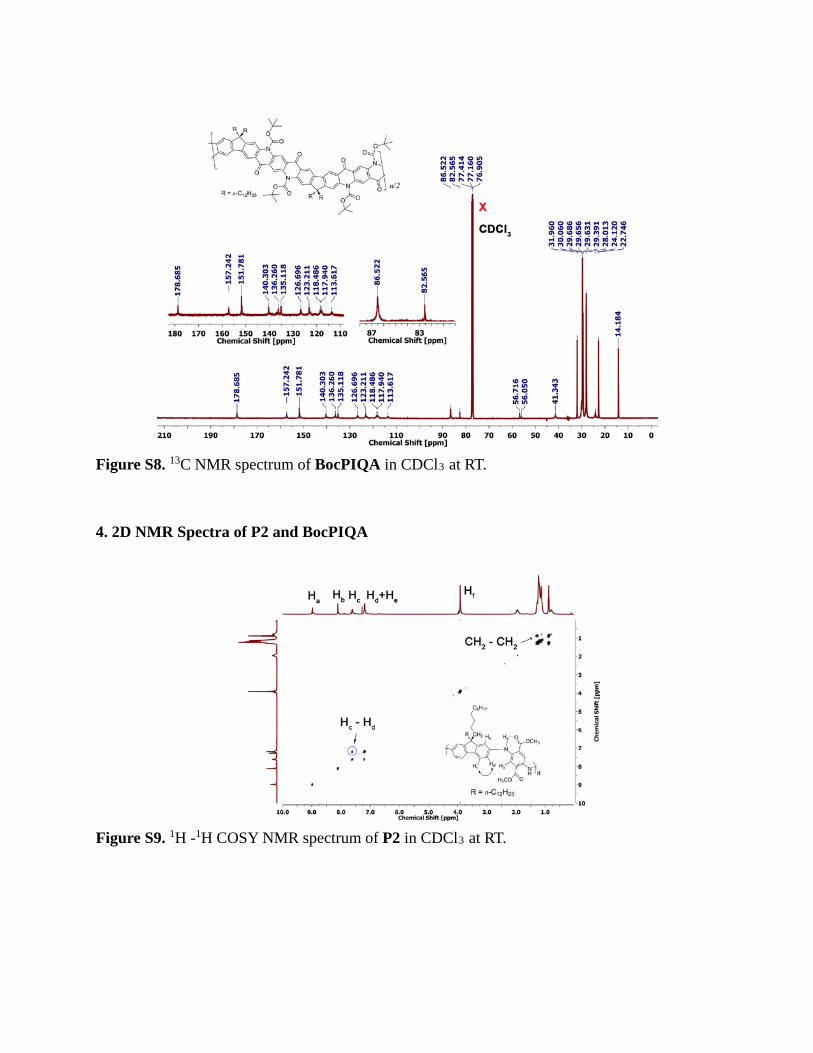
Figure S8. 13C NMR spectrum of BocPIQA in CDCl3 at RT.
4. 2D NMR Spectra of P2 and BocPIQA
Figure S9. 1H -1H COSY NMR spectrum of P2 in CDCl3 at RT.
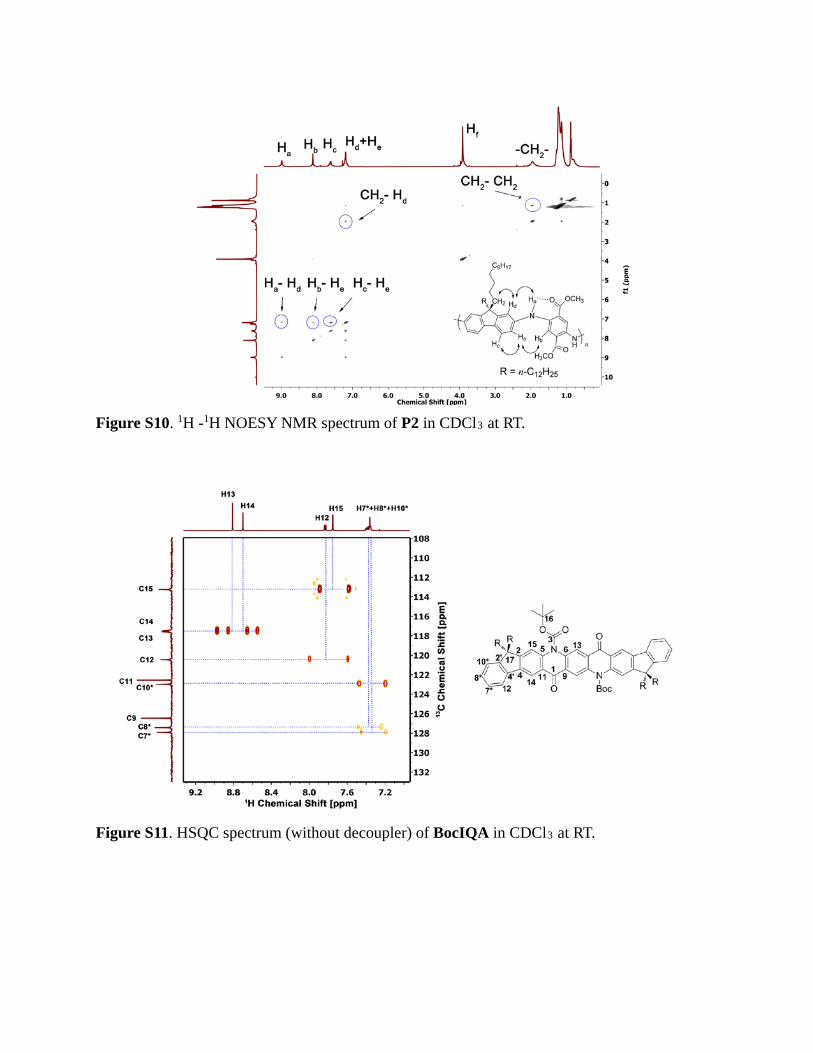
Figure S10. 1H -1H NOESY NMR spectrum of P2 in CDCl3 at RT.
Figure S11. HSQC spectrum (without decoupler) of BocIQA in CDCl3 at RT.

Figure S12. 1H -1H COSY spectrum of BocPIQA in CDCl3 at RT.
5. SEC Chromatograms of P1, P2 and BocPIQA.
Figure S13. SEC curves of a) P1 prepared under different condition, b) P2 and BocPIQA and purified BocPIQA
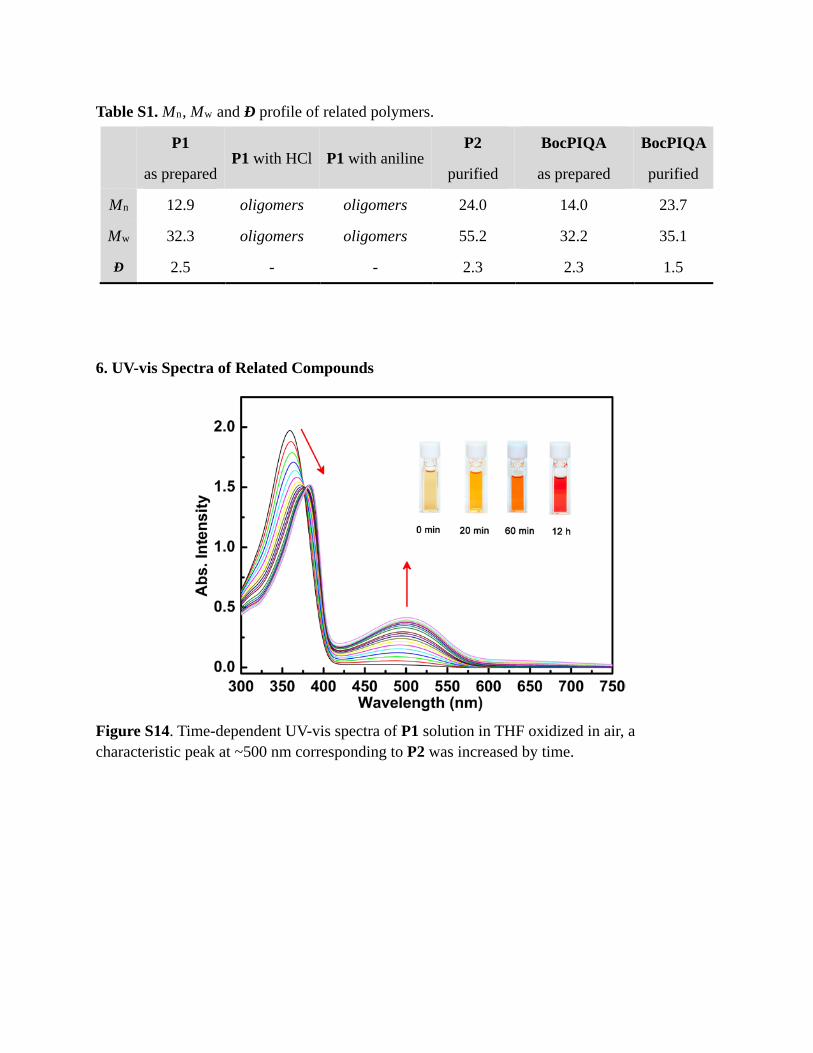
Table S1. Mn, Mw and Ð profile of related polymers.
P1
as preparedP1 with HCl P1 with aniline
P2
purified
BocPIQA
as prepared
BocPIQA
purified
Mn 12.9 oligomers oligomers 24.0 14.0 23.7
Mw 32.3 oligomers oligomers 55.2 32.2 35.1
Ð 2.5 - - 2.3 2.3 1.5
6. UV-vis Spectra of Related Compounds
Figure S14. Time-dependent UV-vis spectra of P1 solution in THF oxidized in air, a characteristic peak at ~500 nm corresponding to P2 was increased by time.
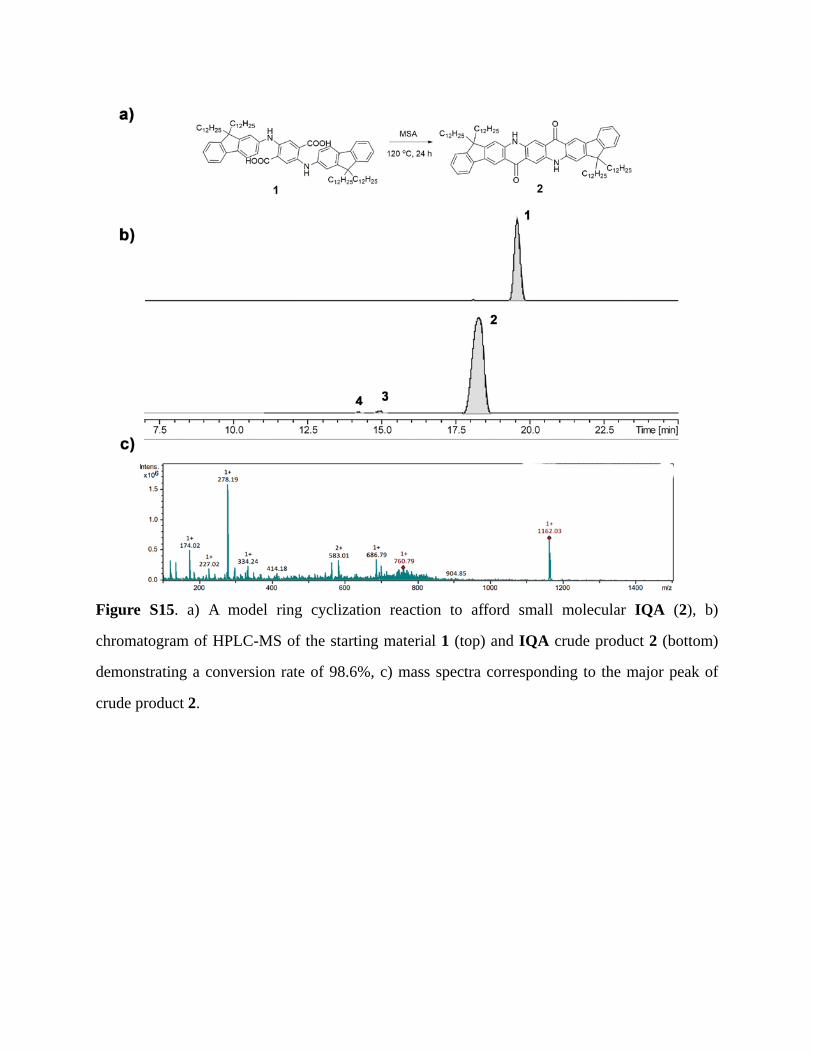
Figure S15. a) A model ring cyclization reaction to afford small molecular IQA (2), b)
chromatogram of HPLC-MS of the starting material 1 (top) and IQA crude product 2 (bottom)
demonstrating a conversion rate of 98.6%, c) mass spectra corresponding to the major peak of
crude product 2.

Figure S16. UV-vis spectra of IQA and PIQA in MSA, PIQA showed characteristic absorption
band compared to IQA, the bathochromic shift indicated the extended conjugation of PIQA.
Figure. S17. UV-vis spectra of IQA-based small molecule and polymers in thin film.

Figure S18. UV-vis spectra of BocPIQA thin film before and after thermal annealing. After
annealing at 200 ºC for 30 min, BocPIQA showed identical absorption spectrum like PIQA,
indicating the Boc groups cleavage
6. Fluorescent Spectra of BocPIQA Before and After Thermal Annealing.
Figure S19. Fluorescent spectra of BocPIQA before and after thermal annealing, fluorescent is
quenched after Boc cleavage by thermal annealing.

7. FT-IR Spectra of P2, P3 and PIQA in Solid-state
Figure S20. FT-IR spectra of P2, P3 and PIQA in solid state. P2 showed identical peaks to its
small molecular analogue, with N-H stretching at 3350 cm-1, C=O stretching at 1690 cm-1 and
C-O stretching at 1200 cm-1. After hydrolysis, C=O stretching of P3 was shifted from 1690 cm-1
to 1660 cm-1.
8. TGA Curves of BocIQA, IQA, PIQA and Their Precursor 2, 3, P2 and P3.
Figure S21. TGA curves of BocIQA, IQA and their precursors 2, 3. Td and carbonization yield

were determined to be 179 ºC (Boc cleavage), 36%, 417 ºC, 43%; 394 ºC, 20% and 237 ºC, 10% for BocIQA, IQA, 2 and 3, respectively.
Figure S22. TGA curves of PIQA and its precursors P2, P3. Td and carbonization yield were determined to be 370 ºC, 53%; 357 ºC, 50% and 325 ºC, 50% for PIQA,P2 and P3, respectively.
Figure S23. DC-conductivity curve of PIQA annealed at different temperatures.

Figure S24. a) Raman spectra of as cast PIQA and PIQA after annealing at 700 °C. b) XPS spectra of PIQA before thermal annealing (top), PIQA after 700 °C annealing (middle), and HOPG (bottom).
9. Electrochemistry Properties of PIQA.
Figure S25. CV curve of BocPIQA film after thermal annealing. BocPIQA was spin-coated on ITO glass and then thermal annealed at 180 ºC for 1 h.. The HOMO, LUMO and energy gap of PIQA were estimated to be 5.21, 2.93 and 2.28 eV, respectively, estimated from its potentials.
10. BocPIQA Film Characterization.
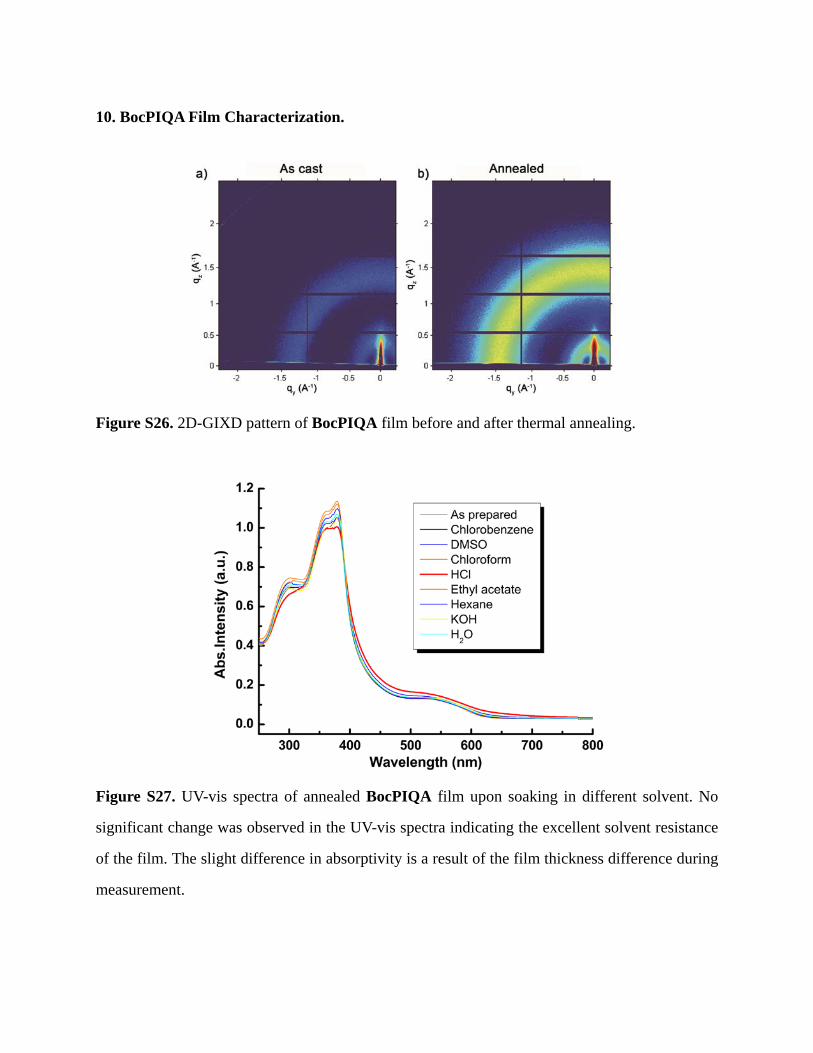
Figure S26. 2D-GIXD pattern of BocPIQA film before and after thermal annealing.
Figure S27. UV-vis spectra of annealed BocPIQA film upon soaking in different solvent. No
significant change was observed in the UV-vis spectra indicating the excellent solvent resistance
of the film. The slight difference in absorptivity is a result of the film thickness difference during
measurement.
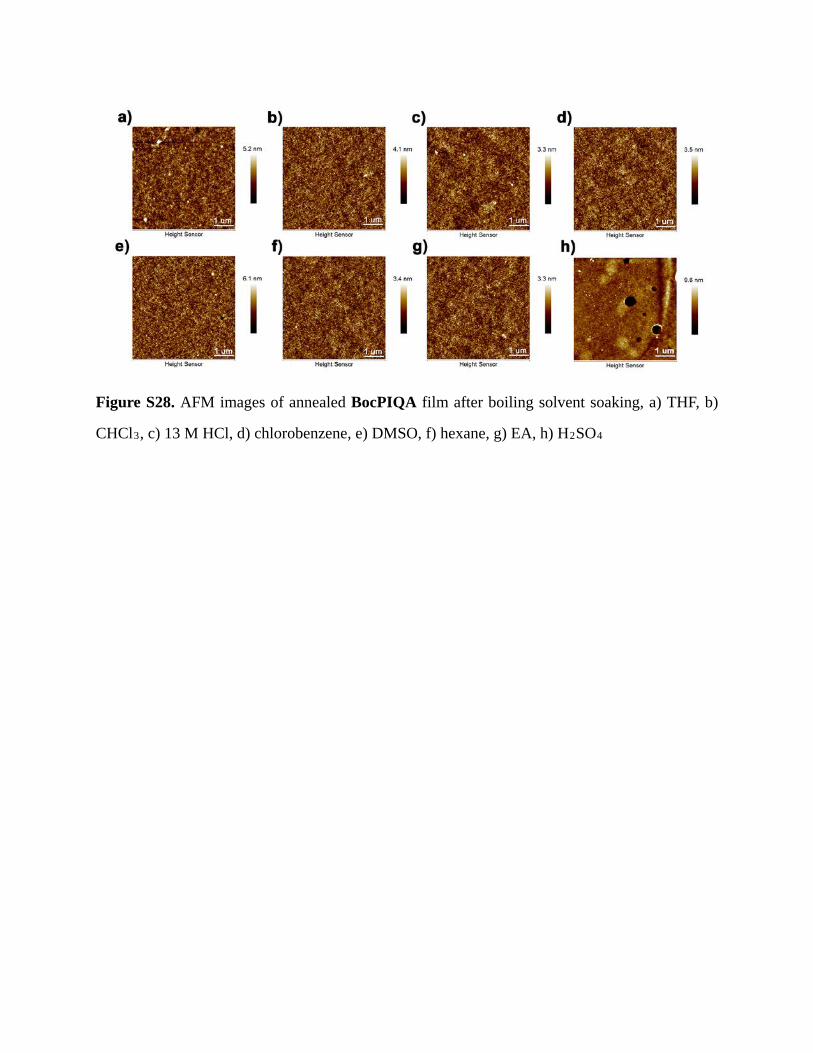
Figure S28. AFM images of annealed BocPIQA film after boiling solvent soaking, a) THF, b)
CHCl3, c) 13 M HCl, d) chlorobenzene, e) DMSO, f) hexane, g) EA, h) H2SO4

Table S2. Thickness and RMS data of annealed BocPIQA film upon soaking in varies solvents.
As
castTHF CHCl3
HCl
(13 M)
Chloro-
benzeneHexane EA H2SO4
Thickness
(nm)
106±
3104±3 106±3 106±3 105±3 104±3 104±3 73±3
RMS (nm) 0.466 0.798 0.593 0.485 0.499 0.500 0.489 1.270
11. References
[1] A. Rostami, C. J. Wei, G. Guérin, M. S. Taylor, Angew. Chem. Int. Ed. 2011, 50, 2059-2062.
[2] Y. Zou, T. Yuan, H. Yao, D. J. Frazier, D. J. Stanton, H.-J. Sue, L. Fang, Org. Lett. 2015, 17, 3146-3149.
[3] J. K. Sørensen, J. Fock, A. H. Pedersen, A. B. Petersen, K. Jennum, K. Bechgaard, K. Kilså, V. Geskin, J. Cornil, T. Bjørnholm, M. B. Nielsen, J. Org. Chem. 2011, 76, 245-263
12. General Method
Materials and Synthesis: Unless otherwise indicated, all starting materials were obtained from
commercial suppliers and were used without further purification. Dimethyl succinyl succinate
(DMSS) was recrystallized from toluene before polymerization. Reaction solvents were purified
by solvent purification system prior to use. 2,7-diamino-9,9-didodecylfluorene[1], compound 2, 3
and IQA [2] were prepared according to the literature. 1H, 13C, 1H - 1H COSY, NOESY, HSQC,
and HMBC NMR spectra were obtained on a Varian Inova 500 MHz spectrometer at rt and
processed by MestReNova 6.1.0. Chemical shifts are reported in ppm relative to the signals
corresponding to the residual non-deuterated solvents (CDCl3: δ 7.26, d8-THF: δ 3.58 for 1H,

and CDCl3: δ 77.16, d8-THF: δ 67.67 for 13C at rt). Size exclusion chromatography (SEC) was
performed on a TOSOH EcoSEC (HLC-8320GPC) chromatography at 40 ºC with THF as the
eluent. The molecular weights were calculated using a calibration curve based on polystyrene
standards. The SEC columns were TSKgel SuperHM-M and TSKgel SuperH-RC.
Thermogravimetric analysis (TGA) was undertaken with a TA Q500 thermogravimetric analyzer.
UV-Vis absorption spectra were recorded using a Shimadzu UV-2600 UV-Vis Spectrophotometer,
while the fluorescent spectra were measured on Horiba Fluoromax-4. FT-IR spectra were
recorded with ZnSe ATR using Shimadzu IRAffinity-1S. Cyclic voltammetry (CV) was carried
out in nitrogen-purged dichloromethane (oxidation scan) at room temperature with a CHI
voltammetric analyzer. n-Bu4PF6 (0.1 M) was used as the supporting electrolyte. The
conventional three-electrode configuration consists of a platinum working electrode, a platinum
wire auxiliary electrode, and an Ag wire pseudoreference electrode with ferrocenium-ferrocene
(Fc+/Fc) as the internal standard. Cyclic voltammograms were obtained at a scan rate of 100 mV
s-1.
13. Thin Film Processing and Characterization Method
Thin Film processing of BocPIQA: BocPIQA solutions in chlorobenzene (2 mg/mL) were
added to Uv-Ozone cleaned silicon wafer. BocPIQA thin films were formed by spin-coating
with the condition of 600 or 1000 rpm for 7s then 2000rpm for 13s. After casting, the films were
thermally annealed at 180 ºC for 0.5 h inside a glovebox to remove to Boc protecting groups.
The morphology of films before and after thermal annealing was examined by optical
microscope and atomic force microscopy. Atomic force microscopy (AFM) images were
recorded with Bruker Dimension S4 Icon AFM in a tapping mode and processed using
NanoScope Analysis. GIXD measurements were carried out on Sector 8-ID-E at the Advanced
Photon Source, Argonne National Laboratory. Beamline 8-ID-E operates at an energy of 7.35
keV and images were collected from a Pilatus 1MF camera (Dectris), with two exposures for
different vertical position of the detector. After flatfield correction for detector nonuniformity, the
images are combined to fill in the gaps for rows at the borders between modules, leaving dark
only the columns of inactive pixels at the center. Using the GIXSGUI package2 for Matlab
(Mathworks), data are corrected for X-ray polarization, detector sensitivity and geometrical
solid-angle. The beam size is 200 μm (h) × 20 μm (v). Sample detector distance is 204 mm.
Sample measurement and thermal annealing were carried out under vacuum which is in the range
of 2~3 × 10⁻⁶ bar, with the sample stage interfaced with a Lakeshore 340 unit.
14. Conductivity measurement of PIQA
The AC electrical conductivity of PIQA powder pellet ( diameter = 12.7mm, thickness = 4mm)
was tested using Novocontrol Broadband Dielectric Spectromete, which was performed at room
temperature (25 °C) over a frequency range of 0.01 Hz to 1 MHz. The DC electrical conductivity
of the material was estimated as equivalent to AC electrical conductivity at lowest frequency of
0.01 Hz.