cheatsheet: a model-driven approach for capacity
TRANSCRIPT
CheatSheet: A Model-Driven Approach for CapacityAllocation in Managed Swarming
Abhigyan SharmaUniversity of Massachusetts Amherst
Antonio A. A. RochaFederal University of Rio de Janeiro, RJ, Brazil
Arun VenkataramaniUniversity of Massachusetts Amherst
ABSTRACTIn this paper, we address the problem of allocating servercapacity across competing swarms in a managed swarmingenvironment. To this end, we make two contributions. First,we develop a detailed measurement-based model to quantifythe relationship between swarm performance and the amountof server bandwidth supplied. Second, we present the de-sign and implementation of CheatSheet, a system to allocateserver capacity to competing swarms so as to maximize theaverage download rate or to achieve a set of target downloadrates while minimizing the total amount of server bandwidthconsumed. The key strength of CheatSheet is its use of themeasurement-based model that enables it to converge to theoptimal allocation in a single round. We evaluate an im-plemented prototype of CheatSheet and show that it signif-icantly improves swarm performance and server bandwidthcost compared to BitTorrent as well as state-of-the-art ap-proaches to control capacity allocation in an online manner.For the max-min metric for download rate among swarms,CheatSheet performs better than the online strategy by 10%and a naive controller strategy by 20%. It also enables band-width savings compared to online controller strategy by asmuch as 50% in some cases.
1. INTRODUCTIONPeer-to-peer swarming systems such as BitTorrent
[10] have witnessed tremendous success and growth overthe last decade. However, although P2P swarming hasbeen widely adopted for disseminating user-generatedor pirated content, P2P strategies have largely beenshunned by large-scale commercial content distributionservices (e.g., Netflix, iTunes etc.). One reason is thatcommercial content distributers fear being associatedwith the piracy “bad rep” of P2P systems. However, amore fundamental reason is that P2P systems do not of-fer predictable performance and are difficult to manage,which makes them unattractive for commercial contentdistribution.
An emerging trend that portends to change this stateof affairs is the emergence of managed swarming [25, 26]for large-scale commercial content distribution. Man-aged swarming seeks to achieve the best of client-server
dissemination and peer-to-peer swarming, namely thepredictable performance and ease of management of theformer and the scalability and bandwidth cost savingsof the latter. To this end, managed swarming seeks toopportunistically leverage P2P bandwidth when avail-able falling back to server bandwidth otherwise. Asserver bandwidth is limited and expensive, a key chal-lenge in large-scale managed swarming is to allocateserver capacity across competing swarms so as to op-timize system-wide performance or bandwidth cost ob-jectives.
In this paper, we present the design and implementa-tion of CheatSheet, a novel “offline control” approach tooptimize capacity allocation in managed swarming. Thekey strength of CheatSheet is a detailed measurement-based model that quantifies the performance or healthof a swarm as a function of the server capacity allocatedto it. Through extensive measurements based on run-ning large-scale BitTorrent swarms, we show that thehealth of a swarm shows a consistent and predictablerelationship to the server bandwidth, peer arrival rate,the distribution of peer upload capacities, and the sizeof the file. Furthermore, we show that this model canbe stored in a concise manner while preserving much ofits accuracy. To our knowledge, our work is the firstto develop a comprehensive predictive model of swarmhealth.
The measurement-based predictive model of swarmhealth enables CheatSheet to easily optimize a variety ofobjectives such as maximizing the minimum downloadrate across swarms, maximizing the average downloadrate across swarms, or minimizing the server bandwidthconsumed in order to achieve specified target downloadrates for all swarms. More importantly, the model en-ables CheatSheet to converge to the optimal allocationin a single round. In contrast, state-of-the-art systemssuch as Antfarm [26] for capacity allocation based on”online control” take several rounds of bandwidth prob-ing and performance feedback in order to converge tothe desired allocation.
We have implemented a fully protocol-compliant pro-totype of CheatSheet based on BitTorrent and instanti-
1
ated with all of the above three objectives. We evaluateCheatSheet through large-scale experiments over Plan-etLab against BitTorrent with static allocation policiesas well as online control strategies. Our results showthat CheatSheet’s offline control approach yields up to20% improvement in swarm performance compared toBitTorrent and can reduce server bandwidth cost by upto 50% compared to an online control strategy.
2. BACKGROUND AND GOALSWe assume that the reader is familiar with peer-to-
peer swarming and BitTorrent [10] in particular. A briefintroduction may be obtained in [18] or the backgroundsections of recent papers on swarming (e.g., [27, 23]).
Managed swarming seeks to get achieve the best ofclient-server file distribution and peer-to-peer swarm-ing, namely, the predictable performance and ease ofmanagement of the former and the bandwidth cost sav-ings of the latter. In addition to a tracker for each fileor bundle, we assume the presence of an always onlineseed (also referred to as the publisher or server). Werefer to users interested in downloading the file simplyas peers and assume that they are not altruistic, i.e.,they leave as soon as they complete their download.
The primary goal of managed swarming is to oppor-tunistically leverage peer-to-peer bandwidth when pos-sible and fall back to the publisher’s bandwidth oth-erwise. Server capacity in practice is limited and in-curs a higher cost with higher usage, so a large con-tent publisher may wish to opportunistically leveragepeer-to-peer bandwidth for one of two broad classes ofobjectives. The first is to allocate the total amount ofavailable server capacity across all active swarms so asto maximize the overall performance. The second isto achieve a specified target performance level for allswarms while minimizing the server bandwidth usage.We consider both classes of objectives in this paper.
The server capacity allocation problem would be straight-forward if the capacity contributed by peer-to-peer swarm-ing were relatively insensitive to the server bandwidthavailable. Ideally, the aggregate bandwidth would sim-ply be aggregate upload capacities of peers concurrentlydownloading the file plus the bandwidth supplied bythe server. Indeed, this is a common assumption madeby textbook presentations of peer-to-peer systems [18]or simplistic theoretical models of BitTorrent perfor-mance that incorporate a constant inefficiency factorassociated with the utilization of peer-to-peer capacity[28]. Although such simplistic models are well suitedfor pedagogical purposes or for deriving theoreticallytractable performance models, they do not adequatelycapture the dependence of swarming efficiency on theserver bandwidth.
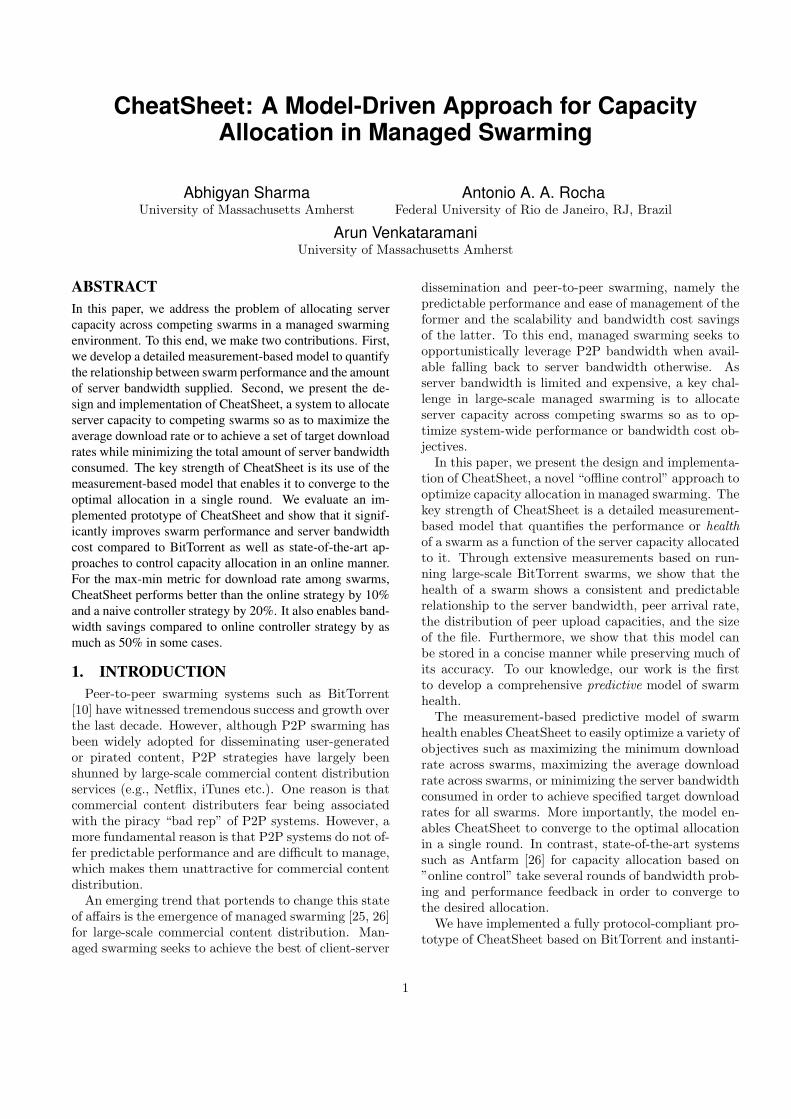
To appreciate this claim, consider Figure 1 resultsof a set of experiment conducted by running a swarm
using real BitTorrent clients on PlanetLab. Peers arriveinto the swarm at the rate of one every 12.5 secondseach with an upload capacity of 200 KBps. Each pointshows the average download rate experienced by peersas a function of the corresponding publisher bandwidth.We defer further details of the experimental setup toSection 3.2.1.
0
20
40
60
80
100
120
140
160
180
200
220
0 20 40 60 80 100 120 140 160 180 200
Avg
. D
ow
nlo
ad
Ra
te (
KB
ps)
Publisher Upload Bandwidth (KBps)
λ=1/12.5
Figure 1: Average peer download rate as a func-tion of the publisher bandwidth.
Figure 1 clearly shows that swarming efficiency isquite sensitive to the publisher bandwidth. For exam-ple, increasing the publisher bandwidth from 20KBpsto 60KBps improves the average download experiencedby peers from 40KBps to 120KBps. The average num-ber of peers in the swarm at any given point is TBDin the first case and TBD in the second case. Thus,increasing the server bandwidth by just 20KBps has in-creased swarming efficiency by almost 4×. If the serverbandwidth is further increased, we notice that peersexperience increased download rates, but diminishingmarginal returns. For instance, increasing the publisherbandwidth from 140KBps to 180Kbps improves the av-erage download by less than 20KBps. This is becausethe block diversity in the swarm increases as a func-tion of the server bandwidth, favoring the saturation ofthe peers downlinks and uplinks, which in turn favors aslower growth of the average download rate of the peers.
Thus, in order to address the server capacity alloca-tion problem, it is important to first quantify the im-pact of server capacity on the efficiency of peer-to-peerswarming.
3. A MEASUREMENT-BASED MODEL OFSWARMING EFFICIENCY
In this section, we formally introduce the problemof modeling swarming efficiency, explain why the prob-lem is analytically challenging, and present an empiricalmeasurement-based model of swarming efficiency.
3.1 Problem statement
2
Our goal is to quantify the performance of a swarmas a function of the publisher bandwidth and other rele-vant swarm parameters. Consider a swarm distributinga file of size S to peers arriving at a rate λ. Let x de-note the bandwidth supplied by the publisher and µ theaverage peer upload capacity. Unless otherwise stated,we assume that the download capacity of peers is unlim-ited. Let y denote the average download rate of peers inthe swarm. The model seeks to quantify y as a functionof x, µ, λ and S as follows.
y
µ= f(x, µ̃, λ, S) (1)
We refer to the left hand side above, i.e., the averagedownload rate normalized by the average peer uploadcapacity, as the health of a swarm. The normalizationallows us to compare swarms with very different char-acteristics against a common performance metric. Weuse µ̃ to denote the distribution of peer upload capaci-ties. Note that a swarm with uniform upload capacitiesmay behave differently compared to one with a skewedcapacity distribution (as is observed in practice) despiteboth having the same mean.
It is straightforward to intuit some aspects of thenature of f(.). For example, increasing the publisherbandwidth (keeping all else fixed) always improves thehealth of the swarm. Intuitively, at very low values ofx, the publisher bandwidth becomes a bottleneck andprevents potential opportunities for block exchanges be-tween peers, thereby hurting the swarm performance y.Increasing x increases y both by improving the utiliza-tion of peer upload capacity as well as simply by provid-ing more bandwidth as in a client-server system. Thus,f(.) must be monotonically increasing in x.
Similarly, it can be argued that a higher arrival rateimplies a healthier (unhealthier) swarm in the regimex � µ (x � µ). When x � µ, a very low arrival rateeffectively reduces the swarm to a client/server system,so y is limited by and equal to x. Increasing the arrivalrate increases opportunities for peer-to-peer exchangesand improves y. On the other hand, when x � µ, asignificant fraction of the swarm’s performance comesfrom the publisher as opposed to peer-to-peer interac-tions, so increasing the arrival rate reduces the down-load rate (despite the improved utilization of peer up-load capacity) as there are more peers competing for thepublisher’s bandwidth. Thus, f(.) increases (decreases)with λ when x � µ (x � µ).
However, some aspects of f(.) are not intuitive andeven run counter to intuition. For example, increasingthe peer upload capacity µ can in some scenarios hurtthe download rate y (and by consequence the healthy/µ as well). A higher peer upload capacity nominallyenables existing peers to complete the download and de-
part quicker, but the resulting swarm consists of fewerpeers and is less efficient in utilizing peer-to-peer ex-change opportunities. The increased peer upload ca-pacity is more than outweighed by the loss of efficiencyin utilizing that capacity. Similarly, it is nontrivial tointuit the effect of increasing arrival rate or increasingfile size except in the extreme cases (x � µ or x � µ)outlined in the previous paragraph.
Analytical models.If it were easy to analytically derive the relationship
posed in equation (4), that would be sufficient for ourmodeling goals. However, deriving this relationship isnontrivial. In the appendix, we present a strawmananalytical model that simplistically assumes that thehealth of a swarm is determined by the average numberof peers in the swarm (as alluded to by prior work [26]).However, such models fail to capture even the concavenature of the health curve shown in Figure 1.
Our position is that developing a deeper theoreticalunderstanding of a swarm’s health requires as a firststep a careful, empirical characterization of how the ef-fectiveness of peer-to-peer exchanges depends on vari-ous swarm parameters. So, in the rest of this paper, wefocus on developing a measurement-based model that isaccurate enough to enable us to control a broad rangeof swarms encountered in practice.
3.2 Measurement-based modelIn this section, we present a measurement-based model
to predict the health of the swarm. A naive approach tothis end would be to “measure” the relationship posedin Equation (4) for all foreseeable values of the fourunderlying dimensions (x, µ̃, λ, S). In contrast, the keystrength of our model is that it is concise, i.e., a smallnumber of measurements suffice to predict the healthfor a broad range of unmeasured scenarios. Further-more, the measurements shed light on which aspects ofthe four dimensions are most critical to predicting thehealth, thereby improving our understanding of swarmbehavior and the ability to control it.
We develop the measurement-based model by pre-senting a sequence of claims supported by experimentalevidence as follows. We begin by describing the exper-imental setup.
3.2.1 Experimental setupWe used our experimental setups for measurements
on the PlanetLab and a local cluster. The design of theexperimental setup was identical for both experiments.Each node in an experimental setup was installed witha BitTorrent client. Two nodes were setup as the seederand the tracker respectively. The seeder distributed afile of size S The upload capacity of the seeder node wasfixed at a limit x KBps. Each experiment simulated a
3
peer arrival at rate λ by starting a new BitTorrent clientto join the swarm once every 1/λ seconds. The uploadcapacity of the peers was fixed according to a distribu-tion. We let the swarm evolve until the arrival of at least200 peers after which we terminate the experiment. Wemeasure the download rates of the peers which finishdownload and the average value of the download rate ismeasured for the experiment.
In this manner, we collect data for a range of values ofλ and by varying the seeder bandwidth x = 1/10×µ tox = µ. We keep the values of S and µ fixed throughout.We collected data based on 5 runs of experiment foreach tuple(x, µ, λ, S) on PlanetLab and a local cluster.On the local cluster, we chose the values of S = 20 MB,µ = 200KBps a range of λ values from λ = 1/3.125 toλ = 1/100. On PlanetLab, we chose the values of S =10 MB, µ = 100KBps a range of λ values from λ = 1/2to λ = 1/100.
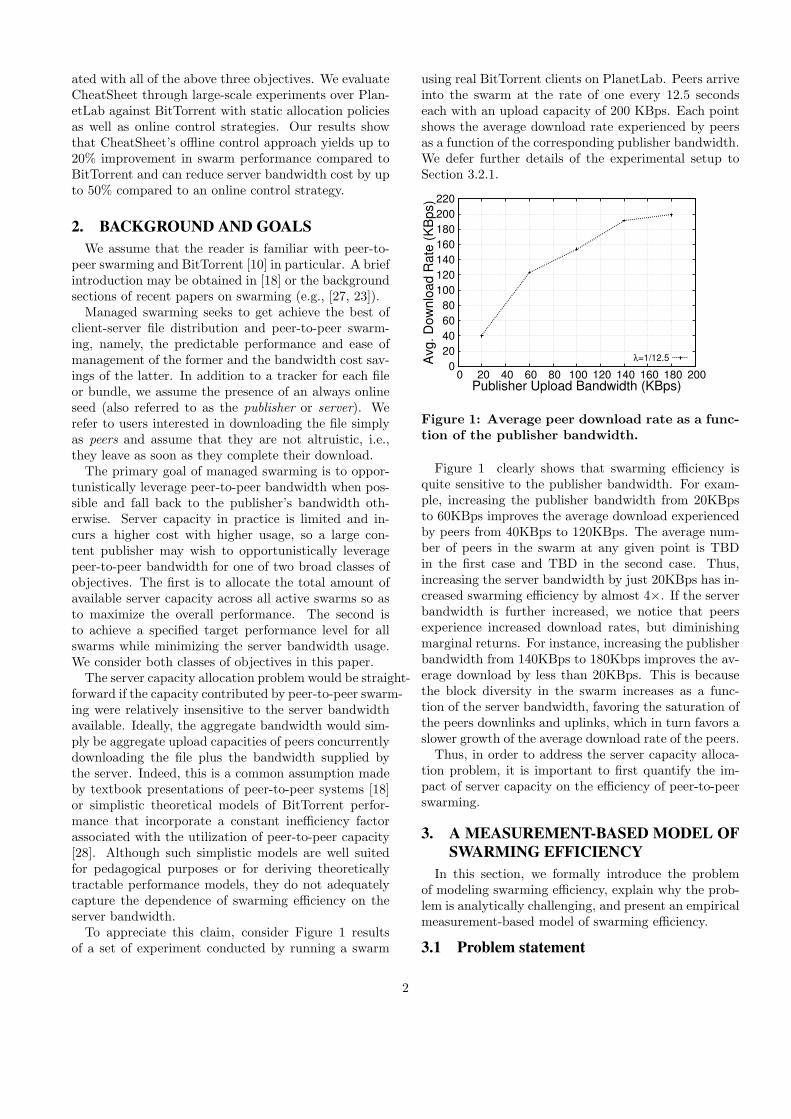
3.2.2 Dependence on x, µ, and λ
claim 1. f(.) depends on x, µ and λ.
0 10 20 30 40 50 60 70 80 90
100
0 10 20 30 40 50 60 70 80 90 100Avg.
Dow
nloa
d Ra
te (K
Bps)
Publisher Upload Bandwidth (KBps)
λ=1/5λ=1/7.14
λ=1/10λ=1/25
λ=1/100
Figure 2: Dependence on x, µ, λ.
Figure 2 shows experimental evidence to support theabove claim. Each line plots the average peer down-load rate as a function of the publisher capacity anddifferent lines correspond to different arrival rates. Al-though some points buck the trend, the lines generallyshow an increasing and concave behavior. Each pointin the figure represents the average of five runs, i.e., theaverage download rate across all peers averaged overfive runs. The deviant points are an artifact of ficklePlanetLab nodes that impact some experiments andskew the average. For example, consider the erraticallylow value at x = 70KBps and y = 55Kbps on the lineλ = 1/25s. The average download rates correspondingto the five runs are (40, 70, 75, 73, 77) with each valuebeing the average of the download rates of roughly 200peers. The first run is clearly an outlier and is causedby the seeder, which was hosted at a PlanetLab node,
being constrained in bandwidth due to other slices atthe same node.
0
20
40
60
80
100
120
140
160
180
200
220
0 20 40 60 80 100 120 140 160 180 200 220
Avg
. D
ow
nlo
ad R
ate
(K
Bp
s)
Publisher Upload Bandwidth (KBps)
λ=1/6.25
λ=1/8
λ=1/12.5
λ=1/25
λ=1/50
λ=1/100
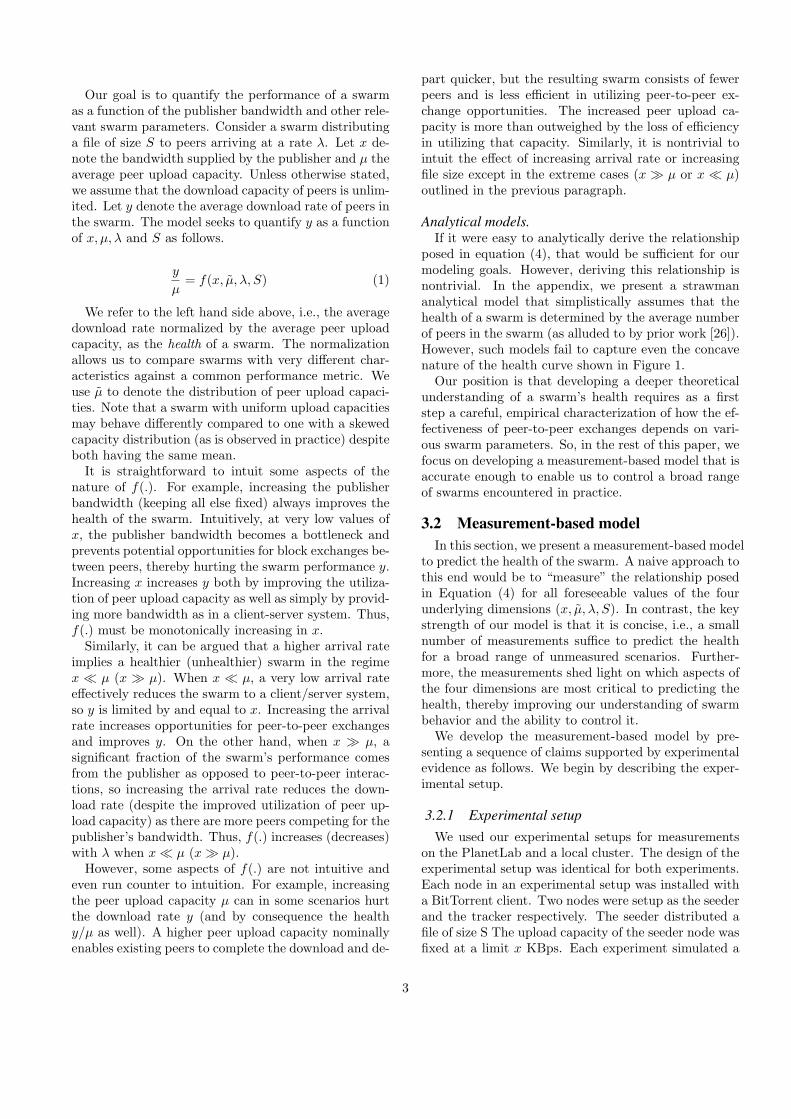
Figure 3: Dependence on x, µ, λ. Cluster withuniform peer upload capacities.
Figure 3 shows a similar experiment conducted overthe local cluster and with peer upload capacities uni-formly set to 200KBps. As before, each point is aver-aged over five runs. As expected, the increasing andconcave trend is more clearly delineable in this case asthe peer upload capacities are uniform and the clustermachines show more predictable behavior. We returnto the impact of variance in peer upload capacities afteranalyzing the impact of file size below.
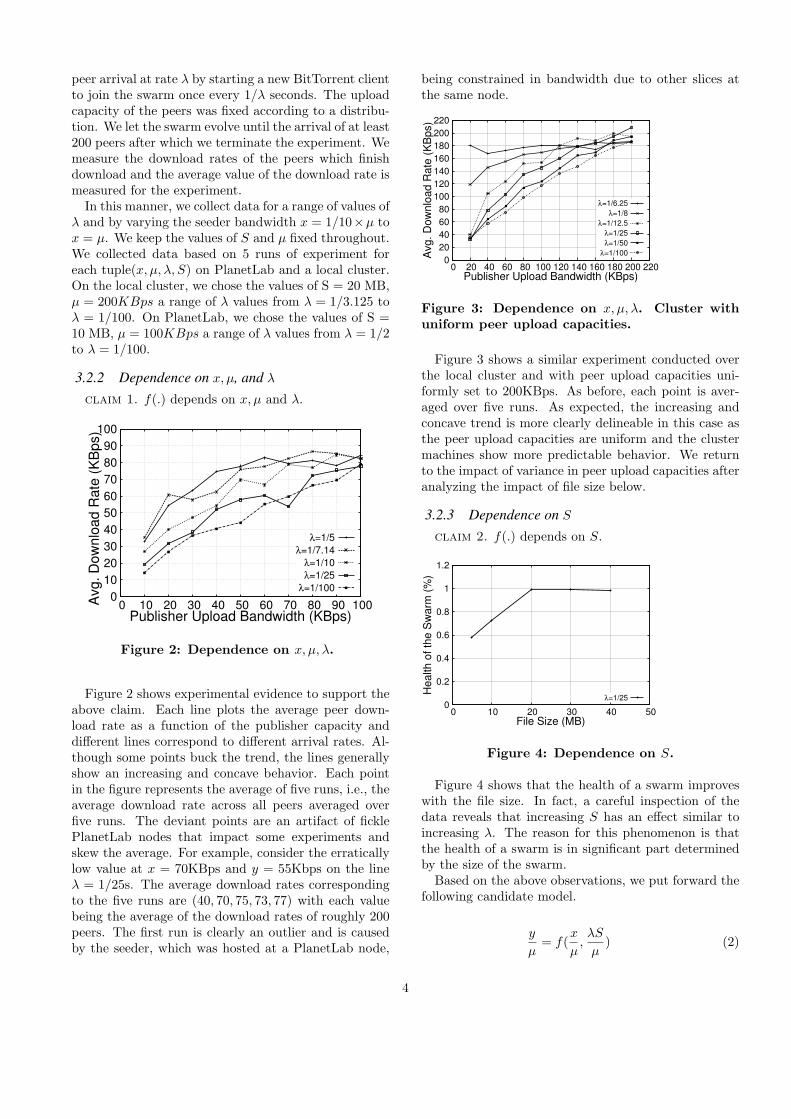
3.2.3 Dependence on S
claim 2. f(.) depends on S.
0
0.2
0.4
0.6
0.8
1
1.2
0 10 20 30 40 50
He
alth o
f th
e S
wa
rm (
%)
File Size (MB)
λ=1/25
Figure 4: Dependence on S.
Figure 4 shows that the health of a swarm improveswith the file size. In fact, a careful inspection of thedata reveals that increasing S has an effect similar toincreasing λ. The reason for this phenomenon is thatthe health of a swarm is in significant part determinedby the size of the swarm.
Based on the above observations, we put forward thefollowing candidate model.
y
µ= f(
x
µ,λS
µ) (2)
4
The thesis underlying the above model is that f(.)does not depend on all possible combinations of (x, µ, λ, S),but only on two normalized quantities: the publisherbandwidth ratio x/µ, and the healthy swarm coverageλS/µ. The health of the swarm monotonically increaseswith x/µ and at x = µ, the swarm is about as efficientas it gets. Note that even at x = µ, y is less than µ (referFigures 2 and 3). This is partly because of the proto-col overhead (e.g., exchanging bitmaps, block requests,TCP inefficiencies etc.) and partly because peers some-times do not possess useful blocks to exchange leadingto underutilization of available capacity.
The health of the swarm increases with λS/µ in theregime x < µ. Note that λS/µ would be the averagenumber of peers in the swarm if it were perfectly effi-cient. The claim follows from Little’s law assuming thatS/µ is the average amount of time peers spend in theswarm. Hence, we refer to this quantity as the healthyswarm coverage. The actual average number of peers inthe swarm on the other hand would be λS/y and is notuseful for predicting y as it is determined by y itself.
In the regime x > µ (not shown in the above figures),the health of the swarm decreases as λS/µ increases.This is because at x > µ, the swarming efficiency isalready maximal. Increasing x further only serves toreduce the average number of peers in the system, whichin turn makes the swarm less healthy.
Unfortunately, although the model described by equa-tion (2) is simple, it turns out to be inaccurate for tworeasons. First, the model uses only the mean µ ignor-ing the effect of the underlying distribution. Second,the model ignores the impact of the size of the file, i.e.,it assumes that the health is determined only by thehealthy swarm coverage λS/µ for large and small filesalike. We discuss the impact of these two parametersnext.
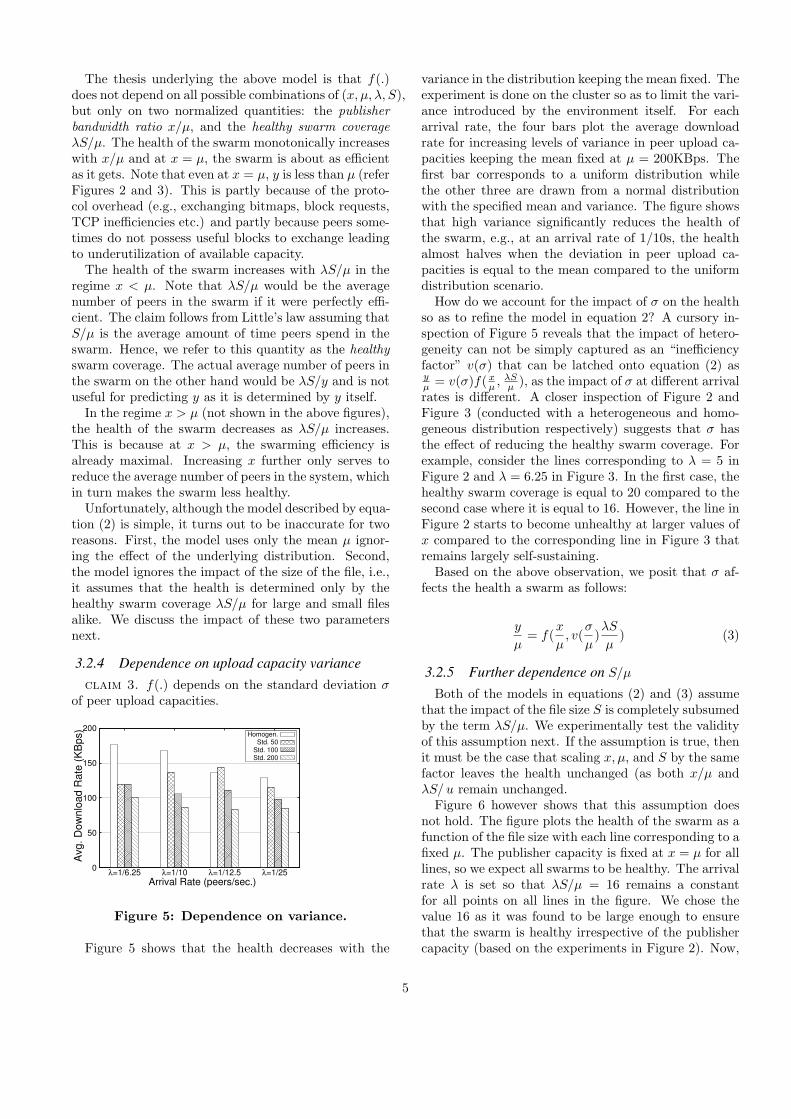
3.2.4 Dependence on upload capacity varianceclaim 3. f(.) depends on the standard deviation σ
of peer upload capacities.
0
50
100
150
200
λ=1/6.25 λ=1/10 λ=1/12.5 λ=1/25
Avg.
Dow
nloa
d Ra
te (K
Bps)
Arrival Rate (peers/sec.)
Homogen.Std. 50
Std. 100Std. 200
Figure 5: Dependence on variance.
Figure 5 shows that the health decreases with the
variance in the distribution keeping the mean fixed. Theexperiment is done on the cluster so as to limit the vari-ance introduced by the environment itself. For eacharrival rate, the four bars plot the average downloadrate for increasing levels of variance in peer upload ca-pacities keeping the mean fixed at µ = 200KBps. Thefirst bar corresponds to a uniform distribution whilethe other three are drawn from a normal distributionwith the specified mean and variance. The figure showsthat high variance significantly reduces the health ofthe swarm, e.g., at an arrival rate of 1/10s, the healthalmost halves when the deviation in peer upload ca-pacities is equal to the mean compared to the uniformdistribution scenario.
How do we account for the impact of σ on the healthso as to refine the model in equation 2? A cursory in-spection of Figure 5 reveals that the impact of hetero-geneity can not be simply captured as an “inefficiencyfactor” v(σ) that can be latched onto equation (2) asyµ = v(σ)f( x
µ , λSµ ), as the impact of σ at different arrival
rates is different. A closer inspection of Figure 2 andFigure 3 (conducted with a heterogeneous and homo-geneous distribution respectively) suggests that σ hasthe effect of reducing the healthy swarm coverage. Forexample, consider the lines corresponding to λ = 5 inFigure 2 and λ = 6.25 in Figure 3. In the first case, thehealthy swarm coverage is equal to 20 compared to thesecond case where it is equal to 16. However, the line inFigure 2 starts to become unhealthy at larger values ofx compared to the corresponding line in Figure 3 thatremains largely self-sustaining.
Based on the above observation, we posit that σ af-fects the health a swarm as follows:
y
µ= f(
x
µ, v(
σ
µ)λS
µ) (3)
3.2.5 Further dependence on S/µ
Both of the models in equations (2) and (3) assumethat the impact of the file size S is completely subsumedby the term λS/µ. We experimentally test the validityof this assumption next. If the assumption is true, thenit must be the case that scaling x, µ, and S by the samefactor leaves the health unchanged (as both x/µ andλS/u remain unchanged.
Figure 6 however shows that this assumption doesnot hold. The figure plots the health of the swarm as afunction of the file size with each line corresponding to afixed µ. The publisher capacity is fixed at x = µ for alllines, so we expect all swarms to be healthy. The arrivalrate λ is set so that λS/µ = 16 remains a constantfor all points on all lines in the figure. We chose thevalue 16 as it was found to be large enough to ensurethat the swarm is healthy irrespective of the publishercapacity (based on the experiments in Figure 2). Now,
5
0
0.2
0.4
0.6
0.8
1
1.2
0 20 40 60 80 100
He
lth
of
the
Sw
arm
(y/µ
)
File Size (MB)
50 KBps
100 KBps
200 KBps
400 KBps
800 KBps
S/µ=50
S/µ=25
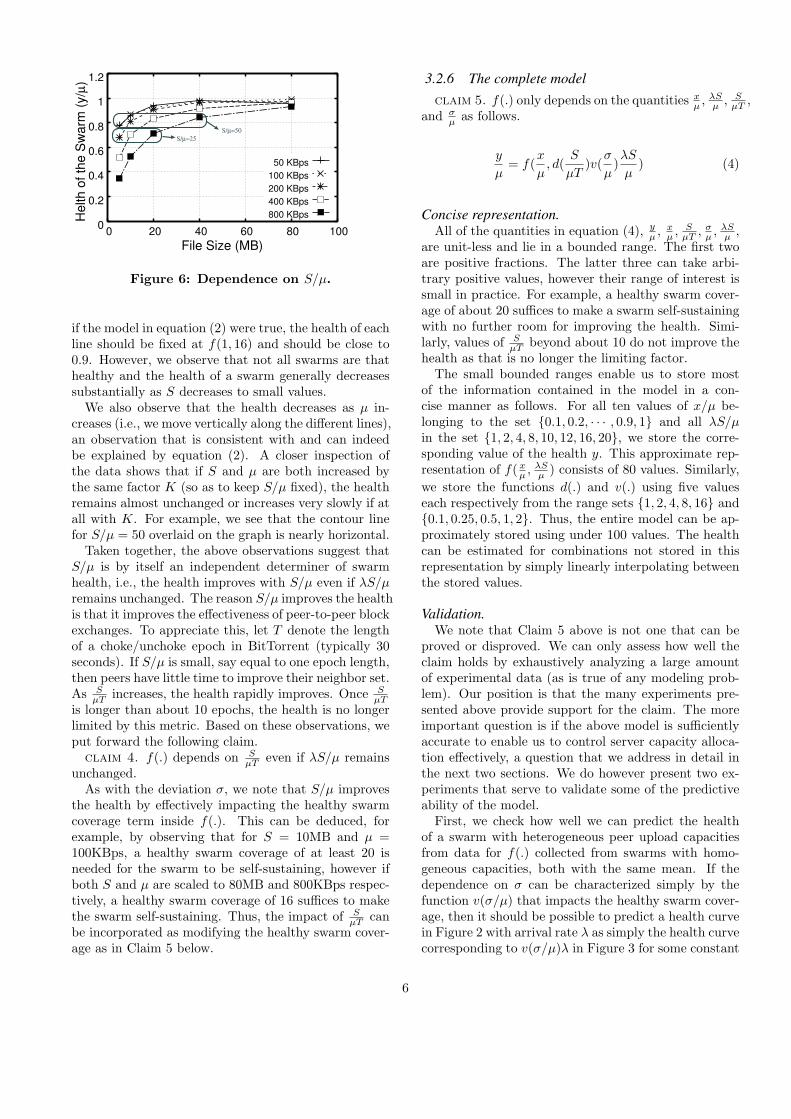
Figure 6: Dependence on S/µ.
if the model in equation (2) were true, the health of eachline should be fixed at f(1, 16) and should be close to0.9. However, we observe that not all swarms are thathealthy and the health of a swarm generally decreasessubstantially as S decreases to small values.
We also observe that the health decreases as µ in-creases (i.e., we move vertically along the different lines),an observation that is consistent with and can indeedbe explained by equation (2). A closer inspection ofthe data shows that if S and µ are both increased bythe same factor K (so as to keep S/µ fixed), the healthremains almost unchanged or increases very slowly if atall with K. For example, we see that the contour linefor S/µ = 50 overlaid on the graph is nearly horizontal.
Taken together, the above observations suggest thatS/µ is by itself an independent determiner of swarmhealth, i.e., the health improves with S/µ even if λS/µremains unchanged. The reason S/µ improves the healthis that it improves the effectiveness of peer-to-peer blockexchanges. To appreciate this, let T denote the lengthof a choke/unchoke epoch in BitTorrent (typically 30seconds). If S/µ is small, say equal to one epoch length,then peers have little time to improve their neighbor set.As S
µT increases, the health rapidly improves. Once SµT
is longer than about 10 epochs, the health is no longerlimited by this metric. Based on these observations, weput forward the following claim.
claim 4. f(.) depends on SµT even if λS/µ remains
unchanged.As with the deviation σ, we note that S/µ improves
the health by effectively impacting the healthy swarmcoverage term inside f(.). This can be deduced, forexample, by observing that for S = 10MB and µ =100KBps, a healthy swarm coverage of at least 20 isneeded for the swarm to be self-sustaining, however ifboth S and µ are scaled to 80MB and 800KBps respec-tively, a healthy swarm coverage of 16 suffices to makethe swarm self-sustaining. Thus, the impact of S
µT canbe incorporated as modifying the healthy swarm cover-age as in Claim 5 below.
3.2.6 The complete modelclaim 5. f(.) only depends on the quantities x
µ , λSµ , S
µT ,and σ
µ as follows.
y
µ= f(
x
µ, d(
S
µT)v(
σ
µ)λS
µ) (4)
Concise representation.All of the quantities in equation (4), y
µ , xµ , S
µT , σµ , λS
µ ,are unit-less and lie in a bounded range. The first twoare positive fractions. The latter three can take arbi-trary positive values, however their range of interest issmall in practice. For example, a healthy swarm cover-age of about 20 suffices to make a swarm self-sustainingwith no further room for improving the health. Simi-larly, values of S
µT beyond about 10 do not improve thehealth as that is no longer the limiting factor.
The small bounded ranges enable us to store mostof the information contained in the model in a con-cise manner as follows. For all ten values of x/µ be-longing to the set {0.1, 0.2, · · · , 0.9, 1} and all λS/µin the set {1, 2, 4, 8, 10, 12, 16, 20}, we store the corre-sponding value of the health y. This approximate rep-resentation of f( x
µ , λSµ ) consists of 80 values. Similarly,
we store the functions d(.) and v(.) using five valueseach respectively from the range sets {1, 2, 4, 8, 16} and{0.1, 0.25, 0.5, 1, 2}. Thus, the entire model can be ap-proximately stored using under 100 values. The healthcan be estimated for combinations not stored in thisrepresentation by simply linearly interpolating betweenthe stored values.
Validation.We note that Claim 5 above is not one that can be
proved or disproved. We can only assess how well theclaim holds by exhaustively analyzing a large amountof experimental data (as is true of any modeling prob-lem). Our position is that the many experiments pre-sented above provide support for the claim. The moreimportant question is if the above model is sufficientlyaccurate to enable us to control server capacity alloca-tion effectively, a question that we address in detail inthe next two sections. We do however present two ex-periments that serve to validate some of the predictiveability of the model.
First, we check how well we can predict the healthof a swarm with heterogeneous peer upload capacitiesfrom data for f(.) collected from swarms with homo-geneous capacities, both with the same mean. If thedependence on σ can be characterized simply by thefunction v(σ/µ) that impacts the healthy swarm cover-age, then it should be possible to predict a health curvein Figure 2 with arrival rate λ as simply the health curvecorresponding to v(σ/µ)λ in Figure 3 for some constant
6
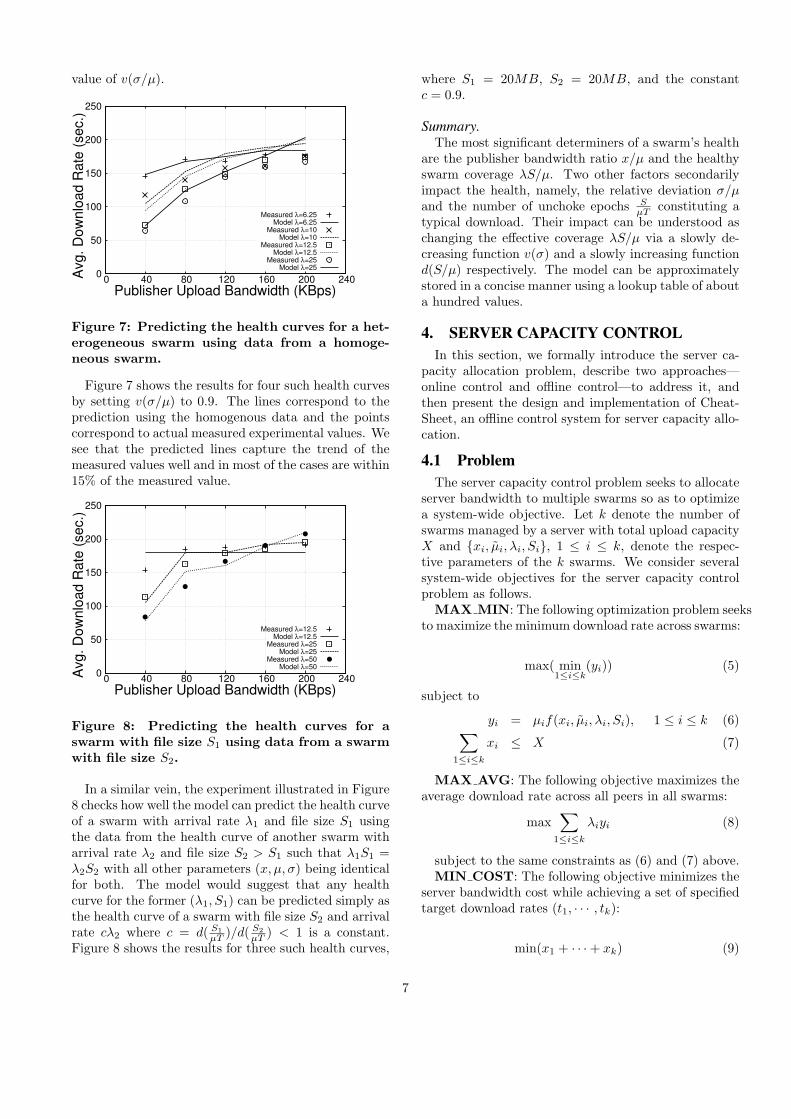
value of v(σ/µ).
0
50
100
150
200
250
0 40 80 120 160 200 240Avg.
Dow
nloa
d Ra
te (s
ec.)
Publisher Upload Bandwidth (KBps)
Measured λ=6.25Model λ=6.25
Measured λ=10Model λ=10
Measured λ=12.5Model λ=12.5
Measured λ=25Model λ=25
Figure 7: Predicting the health curves for a het-erogeneous swarm using data from a homoge-neous swarm.
Figure 7 shows the results for four such health curvesby setting v(σ/µ) to 0.9. The lines correspond to theprediction using the homogenous data and the pointscorrespond to actual measured experimental values. Wesee that the predicted lines capture the trend of themeasured values well and in most of the cases are within15% of the measured value.
0
50
100
150
200
250
0 40 80 120 160 200 240Avg.
Dow
nloa
d Ra
te (s
ec.)
Publisher Upload Bandwidth (KBps)
Measured λ=12.5Model λ=12.5
Measured λ=25Model λ=25
Measured λ=50Model λ=50
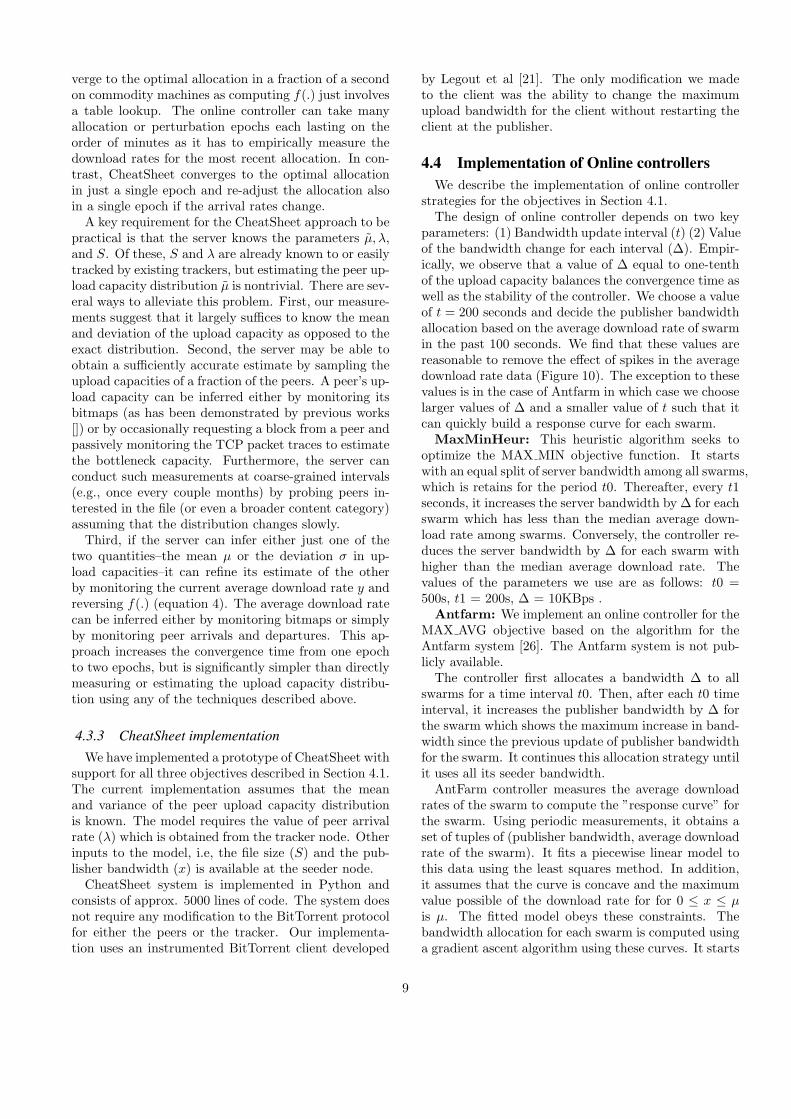
Figure 8: Predicting the health curves for aswarm with file size S1 using data from a swarmwith file size S2.
In a similar vein, the experiment illustrated in Figure8 checks how well the model can predict the health curveof a swarm with arrival rate λ1 and file size S1 usingthe data from the health curve of another swarm witharrival rate λ2 and file size S2 > S1 such that λ1S1 =λ2S2 with all other parameters (x, µ, σ) being identicalfor both. The model would suggest that any healthcurve for the former (λ1, S1) can be predicted simply asthe health curve of a swarm with file size S2 and arrivalrate cλ2 where c = d( S1
µT )/d( S2µT ) < 1 is a constant.
Figure 8 shows the results for three such health curves,
where S1 = 20MB, S2 = 20MB, and the constantc = 0.9.
Summary.The most significant determiners of a swarm’s health
are the publisher bandwidth ratio x/µ and the healthyswarm coverage λS/µ. Two other factors secondarilyimpact the health, namely, the relative deviation σ/µand the number of unchoke epochs S
µT constituting atypical download. Their impact can be understood aschanging the effective coverage λS/µ via a slowly de-creasing function v(σ) and a slowly increasing functiond(S/µ) respectively. The model can be approximatelystored in a concise manner using a lookup table of abouta hundred values.
4. SERVER CAPACITY CONTROLIn this section, we formally introduce the server ca-
pacity allocation problem, describe two approaches—online control and offline control—to address it, andthen present the design and implementation of Cheat-Sheet, an offline control system for server capacity allo-cation.
4.1 ProblemThe server capacity control problem seeks to allocate
server bandwidth to multiple swarms so as to optimizea system-wide objective. Let k denote the number ofswarms managed by a server with total upload capacityX and {xi, µ̃i, λi, Si}, 1 ≤ i ≤ k, denote the respec-tive parameters of the k swarms. We consider severalsystem-wide objectives for the server capacity controlproblem as follows.
MAX MIN: The following optimization problem seeksto maximize the minimum download rate across swarms:
max( min1≤i≤k
(yi)) (5)
subject to
yi = µif(xi, µ̃i, λi, Si), 1 ≤ i ≤ k (6)∑1≤i≤k
xi ≤ X (7)
MAX AVG: The following objective maximizes theaverage download rate across all peers in all swarms:
max∑
1≤i≤k
λiyi (8)
subject to the same constraints as (6) and (7) above.MIN COST: The following objective minimizes the
server bandwidth cost while achieving a set of specifiedtarget download rates (t1, · · · , tk):
min(x1 + · · ·+ xk) (9)
7

subject to
ti = µif(xi, µ̃i, λi, Si), 1 ≤ i ≤ k (10)
4.2 Solution (on paper)Solving any of the above optimization problems re-
quires knowledge of f(.). Furthermore, if f(.) is knownto satisfy certain monotonicity and/or concavity prop-erties, the optimal solution can be efficiently computedusing a simple greedy search strategy as described be-low. Below, we use the notation f−1(y, µ, λ, S) to de-note x such that f(x, µ̃, λ, S) = y, and f
′(xi, µ̃i, λi, Si)
to denote the derivative with respect to x.If f(.) monotonically increases with x, MAX MIN can
be solved as follows. (1) Start with y = ∆ for a small∆; (2) Set xi = f−1(y, µ̃i, λi, Si), 1 ≤ i ≤ k; (3) If(∑
i xi < X), increment y to y + ∆ and goto (2). Itis straightforward to speed up the linear search usingbinary search.
If f(.) is smooth and concave in x, MAX AVG canbe solved using a simple gradient ascent strategy thatresults in a unique solution. We start with x1 = x2 =· · · = ∆ for a small ∆ and allocate the next ∆ unitsof capacity (equally) to the swarm(s) with the largestvalue(s) of λif
′(xi, µ̃i, λi, Si), proceeding until all X
units of capacity have been allocated. If f(.) is piece-wise linear and concave, the same strategy still works,but the resulting solution may not be unique.
If f(.) is invertible, then MIN COST can be solved bysetting xi = f−1(ti, µ, λ, S) if the resulting
∑i xi < X,
otherwise the target allocation is not feasible.
4.3 CheatSheet design and implementationThe formal description above skirts several important
practical design and implementation issues. Most im-portantly, we have assumed above that f(.) is known apriori, but must be estimated in practice. There are twodistinct design options available to address this prob-lem: the online approach and the offline approach.
4.3.1 Online controlThe online approach begins with no a priori knowl-
edge of f(.) (except for assumptions about its mono-tonicity and concavity) and estimates it in situ. For ex-ample, in order to optimize the MAX AVG objective,the server capacity controller can implement the gradi-ent ascent strategy described above by allocating ∆ toeach swarm in the beginning, monitoring the resultingdownload rates and the corresponding gradients, andallocating the next ∆ to the swarm(s) with the largestgradient. Once all server capacity has been allocated,the controller must periodically perturb the allocationsto all swarms by a small amount and, based upon theoutcome, re-adjust the allocations. Antfarm [26] is anexample of a system based upon the online approach(but for an objective different from MAX AVG as de-
scribed in [26]).The periodic perturbations are required in the online
approach for two reasons. The first is to gather addi-tional data points so as to refine the estimate of f(.).The second is to account for changes to the arrival ratesof swarms, completion of swarms, and the initiation ofnew swarms. If the resulting gradients upon the pertur-bation are unequal by more than a threshold, the con-troller must move some capacity from swarm(s) withthe smallest gradient to those with the largest gradient.Note that the online strategy does not need to knoweven µi and Si for each swarm i, but simply the currentvalue of (xi, yi) and the gradient λiy
′
i at that point.However, the online control approach suffers from
several key shortcomings. First, estimating f(.) basedon online measurements is noisy and error-prone. There-fore, a large number of measurements are needed inorder to fit a smooth or piecewise linear function tothe measured scatterplot. Second, the estimated modelneeds to be updated if the peer arrival rate changesor a new swarm begins. As we show in the measure-ments in Section 3, f(.) for different arrival rates canbe dramatically different. Estimating the new f(.) andascending or descending its gradient incurs additionallatency. Note that the convergence time of the gradientascent strategy is limited by choice of the perturbation∆ in each step. Too large a ∆ may be prone to perennialoscillations while two small a ∆ can excessively inflatethe convergence time and indeed fail to converge ever ifthe arrival rate changes often.
Third, and most importantly, an online control sys-tem is more complex to engineer for a broad range of ob-jectives. The gradient ascent strategy is not applicableto the other two objectives MAX MIN and MIN COST,each of which requires a different kind of controller. Forexample, MIN COST is better suited to an additive-increase multiplicative-decrease (AIMD) or MIMD basedstrategy to achieve the target download rates while min-imizing cost. Each of these controllers further need todeal with measurement error and swarm dynamics, andcarefully balance the dual concerns of convergence timeand stability.
4.3.2 Offline controlCheatSheet employs an offline control approach that
circumvents the problems with online control describedabove. The offline control approach knows f(.) a pri-ori as obtained from the measurement-based model de-scribed in the previous section. Although the model isnot analytical, it can be stored concisely as a “cheatsheet” containing just over a hundred values and suf-fices to predict the download rate for a broad range ofswarms (x, µ̃, λ, S) encountered in practice.
CheatSheet’s offline computation is extremely effi-cient. All of the greedy strategies described above con-
8
verge to the optimal allocation in a fraction of a secondon commodity machines as computing f(.) just involvesa table lookup. The online controller can take manyallocation or perturbation epochs each lasting on theorder of minutes as it has to empirically measure thedownload rates for the most recent allocation. In con-trast, CheatSheet converges to the optimal allocationin just a single epoch and re-adjust the allocation alsoin a single epoch if the arrival rates change.
A key requirement for the CheatSheet approach to bepractical is that the server knows the parameters µ̃, λ,and S. Of these, S and λ are already known to or easilytracked by existing trackers, but estimating the peer up-load capacity distribution µ̃ is nontrivial. There are sev-eral ways to alleviate this problem. First, our measure-ments suggest that it largely suffices to know the meanand deviation of the upload capacity as opposed to theexact distribution. Second, the server may be able toobtain a sufficiently accurate estimate by sampling theupload capacities of a fraction of the peers. A peer’s up-load capacity can be inferred either by monitoring itsbitmaps (as has been demonstrated by previous works[]) or by occasionally requesting a block from a peer andpassively monitoring the TCP packet traces to estimatethe bottleneck capacity. Furthermore, the server canconduct such measurements at coarse-grained intervals(e.g., once every couple months) by probing peers in-terested in the file (or even a broader content category)assuming that the distribution changes slowly.
Third, if the server can infer either just one of thetwo quantities–the mean µ or the deviation σ in up-load capacities–it can refine its estimate of the otherby monitoring the current average download rate y andreversing f(.) (equation 4). The average download ratecan be inferred either by monitoring bitmaps or simplyby monitoring peer arrivals and departures. This ap-proach increases the convergence time from one epochto two epochs, but is significantly simpler than directlymeasuring or estimating the upload capacity distribu-tion using any of the techniques described above.
4.3.3 CheatSheet implementationWe have implemented a prototype of CheatSheet with
support for all three objectives described in Section 4.1.The current implementation assumes that the meanand variance of the peer upload capacity distributionis known. The model requires the value of peer arrivalrate (λ) which is obtained from the tracker node. Otherinputs to the model, i.e, the file size (S) and the pub-lisher bandwidth (x) is available at the seeder node.
CheatSheet system is implemented in Python andconsists of approx. 5000 lines of code. The system doesnot require any modification to the BitTorrent protocolfor either the peers or the tracker. Our implementa-tion uses an instrumented BitTorrent client developed
by Legout et al [21]. The only modification we madeto the client was the ability to change the maximumupload bandwidth for the client without restarting theclient at the publisher.
4.4 Implementation of Online controllersWe describe the implementation of online controller
strategies for the objectives in Section 4.1.The design of online controller depends on two key
parameters: (1) Bandwidth update interval (t) (2) Valueof the bandwidth change for each interval (∆). Empir-ically, we observe that a value of ∆ equal to one-tenthof the upload capacity balances the convergence time aswell as the stability of the controller. We choose a valueof t = 200 seconds and decide the publisher bandwidthallocation based on the average download rate of swarmin the past 100 seconds. We find that these values arereasonable to remove the effect of spikes in the averagedownload rate data (Figure 10). The exception to thesevalues is in the case of Antfarm in which case we chooselarger values of ∆ and a smaller value of t such that itcan quickly build a response curve for each swarm.
MaxMinHeur: This heuristic algorithm seeks tooptimize the MAX MIN objective function. It startswith an equal split of server bandwidth among all swarms,which is retains for the period t0. Thereafter, every t1seconds, it increases the server bandwidth by ∆ for eachswarm which has less than the median average down-load rate among swarms. Conversely, the controller re-duces the server bandwidth by ∆ for each swarm withhigher than the median average download rate. Thevalues of the parameters we use are as follows: t0 =500s, t1 = 200s, ∆ = 10KBps .
Antfarm: We implement an online controller for theMAX AVG objective based on the algorithm for theAntfarm system [26]. The Antfarm system is not pub-licly available.
The controller first allocates a bandwidth ∆ to allswarms for a time interval t0. Then, after each t0 timeinterval, it increases the publisher bandwidth by ∆ forthe swarm which shows the maximum increase in band-width since the previous update of publisher bandwidthfor the swarm. It continues this allocation strategy untilit uses all its seeder bandwidth.
AntFarm controller measures the average downloadrates of the swarm to compute the ”response curve” forthe swarm. Using periodic measurements, it obtains aset of tuples of (publisher bandwidth, average downloadrate of the swarm). It fits a piecewise linear model tothis data using the least squares method. In addition,it assumes that the curve is concave and the maximumvalue possible of the download rate for for 0 ≤ x ≤ µis µ. The fitted model obeys these constraints. Thebandwidth allocation for each swarm is computed usinga gradient ascent algorithm using these curves. It starts
9
with a minimum bandwidth of δ to each swarm andthen allocates one additional unit to the swarm whichhas the maximum value of λ times the current slope ofthe curve.
Further, the publisher bandwidth is periodically per-turbed by δ to get more data points for the responsecurve. The algorithms first perturbs the publisher band-width in a time interval t1 and recomputes the responsecurve and a bandwidth allocation for each swarm in thenext time intervals t1. It alternates between the twothereby constantly updating the response curve basedon new measured data points.
The value of the parameters for this controller are:t0 = 100s, ∆ = 20 KBps, t1 = 200s, δ = 10 KBps.
AIAD: This online controller aims to optimize theMIN COST objective while keeping the download ratehigher than the target download rate. AIAD controllerstarts with an initial bandwidth x0 = µ to keep abovethe target download rate. Clearly, this is based on theassumption that the target download rate is less thanthe peer upload capacity. The controller assigns a band-width x0 for time interval t0. From now on, it runsthe AIAD algorithm. If the current download rate ofthe swarm is more than the target download rate, it de-creases the publisher bandwidth by ∆ and vice versa. Itupdates the publisher bandwidth once every t1 seconds.The values of the parameters we use are as follows: t0= 500s, t1 = 200s, ∆ = 10KBps .
5. EVALUATION
5.1 Experimental setupWe used PlanetLab as our testbed and selected 250
nodes for our experiments. Each PlanetLab node wasinstalled with an instrumented BitTorrent client. Twoservers running at our university acted as the seeder andthe tracker respectively. We placed a limit on the totalupload capacity at the seeder. The controller algorithmrunning at the seeder determined the bandwidth allo-cated to each swarm. The seeder collected the currentdownload rate reported by all active peers every 20 sec-onds. The average download rates of all peers is usedby dynamic controller strategies to estimate the currentswarm performance.
We selected a workload consisting of 8 swarms. Thecoverage (equal to λS
µ ) for these swarms 1, 2, 6, 8, 12,14, 20 and 40 which approximately follow a Zipf dis-tribution with exponent 1.5. Each swarm distributed afile of size 10 MB. The mean, minimum and maximumupload capacities of peers were 100 KBps, 40 KBps and200 KBps respectively. We use a distribution of uploadcapacity of BitTorrent peers reported in [27], which wastruncated to remove the high capacity peers in viewof the bandwidth limit imposed on PlanetLab nodes.The total seeder bandwidth for each experiment was
400KBps. Each experiment was run for a duration of4000 seconds.
5.2 Controller StrategiesWe compare the CheatSheet system against the con-
troller strategies described in Section 4.4. Further, weinclude in our comparison two simple static control strate-gies which serve as the baseline for comparison. Thesesimple controller strategies are (1) EqualSplit and (2)PropSplit. EqualSplit splits the total publisher band-width equally among all swarms while PropSplit splitsits bandwidth proportional to the healthy swarm cov-erage (λS
µ ).
5.3 ResultsWe present a comparison of controller strategies for
the objectives MAX MIN, MAX AVG and MIN COSTdescribed in Section 4.1.
5.3.1 Max-min download rate
0
10
20
30
40
50
60
70
Equal Split
Proportional Split
MaxMinHeur CSMin
. Dow
nloa
d Ra
te (K
Bps)
Controller
Figure 9: Minimum download rates for con-troller strategies
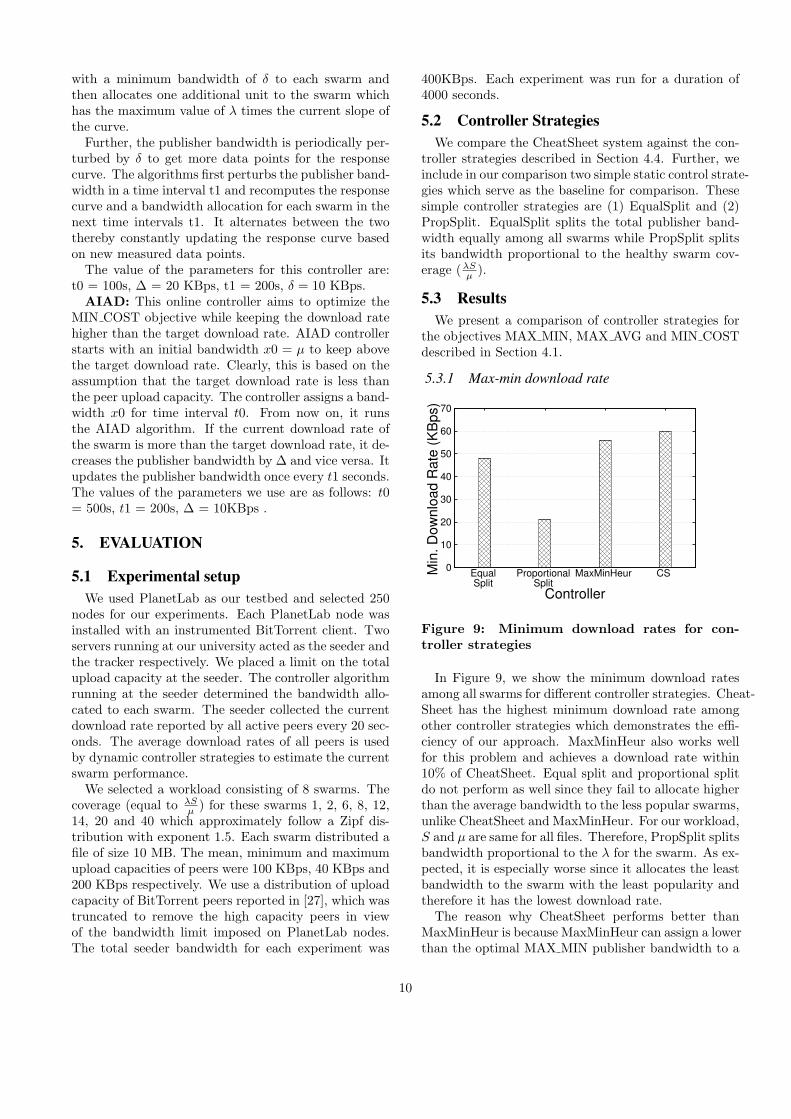
In Figure 9, we show the minimum download ratesamong all swarms for different controller strategies. Cheat-Sheet has the highest minimum download rate amongother controller strategies which demonstrates the effi-ciency of our approach. MaxMinHeur also works wellfor this problem and achieves a download rate within10% of CheatSheet. Equal split and proportional splitdo not perform as well since they fail to allocate higherthan the average bandwidth to the less popular swarms,unlike CheatSheet and MaxMinHeur. For our workload,S and µ are same for all files. Therefore, PropSplit splitsbandwidth proportional to the λ for the swarm. As ex-pected, it is especially worse since it allocates the leastbandwidth to the swarm with the least popularity andtherefore it has the lowest download rate.
The reason why CheatSheet performs better thanMaxMinHeur is because MaxMinHeur can assign a lowerthan the optimal MAX MIN publisher bandwidth to a
10

0
50
100
150
200
250
0 500 1000 1500 2000 2500 3000 3500 4000Avg
. D
ow
nlo
ad
Rate
(K
Bp
s)
Time (sec.)
Publisher BWAvg. Download Rate
Figure 10: Publisher bandwidth and averagedownload rate during the experiment
swarm due to constant reallocation. It waits for theswarms’ download rate to decrease before it again in-creases the allocated bandwidth to the swarm, therebyhurting the average download rate for the swarm. Letus analyze a specific swarm where the MaxMinHeur hasthe lowest download rate. In Figure 10, we show thepublisher bandwidth and and the average download ratefor the experiment where MaxMinHeur had the leastdownload rate. In this case, MaxMinHeur reduces thepublisher bandwidth to 10 KBps for this swarm at 3000seconds. The average download rate for the swarm de-creases significantly a few hundred seconds after thepublisher bandwidth is reduced. Again, the controllerreacts to the change to increase the publisher band-width. Figure 10 also shows that the average downloadrate data show a lot of deviation from the mean value.Due to the reason, the publisher bandwidth cannot beadjusted too quickly based on an increase and decreasein the average download rate measured.
5.3.2 Avg download rateWe compared CheatSheet against EqualSplit Prop-
Split and AntFarm scheme.The difference in performance among CheatSheet and
our baseline controller strategies is less significant inthis case. The average download rate of all peers de-pends heavily on the performance of larger swarms.Larger swarms require lesser publisher bandwidth toachieve a healthy swarm download rate. Therefore allschemes achieve nearly the same average download rate.
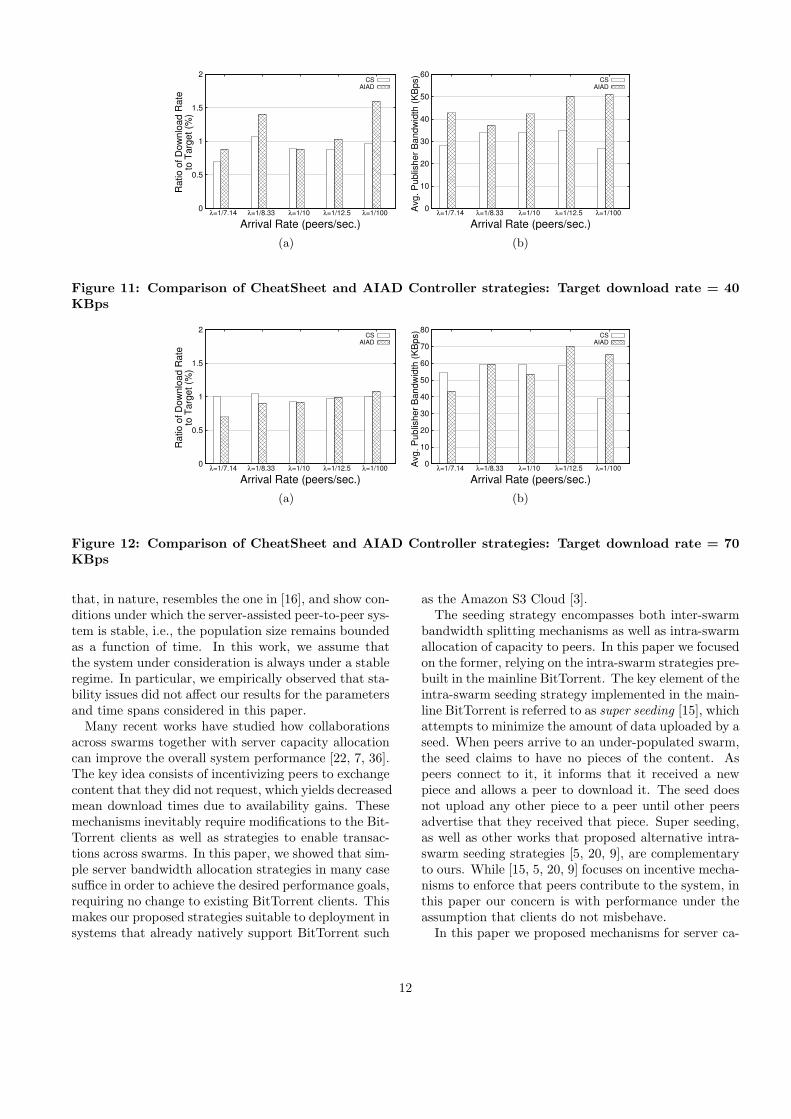
5.3.3 Target download rateWe compare the MIN COST objective for 5 swarms
with λ = 1/7.14, 1/8.33, 1/10, 1/12.5, 1/100 respectively.We show the comparison of CheatSheet and AIAD fora target download rate of 40 KBps in Figure 11 andfor a target of 70 KBps Figure 12. The presented re-sult is for a single run of experiment on PlanetLab.
In Figure 11(a) we observe that CheatSheet perfomsbelow the target download rate for all swarms exceptλ = 1/8.33. We observe in Figure 12(a) that, un-like AIAD, CheatSheet consistently achieves a down-load rate within 5% of the target value for a target of70KBps. For λ = 1/100, it achieves a bandwidth sav-ings of nearly 50% over the AIAD controller.
We attribute this inaccuracy in the model predictionto the higher variance in the download rate value forsmaller values of publisher bandwidth. A possible so-lution to this problem could be taking into account thevariance observed in the measured data while predictingthe download rate.
Figure 12(a) also illustrates that AIAD is not a goodsolution for the the problem of achieving a target band-width for a swarm. For λ = 7.14, the AIAD suffers fromthe same problem as illustrated in Figure 10. The AIADcontroller first decreases the publisher bandwidth andthen reacts to the reduced download rate. The designof an online controller for this objective appears a hardproblem to us.
6. RELATED WORKIn 2005, Bram Cohen pointed out that “making seed-
ing optimizations for enterprise use” was one of the“puzzles” to be solved to improve the BitTorrent pro-tocol [11]. Interestingly, despite the growing interest onthe use of peer-to-peer swarming in the enterprise do-main (due to cost reductions in bandwidth [6, 31, 35]and energy [19]) and the popularity of server-assistedpeer-to-peer systems (such as Shark [4], Coral [13] andCoblitz [25]) the literature on the enterprise use of peer-to-peer systems is still scarce and is comprised mainlyof white papers [1, 17, 2] (some notable exceptions be-ing [26, 9, 16, 37]).
The literature on allocation strategies for server-assistedpeer-to-peer content delivery encompasses measurementoriented works [26, 9] as well as analytical modeling ef-forts [12, 30, 37, 33]. To the best of our knowledge, thispaper is the first to bridge the gap between these two ap-proaches. The methodology adopted in measurement-oriented works [26, 9] consists of probing the swarms toinfer the gains of modifying the bandwidth allocation.The model-driven efforts [12, 30, 37, 33], in contrast,usually consist of defining an optimization problem tobe solved by the publishers and then showing how dif-ferent system parameters affect the optimal bandwidthallocation strategy. The approach we take in this paperis a mix of these two. We couple off-line measurementsand insights on how different system parameters affectbandwidth allocation with on-line probing in order tosplit the server bandwidth across multiple swarms.
Ioannidis et al. [16] study how quickly the bandwidthavailable at the server has to grow as the number ofusers increases. Hajek and Zhou [14] address a question
11
0
0.5
1
1.5
2
λ=1/7.14 λ=1/8.33 λ=1/10 λ=1/12.5 λ=1/100
Ra
tio
of
Do
wn
loa
d R
ate
to T
arg
et
(%)
Arrival Rate (peers/sec.)
CSAIAD
(a)
0
10
20
30
40
50
60
λ=1/7.14 λ=1/8.33 λ=1/10 λ=1/12.5 λ=1/100
Avg. P
ublis
her
Bandw
idth
(K
Bps)
Arrival Rate (peers/sec.)
CSAIAD
(b)
Figure 11: Comparison of CheatSheet and AIAD Controller strategies: Target download rate = 40KBps
0
0.5
1
1.5
2
λ=1/7.14 λ=1/8.33 λ=1/10 λ=1/12.5 λ=1/100
Ra
tio
of
Do
wn
loa
d R
ate
to T
arg
et
(%)
Arrival Rate (peers/sec.)
CSAIAD
(a)
0
10
20
30
40
50
60
70
80
λ=1/7.14 λ=1/8.33 λ=1/10 λ=1/12.5 λ=1/100
Avg. P
ublis
her
Bandw
idth
(K
Bps)
Arrival Rate (peers/sec.)
CSAIAD
(b)
Figure 12: Comparison of CheatSheet and AIAD Controller strategies: Target download rate = 70KBps
that, in nature, resembles the one in [16], and show con-ditions under which the server-assisted peer-to-peer sys-tem is stable, i.e., the population size remains boundedas a function of time. In this work, we assume thatthe system under consideration is always under a stableregime. In particular, we empirically observed that sta-bility issues did not affect our results for the parametersand time spans considered in this paper.
Many recent works have studied how collaborationsacross swarms together with server capacity allocationcan improve the overall system performance [22, 7, 36].The key idea consists of incentivizing peers to exchangecontent that they did not request, which yields decreasedmean download times due to availability gains. Thesemechanisms inevitably require modifications to the Bit-Torrent clients as well as strategies to enable transac-tions across swarms. In this paper, we showed that sim-ple server bandwidth allocation strategies in many casesuffice in order to achieve the desired performance goals,requiring no change to existing BitTorrent clients. Thismakes our proposed strategies suitable to deployment insystems that already natively support BitTorrent such
as the Amazon S3 Cloud [3].The seeding strategy encompasses both inter-swarm
bandwidth splitting mechanisms as well as intra-swarmallocation of capacity to peers. In this paper we focusedon the former, relying on the intra-swarm strategies pre-built in the mainline BitTorrent. The key element of theintra-swarm seeding strategy implemented in the main-line BitTorrent is referred to as super seeding [15], whichattempts to minimize the amount of data uploaded by aseed. When peers arrive to an under-populated swarm,the seed claims to have no pieces of the content. Aspeers connect to it, it informs that it received a newpiece and allows a peer to download it. The seed doesnot upload any other piece to a peer until other peersadvertise that they received that piece. Super seeding,as well as other works that proposed alternative intra-swarm seeding strategies [5, 20, 9], are complementaryto ours. While [15, 5, 20, 9] focuses on incentive mecha-nisms to enforce that peers contribute to the system, inthis paper our concern is with performance under theassumption that clients do not misbehave.
In this paper we proposed mechanisms for server ca-
12

pacity allocation for the transmission of stored contentin the presence of trackers. The order at which pack-ets are delivered, as well as strict delivery deadlines,are not relevant. Future work consists of extending theideas presented in this paper to real-time peer-to-peersystems, whose performance was analyzed only in thecontext of isolated swarms [24, 34] (one exception be-ing [32]). Extending our work to trackerless systems,which rely on random contacts between peers for con-tent dissemination [8, 29], is also subject of future work.
7. CONCLUSIONSWe presented the design and implementation of Cheat-
Sheet, a system for allocating capacity to competingswarms in managed swarming environments. The keyinsight underlying CheatSheet is a concise, measurement-based predictive model of swarm performance as a func-tion of the server bandwidth supplied to it. The modellets CheatSheet optimize the allocation in an offlinemanner enabling it to converge in a single round. Thus,CheatSheet is also simpler to implement than approachesbased on perturbing the allocated capacities and mea-suring performance feedback in an online manner. Wehave implemented a prototype of CheatSheet based onBitTorrent that is protocol-compliant and requires nochanges to existing BitTorrent clients. Our evaluationof CheatSheet over PlanetLab shows that CheatSheetachieves significant gains in swarm performance andserver bandwidth cost compared to BitTorent and con-verges much faster than capacity allocation based ononline control.
8. REFERENCES[1] About.com. Enterprise technology: Peer-to-peer gets down
to businees, 2005. http://pcworld.about.com/magazine.[2] Akamai. Akamai goes peer to peer, 2007. www.forbes.com.[3] Amazon. Using BitTorrent with Amazon S3.
http://aws.amazon.com/.[4] Siddhartha Annapureddy, Michael J. Freedman, and David
Mazieres. Shark: scaling file servers via cooperativecaching. In NSDI, 2005.
[5] Ashwin R. Bharambe, Cormac Herley, and Venkata N.Padmanabhan. Some observations on Bittorrentperformance. In SIGMETRICS, 2005.
[6] Blizzard. Blizzard wow uses p2p for downloading, 2010.http://us.battle.net/wow/en/.
[7] N. Carlsson, D. Eager, and A. Mahanti. Using torrentinflation to efficiently serve the long tail in peer-assistedcontent delivery systems. In Networking, 2010.
[8] Augustin Chaintreau, Jean-Yves Le Boudec, and NikodinRistanovic. The age of gossip: spatial mean field regime. InSIGMETRICS, 2009.
[9] Alix Chow, Leana Golubchik, and Vishal Misra. Improvingbittorrent: A simple approach. In IPTPS’08, 2008.
[10] Bram Cohen. Incentives build robustness in Bittorrent. InP2PEcon, 2003.
[11] Bram Cohen. Interview with Bram Cohen, the inventor ofBitTorrent, 2005. http://torrentfreak.com/.
[12] S. Das, S. Tewari, and L. Kleinrock. The case for servers ina peer-to-peer world. In ICC, 2006.
[13] M.J. Freedman, E. Freudenthal, and D. Mazieres.Democratizing content publication with coral. In NSDI,2004.
[14] B. Hajek and J. Zhu. The missing piece syndrome inpeer-to-peer communication. In ISIT, 2010.
[15] John Hoffman. Super seeding, 2003.http://en.wikipedia.org/wiki/Super-seeding.
[16] Stratis Ioannidis and Peter Marbach. On the design ofhybrid peer-to-peer systems. In SIGMETRICS’08, 2008.
[17] Kontiki. The power of commercial peer-to-peer delivery,2008. www.kontiki.com/ download/The-Power-of-Commercial-P2P.pdf.
[18] J. Kurose and K. Ross. Computer Networking: A TopDown Approach Featuring the Internet. PearsonAddison-Wesley, 2010.
[19] Nikolaos Laoutaris, Georgios Smaragdakis, PabloRodriguez, and Ravi Sundaram. Delay tolerant bulk datatransfers on the internet. In SIGMETRICS/Performance,pages 229–238, 2009.
[20] A. Legout, N. Liogkas, E. Kohler, and L. Zhang. Clusteringand sharing incentives in Bittorrent systems. InSIGMETRICS, 2007.
[21] Arnaud Legout, Nikitas Liogkas, and Eddie Kohler. Rarestfirst and choke algorithms are enough. In IMC, 2006.
[22] N. Lev-tov, N. Carlsson, Zongpeng Li, C. Williamson, andSong Zhang. Dynamic file-selection policies for bundling inbittorrent-like systems. In IWQoS, 2010.
[23] Dave Levin, Katrina LaCurts, Neil Spring, and BobbyBhattacharjee. Bittorrent is an auction: Analyzing andimproving Bittorrent incentives. In SIGCOMM, 2008.
[24] L. Massoulie and A. Twigg. Rate optimal schemes forpeer-to-peer live streaming. Performance Evaluation,65:804–822, 2008.
[25] KyoungSoo Park and Vivek S. Pai. Scale and performancein the coblitz large-file distribution service. In NSDI, 2006.
[26] R. S. Peterson and E. G. Sirer. Antfarm: efficient contentdistribution with managed swarms. In NSDI, 2009.
[27] Michael Piatek, Tomas Isdal, Thomas Anderson, ArvindKrishnamurthy, and Arun Venkataramani. Do incentivesbuild robustness in bittorrent? In NSDI, 2007.
[28] D. Qiu and R. Srikant. Modeling and performance analysisof Bittorrent-like peer to peer networks. In SIGCOMM,2004.
[29] Joshua Reich and Augustin Chaintreau. The age ofimpatience: optimal replication schemes for opportunisticnetworks. In CONEXT, 2009.
[30] Ivica Rimac, Anwar Elwalid, and Sem Borst. On serverdimensioning for hybrid peer-to-peer content distributionnetworks. In P2P’08, 2008.
[31] Janko Roettgers. Wikipedia is using bittorrent p2p forhtml5 video, 2010. http://gigaom.com/.
[32] Sheldon Ross. Stochastic Processes. Wiley, 1996.[33] S. Shakkottai and R. Johari. Demand-aware content
distribution on the internet. IEEE/ACM Transactions onNetworking, 18, April 2010.
[34] S. Tawari and L. Kleinrock. Analytical model forbittorrent-based live video streaming. In NIME, 2007.
[35] Ubuntu. Download Ubuntu using BitTorrent.http://torrent.ubuntu.com:6969/.
[36] Y. Yang, A. Chow, and L. Golubchik. Multi-torrent: aperformance study and applications. Int. J. AdvancedMedia and Communication, 4(1), 2010.
[37] B. Zhang, S. Borst, and M. Reiman. Optimal serverscheduling in hybrid p2p networks. PerformanceEvaluation, 67:1259–1272, 2010.
9. APPENDIXPractical swarms are inefficient, i.e., peers do not consistently
upload at their capacities. We denote the inefficiency of a swarmby γ(N(t)) that depends on the number of peers N(t) in the sys-tem. The justification for assuming γ as dependent on N is em-pirical: we observed experimentally that large swarms are moreefficient than small swarms. Then, we have
13

y(t) = γ(N(t))µ +x
N(t)(11)
where we note that defining γ(1) = 0 implicitly captures theclient-server mode. The number of peers N(t) is governed by thefollowing markov chain
1 → 0, x
i → i + 1, λ
(i > 1) i → i− 1, γ(i)iµ + x
Let N denote the expected value of N(t) in steady-state. Ob-taining a closed-form expression for N is difficult. Little’s lawstill holds as follows
N = λ · E[S
y(t)]
where the second term in the product above denotes the meandownload time of a peer.
Suppose we make the following simplistic assumptions: (1)
E[ Sy(t)
] = S/y where y is the mean download rate of a peer, (2)
N is an integer, and (3) y = γ(N)µ + x/N . Then,
N = λ ·S
γ(N)µ + x/N
or
Nγ(N) =λS − x
µ
Note that we have implicitly assumed above that x < λS asotherwise N must be zero. When x > λS, the performance y issimply equal to the publisher bandwidth x. The system behaveslike a client-server system in this case.
In the cases below, we assume x < λS. Suppose we make thefurther simplifying assumption that γ(N) = 1 − 1
Nα for someα > 0.
Case 1.Consider α = 1 . Then, N = (λS − x + µ)/µ, which yields
y =λSµ
λS − x + µ(12)
Note that the function is convex and increasing in this regime.
Case 2.Consider α = 2 . Then,
N −1
N=
λS − x
µ
which yields a quadratic equation for N . The correspondingperformance is given by
y =2λSµ
(λS − x)(1 +p
(1 + 4µ2
(λS−x)2))
(13)
Other values of α will result in similar polynomial equationsthat can be solved numerically. In general, this equation will havemultiple solutions, but only some of them may be meaningful.The exact value of α needs to be determined empirically.
Unfortunately, models such as above do not even capture theconcave behavior of y with respect to x in the regime 0 < x < µ.
For example, it is easy to see that the slope of the curve dydx
in
equation (12) monotonically increases with x. The reason suchmodels fail to capture realistic swarm behavior is that they as-sume that the swarm reaches a steady-state where the number ofpeers N remains fixed. However, in practice, we observe that atsmaller values of x, the number of peers fluctuates significantlynever reaching a steady-state. Thus, the swarming efficiency inturn varies over time and modeling these time-varying dynamicsas a function of the publisher bandwidth x is nontrivial and ne-cessitates a thorough empirical characterization of swarm healthas a first step.
14