cheating and incentives: learning from a policy...
TRANSCRIPT

CHEATING AND INCENTIVES: LEARNING FROM A POLICY EXPERIMENT1
CÉSAR MARTINELLI, SUSAN W. PARKER, ANA CRISTINA PÉREZ-GEA, ANDRODIMIRO RODRIGO
ABSTRACT. We use a database generated by a policy intervention that incentivized learning as mea-sured by standardized exams to investigate empirically the relationship between cheating by studentsand cash incentives to students and teachers. We adapt methods from the education measurement lit-erature to calculate the extent of cheating, and show that cheating is more prevalent under treatmentsthat provide monetary incentives to students (versus no incentives, or incentives only to teachers),both in the sense of a larger number of cheating students per classroom and in the sense of morecheating relations per classroom. We also provide evidence of learning to cheat, with both the num-ber of cheating students per classroom and the average number of cheating relations increasing overthe years under treatments that provide monetary incentives to students.
Date: February 16, 2015.1The authors are grateful for financial support from Asociación Mexicana de Cultura. Martinelli: George Ma-son University, [email protected]. Parker: CIDE, [email protected]. Pérez-Gea: Instituto TecnológicoAutónomo de México, [email protected]. Rodrigo: Secretaría de Hacienda y Crédito Público, México,[email protected]. The authors alone are responsible for all contents of this paper.

CHEATING AND INCENTIVES 1
1. INTRODUCTION
Anecdotal evidence, available to most anyone who has taken, or administered, written exams,indicates that cheating is common. This view is confirmed by self-reported evidence (Cizek 1999);in fact, an important body of education literature is devoted to the statistical detection of cheatingin multiple choice exams.1 There is, however, surprisingly little empirical analysis of the effects ofincentives on cheating. Jacob and Levitt (2003) have documented, using data from Chicago publicschools, that cheating is responsive to incentives provided to teachers. Jacob and Levitt took ad-vantage of a policy reform by which Chicago schools were put on probation if not enough studentsperformed at or above national levels in a standardized multiple choice achievement exam, withthe subsequent danger that the school could be closed and the school staff dismissed or reassigned.Another piece of the policy reform was to require students to satisfy minimum standards on thesame exam on reading and mathematics in order to be promoted to the next grade.
In this paper, we explore the effects of incentives to students and teachers on cheating using adata base generated by Aligning Learning Incentives [ALI], a policy intervention involving around40,000 students that incentivized learning in mathematics in 88 high schools throughout Mexico.The Mexican intervention included explicit monetary incentives linked to performance in a multi-ple choice exam. Three treatment groups provided incentives to students alone, to teachers alone,and to students, teachers and school administrators. Though the policy intervention proved to bevery successful in increasing performance, there was some evidence of cheating in the incentivizedexams, as described by Behrman et al. (2014). Incentivized exams were monitored by staff fromthe Mexican Secretariat of Public Education, not by teachers. This feature is unlike the Chicagoreform, where exams were left to be monitored by the incentivized teachers. Correspondingly, ourevidence suggests a focus on the students as the main agents in breaking the rules. We analyze theextent of cheating in the incentivized exams, the impact of monetary incentives and other variableson cheating, and the evolution of cheating over the duration of the program.
To guide the analysis, we propose a simple model of cheating and incentives. We approach thedecision to cheat as that of an illicit communication between two students, a copier and a source,in the course of an exam. Provided an opportunity for communication arises, the incentive for thecopier to communicate is proportional to the benefits attached to the exam score and the expectedincrease in the score. The expected increase in score, in turn, is related to the knowledge or abilityof the source. Acquiescence from the source student may be obtained via side payments, rewards insocial status, or implicit threats. The cost of communication may vary with personal characteristicsof the copier and with random events such as how carefully the test is being supervised, the physicaldistance between the copier and the source, etc. Thinking of illicit communication as a directedlink and of the students as nodes, cheating in a classroom can then be described as a directednetwork. Each active component of this communication network consists of a source and one orseveral copiers. When there are substantial incentives linked to the exam score, potential copiersmay seek better students as sources, so that several copiers may try to communicate with the samesource, leading to larger components in the cheating network.
We start our empirical analysis by identifying cheating students extending methods borrowedfrom the education measurement literature. These methods rest on the statistical detection of pairs
1On the pervasiveness of copying in high school and college, see also Davis et al. (1992), Davis and Ludvigson (1995),Brandes (1986) and Schab (1991).

CHEATING AND INCENTIVES 2
of students whose response patterns are unusually similar.2 Ideally, these methods are designedwith the aim of testing whether a particular pair of students on which there may be some suspicionhave, in fact, engaged in illicit communication. In our setting, since we test for illicit commu-nication every possible pair of students in each classroom, the probability of accusing falsely ofcheating any student is much larger than that of accusing any given pair. To classify students intocheaters and non cheaters, we exploit the fact that the same exam was administered across class-rooms, whilst cheating is likely confined to pairs of students in the same classroom. We test forcheating every pair of students in a school, and raise the threshold for accusing a given pair to thepoint where only 10% of students are accused of cheating because of an unusual similarity with astudent in a different classroom. We then use this threshold to classify all pairs of students withineach classroom as cheating or non cheating pairs, and identify a student as a cheater if the studentbelongs to a cheating pair.
The statistical classification confirms that the fraction of students involved in cheating is larger inthe treatments that provide incentives to students than in those that provide incentives to teachersalone. For the control (i.e. no incentives) group, cheating ranges from 5% to 7.5% in differentyears. For the student incentives group, cheating jumps from about 11% the first year to about27% the second year and an astonishing 30% the third year. For the teacher and student incentivesgroup, cheating jumps from about 7% the first year to about 23.5% the second year and an equallyastonishing 32% the third year. For the teacher only incentives group, per contra, cheating increasesfrom about 7% the first year to nearly 10% the third year; statistically different than cheating inthe control group but not very different in magnitude. Cheating is not only more widespread inincentivized settings, but also more intense. In particular, illicit communication networks identifiedin the data contain not only more active students but also are more densely connected. There isa large variance in the prevalence of cheating across schools and classrooms, with a few schoolshaving a large percentage of cheaters in every or almost every classroom.
In recent years there has been a growing reliance on standardized testing to evaluate perfor-mance of different education institutions and to introduce accountability in public education. TheNo Child Left Behind Act of 2001, for instance, provides support for standards-based education re-form in the United States. The introduction of the National Evaluation of Achievement in Schools[ENLACE] exams in Mexico in 2006 pursues similar measurement and accountability goals. Con-comitantly, there has a growing interest in incentives programs that include incentives to studentsand teachers linked to performance in standardized tests. Recent teacher incentives program in-clude Muralidharan and Sundararaman (2011) carried out in rural India, Glewwe, Ilias and Kremer(2010) in rural Kenya, and Springer et. al. (2010) in Nashville, Tennessee public schools. Recentexamples of student incentives programs include Angrist and Lavy (2009) study of high schoolstudent incentives in Israel, Kremer, Miguel and Thornton (2009) of 6th grade girls in Kenya, andFryer ( 2011) report on four different field experiments in Chicago, Dallas, New York City andWashington, DC. None of these studies analyzes the incidence of student cheating or if incentivesresulted in an increase in student (or teacher) cheating.
To our knowledge, ours is the first research effort to analyze the incidence of student cheatingin standardized testing in reaction to monetary incentives. In particular, our study is different fromJacob and Levitt’s (2003) pioneer work in that the intervention we focus on provided explicit mon-etary incentives, and avoided cheating by teachers by employing other monitors for incentivizedexams. Behrman et al. (2014), who report on the ALI intervention effects on learning, are careful
2See e.g. Wollack 1997, 2003 and 2006, Wesolowsky 2000, van der Linden and Sotaridona 2006, Romero et al. 2012,Zopluoglu and Davenport 2012.

CHEATING AND INCENTIVES 3
to isolate the effects of cheating on inflating test scores, but do not elaborate on the determinantsof cheating, the characteristics of cheating networks, or the evolution of cheating over time.
Other recent work on cheating has focused on peer effects and the use of external monitors.Carrell et al. (2008) use self-reported data from US military academies to show that peer honesty(as measured by the presence of high school cheaters in the classroom) result in a substantialincrease in the probability that student will cheat. They interpret this social effect as an evolvingsocial norm of toleration, which may be a mechanism operating behind the evolution of cheatingnetworks in the policy intervention we study. Lucifora and Tonello (2012) use a dataset drawnfrom a national evaluation standardized test in Italy that including random monitoring by externalinspectors to show that grades are inflated in the absence of such inspectors.3
Our results illustrate what has been dubbed (e.g. by Charness et al. 2013) “the dark side ofincentives:” explicit rewards often have unintended consequences, as individuals attempt to gamethe system in ways that are sometimes detrimental to the objectives pursued by the rewards. Policyinterventions that rely on incentivize exams should pay attention to these unintended consequences,and analyze the impact of incentives on gaming attempts.
We believe that cheating in an incentivized exam illustrates the tension between material incen-tives and ethical and social considerations. With few students in a classroom engaging in cheating,cheating may be an activity subject to stigma; as cheating becomes widespread, it may lose anysuch negative connotation (Benabou and Tirole 2006, 2011). In this sense, cheating in the class-room resembles illegal activities in the society at large. Glaeser, Sacerdote and Scheinkman’s(1996) classical work on social interactions and crime interprets the high variance of crime ratesacross US cities as evidence of the importance of social interactions in crime, leading to interde-pendent decisions. In this line, Calvó-Armengol and Zenou (2004) and Ballester, Calvó-Armengoland Zenou (2010) offer models of crime decisions in which criminals benefit from friendship links,modeled explicitly as a network. They consider positive externalities at the local level, stemmingfrom shared knowledge, but also competition between criminals at the aggregate level. In our set-ting, per contra, both local and aggregate interactions may have helped the spreading of cheatingin incentivized settings.
The remainder of this paper is organized as follows. Section 2 provides a network model ofcheating in a classroom. Section 3 describes the policy intervention on which our exploration isbased, explains the statistical methods employed to detect cheating, and provides an estimate of theextent of cheating during the policy intervention for the different treatments. Section 4 exploresempirically cheating at the student level, focusing on the impact of incentives and experienceon the probability of cheating, and on the effects of cheating in exam performance. Section 5explores empirically cheating at the classroom level, focusing on the percentage of cheaters andthe characteristics of the cheating network for each treatment. Section 6 concludes.
2. A MODEL OF CHEATING AND INCENTIVES
2.1. The decision to copy. We propose in this section a simple model as a guide to the empiricalanalysis of cheating at the classroom level. Consider a classroom with N students, i = 1, . . . ,N,who are about to take an exam. The exam has a reward for each student equal to b times the scoreobtained by the student in the exam, where b > 0 represents explicit monetary benefits, as those
3Figlio and Winicki (2005) show another gaming effect of school accountability based on high-stakes testing: schooldistricts under an accountability system in the state of Virginia reacted by substantially increasing calories in theirmenus on testing days, apparently with some success in raising standardized test scores.

CHEATING AND INCENTIVES 4
provided by the incentivized treatments, as well as the implicit satisfaction or amenity value of per-forming well in a test. Student i’s expected score in the exam, if the student does not copy anybodyelse, is given by si. This score is supposed to reflect the ability and preparation of the student andis known to all students in the classroom. If student i copies another student j, then the expectedscore for student i is max{si,s j}, and the student must pay a communication cost ci j > 0. This costrepresents the effort and pain in illicitly communicating with another student, and may vary withthe diligence of the person monitoring the exam, with the social norm of toleration for cheating inthe classroom (and the school), with friendship or other affinity easing communication among thestudents involved, with the location and physical proximity of the students in the classroom, andwith the cheating skills of the students involved. We assume the triangular inequality ci j+c jk ≥ cikfor each triple of distinct students i, j,k, corresponding to the notion that mediated communicationis feasible.
Note that we assume that costs and benefits of copying accrue only to the copier, that copyingaffects only the score of the student copying, and that a student can copy only from one sourceor from none. (Alternatively, we could introduce costs for the source student, and approach thestrategic interaction between the students as a cooperative game, with side payments representingrewards in friendship or status.)
Under the preceding assumptions, a student i will find it optimal to copy if
maxj 6=i
{bs j− ci j
}≥ bsi,
or equivalently if
maxj 6=i
{s j− ci j/b
}≥ si,(1)
and will copy only from one of the students maximizing the expression on the left.Because of the triangular inequality, a student will not find it optimal to have as a source another
student who is in turn copying. It is possible, however, that several students copy from the samesource. The following is immediate:
Proposition 1. Increasing the benefits of the exam, while keeping fixed the expected scores andthe structure of costs, (i) weakly increases the number of copiers in the classroom, and (ii) weaklyincreases the score of the source for each copier.
The first part of the proposition follows from simple inspection of equation 1. The second relieson the fact that larger benefits make it attractive to incur larger communication costs.
2.2. The cheating network. We can represent cheating in the classroom as a directed network, inwhich each student in the classroom is a node and illicit communication is represented as a directedlink from the copier to the source student.4 A path is a sequence of links connecting a sequenceof nodes (ignoring the direction of the links). A component of the network is a maximal subsetof students in the classroom with the property that there is a path between each pair of studentsin the subset. Given our previous assumptions, each component of the cheating network is eitheran isolated student who is neither a copier nor a source, or is composed of one source and one ormore copiers. That is, each component with active cheating has a star-shaped structure. We referto copiers and sources as cheaters, and to a component with a single copier as a pair of cheaters.
4Definitions in this section are adapted from Jackson (2010).

CHEATING AND INCENTIVES 5
Let us assume that there are no ties at the top score for the classroom. Denote N the student withthe best expected score; that is, sN > si for all i 6= N, and define
b = mini, j:s j>si
{ci j
s j− si
}and b = max
i, j 6=N:s j>si
{ci1− ci j
s1− s j
}.
Suppose the ratio of communication costs to score differences is heterogenous across student pairs;then it follows from Proposition 1:
Proposition 2. For b ≤ b, there is at most a pair of cheaters, and for b ≥ b, every student otherthan N either copies from N or does not copy.
The following example illustrates the evolution of the cheating network in reaction to increasedincentives from isolated pairs of cheaters to a unique component with active cheating. Supposethere are N = 2n+1 students, with expected scores
si =
0 if i is odd and different from N,1 if i is even,2 if i = N,
and copying costs
ci j =
{εi if i is odd and j = i+1,1+ εi in all other cases.
Intuitively, each student with a low expected grade has a “neighbor” with a middle expected grade.We have b = ε and b = 1. If benefits are low (b < 1), students with low expected grades such thati ≤ b/ε prefer to copy from their neighbors, forming cheating pairs. If benefits are high (b > 1),students with low expected grades prefer to copy from the student with the top score even if this iscostlier. Moreover, students with middle expected grades such that i ≤ (b− 1)/ε also copy fromthe student with the highest expected grade. Copying in this case is a generalized affair.
Figure 1 depicts the evolution of the cheating network in the example as incentives linked to theexam increase. For low incentives, as in cases A and B, copying is a local affair occurring betweenstudents and their neighbors with better expected grades. For higher incentives, as in cases C,D, and E, students copy from a better if costlier source. The active components of the networkare {1,2} in case A, {1,2} and {3,4} in case B, {1,3,N} in case C, {1,2,3,N} in case D, and{1,2,3,4,N} in case E. Note that when incentives are high enough in reaction to communicationcosts (case C), the best students are drafted into cheating, which may lead to a positive correlationbetween ability and cheating. For very high incentives (case E), such positive correlation is likelyto get swamped by generalized cheating.
Like the cost of other illicit activities, part of the cost of copying may depend on social normsthat stigmatize this behavior. These social norms may be eroded in a classroom if students whodid not copy in an exam observe that other students were not so reticent. Thus, even if incentivesare held constant, the cheating network may evolve over time in a pattern similar to that depictedby Figure 1.
A useful indicator for the level of activity in a network is the density, which is defined as thenumber of directed links in the network divided by the potential number of links, N(N−1). FromProposition 1, the density of the cheating network is weakly increasing in the benefits associatedto the exam. (The number of cheaters is not, as illustrated by going from case B to case C.) Acommonly used indicator of activity at the individual node level is the degree, which is definedas the number of directed links stemming from a node; note that density is equal to the average

CHEATING AND INCENTIVES 6
N
14
23
(A) ε≤ b < 3ε
N
14
23
(B) 3ε≤ b < 1
N
14
23
(C) 1≤ b < 1+2ε
N
14
23(D)1+2ε≤ b < 1+4ε
N
14
23
(E) b≥ 1+4ε
FIGURE 1. Cheating network for different incentive levels
degree divided by N−1. We return to both indicators later to describe likely illicit communicationactivity in our data.
3. INCIDENCE OF CHEATING IN THE ALI EXPERIMENT
3.1. The ALI experiment. The data used in this paper derive from the Aligning Learning Incen-tives [ALI] experiment carried out in Mexico, which began with the 2008-09 academic year andended with the 2010-11 academic year (Behrman et al. 2014). A total of 88 high schools (prepara-torias) participated in the experiment; Figure 2 illustrates the location of the schools. The schools

CHEATING AND INCENTIVES 7
ControlTreatment 1Treatment 2Treatment 3
0 500 1000 km
FIGURE 2. ALI schools
were randomly assigned to four different groups; 20 schools were assigned to each of three treat-ment schools, corresponding to different incentive schemes, and 28 schools were assigned to acontrol group with no incentives. Specifically, the four groups were:
(C) Control group: No payments.(T1) Treatment group 1: Payments to students based on their own performance.(T2) Treatment group 2: Payments to mathematics teachers based on the performance of the
students in their classes.(T3) Treatment group 3: Payments to students based on their own performance and on the per-
formance of the other students in their class. Payments to mathematics teachers based onthe performance of the students in their classes and on the performance of the students inall other mathematics classes. Payments to non-mathematics teachers and school adminis-trators based on the performance of all of the students in the school.
Incentive payments were based on standardized curriculum-based mathematics exams in 10th,11th and 12th grade given at the end of each academic year. Incentive payments were basedon the amount of improvement in mathematics learning over the school year for 10th and 11thgraders and on the final level of learning for 12th graders. The score on the 9th grade ENLACE, aMexican national level exam in reading and mathematics skills, was used as the baseline for mathachievement. For the purpose of determining incentive payments, performance on each examwas categorized, as in the 9th grade ENLACE, into four levels: Pre-Basic, Basic, Proficient, andAdvanced. The exams were designed by CENEVAL (an independent and widely regarded Mexicaneducation evaluation agency) based on the input of Mexican experts on high school mathematics.The monetary incentives for improving performance from one level to one or more levels above

CHEATING AND INCENTIVES 8
fluctuated between 4,000 and 15,000 Mexican pesos (approximately 30 to 120 US dollars at theexchange rate at the time of the program); these are substantial incentives for Mexican high schoolstudents. The Appendix provides more details on the incentive payments of the ALI program.
Baseline and follow up questionnaires were applied to students and teachers at the beginningand at the end of each year. The student questionnaires provided (self reported) information onfamily background and personal characteristics. The incentivized exams were not administered ormonitored by school personnel, but by representatives of the Secretariat of Public Education stateoffices, with one monitor assigned to each class and an overall supervisor assigned to the school.The same administrators collected the answer sheets and were required to account for all copies ofthe exams after administration of the exam to reduce the possibility of teaching to the test basedon past tests.
3.2. Statistical detection of cheating. A number of statistical indices for the detection of answercopying in an exam have been developed by the education measurement literature, including the ω
index (Wollack 1997), the Generalized Binomial Test [GBT] index (van der Linden and Sotaridona2006), the K index (Holland 1996, Sotaridona and Meijer 2002), and the S1 and S2 indices (Sotari-dona and Meijer 2003). There is, however, a relatively small literature comparing the performanceof the different indices with real data. It is known that the indices perform better when tests havea larger number of questions and a larger sample (Wollack 2003 and 2006). We focus the analysison the ω index and the GBT, which looked most promising given the recent education literature.5
Both the ω index and the GBT index use the similarity in both correct and incorrect answersfor each ordered pair of students to assess whether a student copied from the other. Figure 3illustrates the distribution of the number of exact matches for sampled pairs of students in the sameclassroom for each treatment in the 12th grade exam the last year of the program (2010-11). This isthe cohort that went through the program all three years, and is the focus of our empirical analysis.The distribution of exact matches for the teacher incentive treatment is almost identical (mostlyoverlapping) to that for the control treatment. The distributions for the student and the teacher andstudent incentive treatments, however, are markedly different, with both of them exhibiting firstorder stochastic dominance over the distribution for the control. Note that the distribution of exactmatches for the teacher and student incentive treatment, in particular, is bimodal, with the secondmode at about 75 exact matches, out of 112 questions. This is not, in itself, evidence of morecheating. Part of it reflects increased achievement. A necessary building block for determiningthe extent of cheating is a model to determine the probability that an individual chooses a givenanswer to a multiple-choice question if the individual is not copying.
Both the ω index and the GBT index calculate the probability of each answer if an individual isnot cheating using the Nominal Response Model (NRM) proposed by Bock (1972). In particular,the probability that individual i chooses answer m to a given question q is taken to be
Piq(m) =exp(ζm +λmθi)
∑m′∈Mq exp(ζm′+λm′θi),
where Mq indicates the set of answers to question q. Intuitively, the parameters ζm, λm for m ∈Mq capture the difficulty of question q or the distractors associated to different possible answers,
5We explored the other indices with our data. The K index, which only uses information from wrong answers, didnot show much difference between the different groups. In line with the real-data test provided by Wollack (2003),this seems to reflect a poor performance of the K index detecting cheating. Zopluoglu and Davenport (2012) find littledifference in the statistical power of the ω index and the GBT in the context of a simulation study, but we do not knowof previous comparisons between the ω index and the GBT using real data.

CHEATING AND INCENTIVES 9
0.00
0.02
0.04
0.06
0 30 60 90Exact matches
Cou
nt
treatment
C
T1
T2
T3
Exact match distribution with n = 235509 sampled pairs
FIGURE 3. Distribution of exact matches for pairs of students
and the parameter θi captures the ability of individual i. Since Piq(m) is invariant to translationsof the vector of ζm + λmθi, arbitrary linear restrictions on the parameters such as ∑m∈Mq ζm = 0and ∑m∈Mq λm = 0 allow to normalize the denominator of Piq(m) to one. The parameters can beestimated jointly by maximum likelihood using all the answers of all individuals taking a test.
The ω index then identifies copiers by computing the standardized difference between the num-ber of answer matches between the pair of students and the number predicted by chance, condi-tional on the answers by the potential source, the estimated ability for the potential copier, and theestimated difficulty for each item. That is, if m jq is the answer of student j to question q, and hi jis the number of matches between the answers of student i and the answers of student j, the indexωi j for the ordered pair (i, j) (where i is the potential copier and j the potential source) is given by
ωi j =hi j−∑q Piq(m jq)√
∑q(Piq(m jq)(1−Piq(m jq))).
The idea behind classification is that ω is approximately standard normal, a postulate based onthe central limit theorem. Thus, i is classified as having copied from j, with α probability ofaccusing an innocent pair, if 1−Φ(ωi j)≤ α, where Φ is the standard normal distribution function.Student i is classified as a cheater if there is some other student j in the same classroom such that1−Φ(ωi j)≤ α or 1−Φ(ω ji)≤ α.
The GBT approach, instead, starts with the observation that the probability of an exact matchbetween the answer of student i and the answer of student j to a given question q, under the nullhypothesis that neither student has cheated, is equal to
Pi jq = ∑m∈Mq
Piq(m)Pjq(m).

CHEATING AND INCENTIVES 10
●
●
●
●
●
●
●
●
●
●
●
●
●
●
●
●
●
●
●
●
●
●
●●
●
●
●●
●
●
●
●
●●
●
●
●
●
●
●
●
●
●
●
●
●
●
●
●
●
●
●
●
●
●
●
●
●
●
●
●
●
●
●
●
●
●
●
●
●
●●
●
●
●
●
●
●●
●
●
●
●
●
●
●
●
●
●
●
●
●
●
●
●
●
●
●
●
●
●
●
●
●
●
●
●
●
●
●●
●
●
●
●
●
●
●
●
●
●
●
●
●
● ●●
●
●
●
●
●
●
●
●●
●
●
●
●
●
●
●
●
●
●
● ●
●
●●
●
●
●●
●●
●
●
●
●
●
●
●
●●
●
●
●
●
●
●
●
●
●
●
●
●●
●
●
●
●
●
●
●
●
●
●
●
●
●
●
●
●
●
●●
●
●
●
●
●
●
●
●
●
●
●
●
●
●
●
●●
●
●
●●
●
●
●
●
●
●
●
●
●
●
●
●
●
●
●
●
●
●
●
●
●
●
●
●
●
●
●
●
●
●
●
●●
●
●
●
●
●
●
●
●
●
●
●
●
●
●
●
●
● ●
●
●
●
●
●●
●●
●
●
●
●
●
●
●
●
●
●
●
●
●
●
●
●
●
●
●
●
●
●
●
●
●
●
●
● ●
●
●
●
●
●
●
●
●
●●
●
●
●
●
●
●
●
●
●
●
●
●
●
●
●
●
●
●●
●
●
●
●
●
●●
●
●
●
●
●
●
●
●●
●
●
●
●
●
●
●
●
●● ●
●
●
●
●
●
●
●
●
●
●
●
●
●
●●
●
●
●
●
●●
●
●
●
●
●
●
●
●
●
●
●
●
●
● ●
●
●
●
●
●
●
●
●
●
●
●●
●
●
●
●
●
●
●
●
●
●
●
●
●
●
●
●
●
●
●
●
●
●
●
●
●
●
●
●
●
●
●
●
●
●
●
●●
●
●
●
●●
●
●
●
●
● ●
●
●
●
●
●
●
●
●
●
●
●
●
●
●
●
●
●
●
●
●
●
●
●
●
●
●
●●
●●
●
●
●
●
●
●
●
●
●
●
●
●
●
●
●
●
●
●
●
●
● ●
●
●
●
●
●●
●
●
●
●
●
●
●
●
●
●
●●
●
●
●
●
●
●
●
●
●
●
●
●
●
●
●
● ●
●
●
●
●
●
●
●
●
●
●●
●
●
●
●
●
●
●
●
●
●
●
●
●
●
●
●
●
●
●
●
●
●
●
●
●
●●
●
●
●
●
●
●
●
●
●●
●
●
●
●
●
●
●
●
●
●
●
●
●
●
●
●
●
●
●
●
●
●
●
●
●
●
●
●
●
●
●
●
●
●
●
●
●
●
●
●
●
●
●
●
●
●
●
●
●
●
●
●
●
●
●
●
●
●
●
●
●
●
●
●
●
●
●
●
●
●
●
●
●
●
●
●
●
●
●
●
●
●
●
●
●
●
●
●
●
●
●
●
●
●
●
●
●
●
●
●
●●
●
●●
●
●
●
●
●
●
●
●
●
●
●
●
●
●
●
●
●
●
●
●
●
●
●
●
●
●
●
●
●
●
●
●
●
●
●
●
●
●
●●
●
●
●
●
●
●
●●●
●
●
●
●
●
●
●
●
●
●
●
●
●
●
●
●
●
●
●
●
●
●
●
●
●
●
●
●
●
●
●
●
●
●
●
●
●
●
●
●
●
●●
●
●
●
●
●
●
●
●
●
●
●
●
●
●
●
●
●
●
●
●
●
●
●
●
●
●
●
●
●
●
●
●
●
●
●
●
●
●
●
●
●
●
●
●
●
●●
●
●
●
●
●
●●
●●
●
●
●
●
●
●
●
●
●
●
●
●
●
●
●
●
●
●
●
●
●
●
●
●
●
●
●
●
●
●
●
●
●
●
●
●●
●
●
●
●
●
●
●
●
●
●
●
●
●
●
●
●
●
●
●
●
●
●
●
●
●
●
●
●
●
●
●
●
●
●
●
●
●
●●
●
●
●
●
●
●
●
●
●
●
●●
●
●
●
●
●
●
●
●
●
●
●
●
●
●
●
●
●
●
●
●●
●
●
●
●
●
●
●
●
●
●
●
●
●
●
●
●
●
●
●
●
●
●
●
●
●
●
●
●
●
●
●
●
●
●
●
●●
●
●
● ●●
●
●
●
●
●
●
●
●
●
●
●
●
●
●
●
●
●
●
●
●
●
●
●
●
●
●
●
●
●●
●●
●
●
●
●
●
● ●
●
●
●
●
●
●
●
●
●
●
●
●
●
●
●
●
●
●
●
●●
●●
●
●
●
●
●●
●
●
●
●
●
●
●
●
●
●
●
●
●
●
●
●
●
●
●
●
●
●
●
●
●
●
●
●
●
●
●
●
●
●
●
●
●
●
●
●
●
●
●
●
●
●
●
●
●
●
●
●
●
●
●
●
●
●
●
●●
●
●
●
●
●
●
●
●
●
●
●
●
●
●
●
●
●
●
●
●
●
●
●
●
●
●
●
●
●
●
●
●
●
●
●
●
●●
●
●
●
●
●
●
●
●
●●
●
●
●
●
●
●
●
●
●
●
●
●●
●
●
●
●
●
●
●
●
●
●
●
●
●
●
●
●
●
●
●
●
●
●
●
●
●
●
●
●
●
●
●
●
●
●
●
●
●
●
●
●
●
●
●
●
●
●
●
●
●
●
●
●
●
●
●
●
●
●
●
●
●
●
●
●
●
●
●
●
●
●
●●
●
●
●
●
●
●
●
●
●
●
●
●
●
●
●
●
●
●
●
●
●
●
●
●
●
●
●
●
●
●
●
●
●
●
●
●
●
●
●
●
● ●
●
●
●
●
●
●
●●
●
●
●
●
●
●
●
●
●
●
●
●
●
●
●
●
●
●
●
●
●
●
●
●
●
●
●
●
●
●
●
●
●
●
●
●
●
●
●
●
●
●
●
●
●
●
●
●
●
●
●
●
●
●
●
●
●
●
●
●
●
●
●
●
●
● ●
●
●
●
●
●
●
●
●
●
●
●●
●
●
●
●
●
●
●
●
●
●
●
●
●
●●
●
●
●
●
●
●
●
●
●
●●
●
●
●
●
●
●
●
●
●
●
●
●
●
●
●
●
●
●
●
●
● ●
●
●
●
●
●
●
●
●
●
●
●
●
●
●
●
●
●
●
●
●
●
●
●
●
●
●
●
●
●
●
●
●
●
●
●
●
●
●
●
●
●
●
●
●
●
●
●
●
●
●●
●
●
●
●
●
●
●
●
●
●
●
●
●
●
● ●
●
●
●
●
●
●
●
●
●
●
●
●
●
●
●
●
●
●
●
●
●
●
●
●
●
●
●
●
●
●
●
●
●
●
●
●
●
●
●
●
●
●
●
●
●
●
●
●
●●
●
●
●
●
●
●
●
●
●
●
●
●
●
●
●
●
●
●
●
●
●
●
●
●
●
●
●
●
●
●
●
●
●
●
●
●●
●
●
●
●
●
●
●
●
●
●
●
●
●
●
●
●
●
●
●
●
●
●
●
●
●
●
●
●
●
●
●
●
●
●
●
●
●
●
●
●
●
●
●
●
●
●
●
●
●
●
●
●
●
●
●
●
●
●
●●
●
●
●
●●
●
●
●
●
●
●
●
●
●
●
●
●
●
●
●
●
●
●
●
●
●
●
●
●
●
●
●
●
●
●
●
●
●
●
●
●
●
●
●
●
●
●
●
●
●
●
●
●●●
●
●
●
●
●
●
●
●
●
●
●
●
●
●
●
●
●●
●
●
●
●
●
●
●
●
●
●
●
●
●
●
●
●
●
●
●
●
●
●
●
●
●
●
●
●
●
●
●
●
●
●
●
●
●
●●
●
●
●
●
● ●
●
●
●
●
●●
●
●
●
●
●●
●
●
●
●
●
●
●
●
●
●
●
●
●
●
●
●
●
●
●
●
●●
●
●
●
●
●
●
●
●●
●
●
●
●●
● ●
●
●●
●
●
●
●
●
●
●
●
●
●
●
●
●
●
●
●
●
●
●
●
●
●
●
●
●
●
●
●
●
●
●
●
●
●
●
●
●
●
●
● ●
●
●
●
●
●
●
●
●
●
●
●
●
●
●
●
●
●
●
●
●
●
●
●
●
●
●
●
●
●
●
●
●
●
●●
●
●
●
●
●
●
●
●
●
●
●
●
●
●
●
●
●
●
●
●
●
●
●
●
●
●
●
●
●
●
●
●
●●
● ●
●
●
●
●●
●
●
●
●
●
●
● ●●
●
●
●
●
●
●
●
●
●
●
●
●
●
●
●
●●
●
●
●
●●
●
●
●
●
●
●
●
●
●
●
●
●
●
●
●
●●
●
●
●●
●
●
●
●
●
●
●
●
●
●
●
●
●
●
●
●
●
●
●
●●
●
●
●
●
●
●
●
●
●
●
●
●
●
●
●
●
●
●●
●
●
●
●
●
●
●
●
●
●
●
●
●
●
●
●
●
● ●
●
●
●
●
●
●
●
●
●
●
●
●
●
●
●
●
●
●
●
●
●
●
●
●
●
●
●
●
●
●
●
●
●
●
●
●
●
●
●
●
●
●
●
●
●
●
●●
●
●
●
●
●
●
●
●
●
●
●
●
●
●
●
●
●
●
●●
●
●
●
●
●
●
● ●
●
●
●
●
●
●
●
●
●
●
●
●
●
●
●
●
●
●
●
●
●
●
●
●●
●
●
●
●●
●
●●
●
●
●
●
●
●
●
●
●
●
●
●
●
●
●
●
● ●
●
●
●
●
●
●
●
●
●
●
●
●
● ●
●
●
●
●
●
●
●
●●
●
●
●
●
●
●
●
●●
●
●
●
●
●
●
●
●
●
●
●
●
●
●
●
●
●
●
●
●
●
●
●
●●
●
●
●
●
●
●
●
●
●
●
●
●
●●
●
●
●
●
●
●
●
●
●
●
●
●
●
●
●
●
●
●
●
●
●●
●
●
●
●
●●
●
●
●
●
●
●
●
●
●
●
●
●
●
●
●
●
●
●
●
●
●
●
●
●
●
●
●
●
●
●
●
●
●
●
●
●
●
●
●
●●
●
●
●
●
●
●
●
●●
●
●
●
●
●
●
●
●
●
●
●
●
●
●
●
●
●
●
●●
●
●
●
●
●
● ●
●
●
●
●
●
●
●
●
●
●
●
●
●
●
●
●
●
●
●
●
●
●
●
●
●
●
●
●
●
●
●
●
●
●
●
●
●
●
●
●
●
●
●
●
●
●
●
●
●
●
●
●●
●
● ●
●
●
●
●
●
●
●
●
●
●
●
●
●
●
●
●
●
●
●
●
●
●
●
●
●
●
●●
●
●
●
●
●
●
●●
●
●
●
●
●
●●
●
●
●
●
●
●
●●
●
●
●●
●
●
●
●
●
●
●
●
●●
●
●
●
●
●
●
●
●
●
●
●
●
●
●
●
●
●
●
●
●
●
●
●
●
●
●
●
●●
●
●
●
●
●
●
●
●
●
●
●
●
●
●
●
●
●
●
●
●
●
●
●
●
●●
●
●
●
●
●
●●
●
●
●
●
●
●
●
●
●
●
● ●●
●
●
●
●
●
●
●
●
●
●
●
●
●
●
●
●
●
●
●●
●
●
●
●
●
●
●
●●
●
●
●
●
●
●
●
●
●
●
●
●
●
●
●
●
●
●
●
●
●
●
●
●
●
●
●
●●
●
●
●
●
●
●
●
●
●
●●
●
●
●
●
●
●●
●●
●
●
●
●
●
●
●
●
●
●
●
●
●
●
●
●
●
●●
●
●
●
●●
●
●
●
●
●
●
●
●
●
●
●
●
●
●
●
●
●
●
●
●
●
●
●
●
●
●
●
●
●
●
●
●
●
●
●
●
●
●
●
●
●
●
●
● ●
●
●
●
●
●
●●
●
●
●
●
●
●
●
●
●
●
●
●
●
●
●
●
●
●
●
●
●
●
●
●
●
●
●
●
●
●
●
●
●
●●
●
● ●
●
●
●
●
●●
●
●
●
●
●
●
●
●
●
●
●
●
●
●
●
●
●
●
●
●
●
●
●
●
●
●
●
●
●
●
●
●
●
●
●
●
●
●
●
●
●
●
●
●
●
●
●
●
●
●
●
●
●
●
●
●
●
●
●
●
●
●
●
●
●
●●
●
●
●
●
●
●
●
●
●
●
●
●
●
●
●
●
●
●
●
●
●
●
●
●
●
●
●
●
●
●
●
●
●
●
●
●
●
●
●
●
●
●
●
●
●
●
●
●
●●
●
●
●●
●
●
●
●●
●
●
●
●
●
●
● ●
●
●
●
●
●
●
●
●●
●
●
●
●
●
●
●
●
●●
●
●
●●
●
●
●
●
●
●
●
●
● ●
●
●
●
●
●
●
●
●
●
●
●
●
●
●
●
●
●
●
●
●
●
●
●●
●
●
●
●
●
●
●
●
●
●
●
●
●
●
●
●
●
●
●
●
●
●
●
●
●
●●
●
●●
●
●
●
●
●
●
●
● ●
●●
●
●
●
●
●
●
●
●
●
●
●
●
●●
●
●
●
●
●
●
●
●
●
●
●
●
●
●
●
●
●
●
●
●
●
●
●
●
●
●
●
●
●
●
●
●
●
●
●
●
●
●
●
●
●
●●
●
●
●
●
●
●
●
●
●
●●
●
●
●
●
●
●
●
●
●
●
●
●
●
●
●
●
●
●
●
●
●
●
●
●
●
●
●
●
●
●
●
●
●
●
●
●
●
●
●
●
●
●
●
●
●
●
●
●
●
●
●
●
●
●
●
●
●
●
●
●
●
●
●
● ●
●
●
●
●
●
●
●
●
●
●
●
●
●
●
●
●●
●
●
●●
●
●
●
●
●
●
●
●
●
●
●
●
●
●
●
●
●
●
●
●
●
●
●
●
●
●
●
●
●
●
●
●
●
●
●
●
●
●
●
●
●
●
●
●
●
●
●
●
●
●
● ●
●
●
●
●
●
●
●
●
●
●
●
●
●
●
●
●
●
●
●
●
●
●
●
●
●
●
●
● ●
●
● ●
●
●
●
●
●
●
●
●
●
●
●
●
●
●
●
●
●
●
●
●
●
●
●
●
●
●
●
●
●
●
●
●
●
●
●
●
●
●
●
●
●
●
●
●
●●
●
●
●
●
●
●
●
●
●
●
●
●
●
●
●
●
●
●
●
●
●
●
●
●
●
●
●
●
●
●
●
●
●●
●
●
●
●
●
●
●
●●
●
●
●
●
●
●
●
●
●
●●
●
●
●
●
●
●
●
●
●
●
●
●
●
●
●
●
●
●
●
●
●
●
●
●
●
●
●
●
●
●
●●
●
●
●
●
●
●
●
●
●
●
●
●
●
●
●
●
●
●
●
● ●
●
●
●
●
●
●
●
● ●
●
●
●
●
●
●
●
●
●
●
●
●
●
●
●
●
●
●
● ●
●●●
●
●
●
●
●
●
●●
●
●
●
●
●
●
●
●
●
●
●
●
●
●
●
●
●
●
●
●
●
●
●
●
●
●
●
●
●
●
●
●
●
●
●
●
●
●
●
●
●
●
●
●
●
●
●
●
●
●●
●
●
●
●
●
●
●
●
●
●
●
●
●
●
●
●
●
●
●
●
●
●
●●
●●
●
●
●
●
●
●
●
●
●
●
●
●
●
●
●
●
●
●
●
●
●
●
●
●
●
●
●
●
●
●
●
●
●
●
●
●
●
●
●
●
●
●
●
●
●
●●
●
●
●
●
●
●
●
●
●
●
●
●
●
●
●
●
●
●
●
●
●
●
●
●
●
●
●
●
●
●
●
●
●
●
●
●
●
●
●
●●
●
●
●
●
●
●
●
●
●
●
●
●
●
●
●
●
●
●
●
●
●
●
● ●
●
●
●
●
●
●
●
●
●
●
●
●
●
●
●
●
●
●
●
●
●
●
●
●
●
●
●
●
●●
●
●
●
●
●
●
●
●●
●
●
●●
●
●
●
●
●
●
●
●
●
●
●
●
●
●
●
●
●
●
●
●
●
●
●
●
●
●
●
●
●
●
●
●
●
●
●
●
●
●●
●
●
●
●
●
●
●
●
●
●
●
●
●
●
●
●
●
●
●
●
●
●
●
●
●
●
●
●
●
●
●
●
●
●
●
●
●
●
●
●
●
●
●
●
●
●
●
●
●
●
●●
●
●
●●
●
●
●
●
●
●
●
●
●
●●
●
●
●
●
●
●
●
●
●
●
●
●
●
●
●
●
●
●
●
●
●
●
●
●
●
●
●
●
●
●
●
●
●
●
●
●
●
●
●
●
●
●
●
●●
●
●
●
●
●
●
●
●
●
●
●
●
●
●
●
●
●
●
●
●
●
●●
●
●
●
●
●
●
●
●
●
●
●
●
●
●
●
●
●
●
●
●
●
●
●
●
●
●
●
●
●
●
●
●
●
●
●
●
●
●
●
●
●
●
●
●
●
●
●
●
●
●
●
●
●
●
●
●
●
●
●
●
●
●
●
●
●
●
●
●●
●
●
●
●
●
●
●
●
●
●
●
●
●
●●
●
●
●
●
●
●
●
●
●
●
●
●
●
●
●●
●
●
●
●
●
●
●
●
●
●
●
●
●
●
●
●
●
●
●
●●
●
●●
●
●
●
●
●
●
●
●●
●
●
●
●
●
●
●
●
●
●
●
●
●
●
●
●
●
●
●
●
●●
●
●
●
●
●
●
●
●
●
●
●
●
●
●
●
●
●
●
●
●
●
●
●
●
●
●
●
●
●
●
●
●
●
●
●
●
●
●
●
●
●
●
●
●
●
●
●
●
●
●
●
●
●
●
●
●
●
●
●
●
●
●
●
●
●
●
●
●
●
●
●
● ●●
●●
●
●
●
●
●
●
●
●
●
●●
●
●
●
●●
●
●
●
●
●
●
●
●
●
●
●
●
●
●
●
●
●
●
●
● ●●
●
●
●
●
●
●
●
●
●
●
●●
●
●
●
●
●
●
●
●
●●
●●
●
●
●
●
●
●
●
●
●
●
●
●
●
●
●
●
●
●
●
●
●
●
●
●
●
●
●
●
●
●
●
●
●
●
●
●
●
●
●
●
●
●●
●
●
●
●
●
●
●
●
●
●
●
●
●
●
●
●
●●
●
●
●
●
●
●
●
●
●
●
●
●
●
●
●
●
●
●
●
●
●
●
●
●
●
● ●
●
●
●
●
●
●
●
●●
●
●●
●
●
●
●
●●
●
●
●
●
●
●
●
●
●
●
●
●
●
●
●
●
●
●
●
●
●
●
●
●
●
●
●
●
●
●
●
●
●
●
●
●
●
●
●
●
●
●
●
●
●
●
●
●
●
●
●
●
●
●
●
●
●
●
●
●
●
●
●
●
●
●
●
●
●
●
●
●
●
●
●
●
●
●
●
●
●
●
●
●
●
●
●
●
●
●
●
●
●
●
●
●
●
●
●
●
●
●●
●
●
●
●
●
●
●●
●
●
●
●
●
●
●
●
●
●
●
●
●
●
●
●
● ●
●
●
●●
●
●
●
●
●
●
●
●
●
●
●
●
●
●
●
●
●
●
●
●
●
●
●
●
●
●
●
●
●
●
●
●
●
●
●
●
●
●
●
●
●
●
●
●
●
●
●
●
●
●
●
●
●
●●
●
●
●
●
●
●
●
●
●
●
●
●
●
●
●
●
●
●
●
●
●
●
●
●
● ●
●
●
●
●
●
●
●
●
●
●
●
●
●
●
●
●
●
●
●
●
●
●
●
●
●
●
●
●
●
●
●
●
●
●
●
●
●
●
●
●
●
●
●
●
●
●
●
●
●
●
●●
●
●
●
●
●
●
●
●
●
●
●
●
●
●●
●
●
●
●
●
●
●
●
●●
●
●
●
●
●
●
●
●●
●
●
●
●
●
●
●
●
●
●
●
●
● ●
●
●
●
●
● ●
●
●
●
●
●
●
●
●
●
●●
●
●
●
●
●
●●
●
●
●
●
●
●
●
●
●
●
●
●●
●
●
●
●
●
●
●
●
●
●
●
●
●
●
●
●
●
●
●
●
●
●●
●
●
●
●
●
●
●
●
●
●
●●
●
●
●●
●
●
●
●
●
●
●
●
●
●
●
●
●
●
●
●
●
●
●
●
●
●
●
●
●
●
●
●
●
●
●●
●
●
●
●
●
●
●
●
●
●
●
●
●
●
●
●
●
●
●
●
●
●
●
●
●
●
●
●
●
●
●
●
●
●
●
●
●
●
●
●
●
●
●
●
●
●
●
●
●
●
●
●
●
●
●
●
●
●
●
●
●
●
●
●
●
●
●
●
●
●
●
●
●
●
●
●
●
●
●
●
●
●
●
●
●
●
●
●
●
●
●
● ●
●
●
●
●
●
●
●
●
●
●
● ●
●
●●
●
●
●
●
●
●
●
●
●
●
●
●
●
●
●
●
●
●
●
●
●
●
●
●
●
●
●
●
●
●
●
●
●
●
●
●
●
●
●
●
●
●
●
●
●
●
●
●
●
●
●
●
●
●●
●
●
●
●
●
●
●
●
●
●
●
●
●
●
●
●
●
●
●
●
●
●
●
●
●
●
●
●
●
●
●
●
●
●
●
●
●
●
●
●
●
●
●
●
●
●
●
●
●
●
●●
●
●
●
●●
●
●
●
●
●
●
●
●
●
●
●
●
●
●
●
●
●
●
●
●
●
●
●●
●
●
●
●●
●
●
●
●
●
●
●
●
●
●
●
●
●
●
●
●
●
●
●
●
●
●
●
●
●
●
●
●
●
●
●
●
●
●
●
●
●
●
●
●
●
●
●
●
●
●
●
●
●
●
●
●
●
●
●
●
●
●
●
●
●
●
●
●
●
●
●
●
●
●
●
●
●
●
●
●
●
●
●●
●
●
●
●
●
●
●
●
●
●
●
●
●
●
●
●
●
●
●
●
●
●
●
●
●
●
●
●
●
●
●
●
●
●
●
●
●
●
●
●
●
●
●
●●
●●●
●
●
●
●
●
●
●●
●
●
●
●
●
●
●
●
●
●
●
●
●
●
●
●
●
●
●
●
●
●
●
●
●
●
●
●
●
●
●
●
●
●●
●
●
●
●
●
●
●
●
●
●
●●
●
●
●
●
●
●
●
●
●●
●
●
●
●
●
●
●
●
●
●
●
●
●
●
●
●●
●
●
●
●
●●
●
●
●
●
●
●
●
●
●
●
●
●
●●
●
●
●
●
●
●●
●
●
●
●●
●
●
●
●
●
●
●
●
●
●
●
●
●
●
●
●
●
●
●
●
●
●
●
●
●
●
●
●
●
●
●
●
● ●
●
●
●
●
●
●
●
●
●
●
●
●
●
●
●
●
●
●
●
●
●●●
●
●
●
●
●
●
●
●
●
●
●
●
●
●
●
●
●
●
●
●
●
● ●
●
●
●
●
●
●
●
●
●
●
●
●
●
●
●
●
●
●●
●
●
●
●
●
●
●
●
●
●
●
●
●
●
●
●
●
●
●
●
●
●
●
●
●
●
●
●
●
●
●
●
●
●
●
●
●
●
●
●
●
●
●
●
●
●
●
●
● ●
●
●
●●
●
●
●
●●
●
●
●
●
●
●
●
●
●
●
●
●
●●
●
●
●
●
●
●
●
●
●
●
●
●
●
●
●
●
●
●
●
●
●
●
●
●
●
●
●
●
●
●
●
●
●
●
●●
●
●
●
●
●
●
●
●
●
●
●
●
●
●
●
●
●
●
●
●
●
●
●
●
●
●
●
●
●
●
●
●
●
●
●
●
●
●
●
●
●
●
●
●
●
●
●
●
●
●
●
●
●
●
●
●
●
●
●●
●
●
●
● ●
●
●
●
●
●
●
●
●
●
●
●
●
●
●●
●
●
●
●
●
●
●
●
●
●
●
●
●
●
●
●
●
●
●
●
●
●
●
●
●●
●
●
●
●
●
●
●
●
●
●
●
●
●
●
●
●
●
●
●
●
●
●●
●
●
●
●
●
●●
●
●
●
●
●
●
●
●
●
●
●
●
●
●●
●
●
●
●
●
●
●
●●
●●
●
●
● ●
●
●
●
●
●
●
●
● ●
●
●
●
●
●
●
●
●
●
●
●
●
●
●
●
●
●
●
●
●
●
●
●
●
●
●
●
●
●●
●
●
●
●
●
●
●
●
●
●
●
●
●
●
●
●
● ●●
●
●
●● ●
●
●
●
●
●
●
●
●
●
●
●
● ●
●
●
●
● ●●
●
●
●
●
●
●
●
●
●
●
●
●
●
●
●
●
●
●
●
●
●
●●
●
●
●
●
●
●
●
●●
●●
●
●
●
●
●
●
●
●●
●
●
●
●
●
●
●●
●
●
●
●
●
●
●
●
●
●
●
●
●
●
●
●
●
●
●
●
●
●
●
●
●
●
●
●
●
●
●
●
●
●
●
●
●●
●
●
●
●
●
●
●
●
●
●
●●
●
●
●
●
●
●
●●
●
●
●
●
●
●
●
●
●
●
●
●
●
●
●
●
●
●
●
●
●
●
●
●
●
●
●
●
● ●
●
●
●
●
●
●
●
●
●
●
●
●
●
●
●
●
●
●
●
●
●
●●
●
●
●
●
●
●
●
●
●
●
●
●
●
●
●
●
●
●
●
●
●
●
●
●
●
●
●
●
●●
●
●
●
●
●
●
●
●
●
●
●
●
●
●
●
●
●
●
●
●
●
●
● ●
●
●
●
●
●
●
●
●
●
●
●
●
●
●
●●
●
●
●
●
●
●
●●●
●●
●
●
●
●
●
●
●
●●
●
●
●
●
●
●
●
●
●
●
● ●
●
●●
●
●
●
●
●
●
●
●
●
●
●
●
●
●
●●
●
●
●
●●
●
●
●
●
●
●
●
●
●
●
●
●
●
●
●
●
●
●
●
●
●
●●
●
●
●
●
●
●
●
●
●
●
●
●
●●
●
●
●
●
●
●
●
●
●
●
●
●
●●
●
●●
●
●
●
●
●
●
●
●
●
●
●
●
●
●
●
●●
●
●
●
●
●
●
●
●
●
●
●
●
●
●
●
●
●
●
●
●●
●
●
●
●
●
●●
●
●
●
●
●
●
●
●
●
●
●
●
●
●
●
●
●
● ●
●
●
●
●
●
●
●
●
●
●
●
●
●●
●
●●
●
●
●
●
●
●
●
●
●
●
●
●●
●
●
●
●
●
●
●
●
●
●
●
●●
●●
●
●
●
●
●
●
●
●
●
●
●
●
●
●
●
●
●
●
●
●
●
●
●
●
●
●
●
●
●
●
●
●
●
●
●
●
●
●
●
●
●
●
●
●
●
●
●
●
●
●
●
●
●
●
●
●
●●
●
●
●
●
●
●
●
●
●
●
●
●
●
●
●
●
●●
●
●
●
●
●
●
●
●
● ●
●
●
●
●
●
●●
●
●
●
●
●
●
●
●
●
●
●
●
●
●
●
●
●
●
●
●
●
●
●
●
●
●
●
●
●
●
●
●
●
● ●
●
●
●
●
●
●
●
●
●
●●
●
●
●
●
●
● ●
●
●
●●
●
●
●
●
●
●
●
●
●
●
●
●
●
●
●
●
●
●●
●
●
●
●
●
●●
●
●
●
●
●
●
●●
●
●
●
●
●
●
●
●
●●
●
●
●
●
●
●
●
●
●
●
●
●
●
●
●
● ●
●
●
●
●
●
●
●
●
●
●
●
●
●
●
●●
●
●
●
●
● ●
●
●●
●
●
●
●
●
●
●
●
●
●
●
●
●
●
●
●
●
●
●
●
●
●
●
●
●
●
●
●
●
●
●
●
●
●
●
●
●
●●
●●
●
●
●
●
●
●
●●
●
●
●
●
●
●
●
●
●
●
●
●
●
●
●
●
●
●
●
●
●
●
●
●
●
●●
●
●
●
●
●
●
●
●
●
●
●
●
●
●
●
●
●
●
●●
●
●● ●
●●
●
●
●
●
●
●
●
●
●
●
●
●●
●
●
●
●
●
●
●
●
●
●
●
●●
●
●
●
●
●
●
●
●
●
●
●●
●
●
●
●
●
●
●
●
●
●
●
●
●
●
●
●
●
●
●
●
●
●
●
●
●
●
●
●
●
●
●
●
●
●
●
●
●
●
●
●
●●
●
●
●
●
●
●
●
●
●
●
●
●
●
●
●
●
●
●
●
●
●
●●
●●
●
●
●
●
●
●
●
●
●
●
●
●
●
●
●
●
●
●
●
●
●
●
●
●
●
●
●
●
●●
●
●
●
●
●
●
●
●
●
●
●
●
●
●
●
●
●
●
●●
●
●
●
●
●
●
●
●
●
●
●
●
●
●
●
●
●
●
●
●
●
●●●
●
●
●
●
●
●
●
●
●
●
●
●
●
●
●
●
●
●
●
●
●
●●
●
●
●
●
●
●
●
●
●
●
●●
●
●
●
●
●
●
●
●
●
●
●
●
●
●
●
●
●
●
●
●
● ●
●
●●
●
●
●
●
●
●
●
●
●
●
●
●
●
●
●
●
●
●
●
●
●
●
●
●
●●
●
●
●
●
●
●
●
●
●
●
●
●
●
●
●
●
●
●
●
●
●
●
●
●
●
●
●
●
●
●●
●
●
●
●
●
●
●
●
●
●
●
●
●
●
●
●
●
●
●
●
●
●
●
●
●
●
●
●
●
●
●
●
●
●
●
●
●
●
●
●
●
●
●
●
●
●
●
●
●
●
●
●
●
●
●
●
●
●
●
●
●
●
●
●
●
●
●
●
●
●
●
●●
●
●
●
●
●
● ●
●
●
●
●●
●
●
●
●
●
●
●
●
●
●
●
●
●
●
●
●
●
●
●
●
●●
●
●
●●
●
●
●●
●
●
●
●
●
●
●
●
●
●
●
●
●
●
●
●
●
●
●●
●
●
●
●
●
●
●
●
●
●
●●
●●
●
●
●
●
●
●
●
●
●
●
●
●
●
●
●
●
●
●
●
●
●
●
●
●
●
●
●
●
●
●
●●
●
●
●
● ●
●
●
●●
●
●
●
●
●
●
●
●
●
●●
●
●
●
●
●
●
●
●
●
●
●
●
●
●
●
●
●
●
●
●
●
●
●
●
●
●
●
●
● ●
●●
●
●
●
●
●● ●
●
●
●
●
●
●
●
●
●
●
●
●
●
●
●
●
●
●
●
●
●
●
●
●
●
●
●
●
●
●
●
●
●
●
●
●
●
●
●
●
●
●
●
●
●
●
●
●●
●
●
●
●
●
●
●●
●
●
●
●
●
●
●
●
●
●
●
●
●
●●
●
●
●
●
●
●
●
●
●
●●
●
●
●
●
●
●
●
●
●●
●
●
●
●
●
●
●
●
●
●
●
●
●
●
●
●
●
●
●
●
●
●
●
●
●
●
●
●●
●
●
●
●
●
●
●
●
●
●
●
●
●
●
●
●
●
●
●
●
●
●
●
●
●
●
●
●
●
●
●
●
●
●
●
●
●
●
●
●
●
●
●
●
●
●
●
●
●
●
●
●
●
●
●
●●
●
●
●
●
●
●
●
●
●
●
●
●
●
●
●
●
●
●
●
●
●
●
●
●
●
●
●
●
●
●
●
●
●
●
●
●
●
●
●
●●
●
●
●
●
● ●
●
●
●
●
●
●
●
●
●
●
●
●
●
●
●
●
●
●
●
●
●
●
●
●
●●
●
●
●
●
●
●
●
●
●
●
●
●
●●
●
●
●●
●
●
●
●
●
●
●
●
●
●
●
●
●
●
●
●
●
●
●
●
●
●
●
●●
●
●
●
●
●
●●
●
●
●
●
●
●
●
●
● ●
●
●
●
●
●
●
●
●
●
●
●
●
●
●
●
●
●
●
●
●
●
●
●
●
●
●
●●
●
●
●
●
●
●
●
●
●
●
●
●
●
●
●
●
●
●●
●
●
●
●
●
●
●
●
●
●
●
●
●
●
●
●
●
●
●
●
●
●
●
●
●
●●
●
●
●
●
●
●
●
●
●
●
●
●
●
●
●●
●
●
●
●
●
●
●
●
●
●
●
●
●
●
●
●
●
●
●
●
●
●
●
●
●●
●
●
●
●
●
●
●
●
●
●
●
●
●
●
●
●
●
●
●
● ●
●
●
●
●
●
●
●
●
●
●
●●
●
●
●
●
●
●
●
●
●
●
●
●
●
●
●●
●
●
●
●
●
●●
●
●
●
●
●
●
● ●
●
●
●
●
●
●●
●
●
●
●
●
●
●
●
●
●
●
●
●
●
●
●
●
●
●
●
●
●
●●
●
●
●●
●
●
●
●
●
●
●●
●
●
●
●
●
●
●
●
●
●
●
● ●
●
●
●
●
●
●
●
●
●
●
●
●
●
●
●
●
●
●
●
●
●
●
● ●
●
●
●
●
●
●
●
●
●
●
●
●
●
●●
●
●
●
●
●
●
●
●
●
●
●
●
●
●
●
●
●
●
●
●
●
●
●
●
●
●
●
●
●
●
●
●
●
●
●
●
●
●
●
●
●
●
●●
●
●
●
●
●
●
●
●
●
●
●
●
●
●
●
●
●
●●
●
●
●●
●
●
●
●
●
●●
●
●
●
●
●
●
●
●
●
●
● ●
●
●
●
●
●
●
●
●
●
●
●
●
●
●
●
●
●
●
●
●
●
●
●
●
●
● ●●
●
●
●
●
●
●
●
●
●
●
●
●
●
●
●
●
●
●
●
●
●
●
●
●
●
●
●
●
●
● ●
●
●
●
●
●
●
●
●
●
●
●
●
●
●
●
●
●
●
●
●
●
●
●
●
●
●
●
●
●
●
●
●
●
●
●
●
●
●
●
●
●
●
●
● ●
●
●
●
●●
●
●
●
● ●
●
●
●
●
●
●
●
●●●
●
●
●
●
●
●
●
●
●
●
●
●
●
●
●
●
●
●●
●
●
●
●
●
●
●
●
●
●
●
●
●
●
●
●
●●
●
●
●
●
●
●
●
●
●
●
●
●
●
●
●
●
●
●
●
●
●
●
●
●
●
●
●
●
●
●
●
●
●
●
●
●
●
●
●
●
●
●
●
●
●
●
●
●
●
●
●
●●
●
●
●
●
●
●
●
●
●
●
●
●
●
●
●
●
●
●
●
●
●
●
●
●
●
●
●
●
●
●
●
●
●
●
●
●
●
●
●
●
●
●
●●
●
●
●
●
●
● ●
●
●
●
●
●
●●
●
●
●
●
●
●
●
●
●
●
●
●
●
●
●
●
●
●
●
●
●
●
●
●
●
●
●
●
●
●
●
●
●
●
●
●
●
●
●
●●
●
●
●
●
●
●
●
●
●
●
●
●
●●
●
●
●
●
●
●
●
●●
●
●
●
●
●
●
●
●
●
●
●
●
●●
●
●
●
●
●
●
●
●
●
●
●
●
●
●
●
●
●
●
●
●
●
●
●
●
●
●
●
●
●
●
●
●
●
●
●
●
●
●
●
●
●
●
●
●
●
●
●
●●
●
●
●
●
●
●
●
●
●
●
●
●
●
●
●
●
●
●
●
●
●
●
●
●
●
●
●
●
●
●
●●
●●
●
●
●
●
●
●
●
●
●
●
●
●
●
●
●
●
●
●
●
●
●
●
●
●
●
●
●
●
●
●
●
●
●
●
●
●
●
●
●
●●
●
●
●
●
●
●
●●
●
●
●
●●
● ●
●
●
●
●
●
●
●
●
●
●
●
●
●
●
●
●
●
●
● ●
●●
●
●
●
●
●
●
●
●
●
●
●
●
●●
●
●
●●
●
●
●
●
●
●
●
●
●●
●
●
●
●
●
●
●
●
●
●
●
●
●
●●
●
●
●
●
●
●
●
●
●
●
●
●
●
●
●
●
●
●
●
●
●
●
●
●
●
●
●
●
●
●
●
●
●●
●●
●
●
●
●
●
●
●
●
●
●
●
●
●
●
●
●●
●
●
● ●
●
●
●●
●
●
●
●
●
●
●
●
●
●●
●
●
●
●
●
●●
●
●
●
●●
●
●
●
●
●
●
●
●
●
●
●
●
●
●
●●
●
●
●
●
●
●
●
●
●
●
●
●
●
●●
●
●●
●
●●
●
●
● ●
●
●
●
●
●
●
●
●
●
●
● ●
●
●
●
●
●
●
●
●
●
●
●
●
●
●
●
●
●
●
●●
●
●
●
●
●
●
●
●
●
●
●
●
●
●
●
●
●
●
●
●
●
●
●
●
●
●
●
●
●
●
●
●
●
●
●
●
●
●
●
●
●
●
●
●
●
●
●
●
●
●
●
●
●
●
●
●
●
●
●
●
●
●
●
●
●
●
●
●●
●
●
●
●
●●
●
●
●
●
●
●
●
●●
●
●
●
●
●
●
●
●
●
●
●
●
●
●
●
●
●
●
●
●
●
●
●
●
●
●
●
●
●
●
●
●
●
●
●
●
●
●
●
●
●
●
●
●
●
●
●
●
●
●
●
●
●
●
●
●
●
●
●
●
●
●●
●
●
●
●
●
●●
●
●
●
●
●
●
●
●
●
●●
●
●
●●
●
●
●
●
●
●
●
●
●
●
●
●
●
●●
●
●
●
●
●
●
●
●
●
●
●
●
●
●
●
●
●
●
●
●
●
●
●
●
●●
●
●
●●
●
●
●
●
●
●
●
●
●
●
●
●
●
●
●
●
●
●
●
●
●
●
●
●
●
●●
●
●
●
●●
●
●
●
●
●
●
●
●
●
●
●
●
●
●
●
●
●
●
●
●
●
●
●
● ●
●
●
●
●
●
●
●
●
●
●
●
●
●
●
●
●
●
●
●
●
●
●
●
●
●
●
●
●
●
●
●
●
●
●●
●
●●
●
●
●
●
●
●
●
●
●
●
●
●
●●
●
●
●
●
●
●
●
●
●
●
●
●
●
●
●
●
●●●
●
●
●
●
●
●
●
●
●●
●
●
●
●
●
●
●
●●
●
●
●
●
●
●
●
●
●
●
●
●
●
●
●
●
●
●
●
●
●
●
●
●
●
●
●
●
●
●
●
●
●
●
●
●
●
●
●
●
●
●
●
●
●
●
●
●
●
●
●
●
●
●
●
●
●
●
●
●
●
●
●
●
●
●
●
●
●
●
●
●
●
●
●
●
●
●
●
●
●
●
● ●
●
●
●
●
●
●
●
●
●
●
●
●
●
●
●
●
●
●●
●
●
●
●
●
●
●
●
●
●●
●
●
●
●
●
●
●
●
●
●
●
●
●
●
●
●
●
●
●
●
●
●
●
●
●
●
●
●
●
●
●
●
●
●
●
●
●
●
●
●
●
●
●
●
●
●
●
●
●
●
●
●
●
●
●
●
●
●
●
●
●
●
●
●
●
●
●
●●
●
●●
●
●
●●
●
●
●
●
●
●
●
●
●
●
●
●
●
●
●●
●
●
●
●
●
●
●
●
●
●
●
●
●
●
●
●
●
●
●
●
●
●
●
●
●
●
●
●
●
●●
●
●
●
●
●
●
●
●
●
●
●
●
●
●
●
●
●
●
●
●
●
●
●●
●
●
●
●
●
● ●
●
●
●
●
●
●
●
●
●
●
●
●
●
●
●
●
●
●
●
●
●
●
●
●
●●●
●
●
●
●
●
●
●
●
●
●
●
●
●
●
●
●
●
●
●
●
●
●
●
●
●
●
●
●
●
●
●
●
●●
●
●
●
●
●
●
●
●
●
●●
●
●
●
●
●
●
●
●
●
●
●
●
●
●
●
●
●
●
●
●
●
● ●
●
●
●
●
●
●
●
●
●
●
●
●
●
●●
●
●
●
●
●
●
●
●
●
●
●
●
●
●
●
●
●
●
●
●
●
●
●
●
●
●
●
●
●
●
●
●
●
●
●
●
●
●
●
●
●
●
●
●
●
●
●
●
●
●
●
●
●
●
●
●
●
●
●
●
●
●
●
●
●
●
●
●
●
●
●
●
●
●●
●●
●
●●
●
●
●
●
●
●
●
●
●
●
●
●
●
●
●
●
●
●
●
●
●
●
●●
●
●
●
●
●
●
●
●
●
●
●
●
●
●
●
●
●
●
●
●
●
●
●
●
●
●● ●
●
●●
●
●●
●
●
●
●
●
●
●
●
●
●
●
●
●
●
●
●
●
●
●
●
●
●
●
●
●
●
●
●
●
●
●
●●
●
●
●●
●
●
●
●
●
●
● ●
●
●
●
●●
●
●
●
●
●
●
●
●
●
●
●
●
●
●
●
●
●
●
●
●
●
●
●
●
●
●
●
●
●
●
●
●
●
●
●
●
●
●
●
●●
●
●
●
●
●
●
●
●
●
●
●●
●
●
●
●
●
●
●
●
●
●
●
●●
●
●
●
●
●
●
●
●
●
●●
●
●
●
●
●
●●
●
●
●
●
●
●
●
●
●
●
●
●
●
●
●
●
●
●
●●
●
●
●
●
●
●
●
●
●
●
●
●
●
●
●
●
●
●
●
●
●
●
●
●
●
●
●
●
●
●
●
●
●
●
●
●
●
●
●
●
●
●
●
●
●
●
●
●
●
●
●
●
●
●
●
●
●
●
●
●
●
●
●
●
●
●
●
●
●
●
●
●
●
●
●
●
● ●
●
●
●
●
●
●
●
●
●
●
●
●
●
●
●
●
●
●
●
●
●●
●
●●
●
●
●
●
●
●
●
●
●
●
●
●
●
●
●
●
●
●
●
●
●
●
●
●
●
●
●
●
●
●
●
●
●
●
●●
●
●
●
●
●
●
●
●
●
●
●
●
●
●
●
●
●
●
●
●
●
●
●●
●●
●
●
●
●
●
●
●
●
●
●
●
●
●
●
●
●
●
●
●●
●
●
●
●
●
●
●
●
●
●
●
●
●
●
●
●
●
●
●
●
●
●
●
●
●
●
●
●
●
●
●
●
●
●
●
●
●●
●
●
●
●
●
●
●
●
●
●
●
●
●●
●
●
●
●
●
●
●
●
●
●
●
●
●
●
●
●
●
●
●
●
●
●
●
●
●
●
●
●
●
●
●
●
●
●
●
●
●
●
●
●
●
●
●
●
●
●
●
●
●
●
●
●
●
●
●
●
●
●
●
●
●
●
●
●
●
●
●●
●
●
● ●
●
●
●
●
●
●
●
●●
●●
●
●
●
●
●
●
●
●
●
●
●
●
●●
●
●
●
●
●
●
●
●
●
●
●
●
●
●
●
●
●
●
●
●●
●
●
● ●
●
●
●
●
●
●
●●
●
●
●
●
●
●
●
●
●
●
●
●
●
●
●
●
●
●
●
●
●
●
●
●
●
●
●
●
●
●
●
●
●
●
●
●
●
●
●
●
●
●
●
●
●
●
●
●
●
●
●
●
●
●
●
●
●
● ●
●
●
●
●
●
●
●
●
●
●
●
●
●
●●
●
●
●
●
●
●
●
●
●
●
●
●
●
●
●
●
●
●
●
●
●
●
●
●
●
●
●
●
●
●
●
●
●
●
●
●
●
●●
●
●
●
●
●
●
●
●
●
●
●
●
●●
●
●
●
●
●
●
●
●
●
●
●
●●
●●
●
●
●
●
●
●
●
●
●
●
●●
●
●
●
●
●
●
●
●
●
●
●
●
●●
●
●
●
●
●●
●
●
●
●
●
●●
●
●
●
●
●
●
●
●●
●
●
●
●
●
●
●
●
●
●
●
●
●
●
●
●●
●
●
●●
●
●
●
●
●
●
●
●
●
●
●
●
●
●
●
●
●
●
●
●
●
●
●
●
●
●
●
●
●
●
●
●
●
●
●●
●
●●
●
●
●
●
●
●
●
●
●
●
●
●
●
●
●
●
● ●
●
●
●
●
●
●
●
●
●
●
●
●
●
●
●
●●
●
●
●
●
●
●
●
●
●
●
●
●
●
●
●
●
●
●
●
●
●●
●
●
●
●
●
●
●
●
●
●
●
●
●
●
●
●
●
●●
●
●
●
●
●
●
●
●
●
●
●
●
●
●
●
●
●
●
●
●
●
●
●
●
●
●
●
●
● ●
●
●
●
●
●
●
●
●
●
●
●
●
●
●
●
● ●●
●
●
●
●
●
●
●
●
●
●
●
●
●
●
●
●
●
●
●
●
●
●
●
●
●
●
●
●
●
●
●
● ●
●
●
●
●
●
●●
●
●
●
●
●
●
●
●
●
●
●●
●
●
●
●
●
●
●
●
●
●
●
●
●
●
●
●
●
●
●
●
●
●
●
●
●
●
●
●
●
●
●
●
●
●
●
●
●
●
●●
●
●
●
●
●
●
●
●
●
●
●
●
●●
●
●
●
●
●
●
●
●
●
●
●●
●
●
●
●
●
●
● ●
●
●
●
●
●
●
●
●
●
●
●
●
●
●
●
●
●
●
●
●
●
●
●
●
●
●
●
●
●
●
●
●
●●
●
●
●●
●
●
●
●
●
●
●
●
●
●
●
●
●
●
●
●
●
●
●
●
●
●
●
●
● ●
●
●
●
●
●
●
●
●
●
●
●
●
●
●
●
●
●
●
●
●●
●
●
●
●
●
●
●
●
●
●
●
●
●
●
●
●
●
●
●
●
●●
●●
●
●●
●
●
●
●
●
●
●
●
●
●
●
●
●
●
●
●
●
●
●
●
●
●
●
●●
●●
●
●
●
●●
●
●
●
●
●
●
●
●
●
●
●
●
●
●
●
●
●
●
●
● ●
●
●
●
●●
●
●
●
●
●
●
●
●
●
●
●
●
●
●
●
● ●
●
●
●●
●
●
●
●
●
●
●
●
●●
●
●
●
●
●
●
●
●
●
●
●
●
●
●
●
●
●
●
●
●
●
●●
●
●
●
●
●
●
●
●
●
●
●
●
●
●●
●
●
●
●
●
●●
●
●
●
●
● ●
●
●
●
●
●
●
●
●
●
●
●
●
●
●
●
●
●
●
●
●●
●
●
●
●
● ●
●
●
●
●
●
●
●
●
●
●
●
●
●
●
●
●
●
●
●
●●
●
●
●
●
●
●
●
●
●
●
●
●
●
●
●
●
●
●
●
●
●
●●
●
●
●
●
●
●
●
●
●
●
●
●
●
●
●
●
●
●
●
●
●
●
●
●
●
●
●
●
●
●
●
●
●
●
●
●
●
●
●
●
●
●
●
●
●
●
●
●
●
●
●
●
●
●
●
●
●
●
●
●
●
●
●
●
●
●
●
●
●
●
●
●
●
●
●
●
●
●
●
●
●●
●
●
●
●
●
●●
●
●
●
●
●
●
●
●
●
●
●
●
●
●
●
●
●
●
●●
●
●
●
●
●
●
●
●
●
●
●
●
●
●
●
●
●
●
●
●
●
●
●
●
●
●
●
●
●
● ●
●
●
●
●
●
●
●
●
●
●
●
●
●
●
●
●
●
●
●
●
●
●
●
●
●
●
●
●
●
●
●
●
●
●
●
●
●
●
●
●
●
●
●
●
●
●●
●
●
●
●
●
●
●
●
●
●
●
●
●
●
●
●
●
●
●
●
●
●
●
●
●
●
●
●●
●●
●
●
●
●
●
●
●●
●
●
●
●
●
●
●
●
●
●
●
●
●
●
●
●
●
●
●
●●
●
●
●
●
●
●
●
●
●
●
●
●
●
●●
●
●
●
●
●
●
●
●
●
●
●
●
●
●
●
●●
●
●
●
●
●
●
●
●
●
●
●●
●
●
●
●
●
●
●
●
●
●
●
●
●
●
●
●
●
●
●
●
●
●
●
●
●
●
●
●
●
●
●
●
●●
●
●
●
●
●
●
●
●
●
●
●
●
●
●
●
●
●
●
●
●
●
●
●
●●
●
●
●●
●
●
●
●
●
●
●
●
●
●
●
●
●
●
●
●
●
●
●
●
●
●
●
●
●
●
● ●
●●
●
●
●
●
●
●
●
●
●
●
●
●
●
●
●
●
●
●
●
●
●
●
●
●
●
●
●
●
● ●
●
●
●
●
●
●
●
●
●
●
●
●
●
●
●
●
●
●
● ●
●●
●
●
●
●●
●
●
●
●
●
●
●
●
●
●
●
●
●
●
●
●
●
●
●
●
●
●
●
●
●
●
●
●
●●
●
●
●
●●
●
●
●
●
●
●
●
●
●
●
●
●●
●
●
●
●
●
●
●
●
●
● ●
●
●
●
●
●
●
●●
●
●
●
●
●
●●
●
●
●
●
●
●
●
●
●
●
●
●
●
●
●
●
●
●
●
●
●
●
●
●
●
●
●
●
● ●
●
●
●
●
●
●
●
●
●●●
●●
●
●
●
●
●
●
●
●
●
●
●
●
●
●
●
●
●
●
●
●
●
●
●
●
●
●
●
●
●
●
●
●
●
●
●
●
●
●
●
●
●
●
●
●●
●
●
●
●
●
●
●
●
●
●
●
●
●
●
●
●
●
●
●
●
●
●
●
●
●
●
●
●
●
●
●
●
●
●●
●
●
●
●
●
●
●
●
●
●
●
●
●
●
●
●
●
●
●
●
●
●
●
●
●
●
●
●
●
●●
●●
●
●
●
●
●
●
●
●
●
●
●
●
●
● ●
●
●
●
●
●
●●
●
●
●
●
●
●
●
●
●
●
●
●
●
●●
●
●
●
●
●
●
●
●
●
●
●
●
●
●
●
●
●
●
●
●
●
●
●
●
●
●
●
●
●
●
●
●
●●
●
●
●
●
●
●
●
●
●
●
●●
●
●
●
●
●
●
●
●
●
●
●
●
●
●
●●
●
●
●
●
●
●
●
●
●
●
●
●
●
●
●
●
●●
●
●
●
●
●
●
●
●
●
●
●
●●
●
●
●
●●
●
●
●
●
●
●●
●
●●
●
●
●
●
●
●
●
●
●
●
●
●
●
●
●
●
●
●
●
●
●
●
●
●
●
●
●
●●
●
●
● ●
●
●
●●
●
●
●
●
●
●
●
●
●
●
●
●
●
●
●
●
●
●
●
●
●
●
●
●
●
●
●
●
●
● ●
●
●
●
●
●
●
●●
● ●
●
●
●
●
●
●
●
●●
●
●
●
●
●
●
●
●
●
●
●
●
●
●
●
●
●
●
●
●
●
●
●
●
●
●●
●
●
●
●
●
●
●●
●
●
●
●
●
●
●
●
●
●
●
●
●
●
●
●●
●
●
●
●
●
●
●●
●
●
●
●
●
●
●
●
●
●
●
●
●
●
●
●
●
●●
●
●
●
●
●
●
●
●
●
●
●
●
●
●
●
●
●
●●
●
●
●
●
●
●
400
600
800
−2 0 2 4Latent Ability
EN
LAC
E S
core treatment
●
●
●
●
C
T1
T2
T3
Latent Ability vs. ENLACE Score, 6th Semester 2011
FIGURE 4. Latent ability vs. preprogram score
Then the index GBTi j is computed as the probability of hi j matches or more given that the set ofquestions in the exam is Q:
GBTi j = ∑{Q′⊆Q:|Q′|≥hi j}
(∏
q∈Q′Pi jq ∏
q′ /∈Q′(1−Pi jq′)
).
Students i and j are classified as having one of them copied from the other, with α probability ofaccusing an innocent pair, if GBTi j ≤ α. Note that, unlike ω, GBT treats both students symmetri-cally.
As an illustration, Figure 4 plots latent ability for 12th grade students in 2010-11, accordingto an NRM estimation, against their pre-program, 9th grade ENLACE score. It provides someexternal validity to the NRM estimation that the estimated ability is in fact well correlated with thescore in a baseline exam carried out preprogram.
An important variable is the statistical threshold employed to detect cheating. Since each studentbelongs to many pairs as a potential source and as a potential copier, the probability of a falsepositive increases substantially at the student level. The results of the tests applied to differentpotential pairs for one given student are possibly not independent, however, so it is not usefulto simply compound α. To handle this problem, we exploited the fact that the same exam wasadministered across classrooms, whilst answer copying is (precluding the use of electronic devises)likely confined to pairs of students in the same classroom. We tested for cheating every pair ofstudents in the same school, and raised the threshold for accusing a given pair to the point whereonly 10% of students are accused of cheating in the control group because of an unusual similaritywith a student in a different classroom. We consider only possible pairs within the same school forcomputational reasons.
Figure 5 illustrates our procedure for choosing α. In the top figure we consider all 12th gradestudents in the teacher and students incentive group in 2010-11. The horizontal axis shows de-creasing values of α. For the different values of α, we depict the percentage of students who areaccused of cheating because of an unusual similarity with another student in the same classroom,
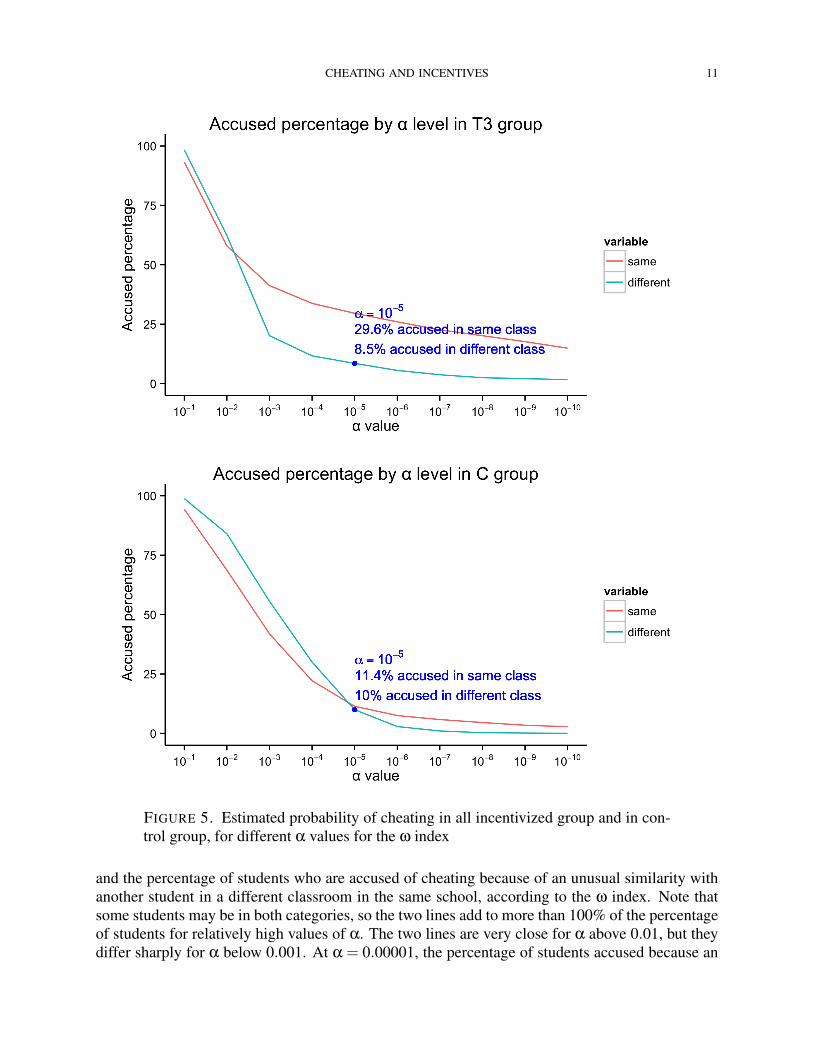
CHEATING AND INCENTIVES 11
FIGURE 5. Estimated probability of cheating in all incentivized group and in con-trol group, for different α values for the ω index
and the percentage of students who are accused of cheating because of an unusual similarity withanother student in a different classroom in the same school, according to the ω index. Note thatsome students may be in both categories, so the two lines add to more than 100% of the percentageof students for relatively high values of α. The two lines are very close for α above 0.01, but theydiffer sharply for α below 0.001. At α = 0.00001, the percentage of students accused because an

CHEATING AND INCENTIVES 12
unusual similarity with a student in the same classroom is 29.6%, while the percentage of studentsaccused exclusively because an unusual similarity with a student in a different classroom is 8.5%.Further lowering α does not help in distinguishing between the two categories. In the figure onbottom we repeat the exercise but considering the control group. As expected, since there are noincentives for cheating, the two lines are much closer. At α = 0.00001, the percentage of studentsaccused because an unusual similarity with a student in the same classroom is 11.4%, while thepercentage of students accused exclusively because an unusual similarity with a student in a dif-ferent classroom is 10%. We take the latter percentage as an approximation to the percentage ofstudents erroneously accused of cheating. (Note that the figure on top suggests a lower probabilityof error of this kind.)
A potential difficulty for the estimation of the parameters of the NRM was the fact that examconditions were different for the control and the treatment groups, given the different incentiveschemes. To assess this problem, we re-estimated the parameters ζ j, λ j using only the controlgroup, and used these estimates to recalculate latent ability for the students in the treatment groups.We then computed the statistical indices ω and GBT, and compared the classification of studentsbetween cheaters and non cheaters for different α values with those obtained when all parame-ters are estimated jointly. The results came out very similar, classifying almost exactly the sameindividuals as cheaters. Thus, we use both the control and treatment groups to estimate jointlyitem parameters and the latent ability of individuals. We observed little difference overall betweenusing the ω index and using the GBT index. We settled in using the ω index with a threshold valueof 0.00001, and calculating item response parameters and individual talent using both the controlgroup and the treatment groups.6
For most pairs of students, it made little difference who was assumed to be the copier and whowas assumed to be the source. As discussed above, the statistical detection of copying relies on theexistence of an unusual similarity between the answers to the exam of a given student, the putativecopier, and those of another student in the same classroom, the putative source, given the former’slatent ability, as estimated using the student’s exam answers. Unfortunately, if a student copiesthoroughly from another student, the estimated latent ability for both will be very similar, and theω test will report that they are copying from each other. For similar reasons, if several students arecopying from the same source, and they are more or less thorough, the ω test will report that theyare copying from each other. As a consequence of this, we can identify (likely) cheaters in the data,but we cannot distinguish copiers from sources. Similarly, we can identify sets of students whoare likely to be active cheating components of the classroom network, but we cannot reasonablyascertain who is the source for each component. Note that we can use the baseline ENLACE examto make an initial classification of cheaters into sources and copiers for isolated pairs of cheaters,but we cannot do that for larger connected components of the cheating network.
3.3. Cheating in the ALI experiment. Table 1 provides aggregate results from the statisticalcheating analysis. The table reports the percentage of students who were members of at least onecheating pair for the cohort that went three years through the program. This cohort began in 10thgrade in the ALI program in the 2008-09 year and completed 12th grade in the ALI program in the2010-11 year. As already mentioned, this is the only cohort we observe during all three years of theprogram and thus have longitudinal data on tests scores and cheating over this time. The estimatedpercentage of cheaters in the control group varied between 5% and 7.5%, depending on the year.
6In Behrman et al. (2014) the method used to identify cheaters was Wesolowsky (2000). The results of that analysisare consistent with ours in terms of the extent of cheating and its distribution across schools and classrooms.

CHEATING AND INCENTIVES 13
TABLE 1. Cheating in ALI by treatment group
Fraction of students involved in cheating1st year 2nd year 3rd year
10th grade 11th grade 12th gradeNo incentives 7.223 5.135 7.506
Student incentives 11.323 26.687 29.693Difference in means −4.099*** −21.551*** −22.187***
(0.227) (0.318) (0.362)Teacher incentives 7.356 8.969 9.599Difference in means −0.133 −3.834*** −2.093***
(0.180) (0.167) (0.232)All incentivized 7.347 23.510 31.878Difference in means −0.123 −18.375*** −24.372***
(0.177) (0.378) (0.439)
Observations 11,530 11,530 11,530
Note: Statistical differences in means are with respect to No incentivesgroup. Standard errors in parentheses; ∗∗∗p < 0.01, ∗∗p < 0.05, ∗p < 0.1.
In the student incentives group, the estimated percentage of cheaters increased from about 11.3%the first year to nearly 30% the third. Similarly, in the group that received incentives for teachersand students, the estimated percentage of cheaters increased from around 7.4% to nearly 32%. Theestimated percentage of cheaters in the teacher incentive group, per contra, barely increased fromaround 7.4% the first year to about 9.6% the third.
The aggregate estimates in Table 1 are reliable insofar as both types of errors, accusing innocentstudents and not accusing cheating students, roughly cancel out. Recall that our statistical analysisaims at a probability of accusing falsely a student of approximately 10%. A more conservativestance would entail disregarding the possibility of not accusing cheating students, and recalculatingTable 1 taking into account the probability of accusing falsely a student. If the fraction of accusedindividuals for a given treatment and year is z, a conservative estimate z can be derived fromz+0.1(1− z) = z for z > 0.1 and z = 0 for z≤ 0.1, yielding z = max{0,(z−0.1)/0.9}. From thisconservative viewpoint, cheating in the control group and in the teacher incentives group may havebeen close to zero through out the program. Cheating in the student incentive group, per contra,went from around 1.5% the first year to nearly 19% the second year to nearly 22% the third year.Similarly, cheating in the teacher and student incentives group went from close to nil to about 15%the second year to about 24% the third year. That is, even from this viewpoint, incentives had avery large effect on cheating, and the effect compounded with experience in the program.
4. EMPIRICAL ANALYSIS OF INDIVIDUAL CHEATING BEHAVIOR
4.1. Descriptive analysis. In Table 2 we compare the characteristics of cheaters with those ofother students in the cohort that was three years in the program, from 10th to 12th grade, where wedefine as a cheater any student who was a member of at least one cheating pair in any year through

CHEATING AND INCENTIVES 14
TABLE 2. Descriptive Analysis
Cheaters Non cheaters All studentsAge 15.265 15.365 15.335
(0.867) (0.891) (0.885)Gender (female = 1) 0.483 0.474 0.477
(0.500) (0.499) (0.499)Family members 3.906 3.976 3.966
(1.116) (1.149) (1.144)Monthly household income: 2000 to 4000 pesos 0.322 0.306 0.311
(0.467) (0.461) (0.463)Monthly household income: 4000 to 8000 pesos 0.169 0.137 0.147
(0.374) (0.343) (0.354)Monthly household income: more than 8000 pesos 0.110 0.071 0.083
(0.313) (0.256) (0.276)Have internet 0.204 0.128 0.152
(0.403) (0.334) (0.359)Three or four books at home 0.283 0.248 0.259
(0.451) (0.432) (0.438)Five or more books at home 0.119 0.084 0.095
(0.324) (0.278) (0.294)Mother with secondary education 0.313 0.318 0.316
(0.464) (0.466) (0.465)Mother with high school or technical education 0.208 0.155 0.171
(0.406) (0.362) (0.377)Mother with college or more 0.120 0.071 0.086
(0.324) (0.256) (0.280)Father with secondary education 0.284 0.291 0.289
(0.451) (0.454) (0.453)Father with high school or technical education 0.203 0.172 0.182
(0.402) (0.378) (0.386)Father with college or more 0.185 0.103 0.129
(0.388) (0.304) (0.335)I have a positive attitude1 0.915 0.898 0.903
(0.279) (0.303) (0.296)I believe I am a failure1 0.081 0.086 0.084
(0.273) (0.280) (0.278)I am at least as capable as most people1 0.930 0.924 0.926
(0.256) (0.264) (0.262)Hang out with friends often 0.090 0.073 0.078
(0.286) (0.260) (0.269)Have scholarship 0.284 0.347 0.328
(0.451) (0.476) (0.469)Baseline score 0.190 −0.081 0.000
(1.068) (0.958) (1.000)ALI math score 47.008 41.807 43.373
(12.675) (11.199) (11.904)Observations 3,471 8,059 11,530
Note: Cheaters defined as those students that cheated at least once during the three years. Standarderrors in parenthesis. 1Dummy variable where 1 means agree and 0 disagree with the statement.

CHEATING AND INCENTIVES 15
TABLE 3. Determinants of cheating
Marginal effects from logit of cheating10th graders 11th graders 12th graders
1 2 3 4 5 6Student incentives 0.031*** 0.025*** 0.221*** 0.214*** 0.223*** 0.217***
(0.007) (0.007) (0.010) (0.010) (0.010) (0.010)Teacher incentives −0.001 −0.002 0.073*** 0.073*** 0.037*** 0.034***
(0.008) (0.008) (0.012) (0.012) (0.013) (0.013)All incentivized −0.006 −0.007 0.201*** 0.203*** 0.238*** 0.240***
(0.008) (0.008) (0.011) (0.011) (0.010) (0.010)Baseline score 0.018*** 0.003 0.033*** 0.028*** 0.024*** 0.014
(0.003) (0.005) (0.003) (0.009) (0.004) (0.009)Score×student incentives 0.028*** 0.025** 0.036***
(0.007) (0.011) (0.011)Score×teacher incentives 0.007 −0.007 0.027**
(0.008) (0.013) (0.014)Score×All incentivized 0.014* −0.016 −0.023**
(0.008) (0.011) (0.011)Age −0.024 −0.023 −0.017 −0.013 −0.049** −0.044**
(0.015) (0.015) (0.019) (0.019) (0.019) (0.019)Age squared 0.002 0.002 0.002 0.001 0.006** 0.005**
(0.002) (0.002) (0.002) (0.002) (0.002) (0.002)Gender (female = 1) −0.012** −0.012** 0.010 0.010 −0.001 −0.002
(0.005) (0.005) (0.007) (0.007) (0.007) (0.007)Family members −0.001 −0.001 −0.002** −0.002** −0.002** −0.002**
(0.001) (0.001) (0.001) (0.001) (0.001) (0.001)Monthly household income: −0.003 −0.003 0.012 0.013 0.019** 0.020**2000 to 4000 pesos (0.007) (0.007) (0.009) (0.009) (0.009) (0.009)Monthly household income: −0.009 −0.010 0.031*** 0.032*** 0.005 0.0054000 to 8000 pesos (0.009) (0.009) (0.011) (0.011) (0.012) (0.012)Monthly household income: 0.009 0.007 0.015 0.015 0.013 0.013more than 8000 pesos (0.011) (0.011) (0.014) (0.014) (0.015) (0.015)Have internet 0.003 0.003 0.018* 0.019* 0.017 0.019*
(0.008) (0.008) (0.010) (0.010) (0.011) (0.011)3 or 4 books at home 0.005 0.005 0.017** 0.017** 0.000 0.000
(0.007) (0.007) (0.008) (0.008) (0.009) (0.009)5 or more books at home −0.001 −0.003 0.009 0.007 0.027** 0.026**
(0.010) (0.010) (0.012) (0.012) (0.013) (0.013)Mother with secondary 0.014* 0.014* 0.009 0.009 0.003 0.003education (0.007) (0.007) (0.009) (0.009) (0.010) (0.009)Mother with high school 0.029*** 0.029*** 0.030*** 0.031*** 0.008 0.01or technical education (0.009) (0.009) (0.011) (0.011) (0.012) (0.012)Mother with college 0.033*** 0.034*** 0.030** 0.032** 0.026* 0.027*or more (0.011) (0.011) (0.015) (0.015) (0.016) (0.016)Father with secondary 0.021*** 0.020*** 0.012 0.011 0.002 0.001education (0.008) (0.008) (0.009) (0.009) (0.010) (0.010)Father with high school 0.022** 0.021** 0.009 0.007 0.041*** 0.039***or technical education (0.009) (0.009) (0.011) (0.011) (0.012) (0.012)Father with college 0.030*** 0.029*** 0.037*** 0.034*** 0.066*** 0.063***or more (0.011) (0.011) (0.013) (0.013) (0.014) (0.014)I have a positive attitude1 0.000 −0.001 0.016 0.016 0.007 0.007
(0.010) (0.010) (0.013) (0.013) (0.014) (0.013)continues next page

CHEATING AND INCENTIVES 16
TABLE 3 continues:
I believe I am a failure1 −0.022* −0.021* 0.007 0.007 −0.010 −0.011(0.012) (0.012) (0.013) (0.013) (0.014) (0.014)
I am at least as capable 0.020 0.020 0.009 0.010 −0.007 −0.005as most people1 (0.013) (0.012) (0.014) (0.014) (0.015) (0.015)Hang out with friends often 0.014 0.015 0.021* 0.023* 0.012 0.015
(0.010) (0.010) (0.012) (0.012) (0.014) (0.014)Have scholarship −0.011* −0.01 −0.01 −0.01 −0.011 −0.011
(0.006) (0.006) (0.008) (0.008) (0.008) (0.008)Observations 11,530 11,530 11,530 11,530 11,530 11,530
Notes: Standard errors in parentheses; ∗∗∗p < 0.01, ∗∗p < 0.05, ∗p < 0.1. 1Dummy variable where 1 meansagree and 0 disagree with the statement.
the program. Table 2 suggests that those students who cheat are somewhat better off economi-cally than their non-cheating counterparts and more likely to live in smaller families. Cheatersare also more likely to report hanging out with friends frequently, and have in average a higherbaseline score (i.e. the ENLACE 9th grade math score). Overall, this initial picture suggests thatthose engaging in cheating have a somewhat more privileged family background and greater socialnetworks.
4.2. Determinants of cheating behavior. In Table 3, we report marginal effects (percentagepoints) of the different treatments, of the baseline score, and of the personal characteristics andfamily background of the student, on the probability of the student being detected as a cheater, ob-tained from logit regressions. The marginal effects are taken with respect to the control treatment(no incentives). We restrict our analysis to students who remain in the cohort of reference the threeyears of the program. Columns 1, 3 and 5 report the results for this cohort as it went through 10th,11th, and 12th grade. Columns 2, 4 and 6 report again the results for this cohort, but includinginteraction terms between the baseline score and the different incentive treatments.
We find that student incentives significantly increase the probability of cheating. The marginaleffect of student incentives on the probability of cheating is 3 percentage points in the first yearin the program and around 22 percentage points in the second and third year, an increase thatlikely reflects the accumulation of experience in cheating as well as the credibility of the incentiverewards associated to the program. Similarly, the marginal effect of student and teacher incentivesis nearly nil the first year of the program but in the range of 20 to 24 percentage points in thesecond and third year. Teacher incentives alone have a much lower marginal effect of cheating, nilthe first year and between 3 and 7 percentage points the second and third year.
Recall that the baseline score is included as a proxy of ability. A higher baseline score alsoreduces incentives to copy (see Table 8 in the Appendix), so any positive impact of this score onthe probability of cheating is likely due to sources in cheating. We find that the effect of the baselinescore is positive and statistically significant, for the score itself and especially for the interactionof the score with student incentives. This last result supports the hypothesis that better studentsare drafted as sources when incentives are high. The interaction term between baseline score andincentives for students and teachers is near zero or has the wrong sign, which suggests even lowercosts of communication for this treatment. Even though the exam was proctored by staff from theSecretariat of Public Education, the fact that the school administrators and teachers had a stake inthe performance of the students may have had an impact on the cost of communication, perhapsvia a reduced stigma of copying or a reduction of expected costs of unrelated to monitoring.

CHEATING AND INCENTIVES 17
FIGURE 6. Probability of cheating by pre-program achievement, from top to bot-tom: 10th graders, 11th graders and 12th graders

CHEATING AND INCENTIVES 18
TABLE 4. Persistence of cheating
Marginal effects from logit of cheating11th graders 12th graders
Cheating prior school year 0.208*** 0.224***(0.020) (0.022)
Student incentives 0.223*** 0.169***(0.012) (0.011)
Teacher incentives 0.078*** 0.035***(0.014) (0.013)
All incentivized 0.210*** 0.184***(0.012) (0.011)
Cheating prior school year×student incentives −0.058** −0.039(0.025) (0.025)
Cheating prior school year×teacher incentives −0.021 −0.071**(0.029) (0.031)
Cheating prior school year×all incentivized −0.047* −0.014(0.027) (0.026)
Baseline score 0.028*** 0.013***(0.003) (0.003)
Observations 11,530 11,530
Notes: Standard errors in parentheses; ∗∗∗p < 0.01, ∗∗p < 0.05, ∗p < 0.1. Controlvariables include the same personal and family characteristics included in Table 2.
In the first year of the program, when there is less experience cheating, some personal charac-teristics seem to be influential in the decision to cheat, including being male, and having high self-esteem (as measured by answers to attitudinal questions). Personal characteristics have a smallerimpact on the probability of cheating the second and third year, except for parental education whichmay be related to ability.
To illustrate further the relationship between ability, incentives, and cheating, we plot in Figure 6the relationship between the baseline score and the probability of engaging in cheating by treatmentgroup in 10th grade, 11th grade and 12th grade. It is noteworthy that the relationship is basicallyflat with a slightly downward slope for the control group and for the teacher incentives group,indicating that higher levels of pre-program achievement are associated with constant or lowerprobabilities of cheating. For the student incentive group and for the teacher and student incentivegroup, instead, the relationship is strongly positive. That is less so for the teacher and studentincentive group in 12th grade, but for this incentive treatment, cheating in 12th grade seem toinclude a large fraction of students. As illustrated by the example in the previous section, incentivesappear to draw higher ability students as sources for cheaters.
4.3. Persistence of cheating. We also look at the persistence of cheating and the relationship withincentives. In Table 4 we report marginal effects (percentage points) of the different determinantsof cheating, including now cheating the previous year for the second and third year in the programof the cohort that began in 10th grade in the ALI program in the 2008-2009 year. We includeas controls the same personal and family characteristics from Tables 2 and 3. Table 4 showsthat there is substantial correlation in cheating over time although there is still movement in andout of cheating over time. We include in the estimation interaction terms between cheating theprevious year and incentive treatments; these generally come up as negative, reflecting a much

CHEATING AND INCENTIVES 19
TABLE 5. Classrooms by year and treatment
Number of classrooms (and students per classroom)10th graders 11th graders 12th graders
No incentives 169 (33) 164 (28) 156 (26)Student incentives 125 (35) 122 (32) 122 (28)Teacher incentives 120 (33) 110 (30) 105 (28)All incentivized 112 (32) 107 (29) 99 (27)
larger increase in cheating among students who did not previously cheat in incentivized treatmentsthan in the control group.
5. EMPIRICAL ANALYSIS OF CLASSROOM CHEATING NETWORKS
5.1. Cheating by school and classroom. In this section we change our perspective from a fo-cus on individual students to a focus on classroom networks. Networks provide us a picture ofthe structure of illicit communication in the classroom, beyond the number and characteristics ofthose involved. Table 5 provides information about the number of classrooms and (in parenthe-sis) the average number of students per classroom in the cohort by treatment and year. There aremore students leaving than new arrivals every year, and schools sometimes reduce the number ofclassrooms and reassign remaining students.
Figures 7 to 10 illustrate the percentage of cheaters by classroom for the different treatmentgroups for the cohort of interest in each year in the program. Classrooms are grouped by school.Schools are ordered from left to right in decreasing order with respect to the prevalence of cheat-ing in the last year in the program; classrooms within each school are ordered from left to right indecreasing order with respect to the prevalence of cheating in the corresponding year. The heightof the bar indicates the percentage of cheaters in a given classroom, while the absence of a barindicates no cheating in a classroom. Consistent with the individual data, there is more cheating inclassrooms under the student incentive group and the teacher and student incentive group. More-over, cheating in those groups increases considerably in going from the first to the second year inthe program, while cheating in the other two groups declines or remains constant.
The figures show a large variance in the prevalence of cheating across schools within each treat-ment group, even in the no incentives group. For instance, under student incentives, the last yearin the program, cheating goes from being more than 50% for every classroom in a school in oneextreme to being zero in a couple of schools in the opposite extreme. There is also some diversityin the prevalence of cheating for different classrooms within the same school. For instance, in thefourth school from the right, under student incentives, the last year in the program, cheating goesfrom more than 75% in one classroom to zero in another. Overall, the data suggests the existenceof a “cheating culture” in a few schools and in some classrooms.
5.2. Cheating networks by treatment. In Table 6, we report on detected communication activitywithin each classroom. For the calculation, we use the directed links detected using the ω test asdescribed in Section 3. We consider two indicators: network density and average degree. Networkdensity is defined as the percentage of directed edges that are active in the classroom, that is thenumber of directed links detected using the ω test divided by the number of possible links, that isN(N−1) if the school size is N. We report the density averaged over classrooms for each treatmentand year. The degree of a student is a defined as the number of students he or she is found to have

CHEATING AND INCENTIVES 20
0
25
50
75
100
Class
Accu
se
d p
erc
en
tag
e
2009
0
25
50
75
100
Class
Accu
se
d p
erc
en
tag
e
2010
0
25
50
75
100
Class
Accu
se
d p
erc
en
tag
e
2011
FIGURE 7. Percentage of cheaters by classroom and school: control group

CHEATING AND INCENTIVES 21
0
25
50
75
100
Class
Accu
se
d p
erc
en
tag
e
2009
0
25
50
75
100
Class
Accu
se
d p
erc
en
tag
e
2010
0
25
50
75
100
Class
Accu
se
d p
erc
en
tag
e
2011
FIGURE 8. Percentage of cheaters by classroom and school: student incentives treatment

CHEATING AND INCENTIVES 22
0
25
50
75
100
Class
Accu
se
d p
erc
en
tag
e
2009
0
25
50
75
100
Class
Accu
se
d p
erc
en
tag
e
2010
0
25
50
75
100
Class
Accu
se
d p
erc
en
tag
e
2011
FIGURE 9. Percentage of cheaters by classroom and school: teacher incentives treatment

CHEATING AND INCENTIVES 23
0
25
50
75
100
Class
Accu
se
d p
erc
en
tag
e
2009
0
25
50
75
100
Class
Accu
se
d p
erc
en
tag
e
2010
0
25
50
75
100
Class
Accu
se
d p
erc
en
tag
e
2011
FIGURE 10. Percentage of cheaters by classroom and school: all incentivized treatment
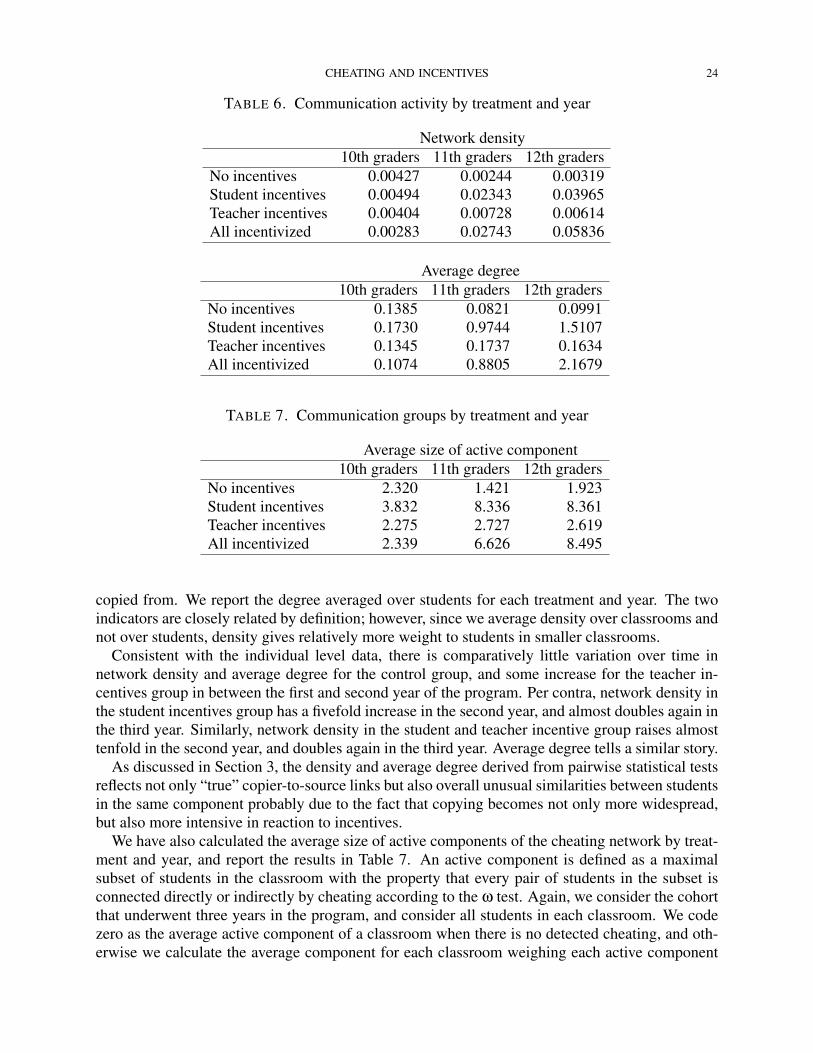
CHEATING AND INCENTIVES 24
TABLE 6. Communication activity by treatment and year
Network density10th graders 11th graders 12th graders
No incentives 0.00427 0.00244 0.00319Student incentives 0.00494 0.02343 0.03965Teacher incentives 0.00404 0.00728 0.00614All incentivized 0.00283 0.02743 0.05836
Average degree10th graders 11th graders 12th graders
No incentives 0.1385 0.0821 0.0991Student incentives 0.1730 0.9744 1.5107Teacher incentives 0.1345 0.1737 0.1634All incentivized 0.1074 0.8805 2.1679
TABLE 7. Communication groups by treatment and year
Average size of active component10th graders 11th graders 12th graders
No incentives 2.320 1.421 1.923Student incentives 3.832 8.336 8.361Teacher incentives 2.275 2.727 2.619All incentivized 2.339 6.626 8.495
copied from. We report the degree averaged over students for each treatment and year. The twoindicators are closely related by definition; however, since we average density over classrooms andnot over students, density gives relatively more weight to students in smaller classrooms.
Consistent with the individual level data, there is comparatively little variation over time innetwork density and average degree for the control group, and some increase for the teacher in-centives group in between the first and second year of the program. Per contra, network density inthe student incentives group has a fivefold increase in the second year, and almost doubles again inthe third year. Similarly, network density in the student and teacher incentive group raises almosttenfold in the second year, and doubles again in the third year. Average degree tells a similar story.
As discussed in Section 3, the density and average degree derived from pairwise statistical testsreflects not only “true” copier-to-source links but also overall unusual similarities between studentsin the same component probably due to the fact that copying becomes not only more widespread,but also more intensive in reaction to incentives.
We have also calculated the average size of active components of the cheating network by treat-ment and year, and report the results in Table 7. An active component is defined as a maximalsubset of students in the classroom with the property that every pair of students in the subset isconnected directly or indirectly by cheating according to the ω test. Again, we consider the cohortthat underwent three years in the program, and consider all students in each classroom. We codezero as the average active component of a classroom when there is no detected cheating, and oth-erwise we calculate the average component for each classroom weighing each active component

CHEATING AND INCENTIVES 25
●
● ●
●
●
●
●
●
●
●
●
●
●
●
●
●
●
FIGURE 11. Small cheating networks in a school in the all incentivized treatment
size by the corresponding number of cheaters. Then we take the simple average over classroomsby treatment and year.
As transpires from Table 7, cheating in the no incentives and the teacher incentives groups ismainly the result of the activity of isolated cheating pairs; per contra, in the student and in theall incentivized groups, some cheating is performed in large (relative to classroom size) groups ofstudents from the second year of the program on.
In Figures 11 and 12, we reproduce the cheating networks in two out of the twenty schools inthe all incentivized group the third year into the program. Each node is an individual who wasdetected cheating. Each edge points in the direction in which the cheating was detected; for thereasons discussed in Section 2, most edges point both ways. The color and size of each vertex is
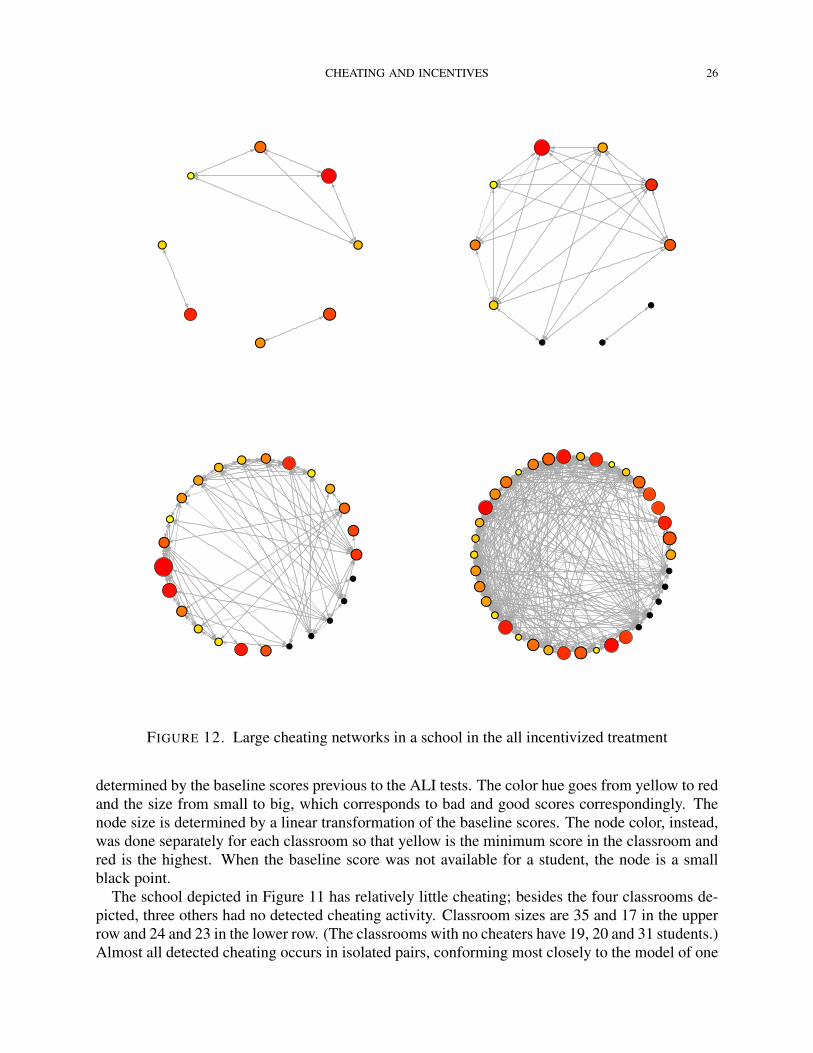
CHEATING AND INCENTIVES 26
●
●
●
●
●
●
●
●
●
●
●
●
● ●
●
●
●
●
●
●
●●●
●
●
●
●
●
●
●●
●
●
●
●
●
●
●
●●
●●●●
●
●●
●
●
●
●
●●
●
●
● ● ● ●
●
●
●
●
●
FIGURE 12. Large cheating networks in a school in the all incentivized treatment
determined by the baseline scores previous to the ALI tests. The color hue goes from yellow to redand the size from small to big, which corresponds to bad and good scores correspondingly. Thenode size is determined by a linear transformation of the baseline scores. The node color, instead,was done separately for each classroom so that yellow is the minimum score in the classroom andred is the highest. When the baseline score was not available for a student, the node is a smallblack point.
The school depicted in Figure 11 has relatively little cheating; besides the four classrooms de-picted, three others had no detected cheating activity. Classroom sizes are 35 and 17 in the upperrow and 24 and 23 in the lower row. (The classrooms with no cheaters have 19, 20 and 31 students.)Almost all detected cheating occurs in isolated pairs, conforming most closely to the model of one

CHEATING AND INCENTIVES 27
copier and one source underlying the statistical detection methods. Note that in the classroom tothe right in the second row more than a third of the students is involved in cheating, but the densityof the cheating network is still fairly small.
The school depicted in Figure 12, per contra, is a heavy offender. Still, besides the four class-rooms depicted, there is another one with no detected cheating activity. Classroom sizes are 18and 26 in the upper row and 33 and 38 in the lower row. (The classroom with no cheaters has 26students.) Cheating in the classroom depicted to the left of the upper row occurs in three differ-ent components; given the relatively small size of the classroom, more than 40% of the studentsare involved. Cheating in the school to the right occurs, in two components, one of them witheight students connected by multiple edges. The latter school has a slightly smaller percentage ofcheaters but a larger cheating density. Since it is hard to imagine eight or more students comparinganswers pairwise, these and other heavily connected classrooms seem to corroborate that unusualsimilarities are due to copying from the same sources. Cheating in the classrooms in the lowerrow is even more egregious, involving three quarters of the class in one case and the entire classin the other. Such densely connected classrooms occur occasionally in other schools in the studentincentive and the teacher and student incentive groups.
6. FINAL REMARKS
In recent years, there has been a movement toward greater accountability in education provi-sion by the introduction of nationwide standardized testing in many countries and even acrosscountries, as exemplified by the OECD Programme for International Student Assessment (PISA)testing. Reliance on standardized testing has led naturally to increases in the stakes in the testsboth for teachers and students, through the policy consequences for the schools or through the con-sequences for student promotion. Policy experiments in a few countries have gone further, linkingexplicitly test scores to financial incentives for teachers and students in the hopes of improvinglearning. These interventions have often been careful in avoiding manipulation of test scores via“teaching to the test” (Kremer et al. 2009) or have engaged external monitors to avoid cheating be-ing orchestrated by teachers. To the extent of our knowledge, however, there has been no previoussystematic study on the effect of the high stakes on answer copying.
In this paper, we explore cheating in the context of an intervention conducted in a sample ofMexican high schools which included different incentive schemes associated to performance instandardized exams. We adapt methods from the education measurement literature designed withthe intention to test whether a particular pair of students have engaged in copying in a multiple-choice exam. Those methods generally set a threshold for the similarity between the answersprovided by two students such that if the threshold is exceeded the pair becomes suspect. In theintervention we study, the same exam was applied to students in different classrooms; we exploitthis feature of the intervention to set a threshold such that the probability of accusing a studentbecause of similarity with a student in a different classroom would be 10%, which we take tobe the probability of accusing an innocent student. Financial incentives to students, combinedwith repeated participation in the program, seem to have had a large impact on cheating. Underconservative assumptions regarding classification errors, by the third year in the program, around20% of students may have engaged in cheating in treatments that provided financial incentives tostudents, while the corresponding percentage without incentives or in a treatment that providedincentives to teachers may have been negligible. Cheating is not distributed homogeneously overthe sample of high schools in each treatment; there are schools with widespread cheating andschools with no detected cheating in every treatment.

CHEATING AND INCENTIVES 28
We also look at the network defined by excessive similarity in the answers to the exam withineach classroom. For classrooms in the no incentives or in the teacher only incentive groups, groupsof students connected by cheating are generally isolated pairs. For classrooms in the treatmentsthat provide incentives to students, however, especially in the second and third year in the program,groups of students connected by excessive similarity can be quite large, encompassing for a coupleof schools a large percentage of each classroom. The combination of high incentives and experi-ence in the program seem to have given rise to extensive collaboration in illicit communication inthese classrooms.
Our evidence indicates that an immediate worry for policy interventions relying on explicitmonetary incentives is to be aware of the participants’ attempts to improve measured rather thanactual performance. Extensive cheating, as detected in some classrooms, is pernicious becauseit blunts the incentives for learning created by the program, at least for potential copiers. Thisis because copying and learning are to some extent substitute activities, and copying is likelyfacilitated if it is deemed acceptable by classmates. If monetary incentives undermine the role ofstigma and other moral considerations in deterring copying, it may be that smaller incentives areactually more effective for learning, depending on the different elasticities of cheating and effortin learning to cash incentives. There is a pointed contrast here with recent literature stressing thepoint that monetary incentives may crow out moral restraints on behavior in some environments; inthose environments, unlike ours, it may be optimal to provide either no incentives or large enoughmonetary incentives (Sneezy and Rustichini 2000, Gneezy et al. 2011). In both cases, it is possiblethat monetary incentives have non monotonic effects due to the interaction with moral motivations.At any rate, every policy intervention has the potential to trigger unintended consequences, chieflyamong them the participants’ attempts to game the rules. A careful research of those attempts mustbe an important ingredient of every intervention with an aspiration to influence policy.

CHEATING AND INCENTIVES 29
REFERENCES
Joshua Angrist and Victor Lavy. The effects of high stakes high school achievements awards:Evidence from a randomized trial. American Economic Review, 99:1384–1414, 2009.
Coralio Ballester, Antoni Calvó-Armengol, and Yves Zenou. Delinquent networks. Journal of theEuropean Economic Association, 8:34–61, 2010.
Jere Behrman, Susan Parker, Petra Todd, and Ken Wolpin. Aligning learning incentives of studentsand teachers: Results from a social experiment in Mexican high schools. Journal of PoliticalEconomy, forthcoming, 2014.
Roland Benabou and Jean Tirole. Incentives and prosocial behavior. American Economic Review,96(5):1652–1678, 2006.
Roland Benabou and Jean Tirole. Laws and norms. NBER Working Paper #17579, 2011.R. Darrell Bock. Estimating item parameters and latent ability when responses are scored in two
or more nominal categories. Psychometrika, 37:29–51, 1972.Barbara Brandes. Academic honesty: A special study of California students. California State
Department of Education, Bureau of Publications, Sacramento, CA, 1986.Antoni Calvó-Armengol and Yves Zenou. Social networks and crime decisions: The role of social
structure in facilitating delinquent behavior. International Economic Review, 45:939–958, 2004.Scott Carrell, Frederick V. Malmstrom, and James E. West. Peer effects in academic cheating.
Journal of Human Resources, 43:173–207, 2008.Gary Charness, David Masclet, and Marie-Claire Villeval. The dark side of competition for status.
Management Science, 60(1):38–55, 2013.Gregory Cizek. Cheating on Tests: How to do it, Detect it and Prevent it. Lawrence Erlbaum,
Mahwah, NJ, 1999.Gregory Cizek, Michael B. Bunch, and Heather Koons. Setting performance standards: Contem-
porary methods. Educational Measurement: Issues and Practice, 23:31–62, 2004.Allan S. Cohen and James Wollack. Test administration, security, scoring, and reporting. In R.L.
Brennan, editor, Educational Measurement, pages 356–386. Praeger Publishers, 4th edition,2006.
Stephen F. Davis and H. Wayne Ludvigson. Additional data on academic dishonesty and a proposalfor remediation. Teaching of Psychology, 22:119–121, 1995.
Stephen F. Davis, Cathy A. Grover, Angela H. Becker, and Loretta N. McGregor. Academicdishonesty: Prevalence, determinants, techniques, and punishments. Teaching of Psychology,19:16–20, 1992.
David Figlio and Joshua Winicki. Food for thought: the effects of school accountability plans onschool nutrition. Journal of Public Economics, 89:381–394, 2005.
Roland Fryer. Financial incentives and student achievement: Evidence from randomized trials.Quarterly Journal of Economics, 126:1755–1798, 2011.
Edward L. Glaeser, Bruce Sacerdote, and José A. Scheinkman. Crime and social interactions.Quarterly Journal of Economics, 111:507–548, 1996.
Paul Glewwe, Nauman Ilias, and Michael Kremer. Teacher incentives. American Economic Jour-nal: Applied Economics, 2:205–227, 2010.
Uri Gneezy and Aldo Rustichini. Pay enough or don’t pay at all. Quarterly Journal of Economics,115:791–810, 2000.
Uri Gneezy, Stephan Meier, and Pedro Rey-Biel. When and why incentives (don’t) work to modifybehavior. Journal of Economic Perspectives, 25:191–210, 2011.

CHEATING AND INCENTIVES 30
Paul W. Holland. Assessing unusual agreement between the incorrect answers of two examinees:Using the K-index. Education Testing Service, Princeton, NJ, 1996.
C. Kirabo Jackson. A little now for a lot later: A look at a Texas advanced placement incentiveprogram. Journal of Human Resources, 45:591–639, 2010.
Matthew Jackson. Social and Economic Networks. Princeton University Press, 2010.Brian Jacob and Steven Levitt. Rotten apples: An investigation of the prevalence and predictors of
teacher cheating. Quarterly Journal of Economics, 118:843–877, 2003.Michael Kremer, Edward Miguel, and Rebecca Thornton. Incentives to learn. Review of Economics
and Statistics, 91:437–456, 2009.Steven D. Levitt, John A. List, and Sally Sadoff. The effect of performance-based incentives on
educational achievement: Evidence from a randomized experiment. University of Chicago,2010.
Claudio Lucifora and Marco Tonello. Students’ cheating as a social interaction: Evidence from arandomized experiment in a national evaluation program. IZA Discussion Papers 6967, Bonn,Germany, 2012.
Jan R. Magnus, Victor M. Polterovich, Dmitri L. Danilov, and Alexei V. Savvateev. Tolerance ofcheating: An analysis across countries. Journal of Economic Education, 3:125–135, 2002.
Karthik Muralidharan and Venkatesh Sundararaman. Teacher incentives in developing countries:Experimental evidence from India. Journal of Political Economy, 119:39–77, 2011.
Manuel Reif. mcIRT: IRT models for multiple choice items, 2014. URLhttps://github.com/manuelreif/mcIRT.
Mauricio Romero, Alvaro Riascos, and Diego Jara. Answer-copying index comparison and mas-sive cheating detection. Universidad de los Andes, unpublished manuscript, 2012.
Fred Schab. Schooling without learning: Thirty years of cheating in high school. Adolescence, 26:839–847, 1991.
Leonardo S. Sotaridona and Rob R. Meijer. Statistical properties of the K-index for detectinganswer copying. Journal of Educational Measurement, 39:115–132, 2002.
Leonardo S. Sotaridona and Rob R. Meijer. Two new statistics to detect answer copying. Journalof Educational Measurement, 40:53–69, 2003.
Matthew G. Springer, Dale Ballou, Laura Hamilton, Vi-Nhuan Le, J.R. Lockwood, Daniel F. Mc-Caffrey, Matthew Pepper, and Brian M. Stecher. Teacher Pay for Performance: ExperimentalEvidence from the Project on Incentives in Teaching. National Center on Performance Incentivesat Vanderbilt University, Nashville, TN, 2010.
Wim J. van der Linden and Leonardo S. Sotaridona. Detecting answer copying when the regularresponse process follows a known response model. Journal of Educational and BehavioralStatistics, 31:283–304, 2006.
George O. Wesolowsky. Detecting excessive similarity in answers on multiple choice exams.Journal of Applied Statistics, 27:909–921, 2000.
James Wollack. A nominal response model approach for detecting answer copying. AppliedPsychological Measurement, 21:307–320, 1997.
James Wollack. Comparison of answer copying indices with real data. Journal of EducationalMeasurement, 40:189–205, 2003.
James Wollack. Simultaneous use of multiple answer copying indexes to improve detection rates.Applied Measurement in Education, 19:265–288, 2006.
Cengiz Zopluoglu. [software note] copydetect: An R package to compute statistical indices fordetecting answer copying on multiple-choice tests. Applied Psychological Measurement, 37(1):

CHEATING AND INCENTIVES 31
75–77, 2013.Cengiz Zopluoglu and Ernest Davenport. The empirical power and type I error rates of the GBT
and ω indices in detecting answer copying on multiple-choice tests. Educational and Psycho-logical Measurement, 72(6):975–1000, 2012.

CHEATING AND INCENTIVES 32
APPENDIX: MONETARY INCENTIVES IN THE ALI EXPERIMENT
In this Appendix we elaborate on the structure of incentive payments associated to ALI.
6.1. Treatment 1 (Student incentives group). Table 8 shows the incentive payment schedule forstudents at each grade for the student incentives treatment. The amount in each cell represents thepayment in Mexican pesos for a student with a given level of performance at the start of the grade(the baseline exam score) and at the end of the grade. As a reference, the exchange rate fluctu-ated between 12 pesos per US dollar and 13 pesos for US dollar during the yeas of the program.Payment levels were intended to be large enough to be expected to induce behavioral changes.The payments are similar in magnitude to the attendance incentives given by the Oportunidadesprogram and to a scholarship program pioneered by the Secretariat of Public Education. As seenin the table, in the 10th and 11th grades, payments are larger when more learning occurs betweenthe beginning and the end of the year. This feature was designed to avoid rewarding only the high-est achieving students. In 12th grade, however, payments are provided only to students in the toptwo categories, reflecting the goal that students reach at least the proficient level by the time theygraduate.
6.2. Treatment 2 (Teacher incentives group). In the teacher incentives group, mathematics teach-ers were rewarded for the performance of the students they taught during the year. The per-studentbonus was 5 percent of the bonus payments in the student schedules, except for the modificationthat teachers were penalized for students who dropped back in levels between the beginning andend year scores in 10th and 11th grade. The reward attached to the performance of each student isdescribed in Table 9.
6.3. Treatment 3 (Student and teacher incentives group).
6.3.1. Students. In 10th and 11th grade, students received a reward based on their individual per-formance and also on the performance of the other students in their mathematics class. The firstcomponent was calculated in exactly the same way as in the student incentives group. The secondcomponent was calculated as a fixed proportion, one percent, of the total payments earned by class-mates. In 12th grade, students received a reward based only on individual performance calculatedin exactly the same way as in the student incentives group.
6.3.2. Mathematics Teachers. The reward to full-time mathematics teachers was the sum of thetotal performance payments earned by the students in their classes calculated as in the teacherincentives group and a fixed proportion, 25 percent, of the average full-time equivalent adjustedperformance payments earned by the other mathematics teachers (across all grade levels).
6.3.3. Non-Mathematics Teachers. Non-mathematics teachers received a payment equal to 25 per-cent of the school-wide average (full-time equivalent) mathematics teacher performance payment.Payments for part-time teachers were adjusted for their own full-time equivalence status.
6.3.4. Principals and Associate Principals. Principals received a cash payment equal to 50 per-cent of the average full-time equivalent mathematics teacher performance payment. AssociatePrincipals received a cash payment equal to 25 percent of the school-wide average full-time equiv-alent mathematics teacher performance payment, adjusted for their own full-time equivalence sta-tus.

CHEATING AND INCENTIVES 33
TABLE 8. Schedule of incentive payments to students for their own achievement,in pesos
End of gradePre-Basic Basic Proficient Advanced
Start of 10th GradePre-Basic 0 4,000 9,000 15,000Basic 0 2,500 7,500 13,500Proficient 0 0 6,000 12,000Advanced 0 0 4,500 10,500
Start of 11th GradePre-Basic 0 4,000 9,000 15,000Basic 0 0 7,500 13,500Proficient 0 0 6,000 12,000Advanced 0 0 4,500 10,500
Start of 12th GradePre-Basic 0 0 5,000 10,000Basic 0 0 5,000 10,000Proficient 0 0 5,000 10,000Advanced 0 0 5,000 10,000
TABLE 9. Schedule of incentive payments to teachers for student achievement, in pesos
End of gradePre-Basic Basic Proficient Advanced
Start of 10th GradePre-Basic 0 200 450 750Basic -125 125 375 675Proficient -125 -125 300 600Advanced -125 -125 225 525
Start of 11th GradePre-Basic 0 200 450 750Basic -125 0 375 675Proficient -125 -125 300 600Advanced -125 -125 225 525
Start of 12th GradePre-Basic 0 0 250 500Basic 0 0 250 500Proficient 0 0 250 500Advanced 0 0 250 500