che 481-483: process design final design project presentation chemical & biological engineering...
TRANSCRIPT
CHE 481-483: Process DesignFinal Design Project Presentation
Chemical & Biological Engineering DepartmentDrexel University
Manufacture of Ethylene GlycolManufacture of Ethylene Glycol
Design Team:
Academic Advisor: Dr. George Rowell
Industrial Advisor: Mr. Steven Schon, P.E.
Name Topics Covered in Presentation
Chong McLaren Project Scope
Nicholas Mitchell Process Description
Timre Segear Economic Feasibility
Suroor Manzoor Safety & Environment
Conclusions & Recommendations

Project Scope
Chong McLaren
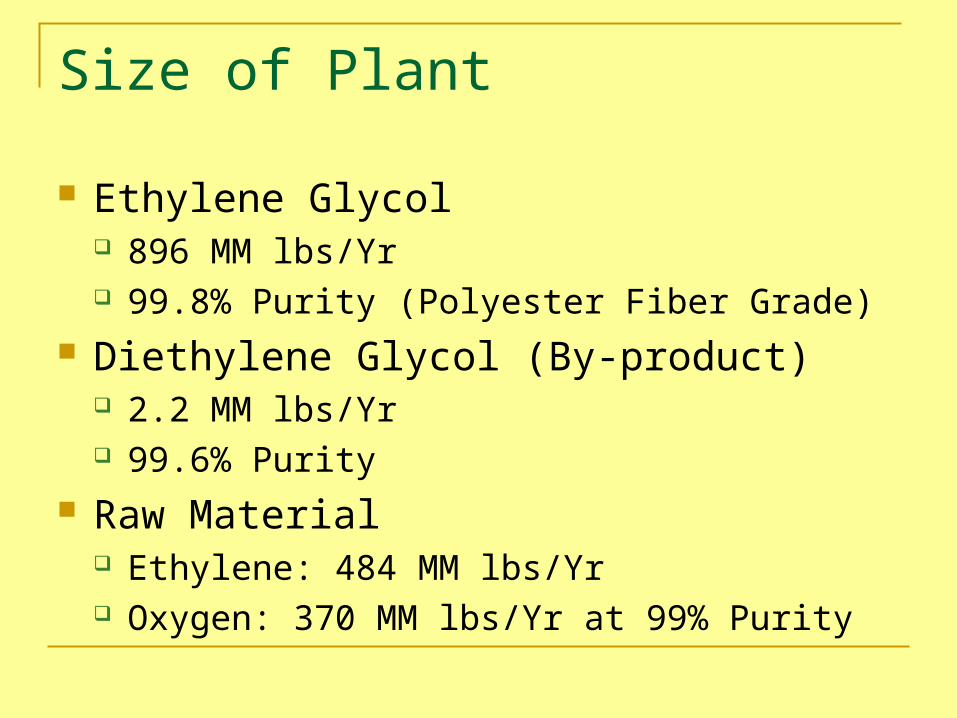
Ethylene Glycol 896 MM lbs/Yr 99.8% Purity (Polyester Fiber Grade)
Diethylene Glycol (By-product) 2.2 MM lbs/Yr 99.6% Purity
Raw Material Ethylene: 484 MM lbs/Yr Oxygen: 370 MM lbs/Yr at 99% Purity
Size of Plant
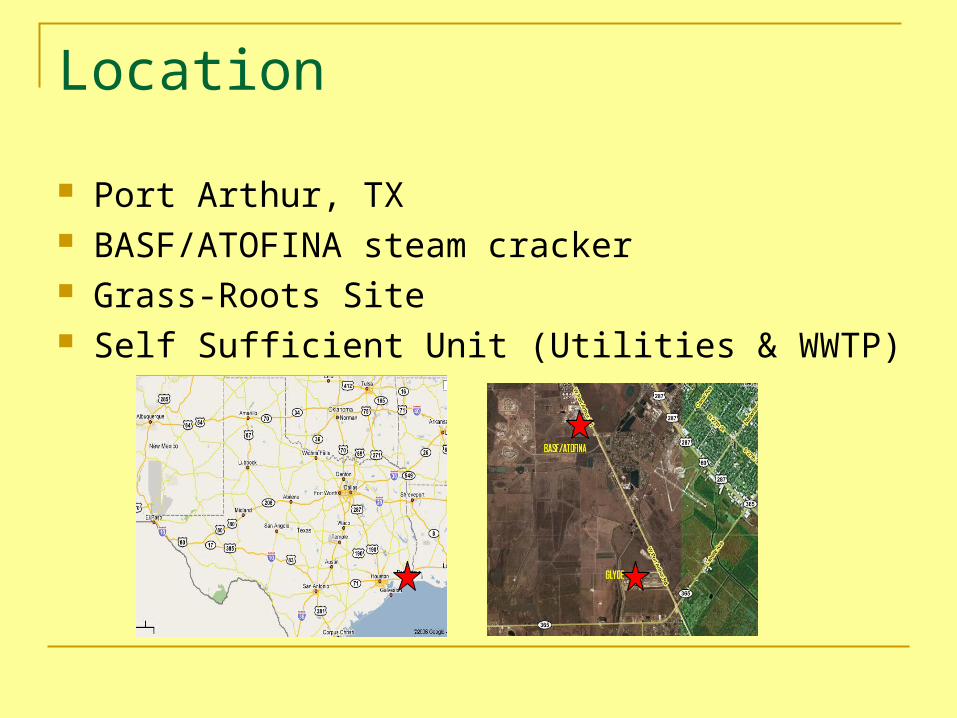
Location
Port Arthur, TX BASF/ATOFINA steam cracker Grass-Roots Site Self Sufficient Unit (Utilities & WWTP)
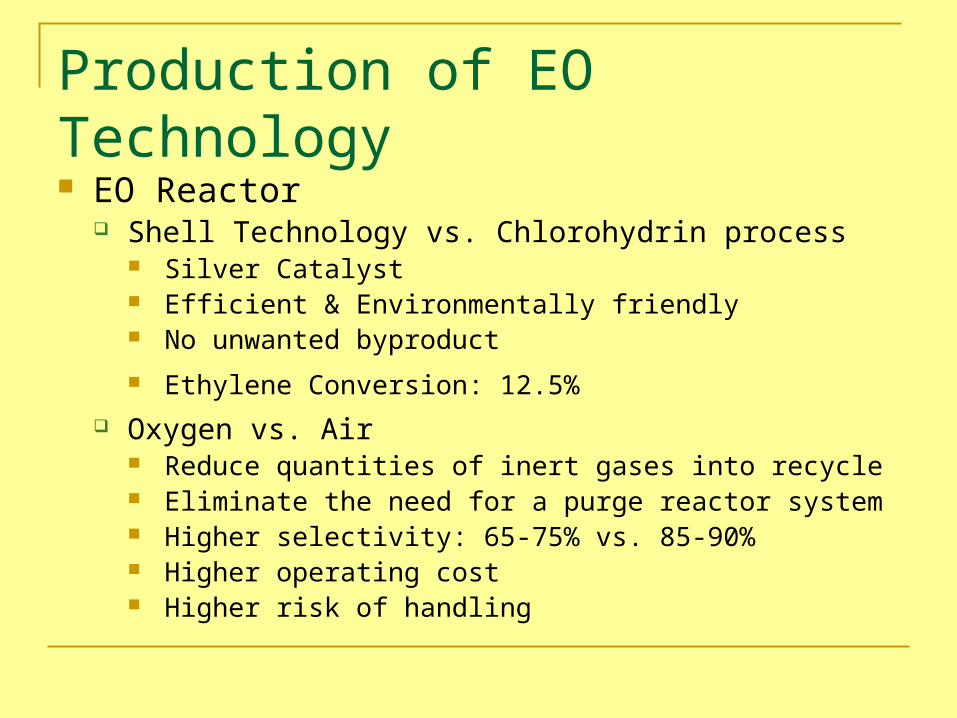
Production of EO Technology
EO Reactor Shell Technology vs. Chlorohydrin process
Silver Catalyst Efficient & Environmentally friendly No unwanted byproduct
Ethylene Conversion: 12.5%
Oxygen vs. Air Reduce quantities of inert gases into recycle Eliminate the need for a purge reactor system Higher selectivity: 65-75% vs. 85-90% Higher operating cost Higher risk of handling
Production of EG Technology
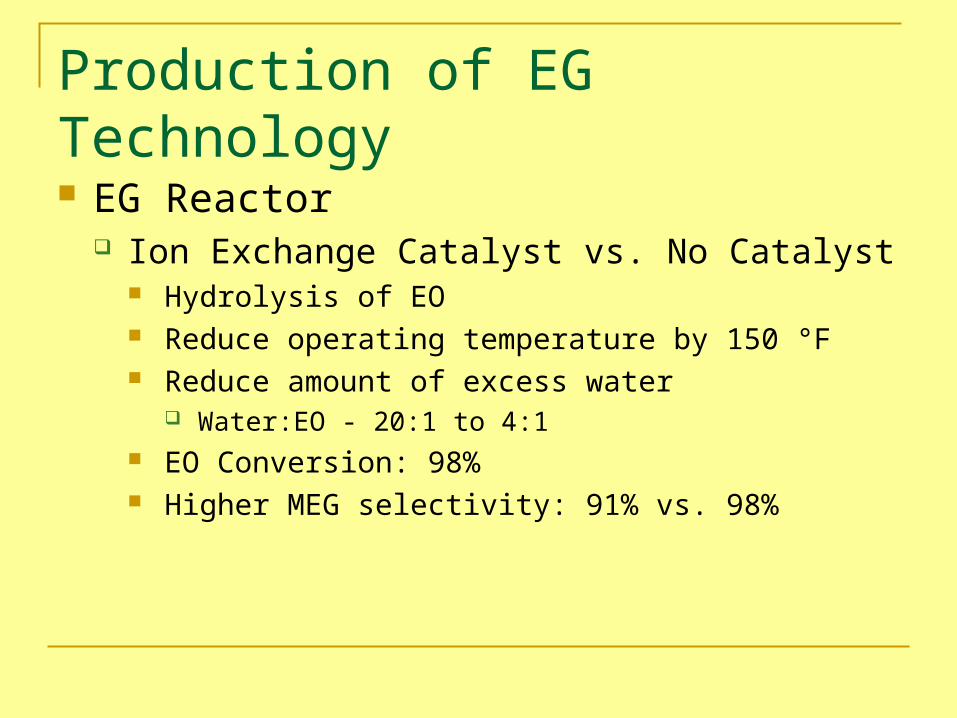
EG Reactor Ion Exchange Catalyst vs. No Catalyst
Hydrolysis of EO Reduce operating temperature by 150 °F Reduce amount of excess water
Water:EO - 20:1 to 4:1 EO Conversion: 98% Higher MEG selectivity: 91% vs. 98%
Chemistry
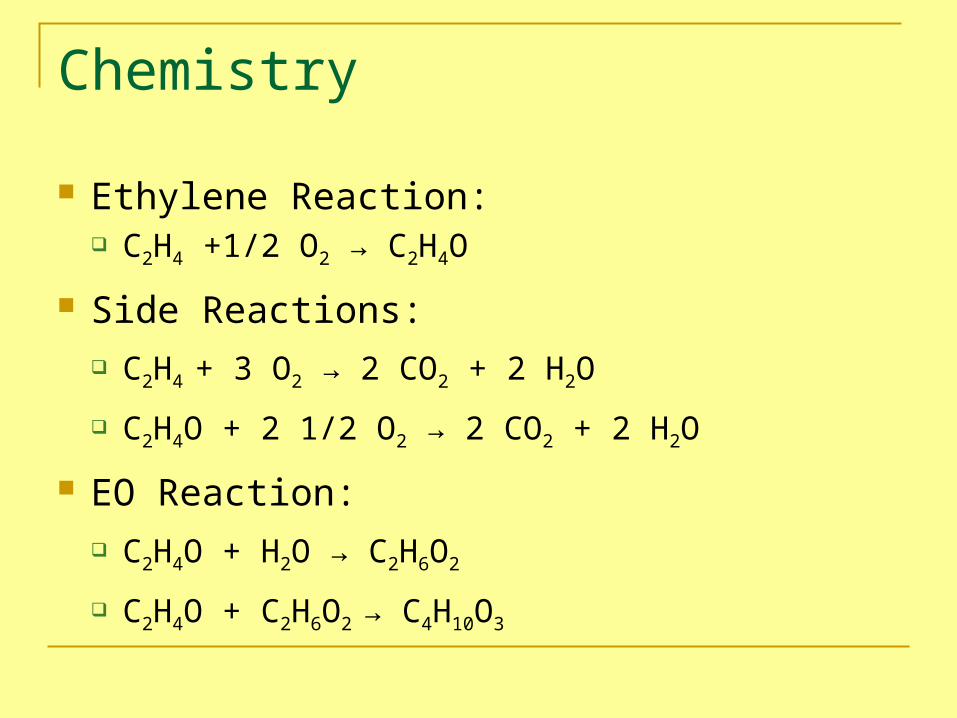
Ethylene Reaction: C2H4 +1/2 O2 → C2H4O
Side Reactions: C2H4 + 3 O2 → 2 CO2 + 2 H2O
C2H4O + 2 1/2 O2 → 2 CO2 + 2 H2O
EO Reaction: C2H4O + H2O → C2H6O2
C2H4O + C2H6O2 → C4H10O3
Market Analysis
EG Worldwide Production 31.2 Billion lbs/Yr 20% in US
GLYDE: 896 MM lbs/Yr of EG Production 3% of World market 14% of US market
Growth Rate 6%-7% globally per year between 2006 - 2010
Market Analysis
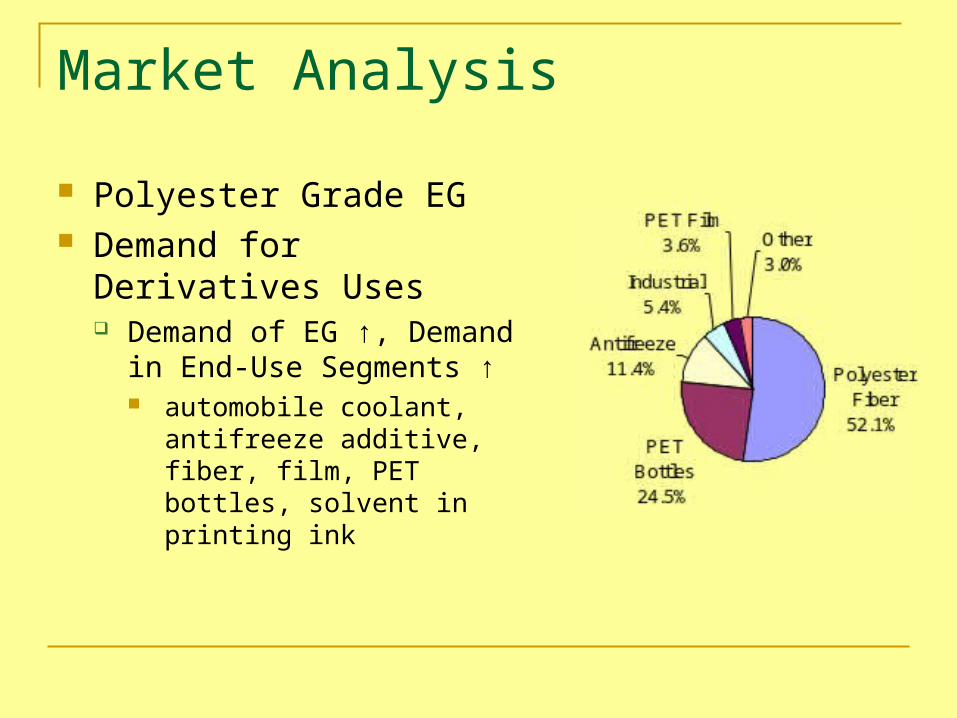
Polyester Grade EG Demand for Derivatives
Uses Demand of EG ↑, Demand in
End-Use Segments ↑ automobile coolant, antifreeze
additive, fiber, film, PET bottles, solvent in printing ink

Process Description
Nick Mitchell
Ethylene
Oxygen
Feed Prep
OMSEO
Absorber
EO Stripper
CO2 Absorber
CO2 Stripper
Flare
EO Reactor
EG Reactor
EG Dehydration
EG Purification
CO2
Purge
EG
DEG
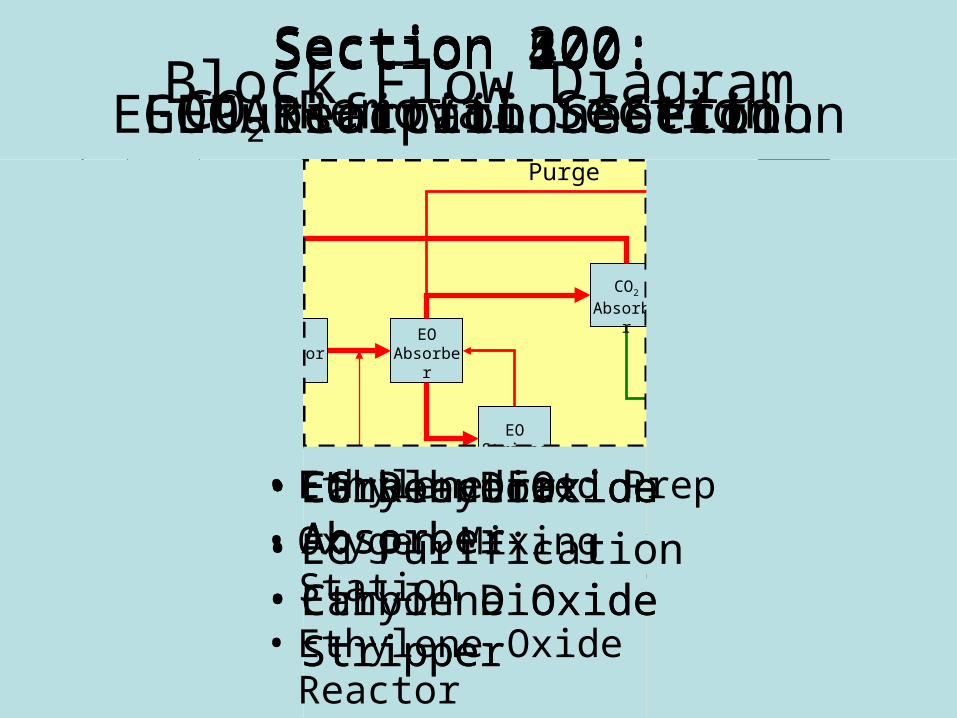
Section 300: CO2 Removal Section
Section 400: EG Reaction Section
Section 500: EG Purification SectionBlock Flow Diagram
Section 100: EO Reaction Section
• Ethylene Oxide Absorber
• Ethylene Oxide Stripper
• Carbon Dioxide Absorber
• Carbon Dioxide Stripper
• EG Reactor• EG Dehydration
• EG Purification
• Ethylene Feed Prep
• Oxygen Mixing Station
• Ethylene Oxide Reactor
Section 200: EO Absorption Section
Feed Prep Turbine
Ethylene Pipeline
Oxygen Mixing Station
Oxygen
Recycle Compressor
Recycle
CO2 Section
55,000 lb/hr
412, 000 lb/hr
46, 000 lb/hr
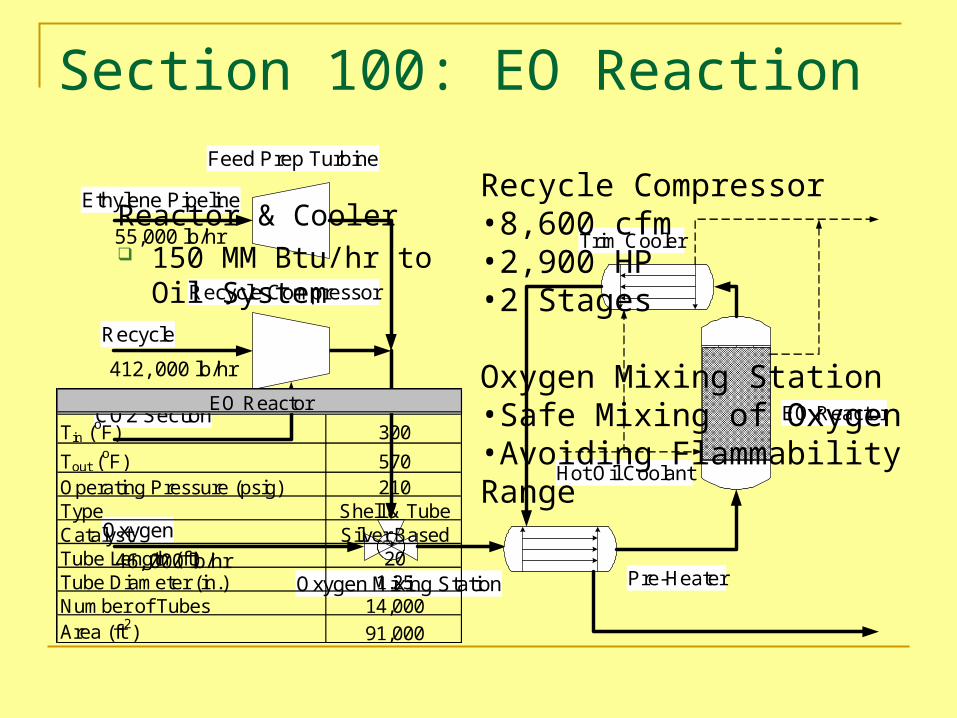
Section 100: EO Reaction
Pre-Heater
Trim Cooler
EO Reactor
Hot Oil Coolant
Recycle Compressor•8,600 cfm•2,900 HP•2 Stages
Oxygen Mixing Station•Safe Mixing of Oxygen•Avoiding Flammability Range
Reactor & Cooler 150 MM Btu/hr to Oil
System
Tin (oF) 300
Tout (oF) 570
Operating Pressure (psig) 210Type Shell & TubeCatalyst Silver BasedTube Length (ft) 20Tube Diameter (in.) 1.25Number of Tubes 14,000Area (ft2) 91,000
EO Reactor
G
as
Co
ole
r
Liq
uid
Co
ole
r
Tri
m C
oo
ler
Pre
-He
ate
r
Heat Duty (MM Btu/hr)
10 37 51 108
Number of Shells
1 3 1 5
Area (ft2) *1000
13 32.7 4.3 52
Area Per Shell (ft2) (*1000)
13 10.9 4.3 10.4
GasCooler
LiquidCooler
TrimCooler
Stripper Pre-Heater
EOAbsorber
To Purge, Recycle, & CO2 Removal
GasCooler
LiquidCooler
TrimCooler
Stripper Pre-Heater
EOAbsorber EO
Stripper
To Purge, Recycle, & CO2 Removal
Pre-Heater
Trim Cooler
EO Reactor
Hot Oil Coolant
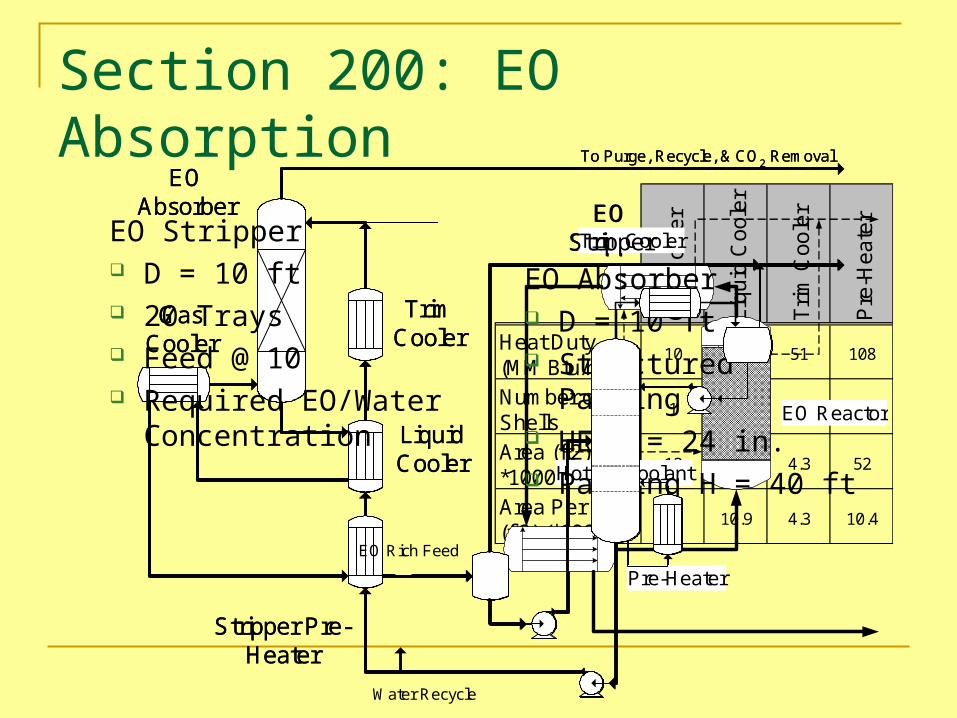
EO Absorber D = 10 ft Structured Packing HETP = 24 in. Packing H = 40 ft
Section 200: EO Absorption
EOStripper
Water Recycle
EO Rich Feed
EO Stripper D = 10 ft 20 Trays Feed @ 10 Required EO/Water
Concentration
GasCooler
LiquidCooler
TrimCooler
Stripper Pre-Heater
EOAbsorber EO
Stripper
To Purge, Recycle, & CO2 Removal
Ethylene
Purge toFlare
Recycle to EOReactor Section
CO2Absorber
CO2Stripper
CO2 toFlare
Make UpWater
CO2Stripper
CO2 toFlare
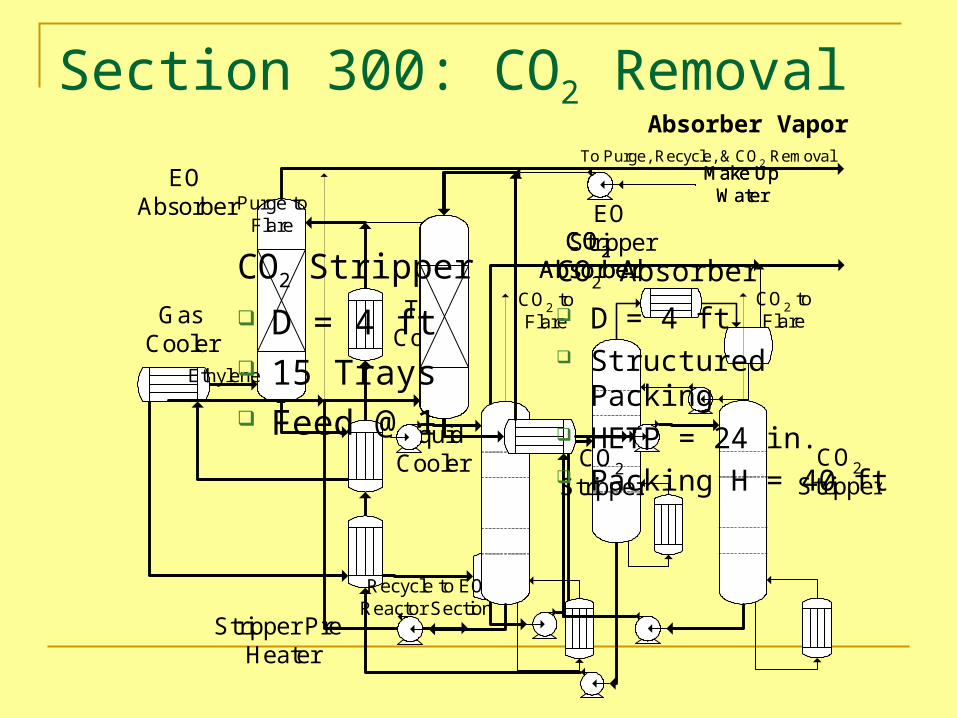
Section 300: CO2 Removal
CO2Absorber
Make UpWater
CO2 Absorber D = 4 ft Structured Packing HETP = 24 in. Packing H = 40 ft
CO2 Stripper D = 4 ft 15 Trays Feed @ 1
Absorber Vapor
GasCooler
LiquidCooler
TrimCooler
Stripper Pre-Heater
EOAbsorber EO
Stripper
To Purge, Recycle, & CO2 Removal
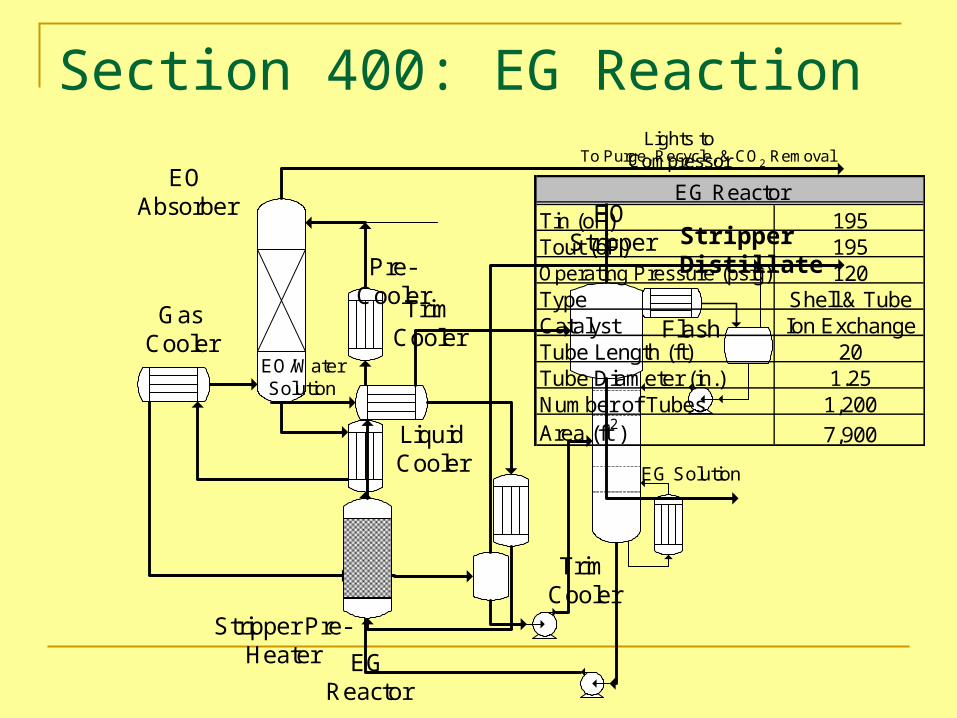
Section 400: EG Reaction
EGReactor
Flash
Pre-Cooler
TrimCooler
EO/WaterSolution
Lights toCompressor
EG Solution
Tin (oF) 195Tout (oF) 195Operating Pressure (psig) 120Type Shell & TubeCatalyst Ion ExchangeTube Length (ft) 20Tube Diameter (in.) 1.25Number of Tubes 1,200Area (ft2) 7,900
EG Reactor
Stripper Distillate
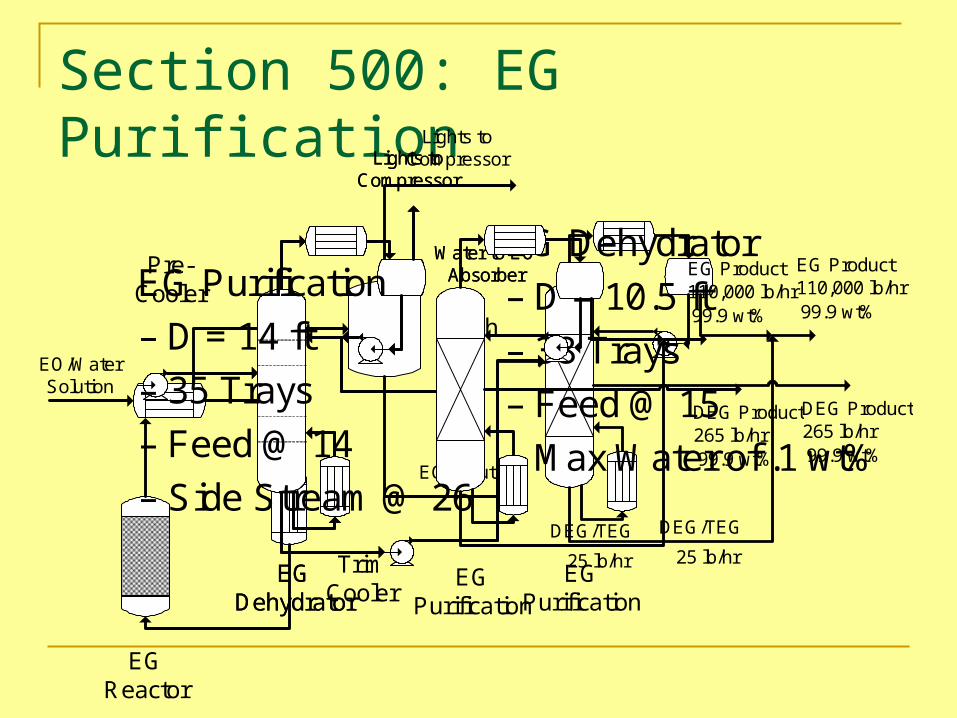
Section 500: EG Purification
EGReactor
Flash
Pre-Cooler
TrimCooler
EO/WaterSolution
Lights toCompressor
EG Solution
EGDehydrator
EGPurification
Lights toCompressor
Water to EOAbsorber
DEG/TEG
25 lb/hr
EG Product110,000 lb/hr99.9 wt%
DEG Product265 lb/hr99.9 wt%
EGDehydrator
Lights toCompressor
Water to EOAbsorber
EG Dehydrator
– D = 10.5 ft
– 38 Trays
– Feed @ 15
– Max Water of .1 wt%
EGPurification
DEG/TEG
25 lb/hr
EG Product110,000 lb/hr99.9 wt%
DEG Product265 lb/hr99.9 wt%
EG Purification
– D = 14 ft
– 35 Trays
– Feed @ 14
– Side Stream @ 26
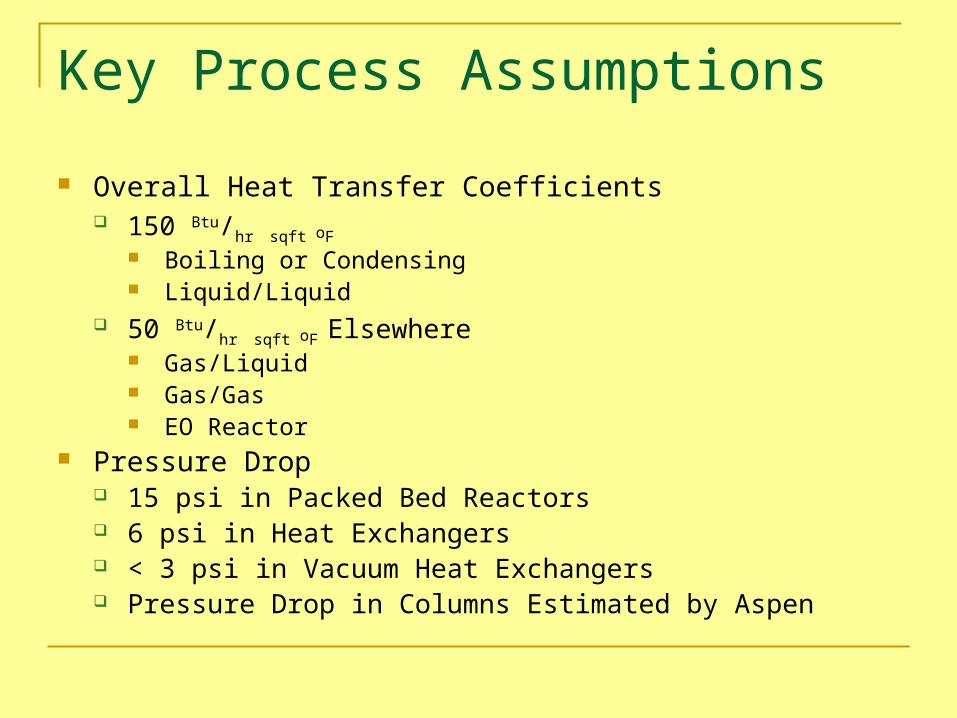
Key Process Assumptions
Overall Heat Transfer Coefficients 150 Btu/hr sqft oF
Boiling or Condensing Liquid/Liquid
50 Btu/hr sqft oF Elsewhere Gas/Liquid Gas/Gas EO Reactor
Pressure Drop 15 psi in Packed Bed Reactors 6 psi in Heat Exchangers < 3 psi in Vacuum Heat Exchangers Pressure Drop in Columns Estimated by Aspen
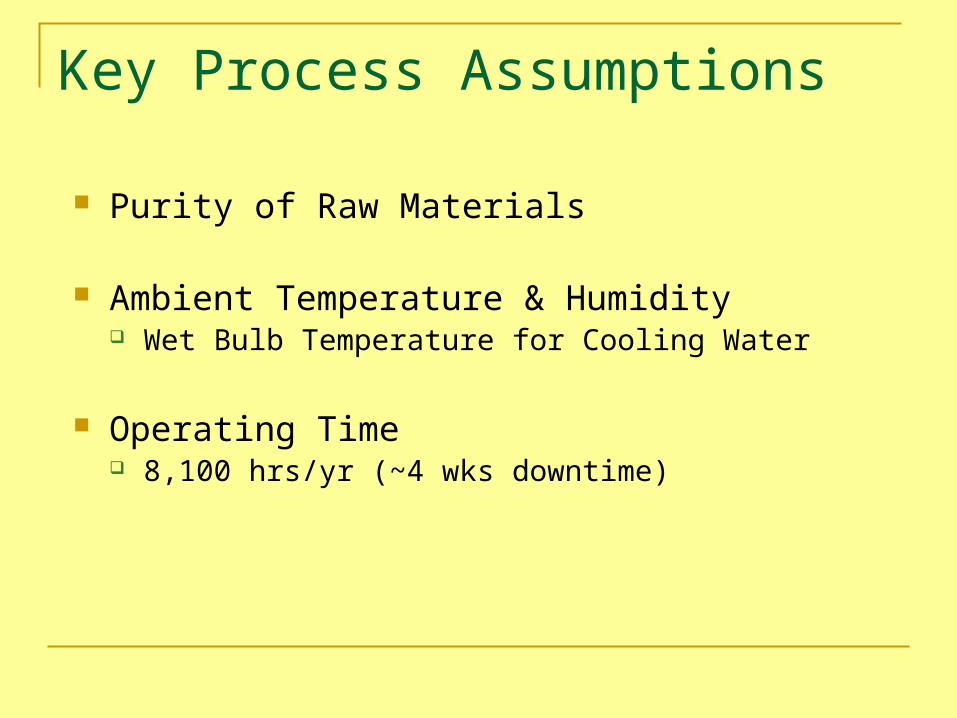
Purity of Raw Materials
Ambient Temperature & Humidity Wet Bulb Temperature for Cooling Water
Operating Time 8,100 hrs/yr (~4 wks downtime)
Key Process Assumptions
Key Process Assumptions
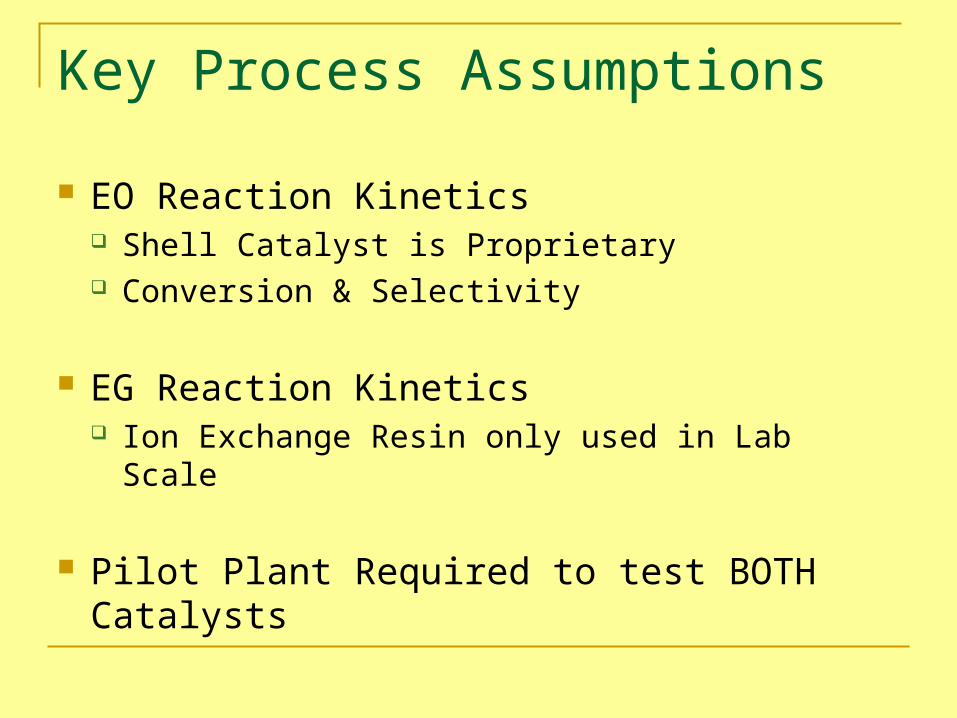
EO Reaction Kinetics Shell Catalyst is Proprietary Conversion & Selectivity
EG Reaction Kinetics Ion Exchange Resin only used in Lab Scale
Pilot Plant Required to test BOTH Catalysts
Economic Feasibility
Timre Segear
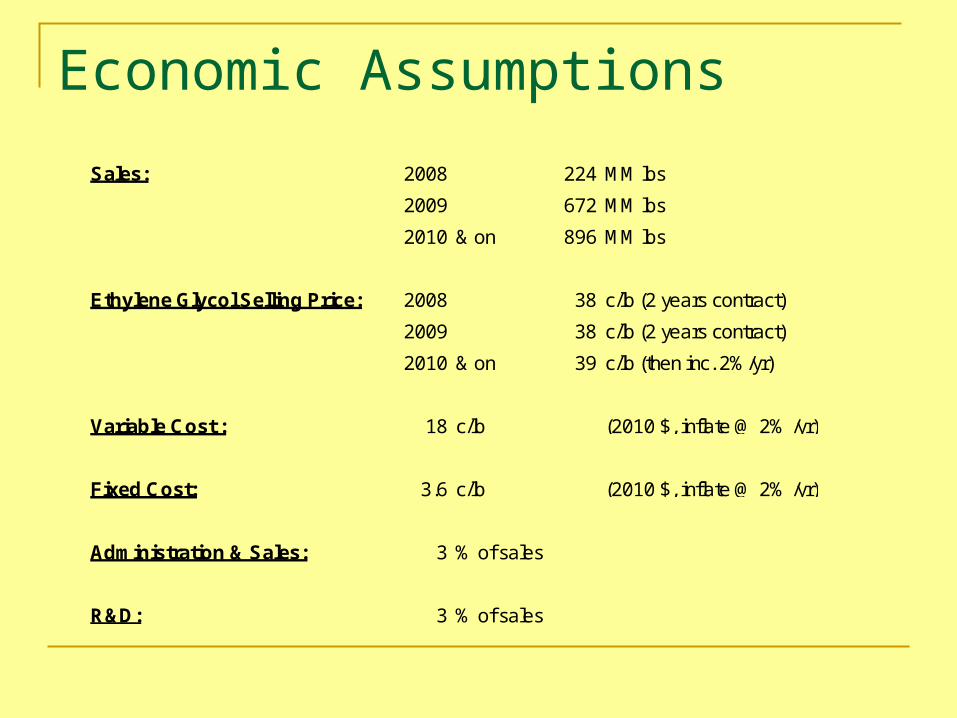
Economic Assumptions
Sales: 2008 224 MM lbs
2009 672 MM lbs
2010 & on 896 MM lbs
Ethylene Glycol Selling Price: 2008 38 c/lb (2 years contract)
2009 38 c/lb (2 years contract)
2010 & on 39 c/lb (then inc. 2%/yr)
Variable Cost : 18 c/lb (2010 $, inflate @ 2% /yr)
Fixed Cost: 3.6 c/lb (2010 $, inflate @ 2% /yr)
Administration & Sales: 3 % of sales
R&D: 3 % of sales
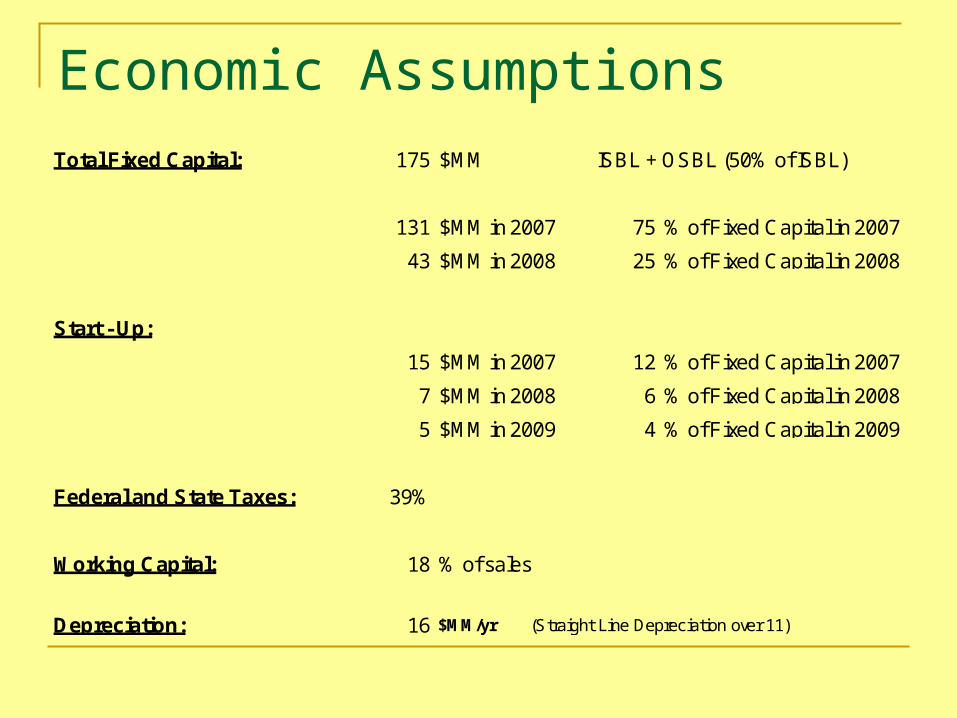
Economic AssumptionsTotal Fixed Capital: 175 $MM ISBL + OSBL (50% of ISBL)
131 $MM in 2007 75 % of Fixed Capital in 2007
43 $MM in 2008 25 % of Fixed Capital in 2008
Start - Up:
15 $MM in 2007 12 % of Fixed Capital in 2007
7 $MM in 2008 6 % of Fixed Capital in 2008
5 $MM in 2009 4 % of Fixed Capital in 2009
Federal and State Taxes: 39%
Working Capital: 18 % of sales
Depreciation: 16 $MM/yr (Straight Line Depreciation over 11)
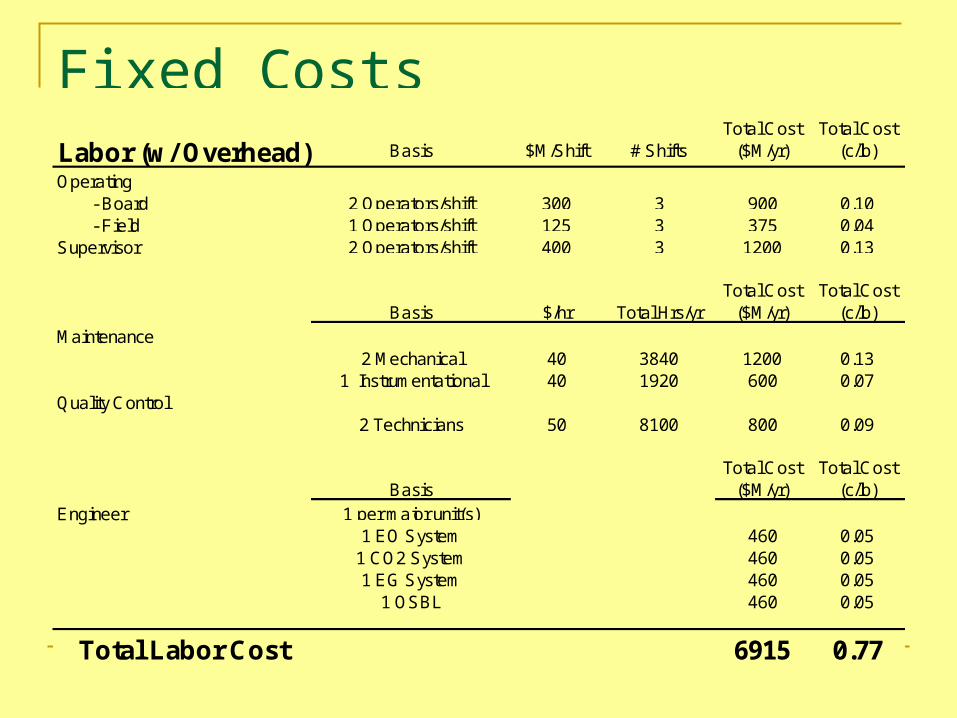
Fixed CostsLabor (w/ Overhead) Basis $M/Shift # Shifts
Total Cost ($M/yr)
Total Cost (c/lb)
Operating - Board 2 Operators/shift 300 3 900 0.10 - Field 1 Operators/shift 125 3 375 0.04Supervisor 2 Operators/shift 400 3 1200 0.13
Basis $/hr Total Hrs/yrTotal Cost
($M/yr)Total Cost
(c/lb)Maintenance
2 Mechanical 40 3840 1200 0.131 Instrumentational 40 1920 600 0.07
Quality Control2 Technicians 50 8100 800 0.09
BasisTotal Cost
($M/yr)Total Cost
(c/lb)Engineer 1 per major unit(s)
1 EO System 460 0.051 CO2 System 460 0.051 EG System 460 0.05
1 OSBL 460 0.05
Total Labor Cost 6915 0.77
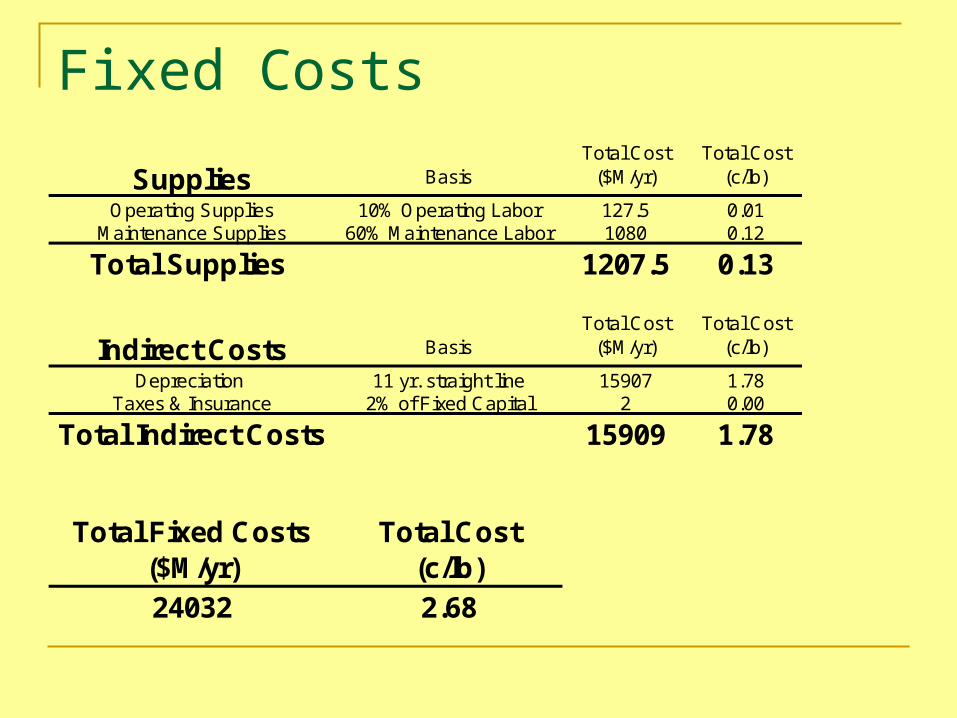
Fixed Costs
Supplies BasisTotal Cost
($M/yr)Total Cost
(c/lb)
Operating Supplies 10% Operating Labor 127.5 0.01Maintenance Supplies 60% Maintenance Labor 1080 0.12
Total Supplies 1207.5 0.13
Indirect Costs BasisTotal Cost
($M/yr)Total Cost
(c/lb)
Depreciation 11 yr. straight line 15907 1.78Taxes & Insurance 2% of Fixed Capital 2 0.00
Total Indirect Costs 15909 1.78
Total Fixed Costs ($M/yr)
Total Cost (c/lb)
24032 2.68
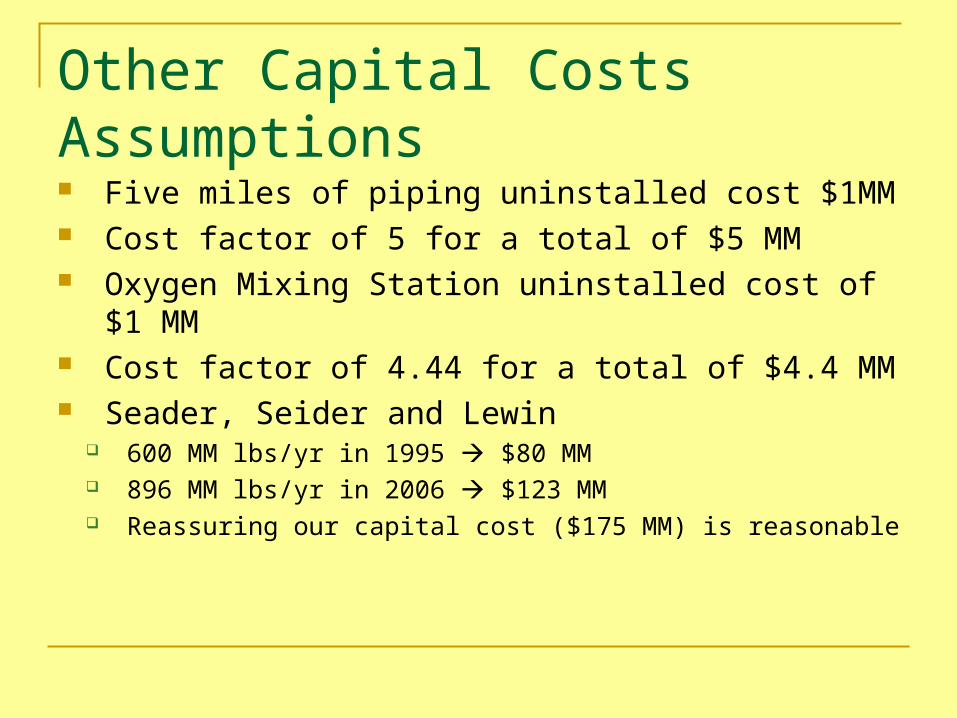
Other Capital Costs Assumptions Five miles of piping uninstalled cost $1MM Cost factor of 5 for a total of $5 MM Oxygen Mixing Station uninstalled cost of
$1 MM Cost factor of 4.44 for a total of $4.4 MM Seader, Seider and Lewin
600 MM lbs/yr in 1995 $80 MM 896 MM lbs/yr in 2006 $123 MM Reassuring our capital cost ($175 MM) is reasonable
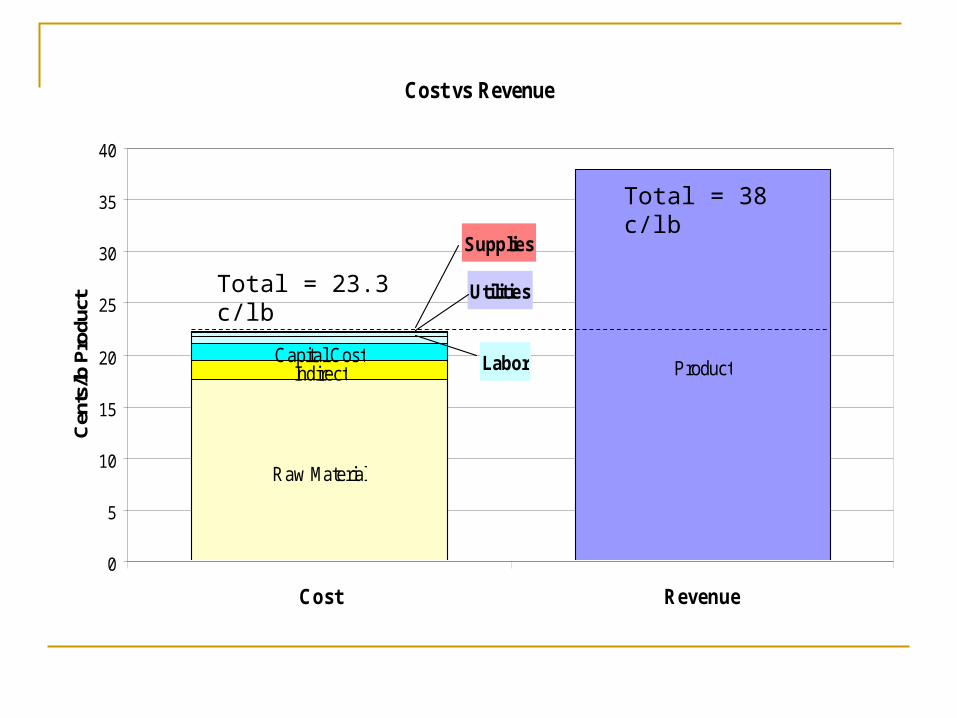
Cost vs Revenue
Product
Raw Material
IndirectCapital Cost Labor
Utilities
Supplies
0
5
10
15
20
25
30
35
40
Cost Revenue
Cen
ts/lb
Pro
duct
Total = 23.3 c/lb
Total = 38 c/lb
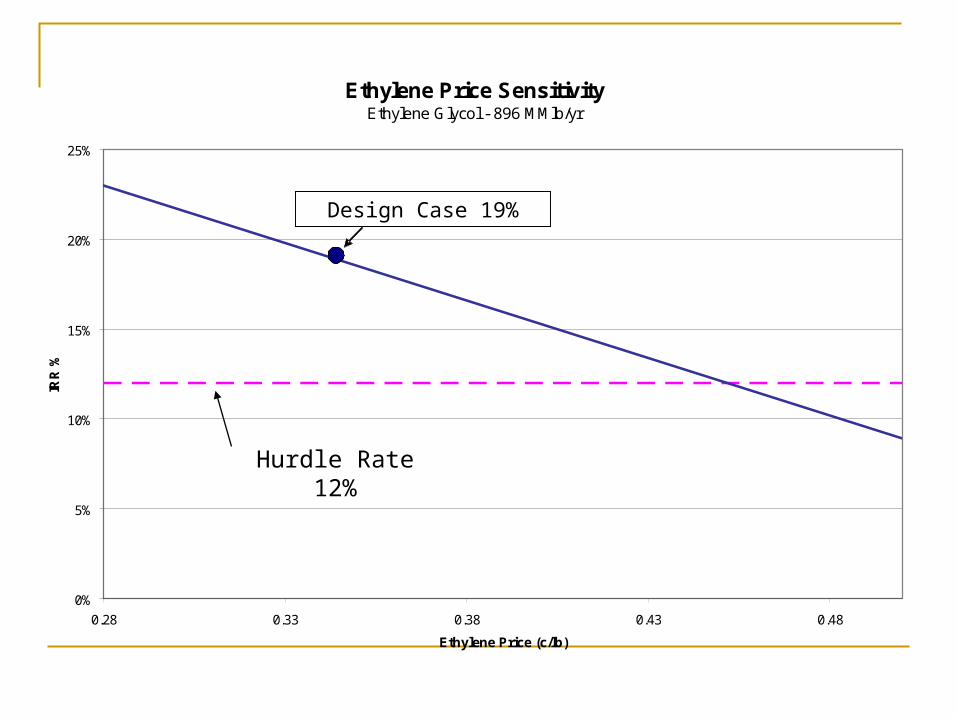
Ethylene Price SensitivityEthylene Glycol - 896 MMlb/yr
0%
5%
10%
15%
20%
25%
0.28 0.33 0.38 0.43 0.48
Ethylene Price (c/lb)
IRR
%
Design Case = 19%Design Case 19%
Hurdle Rate 12%
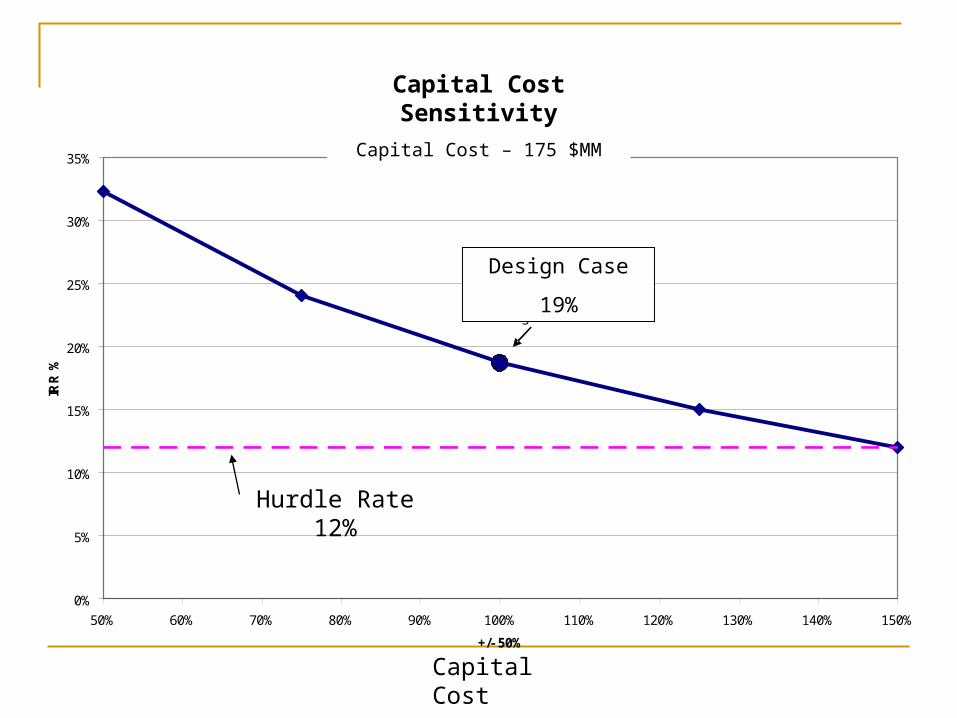
Capital Cost SensitivityEthylene Glycol - 896 MMlb/yr
0%
5%
10%
15%
20%
25%
30%
35%
50% 60% 70% 80% 90% 100% 110% 120% 130% 140% 150%
+/- 50%
IRR
%
Design Case = 19%
Design Case
19%
Hurdle Rate 12%
Capital Cost
Capital Cost Sensitivity
Capital Cost – 175 $MM
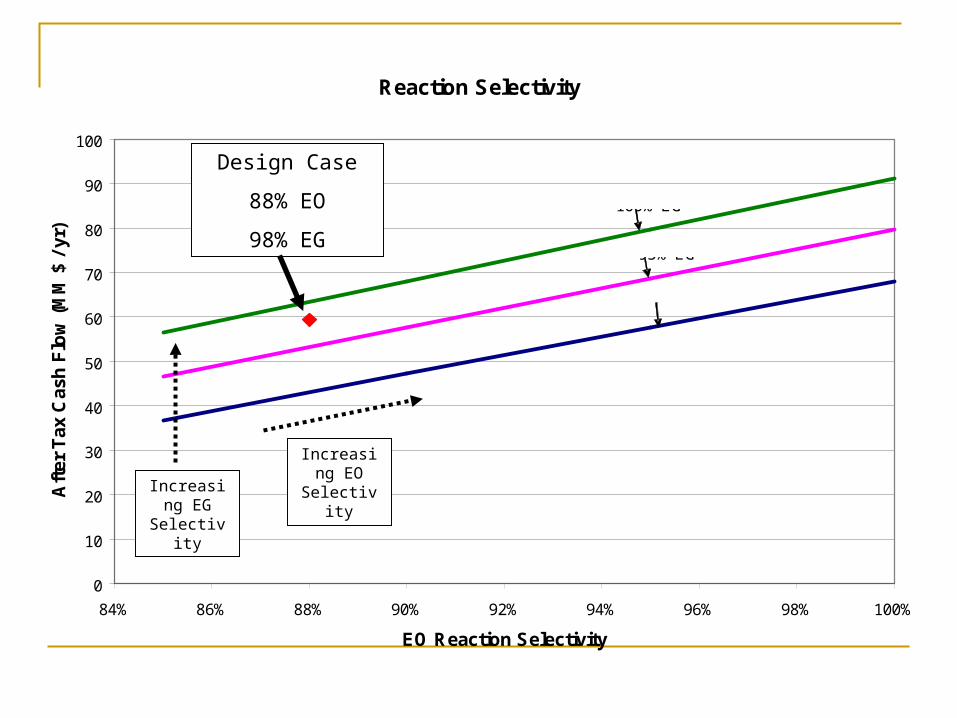
Reaction Selectivity
0
10
20
30
40
50
60
70
80
90
100
84% 86% 88% 90% 92% 94% 96% 98% 100%
EO Reaction Selectivity
Aft
er T
ax C
ash
Flo
w (
MM
$ /
yr)
90% EG
95% EG
100% EG
Design Case
88% EO
98% EG
Increasing EG
Selectivity
Increasing EO
Selectivity
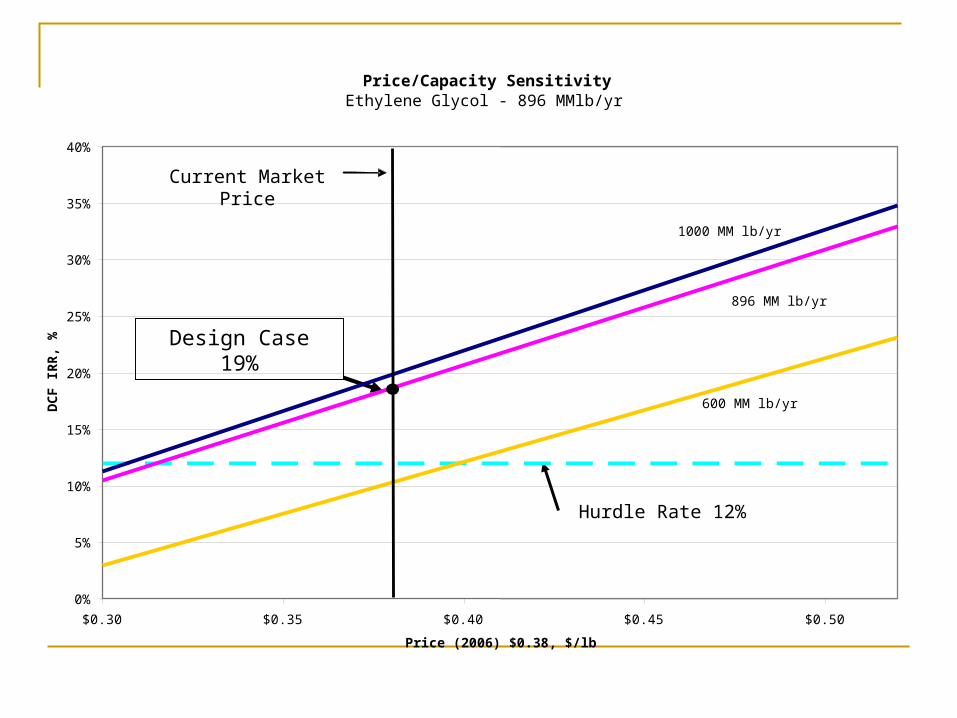
Design Case 19%
Hurdle Rate 12%
Current Market Price
Price/Capacity SensitivityEthylene Glycol - 896 MMlb/yr
0%
5%
10%
15%
20%
25%
30%
35%
40%
$0.30 $0.35 $0.40 $0.45 $0.50
Price (2006) $0.38, $/lb
DC
F IR
R, %
1000 MM lb/yr
896 MM lb/yr
600 MM lb/yr
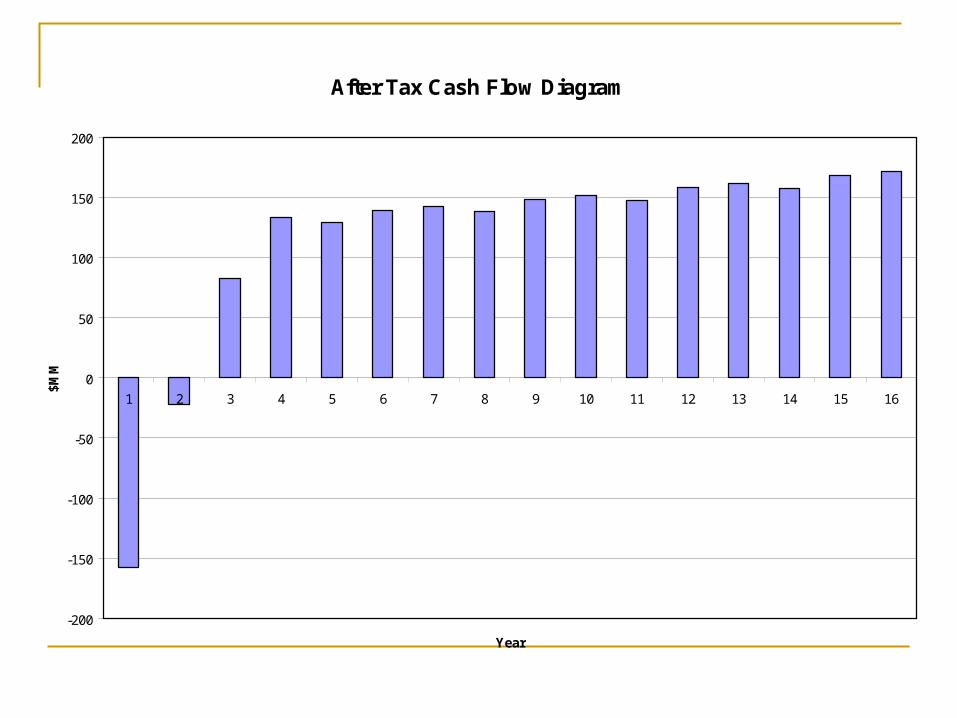
After Tax Cash Flow Diagram
-200
-150
-100
-50
0
50
100
150
200
1 2 3 4 5 6 7 8 9 10 11 12 13 14 15 16
Year
$MM
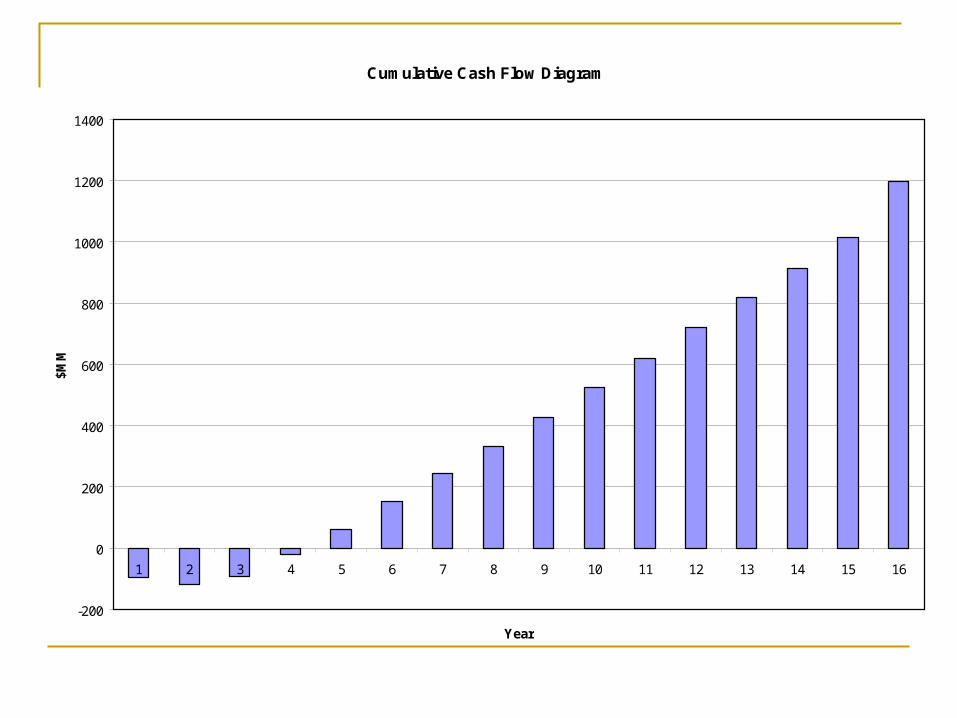
Cumulative Cash Flow Diagram
-200
0
200
400
600
800
1000
1200
1400
1 2 3 4 5 6 7 8 9 10 11 12 13 14 15 16
Year
$MM
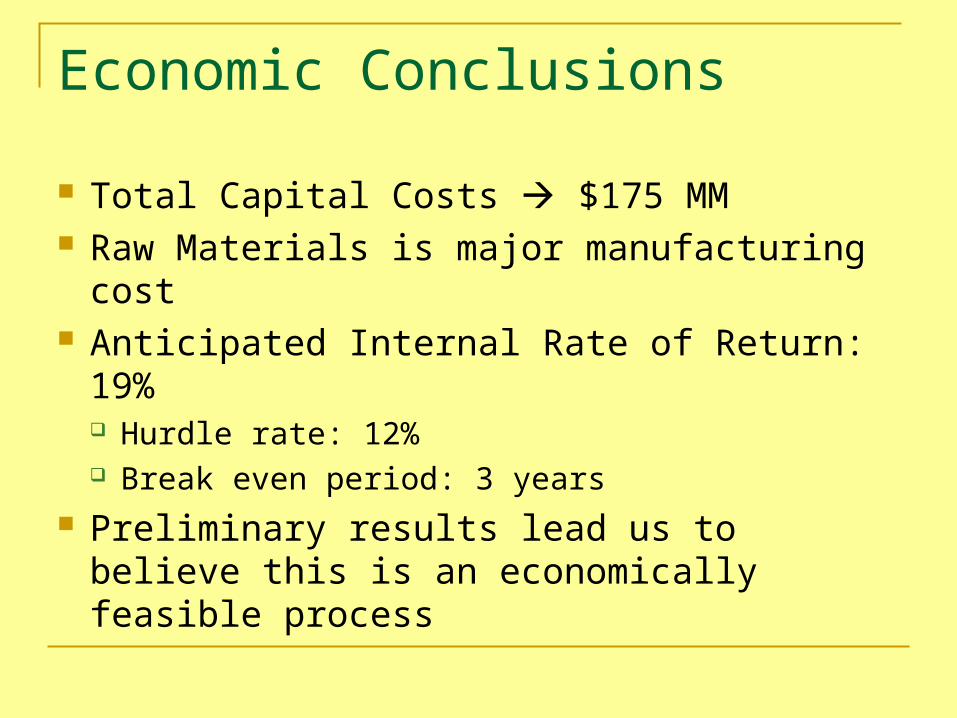
Economic Conclusions
Total Capital Costs $175 MM Raw Materials is major manufacturing cost Anticipated Internal Rate of Return: 19%
Hurdle rate: 12% Break even period: 3 years
Preliminary results lead us to believe this is an economically feasible process

Safety & EnvironmentConclusions & Recommendations
Suroor Manzoor
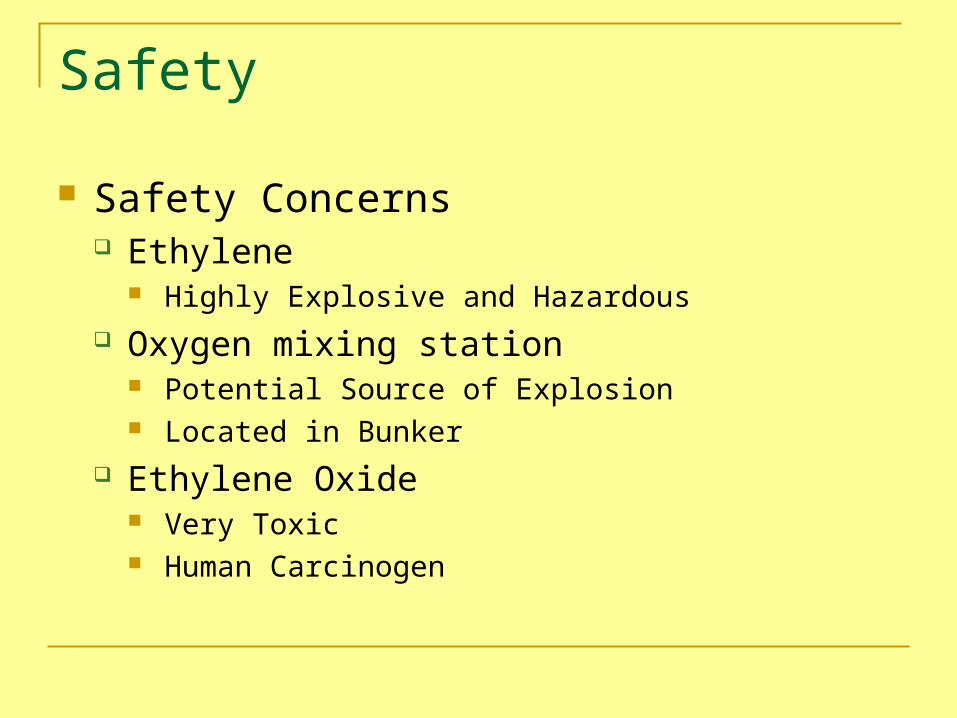
Safety
Safety Concerns Ethylene
Highly Explosive and Hazardous Oxygen mixing station
Potential Source of Explosion Located in Bunker
Ethylene Oxide Very Toxic Human Carcinogen
Safety
Risk Management Utilities Consideration
Shut off Oxygen & Ethylene Supply Back up generator Shut Down
Fire Prevention Fire Suppression System Shut off all gas streams
Wrong Feed Ratios
Risk Management Leaks and Spills
Ventilate Area Isolate Area Spill Collected or Absorbed
Process Waste Flare Recycle and Blending
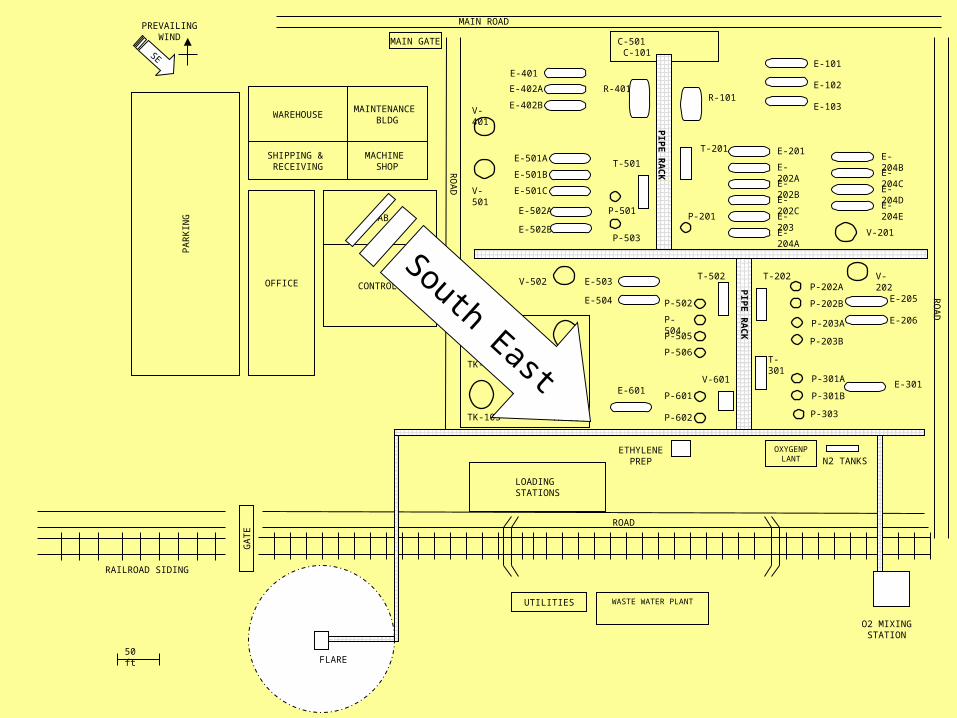
Plant Layout
Safety
WASTE WATER PLANT
MAIN ROADR
OA
D
RAILROAD SIDING
UTILITIES
50 ft
OXYGENPLANT
O2 MIXING STATION
ETHYLENE PREP
C-501 C-101
E-206
E-205
T-202
E-203
E-202A
E-201T-201
E-103
E-102
E-101
R-101R-401
E-502A
T-501
E-502BP-503
V-202
P-202B
V-201
P-201
E-301
T-301
V-501
P-202A
P-301A
P-301B
TK-101 TK-102
TK-103 TK-104
LOADING STATIONS
ROAD
WAREHOUSE
SHIPPING & RECEIVING
MAINTENANCE BLDG
MACHINE SHOP
N2 TANKS
T-502V-502
P-505
P-504
V-601
P-601
PIP
E R
AC
K
E-503
E-504P
IPE
RA
CKRO
AD
PA
RK
ING
MAIN GATE
CONTROL
LAB
FLARE
SE
PREVAILING WIND
GA
TE
OFFICE
P-501
P-303
P-502
P-506
E-202B
E-202C
E-204A
E-204B
E-204C
E-204E
E-204D
P-203B
P-203A
E-401
E-402A
E-402BV-401
E-501A
E-501B
E-501C
E-601
P-602
TK-105
South East
Environmental
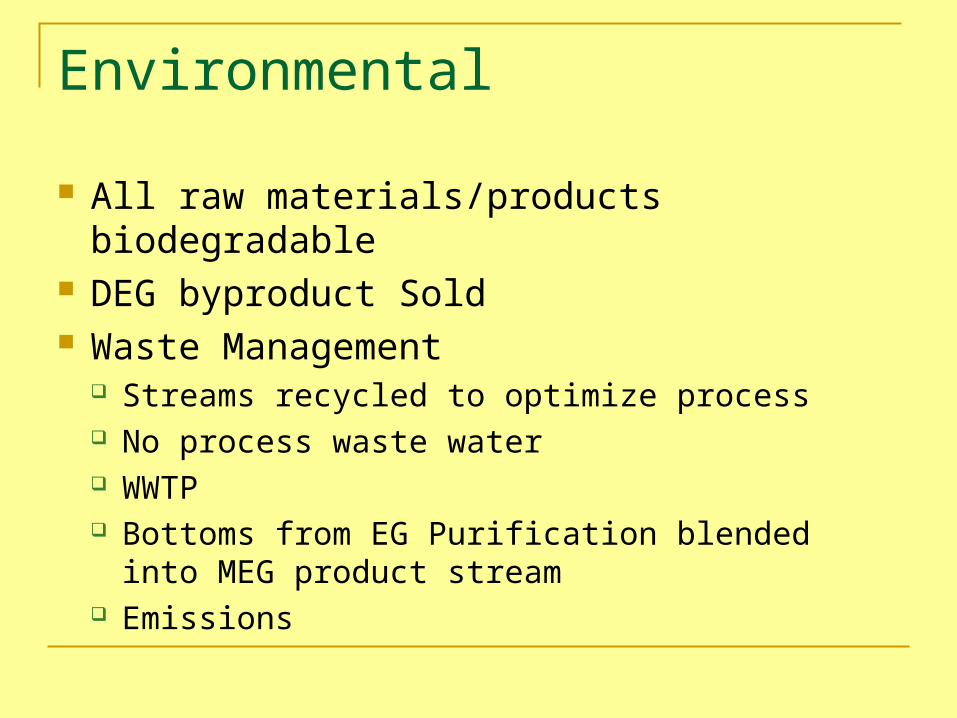
All raw materials/products biodegradable DEG byproduct Sold Waste Management
Streams recycled to optimize process No process waste water WWTP Bottoms from EG Purification blended into MEG
product stream Emissions
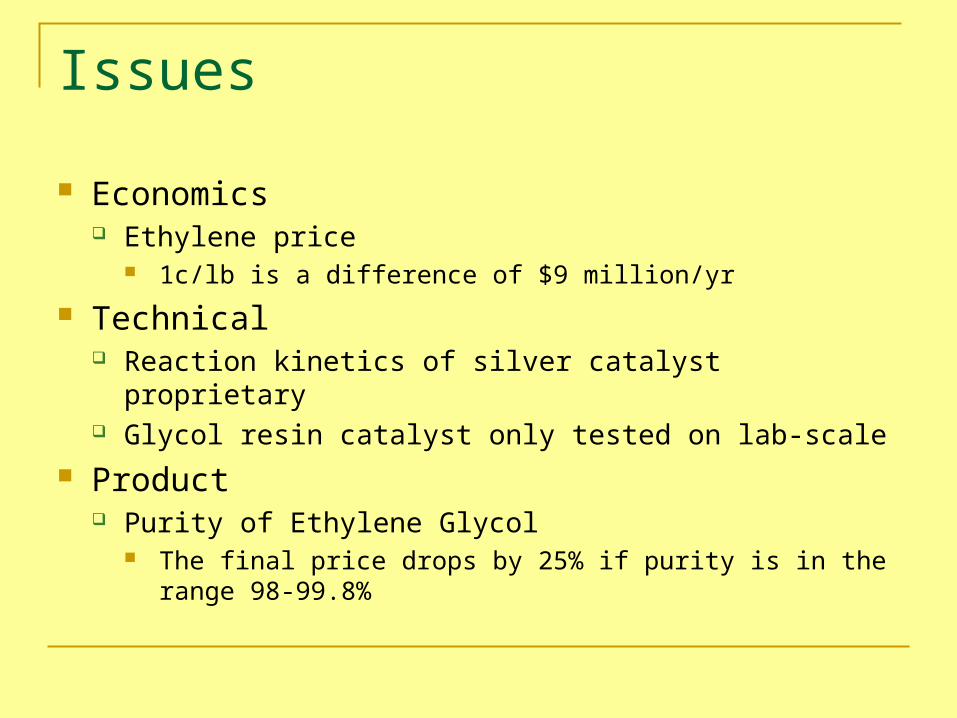
Issues
Economics Ethylene price
1c/lb is a difference of $9 million/yr
Technical Reaction kinetics of silver catalyst proprietary Glycol resin catalyst only tested on lab-scale
Product Purity of Ethylene Glycol
The final price drops by 25% if purity is in the range 98-99.8%
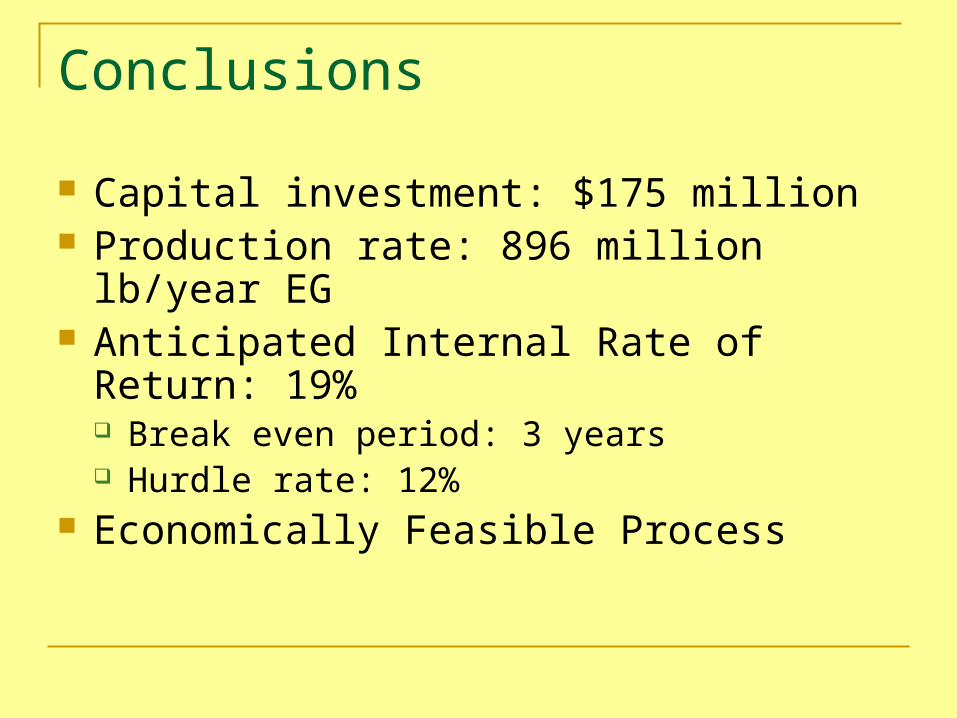
Conclusions
Capital investment: $175 million Production rate: 896 million lb/year EG Anticipated Internal Rate of Return: 19%
Break even period: 3 years Hurdle rate: 12%
Economically Feasible Process
Recommendations
Lock Ethylene price
Process Optimization Heating, Cooling CO2
Catalyst
Acknowledgements
Dr. George Rowell Mr. Steve Schon, P.E. Dr. Richard Cairncross Dr. Elihu Grossmann
Questions
Timre
ChongvsNick
Suroor