chattanooga/hamilton county food coalition
TRANSCRIPT
Wilson 1
Chattanooga/Hamilton County Food Coalition Community Food System Data Collection and Synthesis
M.K. Wilson December 15, 2012

Wilson 2
Table of Contents Chattanooga/Hamilton County Food Coalition Vision, Mission, and Values………………..3
Food Policy Council and Coalitions……………………………………….………………….3-4
Food Systems and Food Security, Conceptual Frameworks……………………………..…4-6
Food Policy, Food Systems, and Food Security…………………………………...…………7-8
Health……………………………………………………………………...…………………..9-11
Food Systems Education……………………………………………………..……………..12-15
Production and Consumption………………………………………………...……………16-24
Access…………………………………………………………………………………..…….25-30
Food Security……………………………………………………………………………..…30-34
Composting…………………………………………………………………………………..….35
Diffusion Theory………………………………………………………………………………..36
Considerations………………………………………………………...………………….…36-37
References……………………………………………………………………………………37-38

Wilson 3
Chattanooga/Hamilton County Food Coalition
Vision The vision of the Chattanooga/Hamilton County Food Coalition is a community with a thriving, comprehensive, and just local food system, where everyone has access to fresh and healthy food. Mission The mission of the Chattanooga/Hamilton County Food Coalition is to play a proactive role in creating a healthy sustainable local food economy through educating, advocacy, policy development, and collaboration. Values The Chattanooga/Hamilton County Food Coalition believes:
• Access to healthy food is a basic human right • Fairness and justice should be fundamental characteristics of the entire food system:
production, processing, distribution, consumption, and waste recovery. • It is important to promote local agriculture and preserve farmland to create a healthy and
sustainable community. • The food system should exist for the safety and health of everyone. • A healthy food system benefits the local economy.
Food Policy Councils and Coalitions
Tennessee is home to the country’s oldest Food Policy Council (FPC). Created in 1982, the city of Knoxville’s Food Policy Council began a comprehensive approach to food planning and security and became a model for proactive food systems thinking, organization, and action (knoxvillepolicycouncil.com). There are approximately 79 Food Policy Councils at the state or local level throughout the United States (CDC, 2009). “The central aim of most of today’s Food Policy Councils is to identify and propose innovative solutions to improve local or state food systems, making them more environmentally sustainable and socially just” (Harper, Shattuck, Holt-Gimenez, Alkon, & Lambick, 2009) A Food Policy Council differs from a Food Coalition in that councils are typically sanctioned and appointed by local government officials, while coalitions are not (Winne, Joseph, & Fisher, 1997). “Coalitions are seen as a primary way of promoting intersectoral health action” (Hawe & Stickney, 1997). Garrett and Feenstra (1999) suggest that foundational to building successful

Wilson 4
coalitions is joining relevant stakeholders from multiple formal and informal organizations in collaborative efforts. Community Food Coalitions build a defined organization and engage in structured, well-organized activities that benefit from a multi-participant initiative rather than a single group participation (Winne, Joseph, & Fisher, 1997).
Winne et al. (1997), describes the following benefits of forming a coalition (as cited in Garrett and Feenstra, 1999): • Allows the group to tackle complex issues through the insights of the multiple components of a food system • Improves coordination of services through increased communication of the coalition members • Policy development can be accomplished through the various constituencies brought to the table by the coalition members • Resources can be leveraged by in-kind match of project resources • Spreads the work by adding more players to an issue or project • Improves project viability by committing more groups to the issue or project • Provides perspective through the diversity of the members’ experiences • Builds multi-sector involvement in community food systems by groups not normally associated with food and agriculture programs
Food Systems and Food Security
The food system is defined as “the integrated process by which food is produced locally, imported, is packaged, processed, distributed/marketed, consumed, and the waste stream managed through reuse, composting, and disposal” (Ashmead & Zbeetnoff, 2009).
Goals of a Community Food System (Garrett & Feenstra, 1999)

Wilson 5
“The way in which the food system makes food available, accessible, acceptable, and adequate, affects the human, environmental, and economic health and the social equality of individuals and the economic health of communities. There are functional relationships between the regions’ food system and each of these factors” (Ashmead & Zbeetnoff, 2009). Deficiencies within a food system are important in understanding and assessing a food system, as well as cornerstones for mobilizing a community (Garrett & Feenstra, 1999). The U.S. Department of Agriculture (USDA, 2012) defines food security and insecurity in the following categories:
Food Security
• High food security: no reported indications of food-access problems or limitations. • Marginal food security: one or two reported indications--typically of anxiety over food
sufficiency or shortage of food in the house. Little or no indication of changes in diets or food intake.
Food Insecurity
• Low food security: reports of reduced quality, variety, or desirability of diet. Little or no indication of reduced food intake.
• Very low food security: Reports of multiple indications of disrupted eating patterns and reduced food intake.

Wilson 6
The following graphs show U.S. households by food security status and households with children by food security status (USDA, 2011). In addition the Food Security Logic Model (Ashmead & Zbeetnoff, 2009) serves as the conceptual framework for food security measurement indicators.
Enhanced Food Security Logic Model
Fundamentals
Actions-‐Outputs
Outcomes-‐Impacts
The Fo
Affordability (income, cost of food)
Knowledge (education, training on nutrition, health)
Food System (efficacy of production, land use, processing, dist., and marketing system)
Outputs-‐Actions (actions, programs, policies to improve food security status of individuals and communities)
Food Security Measurement Indicators
Improved Economic, Human, Environmental, and Social Health

Wilson 7
The Food Security Logic Model (Ashmead & Zbeetnoff, 2009) coincides with the stated values of the Chattanooga/Hamilton County Food Coalition. The Chattanooga/Hamilton County Food Coalition believes:
• Access to healthy food is a basic human right • Fairness and justice should be fundamental characteristics of the entire food system:
production, processing, distribution, consumption, and waste recovery. • It is important to promote local agriculture and preserve farmland to create a healthy and
sustainable community. • The food system should exist for the safety and health of everyone. • A healthy food system benefits the local economy.
Food Policy Council/Coalition, Food Systems & Food Security The Center for Disease Control (2009) compiled a listing by state of policy and environmental indicators including state-level farm-to-school policies, middle and high school competitive fruit and vegetable programs, percentages of farmers markets accepting EBT and WIC, and healthy food retail availability. Coinciding with this information, the data reflects the number of state and local food policy councils.
National Data (CDC, 2009)
• 72% of census tracts have healthier food retailers located within the tract 8 states have a state level policy for healthier food retail
• 1.7 farmers markets per 100,000 U.S. residents • 8% of farmers markets accept electronic benefits transfer (EBT) • 28% of farmers markets accept WIC Farmers Market Nutrition Program coupons • 21% of middle and high schools offer fruits and non-fried vegetables as competitive
foods • 21 states have a state-level policy for Farm to School • 2.5% of U.S. cropland acreage is harvested for fruits and vegetables • 20 states have a state-level Food Policy Council • 59 local Food Policy Councils exist around the country
Tennessee Data (CDC, 2009)
• 68% of census tracts have healthier food retailers located within the tract • 1 farmers markets per 100,000 U.S. residents • 0% of farmers markets accept electronic benefits transfer (EBT) • 9.2% of farmers markets accept WIC Farmers Market Nutrition Program coupons • 14.7%% of middle and high schools offer fruits and non-fried vegetables as competitive
foods • States have a state-level policy for Farm to School • .8% of U.S. cropland acreage is harvested for fruits and vegetables

Wilson 8
• No state-level Food Policy Council • 2 local Food Policy Councils

Wilson 9
Health
One of the goals of a community food system is to promote human health (Garrett & Feenstra, 1999).
With 70% of adults in Tennessee currently classified as overweight or obese, the projected rate by 2025 will be almost 80% (Tennessee Statewide Nutrition Plan, 2010). Tennesseans have considerable opportunity to improve their health through promotion of healthy food consumption and healthy environments. The Center for Disease Control (Healthy Community Design Checklist) suggests healthier and more affordable food choices as a key component to in creating a healthier community design. Healthier food choices in grocery stores, community gardens, farmers markets, and fewer fast food/convenience/liquor stores assist in the goal of providing a community with healthier and more affordable food options (CDC, 2012).
Tennessee Health Fast Facts as of 2009
• Tennessee ranked as the 4th fattest state in the country having the second highest prevalence of overweight, the third highest prevalence of obesity, and the fourth highest prevalence of extreme obesity.
• Obesity in Tennessee increased 3-fold from 1997 to 2009

Wilson 10
• 70% or 3,150,000 of Tennessee adults were classified as overweight or obese • 39% or 1,560,000 of Tennessee adults had been diagnosed with high blood pressure • 10% or 490,000 of Tennessee adults had been diagnosed diabetes • Tennessee adults have a higher prevalence of high blood pressure and diabetes than the
national average • 78% of Tennessee adults eat less than the recommended 5 fruits and vegetables a day • 64% of Tennessee adults do not meet the standard physical activity recommendation • Approximately 47% of Tennessee youth are classified as overweight or obese
The Governor and Health Commissioner of Tennessee have recently supported the Statewide Nutrition and Physical Activity Plan (2010) that will leverage resources and coordinate statewide efforts to address increasing healthy and affordable foods through the following objectives:
• Objective 1 - Promote local or statewide policies, which provide financial incentives and technical assistance for grocery stores locating in underserved neighborhoods, modeled on Pennsylvania’s Fresh Food Financing Initiative.
• Objective 2: Advocate for neighborhood plans to incorporate an analysis and proposed solutions related to food security issues, especially in low-income areas.
• Objective 3: Provide training and incentives to small store owners in underserved areas to carry healthier food items, such as fresh produce.
• Objective 4: Increase the production, distribution and procurement of food from Tennessee farms.
• Objective 5: Increase the use of Women, Infants and Children (WIC) cash value vouchers for the purchase of fresh fruits and vegetables.
• Objective 6: Establish a Tennessee Food Policy Council to build support for healthy eating policy and environmental change.

Wilson 11
Hamilton County Health Fast Facts
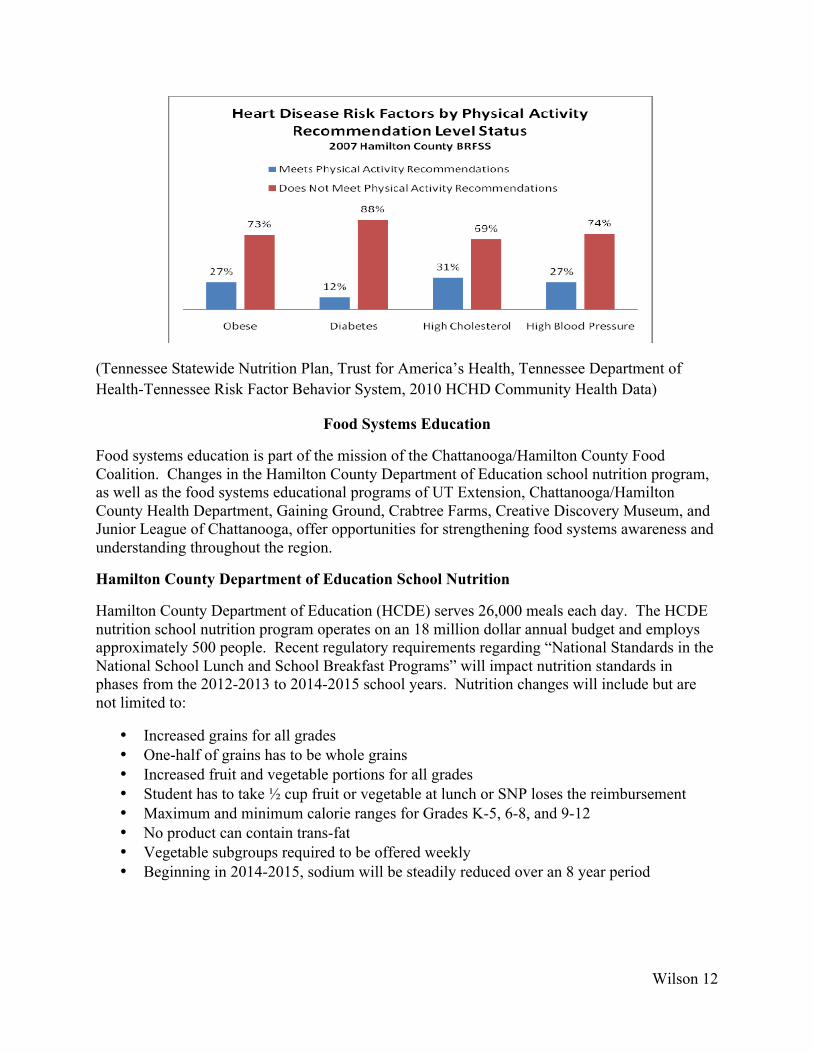
• 57% of Hamilton County adults were classified as overweight or obese. • 30% of Hamilton County adults have been told they have high blood pressure • 31% of Hamilton County adults have been told they have high cholesterol • 74% of Hamilton County adults eat less than the recommended 5 fruits and vegetables a
day • 63% of Hamilton County adults do not meet the standard physical activity recommended • Nearly 2/3 of low-income children in Hamilton County are overweight or obese, with
approximately 16% in the 95% BMI percentile
Prevalence for Behavioral Risk Factors of Hamilton County Adults 2009 Risk Factor Total Eating < 5 Fruits & Vegetables per Day (%) 73.8 Not Meeting Physical Activity Recommendation (%) 63.6 Overweight or Obese
56.8
Have Not Checked Cholesterol Within the Past 5 Years (%) 16.8 Ever Told High Cholesterol (%)
30.4
Ever Told High Blood Pressure (%) 31.1
Overweight and Obesity Rates of Hamilton County Adults from 2005 to 2009
Wilson 12
(Tennessee Statewide Nutrition Plan, Trust for America’s Health, Tennessee Department of Health-Tennessee Risk Factor Behavior System, 2010 HCHD Community Health Data)
Food Systems Education
Food systems education is part of the mission of the Chattanooga/Hamilton County Food Coalition. Changes in the Hamilton County Department of Education school nutrition program, as well as the food systems educational programs of UT Extension, Chattanooga/Hamilton County Health Department, Gaining Ground, Crabtree Farms, Creative Discovery Museum, and Junior League of Chattanooga, offer opportunities for strengthening food systems awareness and understanding throughout the region.
Hamilton County Department of Education School Nutrition
Hamilton County Department of Education (HCDE) serves 26,000 meals each day. The HCDE nutrition school nutrition program operates on an 18 million dollar annual budget and employs approximately 500 people. Recent regulatory requirements regarding “National Standards in the National School Lunch and School Breakfast Programs” will impact nutrition standards in phases from the 2012-2013 to 2014-2015 school years. Nutrition changes will include but are not limited to:
• Increased grains for all grades • One-half of grains has to be whole grains • Increased fruit and vegetable portions for all grades • Student has to take ½ cup fruit or vegetable at lunch or SNP loses the reimbursement • Maximum and minimum calorie ranges for Grades K-5, 6-8, and 9-12 • No product can contain trans-fat • Vegetable subgroups required to be offered weekly • Beginning in 2014-2015, sodium will be steadily reduced over an 8 year period

Wilson 13
University of Tennessee/Tennessee State University Extension University of Tennessee/TSU Extension family and consumer science programs directly impact approximately 10,000 youth and adults, and indirectly impact an additional 2 million individuals. An estimated 500 volunteers and agents utilized more than 50,000 hours of time to support these initiatives. Most programs are free and tax dollar funded, some fee based classes are offered, a $150,000 2-year grant funded some educational programs, partnerships with other agencies and businesses fund some programs. Incentives included Tennessee Saves enrollment
In addition to these programs, the Master Gardeners and AgVentures programs involve an estimated 1000 participants and volunteers. The Master Gardeners recently generated approximately $60,000 in support funds for the Chattanooga Area Food Bank greenhouse and educational center. Below is a detailed listing of UT/TSU Extension programs:
Adults Programs
Preserving Food Safely - the only local class teaching USDA recommended methods of preserving food safely.
Holiday Planning- discussing planning ahead & preparing low cost, nutritious foods
Family Budgeting- ongoing financial education classes incorporate the cost of food in the family budget and the impact of eating out, also the financial and nutritional costs of drinks & snacks
Stretching Your Food Dollar- targeted non-profits working with low income families featuring Extension’s EFNEP and TNCEP programs and materials.
United Way FINRA (Financial Industry Regulatory Authority) 2-year grant program trained nonprofits, government and educational agencies who serve low income families- many who rely on government and agency assistance to feed their families.
An outgrowth of the FINRA grant is the Sound Money And Rental Tools (SMART) program training low income families life skills in order to receive a certificate to improve their chances of locating safe, affordable housing. Food budget choices are discussed.
Small Things Add Up - Exhibits & posters at worksites, health fairs, schools, agencies, etc. show examples of the opportunity costs of snacks and eating out on investment income lost.
Tennessee Saves Week- promotes money saving messages. One thousand basil seed packets are distributed annually- with the message to “Make Your Savings Grow.” Save money by growing food (as easy as small as container herbs) and preparing food at home.
Tennessee Saves enrollment kits- participants in educational classes set savings goals and receive an enrollment kits that includes information on making wise food choices including gardening, preparation, etc.

Wilson 14
Teen Programs
Who Wants to Be a Millionaire high school program- reaches 1,500 Hamilton County high school juniors annually with the cost and health implication of eating out versus meals prepared at home.
Reality Check high school program- reaches 1,400 Hamilton County high school freshmen annually with the message of the food cost in the family budget and the impact on food choices.
Chick Chain – for grades 4-12 and utilizes curriculum focused on livestock and responsibility
Master Gardeners Greening up Chattanooga
Chattanooga Area Food Bank Garden - 8 classes/workshops year to date: 175 participants BUGS (Building Urban Garden Stewards) – 28 Classes scheduled for June and July with Parks and Rec Center youth involving 220 participants total. 7 Rec Centers participating, sending 25-40 children each time. Educational Fieldtrips and Workshops – Events include the Community Garden roundtable, Chattanooga Outdoors fieldtrip, rain barrel construction workshops, maintenance of butterfly/hummingbird garden in the Aquarium Plaza, assistance at the Tennessee Aquarium, beginner/newcomer gardening class, community garden start-up assistance, educational activities at Siskin Children’s Garden and Crabtree Farms, landscaping Habitat for Humanity homes
AgVentures
The University of Tennessee Knoxville & Tennessee State University - Hamilton County Extension conducts an educational field day adventure for fourth grade youth at Title I schools in Chattanooga, TN. This program reached approximately 220 children in 2011 and involved 100 volunteers. Schools classified as Title I consist of students that are at risk of failure and come from low income families that are living at or near poverty. The five hour event is organized in an effort to educate youth about where food comes from. Hands on activities are used to assist youth in developing an understanding of commodities that appear in nature and why they are important to human livelihood.
Center for Profitable Agriculture
As a department in UT Extension, the Center for Profitable Agriculture provides educational programming and technical assistance to Tennessee Farmers interested in a value-added enterprise to improve farm income. Evaluating the costs of starting a new enterprise, navigating regulatory issues and identifying a potential market are some of the many challenges farmers may face when considering a value-added enterprise. Educational programs, workshops, and webinars offered include information regarding: value-added beef, value-added dairy, farmers market boot camps, direct farm marketers and agritourism, farmers interested in marketing to restaurants, and fruit and vegetable harvesting.

Wilson 15
Gaining Ground
The Local Food Program promotes awareness, purchase, and consumption of food grown within 100 miles of Chattanooga. It its simplest form, the program aspires to helps consumers understand the value of locally-grown food to our community and to their families while also helping them identify and buy local food in the marketplace. 27 restaurants, food artisans, and farmers’ markets are listed in Taste Buds local food map as establishments that regularly offer ingredients and whole foods from regional farms.
YMCA
The mission of the YMCA is to put Christian principles into practice through programs that build healthy spirit, mind and body for all. Beyond fitness facilities, the YMCA provides educational programs to promote healthier decisions, and offer a variety of p
The Summer Feeding Program – This program collaborative provided more than 8,000 children, at-risk in Chattanooga healthy, nutritious meals during summer break. This summer over 36,000 meals were provided to over 50 sites including North Georgia .programs that support physical, intellectual and spiritual strength.
Nutrition for You – This six-week nutrition class covers topics including nutrition basics, reading nutritional labels, finding healthy options at the grocery store and on the go, and more. Improving overall health, increasing energy, and achieving body weight goals are the purposes of this class.
Chattanooga/Hamilton County Health Department
The mission of Step One is to create a culture in Hamilton County where residents choose to practice good nutrition and exercise regularly. Physical inactivity is costing Hamilton County an estimated $225,307,423 per year through medical care, workers comp, and lost productivity (Bilderback, Step One). Awareness and educational health promotion programs will readily repay its cost in the reduced future medical expenses of participants. The Step ONE program will initiate a long-term process in the community that is expected to result in healthy lifestyle changes through greater involvement in better nutritional practices and more exercise and fitness activities.
Junior League of Chattanooga Junior League of Chattanooga (JLC) has an active membership of approximately 200 volunteers. Junior League of Chattanooga’s recent gave $150,000 of support to the Chattanooga/Hamilton County Health Department/Step ONE Eat Smart program to address obesity among children age 6 to 11 years with a three-fold focus on homes (families), schools and dining establishments.
Seeds of Change – The signature focus of JLC for the next several years will focus on food insecurity issues throughout Chattanooga. Volunteer support of the Chattanooga Food Bank, a special event titled Kids in the Kitchen, mini-grant support to HCDE teachers with special

Wilson 16
project needs relating to food and nutrition, and advocacy related to food desserts, will be the focus of JLC’s volunteer efforts.
Crabtree Farms Dig in Kids Education -Field Trips are for K-6th grade children to learn about food, science and nature hands-on. During a Field Trip to the Farm, students engage in various activities that are farming related (such as planting seeds and tasting unusual vegetables). These activities are hands-on and enable the students to experience urban agriculture first hand. The activities can be tailored to the groups’ age and grade.
Community Gardens Start-Up Workshop - Crabtree Farms educates and supports community gardeners in Chattanooga through an annual Community Garden Start-Up Workshop, outreach, consultation and email updates.
School Gardens - School gardens engage students on so many levels, providing a dynamic environment to observe, experiment, discover, question and learn. In school gardens, children can discover the complexity of ecosystems, gain an appreciation for food and living things, and learn about plant and animal life cycles.
Creative Discovery Museum
Culinary Corner - The Culinary Corner has an annual impact on approximately 3000 children and adults. It is designed to provide children with a hands-on opportunity to interact with food through cooking classes and special culinary events. Children ages 5 and older and their parents participate. Produce and herbs grown from seed at the CDM rooftop garden is incorporated into the Culinary Corner classes and activities.
Production and Consumption
Farming: Acres and Agriculture Receipts
“Agriculture in Tennessee has experienced an increase in the number of farms and in the value of sales from farms through value-added agriculture, direct marketing and agritourism, as shown in census data from 1997 to 2007” (Bruch and Holland, 2007).
The 100-mile region surrounding Chattanooga is situated between the Appalachian Mountains and the Cumberland Plateau and covers 28,00 square miles (ASAP, 2011). This region supports growth of 42 types of fruit and vegetables, as well as pastureland for livestock and other farm animals (ASAP, 2010). From 2002 to 2007 this 100-mile area increased cash receipts from agricultural products by more than 66 percent, growing from $2.1 billion to $3.5 billion (Ochs Center for Metropolitan Studies, 2008 as cited in ASAP, 2011).
The 2010 and 2011 ASAP reports provide an extensive and thorough review of production and consumption in the 100-mile region food shed. Below are highlighted facts from these reports.

Wilson 17
Chattanooga
MSA Greater
Chattanooga 50-Mile Region 100-Mile Region
Number of Residents (approx.) 528,143 1,000,000 1,400,000 4,000,000
Agriculture Receipts Generated $169,000,000 $1,100,000,000 $1,800,000,000 $3,500,000,000
Number of Farms 2358 12,000 18,000 49,000 Number of Farmers ----- 18,000 26,500 73,000
Acres of Farms 261,000 1,400,000 2,200,000 6,000,000 Average Farm Size 111 117 124 117
Number of farms and acres of farmland in the greater Chattanooga area had an overall increase from 2002 to 2007. The table below shows trends in farm numbers and farmland acreage in Greater Chattanooga from 2002 to 2007. “Farm numbers increased from 11,665 in 2002 to 12,083 in 2007, a 4% increase. The most significant gains occurred in farms that are less than 50 acres (an increase of 639 farms); the biggest losses occurred with farms 140 to 179, 220 to 259, and 500 to 999 acres (a decrease of 165 farms). The data also shows a 2% decrease in farm acreage (a loss of about 24,000 acres), which corresponds with the increasing number of smaller farms and loss of farms with larger acreage” (ASAP, 2010).
Number of Farms and Acres of Farmland, Greater Chattanooga Farm Size in Acres 2002 2007 Change % Change 1 to 9 695 855 160 19 10 to 49 4454 4933 479 10 50 to 69 1332 1265 -67 -5 70 to 99 1236 1270 34 3 100 to 139 1182 1131 -51 -5 140 to 179 731 657 -74 -11 180 to 219 417 417 0 0 220 to 259 330 297 -33 -11 260 to 499 751 814 63 8 500 to 999 367 309 -58 -19 1,000 to 1,999 105 106 1 1 2,000 or more 29 29 0 0 TOTAL 11,629 12,083 454 4 Acres in Farms 1,440,883 1,416,461 -24,422 -2 Average Farm Size 124 118 -6 -5
Consumption
Hamilton County, City of Chattanooga, and Greater Chattanooga Consumption
Wilson 18
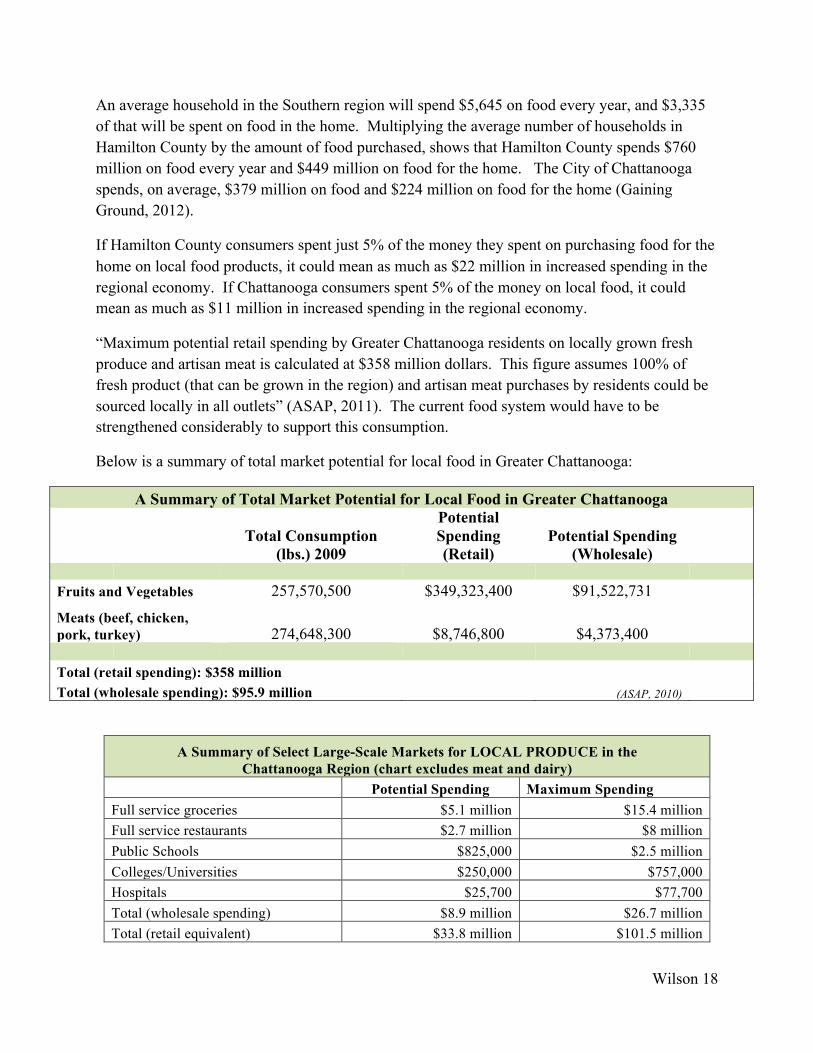
An average household in the Southern region will spend $5,645 on food every year, and $3,335 of that will be spent on food in the home. Multiplying the average number of households in Hamilton County by the amount of food purchased, shows that Hamilton County spends $760 million on food every year and $449 million on food for the home. The City of Chattanooga spends, on average, $379 million on food and $224 million on food for the home (Gaining Ground, 2012).
If Hamilton County consumers spent just 5% of the money they spent on purchasing food for the home on local food products, it could mean as much as $22 million in increased spending in the regional economy. If Chattanooga consumers spent 5% of the money on local food, it could mean as much as $11 million in increased spending in the regional economy.
“Maximum potential retail spending by Greater Chattanooga residents on locally grown fresh produce and artisan meat is calculated at $358 million dollars. This figure assumes 100% of fresh product (that can be grown in the region) and artisan meat purchases by residents could be sourced locally in all outlets” (ASAP, 2011). The current food system would have to be strengthened considerably to support this consumption.
Below is a summary of total market potential for local food in Greater Chattanooga:
A Summary of Total Market Potential for Local Food in Greater Chattanooga
Total Consumption (lbs.) 2009
Potential Spending (Retail)
Potential Spending (Wholesale)
Fruits and Vegetables 257,570,500 $349,323,400 $91,522,731
Meats (beef, chicken, pork, turkey) 274,648,300 $8,746,800 $4,373,400 Total (retail spending): $358 million
Total (wholesale spending): $95.9 million (ASAP, 2010)
A Summary of Select Large-Scale Markets for LOCAL PRODUCE in the Chattanooga Region (chart excludes meat and dairy)
Potential Spending Maximum Spending Full service groceries $5.1 million $15.4 million Full service restaurants $2.7 million $8 million Public Schools $825,000 $2.5 million Colleges/Universities $250,000 $757,000 Hospitals $25,700 $77,700 Total (wholesale spending) $8.9 million $26.7 million Total (retail equivalent) $33.8 million $101.5 million

Wilson 19
Value of Agricultural Products Sold
Value of Agriculture Products Sold in 2007
100-mile Region 50-mile Region Greater
Chattanooga Region Value of crops including nursery and greenhouse $475,207,000 $215,111,000 $86,465 Value of livestock, poultry and their products $3,026,165,000 $1,594,325,000 $690,464 Total $4,501,172,000 $1,809,436,000 $776,929 % Livestock/poultry of total region 86% 88% 89% (USDA, 2007 as cited in ASAP, 2010)
Value of Sales by Commodity Group for 100-Mile Region Total % of Total Aquaculture $16,000 0.00% Cut Christmas trees and short rotation woody crops $292,000 0.01% Other animals and other animal products $1,353,000 0.04% Sheep, goats, and their products $3,463,000 0.10% Tobacco $4,406,000 0.13% Fruits, tree nuts, and berries $5,308,000 0.16% Vegetables, melons, potatoes, and sweet potatoes $15,823,000 0.46% Horses, ponies, mules, burros, and donkeys $20,068,000 0.59% Hogs and pigs $24,521,000 0.72% Other crops and hay $28,149,000 0.82% Cotton and cottonseed $31,940,000 0.94% Milke and other dairy products from cows $99,679,000 2.92% Grains, oilseeds, dry beans, and dry peas $118,310,000 3.47% Nursery, greenhouse, floriculture, and sod $247,665,000 7.25% Cattle and calves $395,291,000 11.58% Poultry and eggs $2,418,073,000 70.82%
100-mile Region Farms by Value of Sales in 2007 Value Number of Farms Percentage of Total Less than $1000 15,748 32% $1000 to $2499 6809 14% $2500 to $4999 6020 12% $5000 to $9999 6767 14% $10,000 to $19,999 5047 10% $20,000 to $24,999 1274 3%
Wilson 20
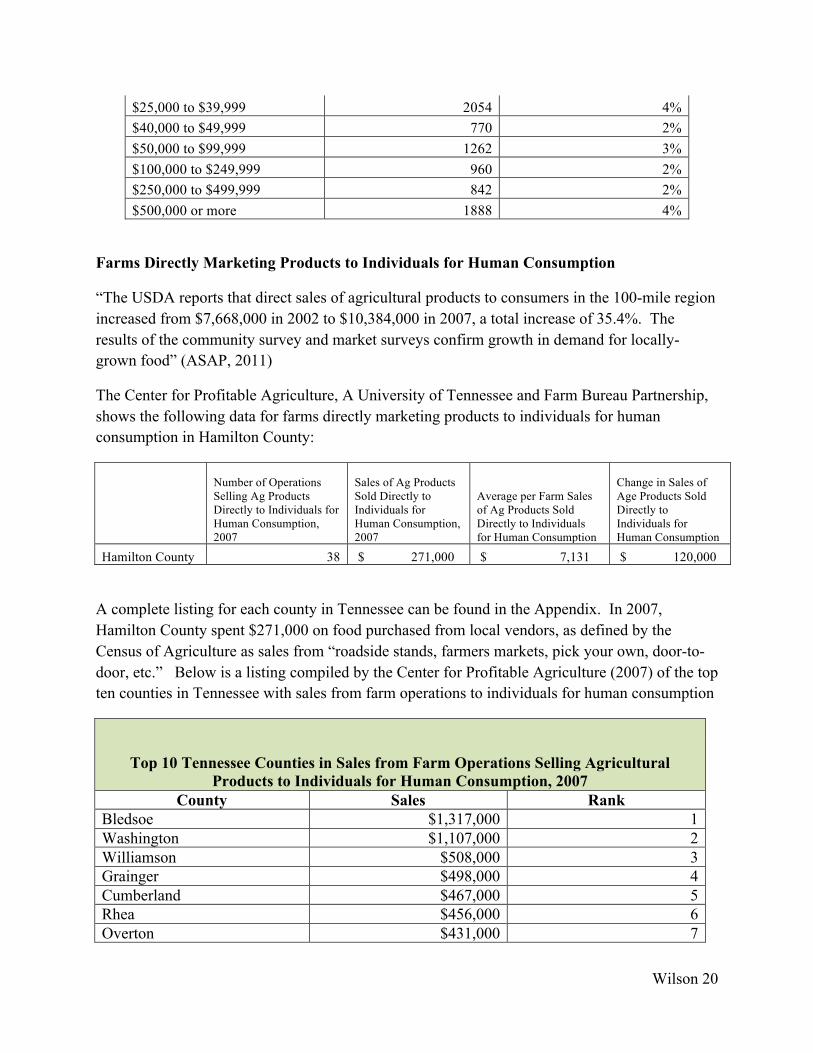
$25,000 to $39,999 2054 4% $40,000 to $49,999 770 2% $50,000 to $99,999 1262 3% $100,000 to $249,999 960 2% $250,000 to $499,999 842 2% $500,000 or more 1888 4%
Farms Directly Marketing Products to Individuals for Human Consumption
“The USDA reports that direct sales of agricultural products to consumers in the 100-mile region increased from $7,668,000 in 2002 to $10,384,000 in 2007, a total increase of 35.4%. The results of the community survey and market surveys confirm growth in demand for locally-grown food” (ASAP, 2011)
The Center for Profitable Agriculture, A University of Tennessee and Farm Bureau Partnership, shows the following data for farms directly marketing products to individuals for human consumption in Hamilton County:
Number of Operations Selling Ag Products Directly to Individuals for Human Consumption, 2007
Sales of Ag Products Sold Directly to Individuals for Human Consumption, 2007
Average per Farm Sales of Ag Products Sold Directly to Individuals for Human Consumption
Change in Sales of Age Products Sold Directly to Individuals for Human Consumption
Hamilton County 38 $ 271,000 $ 7,131 $ 120,000
A complete listing for each county in Tennessee can be found in the Appendix. In 2007, Hamilton County spent $271,000 on food purchased from local vendors, as defined by the Census of Agriculture as sales from “roadside stands, farmers markets, pick your own, door-to-door, etc.” Below is a listing compiled by the Center for Profitable Agriculture (2007) of the top ten counties in Tennessee with sales from farm operations to individuals for human consumption
Top 10 Tennessee Counties in Sales from Farm Operations Selling Agricultural Products to Individuals for Human Consumption, 2007
County Sales Rank Bledsoe $1,317,000 1 Washington $1,107,000 2 Williamson $508,000 3 Grainger $498,000 4 Cumberland $467,000 5 Rhea $456,000 6 Overton $431,000 7

Wilson 21
Lincoln $422,000 8 Lawrence $336,000 9 Gibson $336,000 9
(CPA, 2007)
Famers’ Markets Listing
1. Cumberland Online Farmers Market 2. Main St Farmers Market 3. Signal Mt Farmers Market 4. Blue Cross/Blue Shield Farmers Market 5. Scenic City Online Farmers Market 6. Brainerd Farmers Market 7. St Albans farmers Market 8. Trenton Farmers Market 9. Battlefield Farmers Market 10. Mentone Farmers Market 11. North Sand Mt Farmers Market 12. Earth Fare Farmers Market 13. Chattanooga Market
Survey Data from Farmers Market Vendor and Public Assessment 2011
Gaining Ground administered a survey in 2011 to gather information about area farmers markets. The survey was conducted via email using Survey Monkey and was sent to email lists from all major farmers markets, Crabtree Farms, Gaining Ground, and a number of farms and major employers in Chattanooga. The survey was promoted through social media outlets, including Facebook, as well as through WUTC radio station, 88.1. Shoppers Approximately 815 Farmers’ market shoppers participated in the survey. Of the respondents, almost 70% shopped at a farmers’ market either weekly or several times a month.
How often do you shop at a farmers market?
Weekly
A few times a month

Wilson 22
Over 80% of shoppers lived within 10 miles of a farmers’ market. 79% of shoppers felt that shopping at a farmers’ market changed their food habits through eating a wider variety of fruits and vegetables and 76% stated they ate more fruits and vegetables due to shopping at the market. When choosing what farmers’ market to attend the top four reasons for shoppers was quality of meats and vegetables, by proximity to home, price, and variety of food options. Variety of food options and price were stated as the most important in encouraging more frequency in shopping at farmers’ markets. Shoppers were most likely to hear about farmers’ markets through friends and family and the internet.
Farmers, Food Processors, Craftsmen
Approximately 70 farmers, food processors, and craftsmen completed the Gaining Ground survey. The size of total acres of vendors’ farms is reflected below:
How many total acres is your farm?
Answer Options Response Percent
Not applicable 11.7% 1-10 acres 31.7% 11-20 acres 10.0% 21-40 acres 11.7% 41-80 acres 11.7% 81-150 acres 8.3% 151-300 acres 10.0% 301-800 acres 3.3% 801 acres and up 1.7%
Vendors were also asked how important farmers markets were to their business.
0 5
10 15 20 25 30 35 40 45
Farmers markets are very important for the success of my business I enjoy selling at the farmers market, but I do not have to sell there for my business to be successful I want to sell at the farmers market but wish I could have other sales options outside the farmers market I would rather not sell at a farmers market if I did not have to
How would you agree with the following concerning the importance of the farmers market to your business?
I agree I disagree I do not know

Wilson 23
Fruits, vegetables, and eggs were shown to be the top three primary sellers.
42% suggested that they could use more education about vegetables and fruit, and 67% desired help in marketing and promoting their products. Vendors were more likely to travel further distances than shoppers, with 40% traveling more than 30 miles to get to the market.
Production and Consumption in Greater Chattanooga
0.0%
10.0%
20.0%
30.0%
40.0%
50.0%
60.0%
What products do you primary sell? Chose all that apply.
How far do you travel to reach your primary farmers market?
1-15 miles 16-30 miles 31-45 miles 46-60 miles Over 61 miles

Wilson 24
The following chart shows a comparison of consumption and production of selected fresh fruits and vegetables grown in the Greater Chattanooga (ASAP, 2011).
Comparison of Consumption and Production of 42 Selected Fruits and Vegetables Grown in Greater Chattanooga
Pounds consumed
in Greater Chattanooga
Acres needed to produce that
amount
Acres devoted to the crop in 100-
mile Region
Apples 16,466,700 770 1180 Berries and Strawberries 539,700 50 497 Cantaloupe 9,042,900 880 149 Cherries 1,018,300 7 Grapes 8,686,500 1000 414 Nectarines Melons 1,680,300 160 Peaches 5,163,000 550 147 Pears 3,177,200 56 Plums 936,900 5 Watermelon 15,733,500 640 257 Asparagus 1,201,600 510 Beans 2,169,100 330 7591 Beets 2 Broccoli 6,049,000 950 5 Cabbage 8,340,300 310 19 Carrots 8,218,100 360 2 Cauliflower 1,598,800 230 Celery 6,344,300 180 Corn (Sweet) 9,379,000 1630 964 Cucumbers 6,863,700 500 51 Eggplant 875,800 30 Garlic 2,820,800 820 Green Onion 1 Greens 1,405,300 53 Herbs

Wilson 25
Leeks Mushrooms 2,484,800 10 Onion 19,552,300 670 1 Lettuce 28,493,300 1180 4 Peas 82 Peppers 10,030,700 940 82 Potatoes 37,373,300 2310 164 Pumpkins 4,969,500 240 1163 Radishes 529,500 130 Romaine Spinach 1,649,700 140 1 Sprouts Squash 4,246,500 140 401 Sweet Potatoes 5,122,300 330 118 Tomatoes 18,839,400 760 1322 Total 257,570,400 lbs. 17,250 14,738
Source: (Column 1) ERS/USDA Data Food Availability (Per Capita Data System: Food Guide Pyramid (2010); (Column 2 and Column 3) 2007 Census Agriculture
Access
“National research has shown that nutrition issues and the incidence of food deserts coincide with low-‐income areas, especially among populations with a heavy dependence on public transportation” Ochs Center, 2009. Chattanoogans living in several low-income neighborhoods including South Chattanooga, East Chattanooga, and Downtown struggle with food deserts which can be barriers to accessing affordable, healthy food (Ochs Center, 2009). One indicator of food access is proximity to grocery stores. The following chart displays percent of population living within one mile of a grocery store by subregion.
Percent of Population Living within One Mile of a Grocery Store by Subregion Subregion % Subregion %
Bakewell 4.21 Mountain Creek/Moccasin Bend 31.36
East Chattanooga 6.32 Middle Valley 32.8 Birchwood 10.31 Harrison 33.1 Bushtown/Highland Park 18.3 Riverview/Stuart Heights 37.42 Apison 18.51 Falling Water/Browntown 40.62

Wilson 26
Westview/Mountain Shadows 19.05 Downtown 53.15 Harrison Bay 19.84 Hixson 55.3 South Chattanooga 21.7 Dupont/Murray Hills 61.8 East Brainerd 23.06 Woodmore/Dalewood 63.3 Ooltewah/Summit 23.58 Walden/Mowbray Mountain 65.6 Ridgedale/Oak Grove/Clifton Hills 24.09
Hickory Valley/Hamilton Place 68.19
Dallas Bay/Lakesite 24.39 Red Bank 69.21 Bakewell 25.2 North Chattanooga 69.58 Collegedale 26.4 Lupton City/Norcross 75.74 Tyner/Greenwood 28.38 Bonny Oaks/Highway 58 77.37 Soddy Daisy 29.1 Glenwood/East Dale 85.75 Lookout Valley/Lookout Mountain 29.38 Brainerd 86.89 Signal Mountain 29.75 East Ridge 90.46
Ochs Center for Metropolitan
Studies, 2009
“An August 2008 Ochs Center report concluded that the vast majority of food stamp retailers located in the areas with the highest food stamp use were fringe food stores-corner and convenience stores that sold primarily junk food and could not support a healthy diet” (Ochs Center, December 2009). In addition, grocery stores provide more economical pricing showing up to 20%-30% lower prices than fringe stores
Average Distance to Nearest Grocery Story by Block (Miles)
Subregion Average Distance Subregion
Average Distance
Bakewell 5.5 Riverview/Stuart Heights 1.1
Birchwood 3.7 Mountain Creek/Moccasin Bend 1.04
Apison 3.4 Downtown 0.95 Walden/Mowbray Mountain 2.99 Glenwood/East Dale 0.87 Harrison 2.71 Hixson 0.87
Collegedale 2.3 Ridgedale/Oak Grove/Clifton Hills 0.87
Dallas Bay/Lakesite 2 Hickory Valley/Hamilton Place 0.81
Ooltewah/Summit 1.69 Woodmoore/Dalewood 0.8

Wilson 27
Falling Water/Browntown 1.66 East Brainerd 0.78 East Chattanooga 1.48 Dupont/Murray Hills 0.76 Harrison Bay 1.48 Soddy Daisy 0.75 Westview/Mountain Shadows 1.35 North Chattanooga 0.73 Lookout Valley/Lookout Mountain 1.32 Red Bank 0.72 Middle Valley 1.3 Bonny Oaks/Highway 58 0.69 South Chattanooga 1.25 East Ridge 0.65 Signal Mountain 1.24 Brainer 0.59 Bushtown/Highland Park 1.2 Lupton City/Norcross 0.58 Tyner/Greenwood 1.15
Ochs Center for Metroplitan Studies, 2009
Grocery Stores and Corner Stores by Subregion Subregion Grocery Corner Subregion Grocery Corner Bakewell 0 2 Northgate/Big Ridge 3 5 Birchwood 1 5 Mountain Creek 3 3 Apison 1 1 Downtown 1 3 Walden 1 1 Glenwood/Eastdale 1 5 Harrison 0 2 Hixson 5 3 Collegedale 1 6 Ridgedale/Clifton Hills 1 12 Dallas Bay 1 1 Hickory Valley 5 7 Ooltewah 3 3 Woodmoore//Dalewood 4 1 Falling Water 2 2 East Brainerd 4 4 East Chattanooga 0 9 Dupont/Murray Hills 1 7 Harrison Bay 1 1 Soddy Daisy 4 6 Westview 1 1 North Chattanooga 1 3 Middle Valley 2 3 Red Bank 2 6 South Chattanooga 1 10 Bonny Oaks/Hwy 58 2 3 Signal Mountain 1 1 East Ridge 4 15 Bushtown/Highland Park 0 9 Brainerd 2 5 Tyner/Greenwood 1 4 Lupton City/Norcross 2 5 Riverview/Stuart Heights 1 2 Lookout Valley/Lookout Mountain 3 6
Ochs Center for Metropolitan Studies, 2009

Wilson 28
.

Wilson 29
SNAP and WIC Retailers by Category in Focus Area Subregion Fringe Food Supermarket Grocery SNAP WIC SNAP WIC SNAP WIC Downtown 3 0 0 0 2 1 Bushtown/Highland Park 9 0 0 0 1 1 Ridgedale/Oak Grove/Clifton Hills 12 1 1 1 1 1 East Chattanooga 9 3 0 0 0 0 South Chattanooga 10 4 1 1 0 0
Wilson 30
Food Insecurity
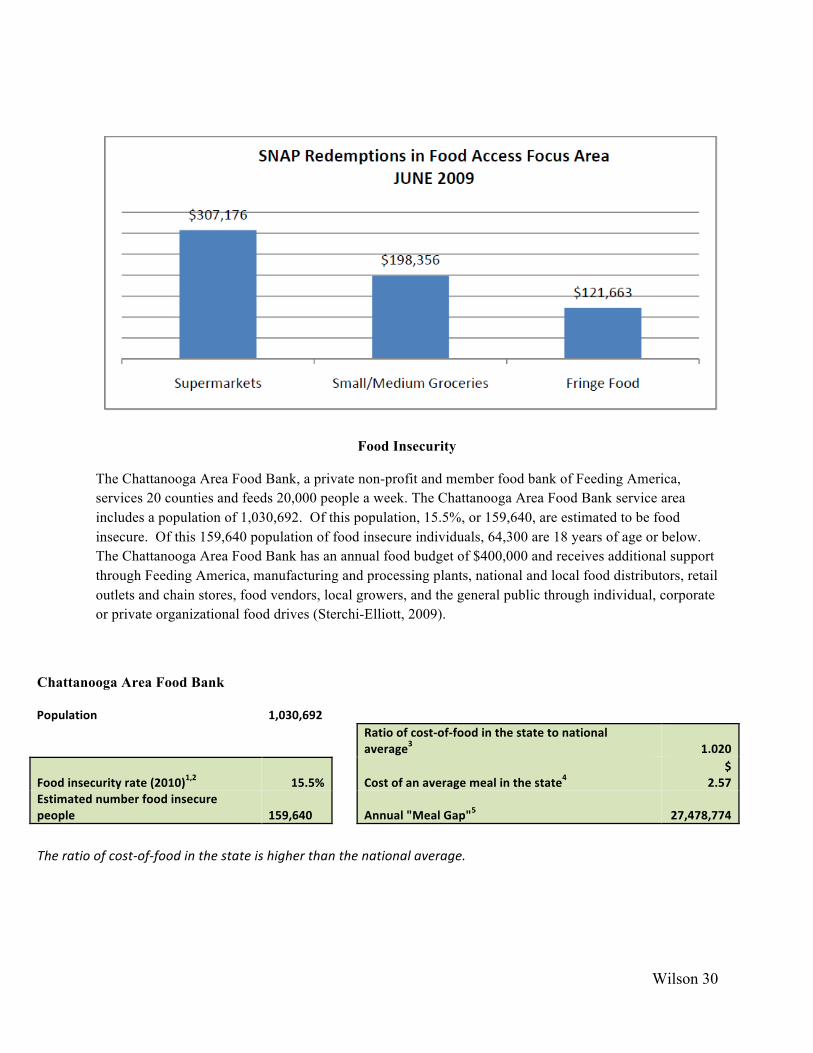
The Chattanooga Area Food Bank, a private non-profit and member food bank of Feeding America, services 20 counties and feeds 20,000 people a week. The Chattanooga Area Food Bank service area includes a population of 1,030,692. Of this population, 15.5%, or 159,640, are estimated to be food insecure. Of this 159,640 population of food insecure individuals, 64,300 are 18 years of age or below. The Chattanooga Area Food Bank has an annual food budget of $400,000 and receives additional support through Feeding America, manufacturing and processing plants, national and local food distributors, retail outlets and chain stores, food vendors, local growers, and the general public through individual, corporate or private organizational food drives (Sterchi-Elliott, 2009).
Chattanooga Area Food Bank
Population 1,030,692
Ratio of cost-‐of-‐food in the state to national average3
1.020
Food insecurity rate (2010)1,2 15.5%
Cost of an average meal in the state4 $
2.57 Estimated number food insecure people
159,640
Annual "Meal Gap"5
27,478,774
The ratio of cost-‐of-‐food in the state is higher than the national average.

Wilson 31
County ST Population Food
insecurity rate
Estimated number food insecure individuals (rounded)
Income within the food insecure population2
% below SNAP threshold of 130% poverty
% between 130% and
185% poverty
% above Nutrition Pgm threshold of 185% poverty
Catoosa County GA
62,951 12.3% 7,720 42% 28% 31%
Chattooga County GA
25,985 18.2% 4,720 50% 35% 15%
Dade County GA
16,595 13.8% 2,290 44% 26% 30%
Fannin County GA
23,337 15.3% 3,570 47% 41% 12%
Gilmer County GA
28,076 15.3% 4,280 55% 34% 11%
Gordon County GA
54,059 16.4% 8,850 49% 32% 19%
Murray County GA
39,925 15.8% 6,310 53% 41% 6%
Walker County GA
67,845 14.7% 10,000 45% 35% 20%
Whitfield County GA
99,910 15.7% 15,680 50% 36% 14%
Bledsoe County TN
12,946 18.7% 2,420 49% 29% 22%
Bradley County TN
97,192 14.2% 13,810 50% 30% 20%
Grundy County TN
13,910 20.0% 2,790 67% 25% 8%
Hamilton County TN
328,960 15.3% 50,370 44% 19% 37%
Marion County TN
28,123 15.8% 4,430 51% 27% 21%
McMinn County TN
52,075 16.9% 8,810 48% 27% 25%
Meigs County TN
11,581 18.8% 2,180 61% 23% 16%
Polk County TN
16,690 16.3% 2,720 50% 23% 26%
Rhea County TN
31,215 17.2% 5,380 52% 31% 17%
Sequatchie County TN
13,814 16.3% 2,250 58% 36% 6%
Van Buren County TN
5,503 19.3% 1,060 56% 36% 8%
Service Area Total Multi
1,030,692 15.5% 159,640 48% 28% 24%

Wilson 32
Chattanooga Area Food Bank
Population under 18 years old 244,046
Child food insecurity rate (2010)1 26.3%
Estimated number food insecure children 64,300
County State
Food insecurity rate -‐ full population
Population under 18 years old
Child food
insecurity rate
Estimated number food insecure children (rounded)
Catoosa County GA 12.3% 15,896 25.3% 3,990 Chattooga County GA 18.2% 5,984 31.2% 1,840
Dade County GA 13.8% 3,656 30.1% 1,080
Fannin County GA 15.3% 4,514 30.6% 1,370
Gilmer County GA 15.3% 6,396 31.5% 1,940
Gordon County GA 16.4% 14,737 31.9% 4,640
Murray County GA 15.8% 10,938 32.3% 3,440
Walker County GA 14.7% 16,294 28.3% 4,540
Whitfield County GA 15.7% 28,710 33.9% 9,480
Bledsoe County TN 18.7% 2,726 31.9% 860
Bradley County TN 14.2% 22,623 23.5% 5,160
Grundy County TN 20.0% 3,301 35.5% 1,140
Food Secure Food insecure children income-‐eligible for federal nutri[on assistance2
Food insecure children NOT
income-‐eligible for federal nutri[on
assistance2 Food Insecure
Service Area Child Food Insecurity

Wilson 33
Hamilton County TN 15.3% 71,875 20.7% 14,660
McMinn County TN 16.9% 12,080 27.5% 3,260
Marion County TN 15.8% 6,191 27.1% 1,660
Meigs County TN 18.8% 2,546 35.4% 870
Polk County TN 16.3% 3,698 27.3% 940
Rhea County TN 17.2% 7,344 28.8% 2,090 Sequatchie County TN 16.3% 3,344 29.3% 960
Van Buren County TN 19.3% 1,193 32.2% 380
Service Area Total
multi 15.5% 244,046 26.3% 64,300
Chattanooga Community Kitchen
The Chattanooga Community Kitchen is a service provider for homeless individuals that serves between 400 and 600 meals each day, approximately 175,000 meals per year. The food served is almost all entirely donated and over 12,000 volunteer hours are utilized annually to provide this service.
The Chattanooga Mobile Market
The Chattanooga Mobile Market brings healthy food and educational programs to the neighborhoods. In many communities throughout Chattanooga, there is a shortage of healthy food. Grocery stores are located too far away for convenient shopping, and fast food or convenience stores have become a main source of the ingredients for family meals. Fresh food options are not often on the table. Below is a schedule of the locations for the Mobile Market:
Tuesday – Emma Wheeler Homes, Eastlake Park, New City Fellowship Wednesday – Glass Street at North Chamberlain, College Hill Courts, The Bethlehem Center Thursday – Gateway Towers, Avondale Recreation Center, Cromwell Hill Apartments Saturday – Eastdale/Wilcox Boulevard, Orchard Knob Elementary School
Food Not Bombs
Food Not Bombs recovers and shares free vegan or vegetarian food with the public without restriction in over 1,000 cities around the world to protest war, poverty and the destruction of the environment. Local Chattanooga coordinator, Andy Fazio, hands out meals every Sunday at Miller Park to anyone who wants a meal. Local restaurants and grocers donate food that they would otherwise throw away to this effort. Food Not Bombs is dedicated to taking nonviolent direct action to change society so no one is forced to stand in line to eat at a soup kitchen expressing a commitment to the fact that food is a right and not a privilege.

Wilson 34
Chattanooga Human Services Head Start/Early Start Program
Chattanooga Human Services Head Start/Early Head Start Program
Meals Served Report Monthly Snapshot - September, 2012
Breakfast Head Start EHS Infants EHS Toddlers Total Avondale 2400 89 396 2885 Cedar Hill 1148 120 373 1641 Daisy 1679 109 258 2046 North Chattanooga 1103 0 0 1103 Total Breakfast 6330 318 1027 7675
Breakfast Head Start EHS Infants EHS Toddlers Total Avondale 2399 92 398 2889 Cedar Hill 1149 118 369 1636 Daisy 1667 107 257 2031 North Chattanooga 1103 0 0 1103 Total Lunch 6318 317 1024 7659
Total Meals Served 12,647 636 2051 15,334
Human Services was commissioned in the 1960s as the local Community Action Agency for Hamilton County. In 1990, it was established as a City of Chattanooga department with an Administrator appointed by the Mayor and confirmed by the Chattanooga City Council. The mission of Human Services of Chattanooga is to improve the quality of living of the poor and/or disadvantaged citizens of Hamilton County by providing temporary assistance, mobilizing community resources, and encouraging self-help activities and programs that will alleviate poverty conditions in the community.
Head Start / Early Head Start is a Federal program for preschool children from low-income families. The program is operated by local non-profit organizations in almost every county in the United States. Children who attend participate in a variety of educational activities.

Wilson 35
Composting
“Composting is the biological decomposition of organic matter by a managed process. The breakdown of wastes by microorganisms is nature’s way of recycling” (Master Gardeners of Hamilton County, 2012). Composting data is not readily available in the Chattanooga region. Large-scale composting initiatives are currently not active in Chattanooga, but there is opportunity for growth in this area of the local food system. Chattanooga’s 2009 Climate Action Plan ranked recycling and waste as the number one priority to creating a sustainable community.
Local entrepreneur and business owner of Niedlov’s Breadworks, John Sweet, received the Business Person of the Year award from the United States Small Business Association in 2010. Sweet’s bakery “supports the local food economy, promotes the use of local ingredients and selling to local restaurants, and endorses local farmers, chefs, and grocers’ commitment to local and organic food” (Chattanooga Chamber of Commerce, 2010).
Sweet began work to build a large scale composting initiative in 2007. While the pilot projects started at such locations as Girls Preparatory School did not transform into widespread community action, there is a still potential for future projects. Sweet picks up approximately 400 pounds of pre-consumer food waste each week from BlueCross BlueShield, as well as 100 pounds from Niedlovs, and takes this compost to Crabtree Farms.
Sweet recommended Blairsville, Georgia as a model of large-scale, community composting initiative.
Chattanooga Atlantis Hydroponics may also serve as a composting resource. The company’s mission is to make self-sustaining gardening an integral part of people's home and community. They are dedicated to researching, developing, manufacturing, and marketing gardening goods and consumables to the general public. Chattanooga Atlantis Hydroponics recently led a workshop for UTC students on the topic of composting and creating rich, organic soil.
Diffusion and Innovation Theory
The Greater Chattanooga region has the potential to support a healthy and thriving food system. A critical factor in doing this will be effectively diffusing key ideas into the community. Variables that determine adoption of ‘new’ ideas or innovations include perceived attributes of the innovation, types of innovation-decision, communication channels, nature of social systems, and extent of change agents’ promotion efforts (Rogers, 2003)

Wilson 36
Understanding the steps and layers of diffusion may assist in creating the desired mission of the coalition.
Considerations
The Chattanooga/Hamilton County Food Coalition has strength in member versatility and expertise. Most components of the food system are well represented in the coalition. The target area for the coalition’s efforts may be worth review. While there is significant opportunity in the large, 100-mile region, the magnitude of the area may be beyond the initial scope of the coalition. Given the centrality of the membership to the Greater Chattanooga Area, it seems the initial focus of the coalition should be on this approximately million resident area that represents significant farmland, consumption potential, educational programs, and food access support.

Wilson 37
Most organizations represented in the Chattanooga/Hamilton County Food Coalition engage in some type of food systems education. Opportunity exists to create a standard instructional design that could be utilized by all organizations and assist in other collaborative efforts. By its nature, a system involves integrated processes. Consideration of this same integrated process between members of the food coalition, and other interested parties in the community, will strengthen the ultimate desired outcomes of the group.
There seems considerable opportunity to coincide the objectives of the Chattanooga/Hamilton County Food Coalition with those presented at the state level (Tennessee Statewide Nutrition and Physical Activity Plan).
• Objective 1 - Promote local or statewide policies, which provide financial incentives and technical assistance for grocery stores locating in underserved neighborhoods, modeled on Pennsylvania’s Fresh Food Financing Initiative.
• Objective 2: Advocate for neighborhood plans to incorporate an analysis and proposed solutions related to food security issues, especially in low-income areas.
• Objective 3: Provide training and incentives to small store owners in underserved areas to carry healthier food items, such as fresh produce.
• Objective 4: Increase the production, distribution and procurement of food from Tennessee farms.
• Objective 5: Increase the use of Women, Infants and Children (WIC) cash value vouchers for the purchase of fresh fruits and vegetables.
• Objective 6: Establish a Tennessee Food Policy Council to build support for healthy eating policy and environmental change.
Collaborative efforts that complement existing efforts are a significant opportunity for the newly formed coalition.
The Chattanooga/Hamilton County Food Coalition is well-positioned in geography, time, and expertise to mobilize a community to create a thriving, comprehensive, and just local food system, where everyone has access to fresh and healthy food.
Wilson 38
References
Ashmead, R. & Zbeetnoff, D. (2009). Food Secure Vancouver Baseline Report. Serecon Management Consulting and Zbeetnoff Agro-Environmental Consulting. Vancouver, British Columbia. Center for Disease Control. (2009). State indicator report on fruits and vegetables. Retrieved from www.cdc.gov/nutrition/downloads/StateIndicatorReport2009.pdf
Center for Disease Control (2012). Healthy community design checklist. Retrieved from http://www.cdc.gov/search.do?queryText=healthy+design+checklist&action =search&searchButton.x=0&searchButton.y=0
Coleman-Jensen, A., Nord, M., Andrews, M., & Carlson, S. (2011). Household Food Security in the United States 2011. United States Department of Agriculture, Economic Research Service.
Feenstra, G. Local food systems and sustainable communities. American Journal of Alternative Agriculture, 28-36.
Garrett, S. & Feenstra, G. (1999). Growing a community food system. Washington State University and University of California Sustainable Agriculture Resource and Education Program.
Gundersen, C., Waxman, E., Engelhard, E., & Del Vecchio, T. Map the Meal Gap 2012: Food Insecurity Estimates at the County Level. Feeding America, 2012.
Harper, A., Shattuck, A., Holt-Gimenez, E., Alkon, A., & Lambick, F. (2009). Food policy councils: Lessons learned. Institute for Food Development Policy.
Hawe, P. & Stickney, P.H. (1997). Developing the effectiveness of an intersectoral food policy coalition through formative evaluation. Health Education Research, 12(2), 213-225
Jackson, C. & Perrett, A. (2010). Food and Farm Assessment Phase I: Chattanooga, Tennessee. Appalachian Sustainable Agricultural Project. Jackson, C. & Perrett, A. (2011). Food and Farm Assessment Phase II: Chattanooga, Tennessee. Appalachian Sustainable Agricultural Project. Ochs Center for Metropolitan Studies. (2008). A Preliminary Analysis of Food Production and Consumption in the Chattanooga Foodshed. Ochs Center for Metropolitan Studies. (2009). Food Access and Price: A Spatial Analysis of Grocery Stores and Food Prices in the City of Chattanooga and Hamilton County.

Wilson 39
Quillen, L. (2009). Food Stamp and WIC Use in Hamilton County: An Ochs Center for Metropolitan Studies Brief on Food Deserts. Ochs Center for Metropolitan Studies. Rogers, E. (2003). Diffusion of Innovations (5th ed.). New York, NY: Free Press. Sterchi-Elliott, R. (2009). Needs of the Hungry 2009: Chattanooga Regional Assessment of Food Insecure Clients and the Chattanooga Area Food Bank. Chattanooga Area Food Bank.
Tennessee Department of Health. (2010). Tennessee statewide nutrition and physical activity plan: A comprehensive plan to reduce obesity and chronic disease in Tennessee, 2010- 2015.
Winne, M., Joseph, H., & Fisher, A. (1997). Community food security: A guide to concept, design, and implementation. Presented by The Community Food Security Coalition.