charts from photographs with adobe photoshop - the · pdf file · 2010-10-05you...
TRANSCRIPT

Through my years of studying Photoshop, I’ve had the opportunity to use it many times as away of reducing photographic material to charts. The program has all the tools youare likely to need, and even relatively inexperienced users can have good results. Asyou work through this tutorial, I think you will find that, though there are many steps,no one step is difficult, nor is it hard to understand.
Pick your photo
Your choice of photo is the most important decision you will make in this process.Good choices are images with strong contrast. The image should include shapes thatare easily identified even if the you look at them with your eyes slightly out of focus.The process of converting to a chart will destroy most of the photo’s detail, and youwill want there to be no doubt about what the chart depicts. For that reason, you willwant to avoid photographs that depend on detail.
For this study, I’ve chosen the hibiscus flower in Figure 00. This photo exhibits mostof what I’ve described as desirable qualities for conversion to a chart. It has excellentcontrast, detail that is relatively unimportant, a limited range of colors, and robustshapes.
Before you begin the conversion, it will be a good idea to enhance your image as much as possible.You will want to adjust it’s color and to make sure that the color ranges available have arange that is as wide as possible.You can, if you wish, force the colors into ranges thatwould be unacceptable in any other circumstance.The conversion will tame those colors.
Preparing Graphs From PhotographsUsing Adobe Photoshop
Figure 00 Original photograph to be converted to chart.
by David Xenakis, for the members of KnitUCopyright©2000 XRX, Inc. All rights Reserved
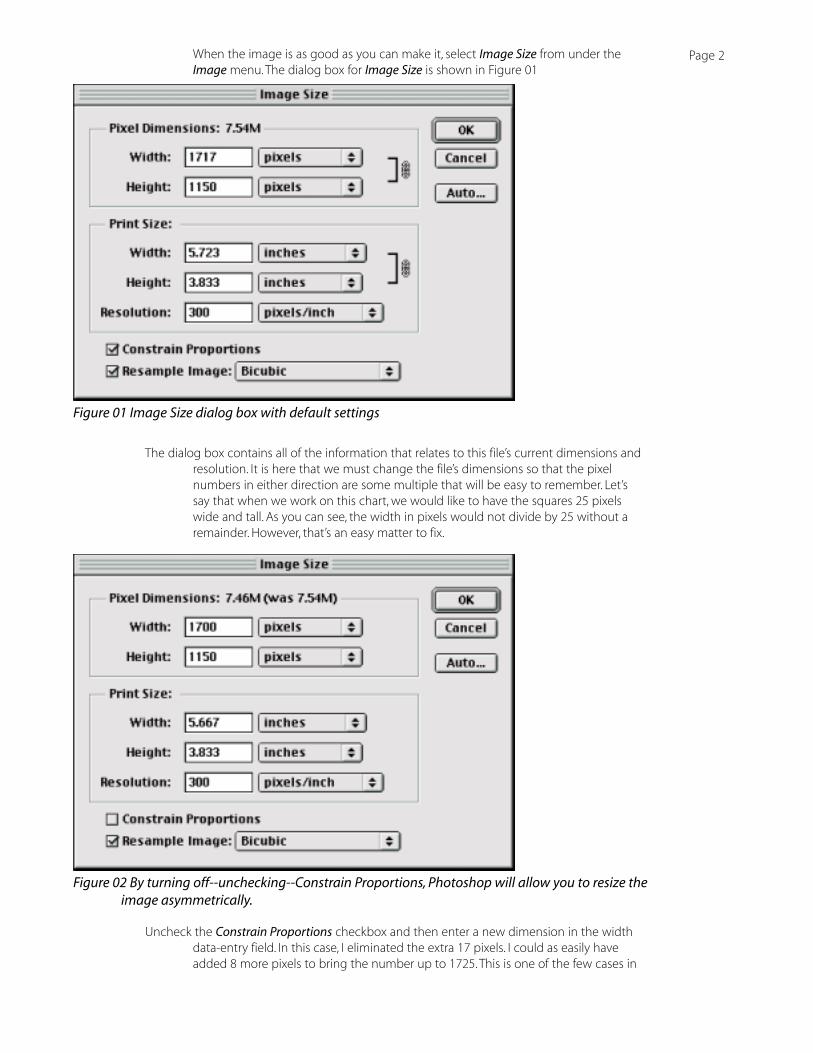
When the image is as good as you can make it, select Image Size from under theImage menu. The dialog box for Image Size is shown in Figure 01
The dialog box contains all of the information that relates to this file’s current dimensions andresolution. It is here that we must change the file’s dimensions so that the pixelnumbers in either direction are some multiple that will be easy to remember. Let’ssay that when we work on this chart, we would like to have the squares 25 pixelswide and tall. As you can see, the width in pixels would not divide by 25 without aremainder. However, that’s an easy matter to fix.
Uncheck the Constrain Proportions checkbox and then enter a new dimension in the widthdata-entry field. In this case, I eliminated the extra 17 pixels. I could as easily haveadded 8 more pixels to bring the number up to 1725. This is one of the few cases in
Page 2
Figure 01 Image Size dialog box with default settings
Figure 02 By turning off--unchecking--Constrain Proportions, Photoshop will allow you to resize theimage asymmetrically.

Photoshop where not resizing proportionally is not especially harmful to theimage. If you’ll compare Figure 03 with Figure 00, you’ll see that there are fewvisible differences.
All of the fussy work is now out of the way. From now on you’ll be able to concentrate oncreating your graph.
Changing the photo image into squares is accomplished by applying the Mosaicfilter. The Mosaic dialog box is seen below in Figure 04.
You’ll recall that the Image Size command was used to make sure the pixel dimensions of thephoto were multiples of 25. 25 is now the cell size to request of the filter. When thefilter has executed, you will see that your image has substantially changed. Noticethat even at this stage, the flower and the leaves are still easily recognizable. Usingthis filter is a very good way to decide if an image is suitable. If the shapes are notrecognizable, it isn’t worth your while to proceed.
Page 3
Figure 03 The image has been asymmetrically resized and does not appear very different.
Figure 04 The squares of the chart are created by using the Mosaic filter.

Having destroyed nearly all of the image’s detail, the next task is to severely reduce thenumber of colors. Assuming that this is an RGB file, it has the potential of having upto nearly 17,000,000 colors.You must decide what number of colors with which youwish to work. For knitting--possibly intarsia--you might wish to retain quite a fewcolors. If you are developing these charts for cross stitch or needlepoint, you couldretain as many as you wish provided you can find yarns to match them. There are afew other things to consider. This image contains colors that are mainly red andgreen. However many colors you choose to retain, half will belong to the greengroup and half to the red. If we were to isolate the flower so that the imagecontained only the blossom, then all of the values could be in the red range. Withmore values, there is more color differentiation and the chart will be more real.
From the Image menu, choose Mode|Indexed color.
Page 4
Figure 05 After the Mosaic filter is applied, the image is still recognizable.
Figure 05 To limit the number of colors, the image is converted to Indexed Color.

The Indexed Color dialog box, shown in Figure 07, has a bewildering number of choices.When youconvert your image, make your dialog box look like this one.The one variable is howmany colors you wish to retain. If the number is more or less than the number shown, goahead and make the change. Immediately change the file back to RGB mode.
Figure 08, below, has now been reduced to 10 colors. I used that number because it doesn’tseem so far out of reach for intarsia knitters, especially when duplicate stitch can beused for isolated stitches.
As you can see from the figure, this image is still recognizable. Loosing color certainlydoes destroy detail, but there is no doubt that this is a flower of some kind, and thatit is surrounded by leaves and leafy shadows.
Page 5
Figure 08 With Index Color, this image has been reduced to 10 colors.
Figure 07 The Indexed Color dialog box lets you enter exactly the number of colors to retain.

The flower chart looks pretty good at this stage and could probably be used with no furthermodification. However, there are some fairly simple things that you can do to make itmore usable. One possibility is to delineate the squares with a grid. We can make thegrid white where it outlines very dark squares, and black everywhere else.
From the File menu, select New.
When the dialog box appears (Figure 09, above), name the new file something like the titleshown in the figure. The dimensions are the same size as the squares in the flowerimage.You will also need to insure that the resolution and color mode of the newfile are the same as for the photo chart.
The new window will appear. From the Select menu, choose All. From the Edit menu,select the Stroke command (Figure 10, below). Clock OK.
Page 6
Figure 09 This 25x25 pixel file will allow us to outline the squares with a grid.
Figure 10 The Stroke command will place a line around the edges of the new file.

It will probably be easier to understand why we are choosing a Stroke width of one pixel afteryou have applied it. I’ll try to state the reasons and ask that you file the informationand come back to it laser when you have seen the grid constructed.
We need to use a line size for the grid that is not too wide or it will block too muchof the color. a half-point line will be perfect. The file is at a resolution of 300 ppi. Atthat density, a one-half point line is almost exactly 2 pixels wide.You will be usingmany versions of this square stacked on top of each other and next to each other. Asthey fit together, each square will contribute half the width of the grid. The end resultwill be a line of the desired size.
From the Image menu, choose Duplicate. Another Dialog box will appear. Type in thename White Grid. When the new window appears, hold down the Command key(Mac) or the Control key (Windows) and type i. The line around the edge of the newwindow will change to white by using this Invert command, as shown in Figure 11.
We’ll work on the light grid first. Make the White Grid the active window. Choose All from theSelect menu. From the Edit menu, choose Define Pattern (Figure 12). A pattern, inPhotoshop terms, is any rectangular shape that has been designated. When patternsare used as fills, Photoshop tiles the patterns throughout the selection area. Patternsare very powerful and quite underused.
Page 7
Figure 11 These two windows will provide both of the grids needed for the chart.
Figure 12 To make the White Grid file behave as a grid, you define it as a pattern.
Before you put your new pattern to use, you need to do a bit of preparation. First, if youcannot see it, look under the Window menu and choose Show Layers. Your imageshould show on the Layers palette as the Background layer. Just to the right of thesmall Trash Can icon at the bottom of the pallets is the New Layer icon. Click it tocreate a new layer above the original.
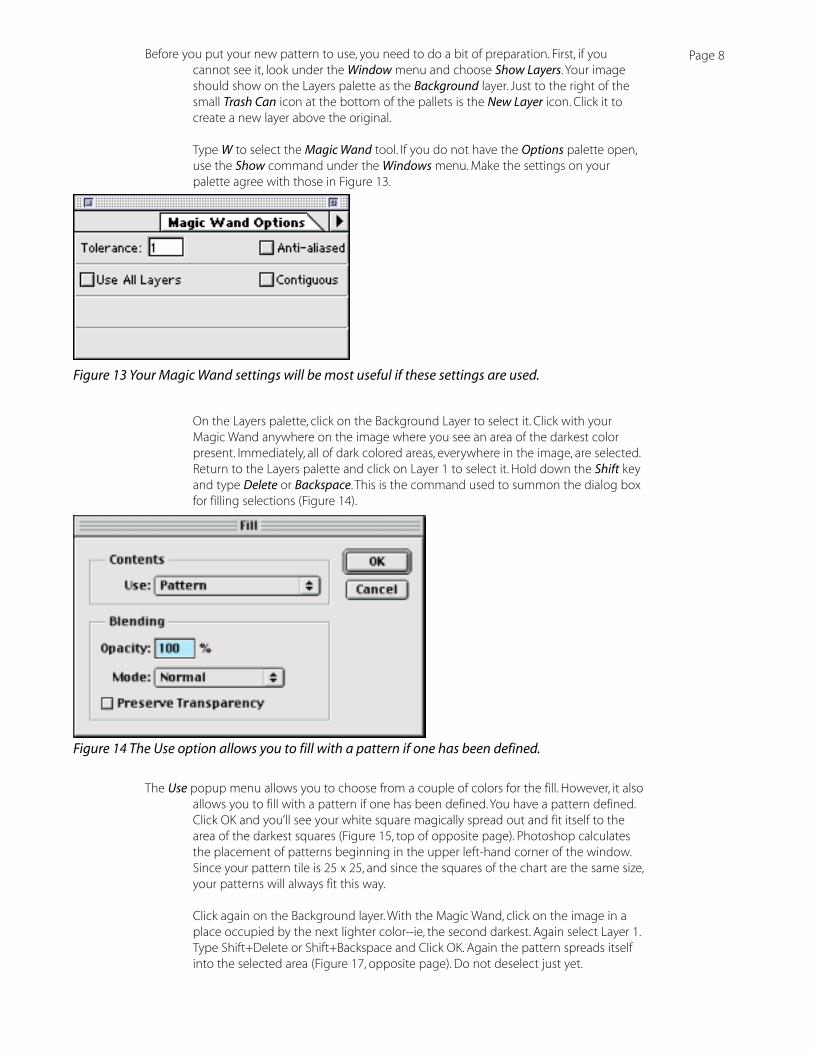
Type W to select the Magic Wand tool. If you do not have the Options palette open,use the Show command under the Windows menu. Make the settings on yourpalette agree with those in Figure 13.
On the Layers palette, click on the Background Layer to select it. Click with yourMagic Wand anywhere on the image where you see an area of the darkest colorpresent. Immediately, all of dark colored areas, everywhere in the image, are selected.Return to the Layers palette and click on Layer 1 to select it. Hold down the Shift keyand type Delete or Backspace. This is the command used to summon the dialog boxfor filling selections (Figure 14).
The Use popup menu allows you to choose from a couple of colors for the fill. However, it alsoallows you to fill with a pattern if one has been defined.You have a pattern defined.Click OK and you’ll see your white square magically spread out and fit itself to thearea of the darkest squares (Figure 15, top of opposite page). Photoshop calculatesthe placement of patterns beginning in the upper left-hand corner of the window.Since your pattern tile is 25 x 25, and since the squares of the chart are the same size,your patterns will always fit this way.
Click again on the Background layer. With the Magic Wand, click on the image in aplace occupied by the next lighter color--ie, the second darkest. Again select Layer 1.Type Shift+Delete or Shift+Backspace and Click OK. Again the pattern spreads itselfinto the selected area (Figure 17, opposite page). Do not deselect just yet.
Page 8
Figure 13 Your Magic Wand settings will be most useful if these settings are used.
Figure 14 The Use option allows you to fill with a pattern if one has been defined.

Figure 15 Your white pattern smoothly aligns itself to the darkest squares.
Figure 16 The white pattern now delineates the two darkest colors.

If you look closely at Figure 16, you’ll see that there is some difficulty distinguishing betweenthe two darkest colors once the pattern has been in place. We need a way to identifythe two so that they are instantly recognized as different. Make your White Gridwindow active. Choose the Marquee selection tool (type m to select it) and make asmall selection in the very center of the square as shown in Figure 17a.
Note: In this figure, white against a background of gray and white is very hard to see.I have shaded it blue for purposes of illustration.You will use white instead of blue.
Select All, Define the Pattern, and return to the flower window. The selection defining thesecond darkest color is still selected. Type Shift+Delete or Shift+Backspace and clickOK. The new pattern overwrites the original. The result is as shown in Figure 18.
Page 10
Figure 17a, left Put a small spot in the center of the White Grid file to make a new pattern tile.
Figure 17b, right Put a small line in the center of the Black Grid file to make a new pattern tile.
Figure 18 The modified white grid makes it easy to distinguish between the two darkest colors.

Lets take a shortcut to completing the entire grid. All of the rest of the colors are light enoughthat they can support a grid of black. Click on the small Eye icon on the Layerspalette to hide Layer 1. Click on the Background layer to select it. Hold down the Shiftkey and click in the image on an area of the darkest color. Now click on an area ofthe second darkest.You have now selected all of the dark-color area.
Return to the Layers palette. Make Layer 1 visible. Click on the Background layer, andthen click on the New Layer icon at the bottom. The new layer will be automaticallynamed layer 2. We are going to use Layer 2 as the layer to contain the black grid.
From the Select menu, choose Inverse. This deselects the dark colors and selectseverything else. Bring the Black Grid window to the front. Select All, Define thePattern, and return to the flower window. Summon the Fill dialog box, and click OK.You see the results in Figure 19.
As you can see from this figure, the vivid red and the next lighter color are difficult todistinguish. It is a simple matter to bring the Black Grid window to the front and touse the line tool to make a small mark in the center (Figure 17b). This new iterationof the Black Grid pattern tile, when applied to the vivid red color, produces the effectshown in Figure 20 (top of the following page).
You can, if you wish, assign small symbols to every color. Coming up with symbols issimply a matter of imagination. For example, take the just-used mark and flip it alonga vertical axis to make a slanted line in the other direction. Or take one line in eachdirection and combine them into an X. If you leave your file in layers, you can comeback to it and modify it as often as you wish to do so.
Page 11
Figure 19 Both grid colors are now in place.

There is a small house-cleaning task that needs attention. It is shown in figure 21. Where thewhite grid and the black grid meet, the effect is untidy looking—and easy to fix!
Figure 20 The marked variation of the black grid helps distinguish between two close reds.
Figure 21 The boundary where white lines meet dark lines looks messy and needs to be fixed.

Hide Layers 1 & 2. Use the Magic Wand to select both of the dark colors (hold down the Shiftkey and click on both). Select Inverse from the Select menu. Make both Layers visible.Click on Layer 1 to select it.
Type D and then X. D makes your Foreground/Background colors black and white. Xreverses the arrangement.You need to have your Foreground color as white for thenext operation. From the Edit menu, choose Stroke. When the dialog box appears,make your stroke one pixel and choose the Outside option. Click OK.. Photoshop willdraw a one-pixel white stroke all around the outside of the white-grid area. The resultis shown in Figure 22. Compare this to the previous figure to see how successful thisclean-up maneuver is.
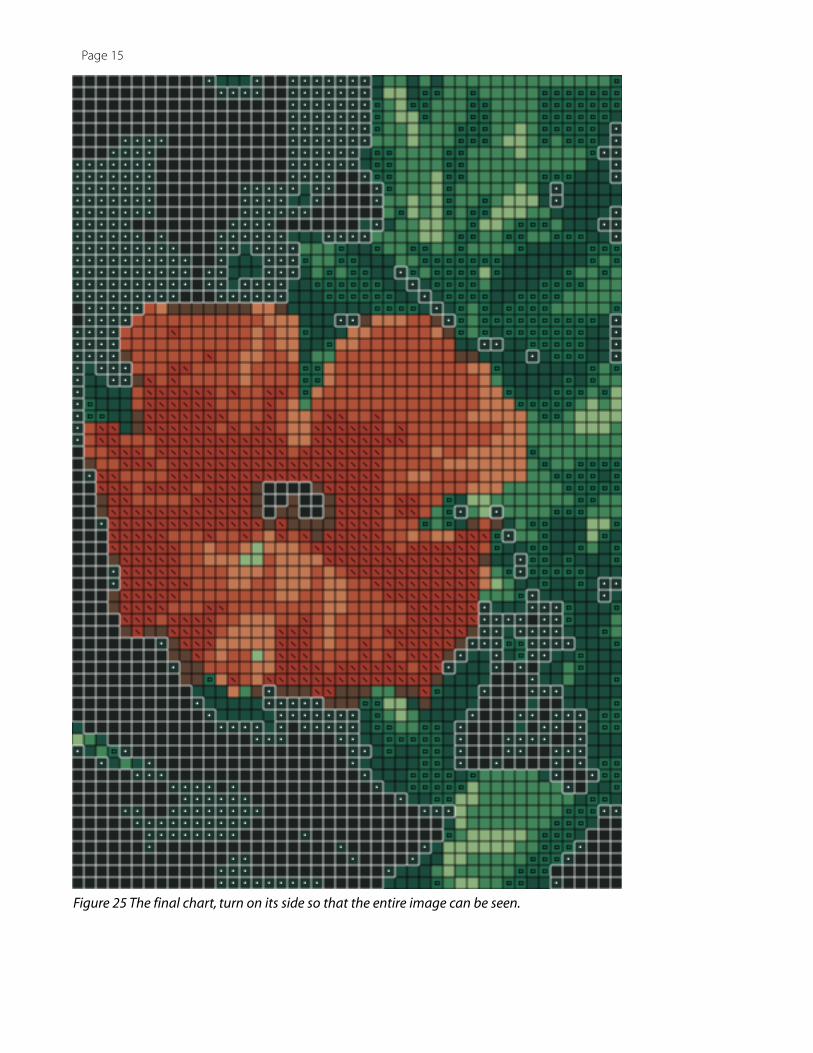
It is likely that the grid you have constructed will be too small for you to use easily. Pleaseselect Image Size from the Image menu. As you can see in Figure 23 (followingpage), the resolution is 300 ppi. Given that our squares are 25 pixels on a side, thatmakes each square 25/300 or 1/12 inches on a side. If you change this dialog box tothe way it is shown in Figure 24, you can make the squares increase in size.You dothat by taking away Photoshop’s resampling capability. When you have done that,Photoshop is forbidden to manufacture new pixel values. All it can do, when youspecify a smaller number for resolution, is to make the pixels larger. By changing to200 ppi, you have changed the square size to 25/200 or 1/8 inches on a side. Thefinal chart, shown on page 15, has been turned on its side so that you can see howclear the results can be.
I hope you have enjoyed this examination of using Photoshop to make charts fromdigital photographs. This file is offered as a gesture of thanks to the members ofKnitU who have enriched my life beyond describing.
dDavid Xenakis
May 2, 2000
Page 13
Figure 22 A white stroke around the entire white-grid area tidies the grid.

Figure 23 This resolution, with 25-pixel squares, makes each square 1/12” on a side.
Figure 24 Using this setting changes the squares to 1/8” on a side.
Page 14
Page 15
Figure 25 The final chart, turn on its side so that the entire image can be seen.

Although this set of instructions was written with Adobe Photoshop in mind, there are other software possibilities that you can consider. They are listed here:
Photoshop Elements from Adobe Systems, Inc. (Windows)Photoshop Elements from Adobe Systems, Inc. (Mac)
Photoshop CS from Adobe Systems, Inc. (Windows)Photoshop CS from Adobe Systems, Inc. (Mac)
Adobe Illustrator from Adobe Systems, Inc. (Windows)Adobe Illustrator from Adobe Systems, Inc. (Mac)
Stitch Painter from Cochenille Design Studio