charting success - council of the great city schools · pdf filecharting success: ... analysis...
TRANSCRIPT

Council of the Great City SchoolsSummer 2012
CHARTING SUCCESS: Data Use and Student Achievement in Urban Schools
ABSTRACT

Charting Success:
Authors
Ann-Marie FariaJessica Heppen
Yibing LiSuzanne StachelWehmah Jones
Katherine SawyerKerri ThomsenMelissa Kutner
David MiserAmerican Institutes for Research
Sharon LewisMichael CasserlyCandace SimonRenata Uzzell
Amanda CorcoranMoses Palacios
Council of the Great City Schools
Abstract
Data Use and Student Achievement in Urban Schools
Council of the Great City Schools and the American Institutes for Research
The Council of the Great City Schools thanks The Bill & Melinda Gates Foundation for supporting this project. The findings and conclusions presented herein do not necessarily represent the view of The Foundation.
Summer 2012
Council of the Great City Schools • American Institutes for Research • Summer 2012 3

ACKNOWLEDGMENTS
This report is the product of exceptional teamwork and involved the considerable expertise of both high-quality researchers and experienced practitioners in an analysis of how principals and teachers in big-city public school systems use data and whether its use matters in improving student achievement.
First, I thank Ann-Maria Faria, Jessica Heppen, and their team at the American Institutes for Research, including Yibing Li, Suzanne Stachel, Wehmah Jones, Katherine Sawyer, Melissa Kutner, Kerri Thomsen, Jinok Kim, and David Miser for their expertise and teamwork on this important project. Their skill and know-how were critical to the successful execution of the initiative. Second, I thank Sharon Lewis, the Council’s Director of Research, and her team of research managers—Renata Uzzell, Candace Simon, Moses Palacios, and Amanda Corcoran. Each one played a critical role in reviewing results and working with the technical team on ensuring the strongest possible product. Thank you.
The ability of the Council and the AIR teams to work together and to test and challenge each other’s analyses and conclu-sions was a unique and critical element of the project’s success.
Third, I thank Jason Snipes, former research director for the Council, and Mike Garet from the American Institutes for Re-search, for their outstanding contributions to the research design for this very complicated effort. Thanks also to Mike Garet for continued technical review of the methods, analysis, results, and report over the course of the project.
Finally, I thank Vicki Phillips, director of education at The Bill & Melinda Gates Foundation, for the foundation’s generos-ity in supporting this research. And I thank Jamie McKee, who served as our first program officer at The Foundation, and Teresa Rivero, who brought the project to the finish line, for their invaluable guidance, advice, and support throughout the project. Thank you.
Michael CasserlyExecutive Director
Council of the Great City Schools
CHARTING SUCCESS: DATA USE AND STUDENT ACHIEVEMENT IN URBAN SCHOOLS4

Council of the Great City Schools • American Institutes for Research • Summer 2012 5 CHARTING SUCCESS: DATA USE AND STUDENT ACHIEVEMENT IN URBAN SCHOOLS
Chapter 1. Introduction.................................................................................................................................................8
Chapter 2. Methodology..............................................................................................................................................16
Chapter 3. Key Findings.............................................................................................................................................22
Chapter 4. Discussion and Conclusion........................................................................................................................30
References....................................................................................................................................................................42
TABLE OF CONTENTS
LIST OF EXHIBITS
Exhibit 1. Using Data from Interim Assessments to Improve Student Achievment...................................................10
Exhibit 2. Structural Equation Model of the Relationship Between General Data Use and Student Achievement...........................................................................................................................24

LIST OF TABLES
Table 1. Number of Districts, Schools, Principals, Teachers, and Students in the Four Groups of Analysis Samples.......................................................................................................................................16
Table 2. Description of District Size and Interim Assessment Context....................................................................18
Table 3. Mean Differences in Teachers’ Reported Key Dimensions of Data Use.....................................................22
Table 4. Mean Differences in Principals’ Reported Key Dimensions of Data Use...................................................23
Table 5. Relationships Between Teachers’ General Data Use and Student Achievement in Elementary and Middle Grades Mathematics and Reading........................................................................25
Table 6. Relationships Between Teacher Data-Use Scales and Student Achievement in Mathematics and Reading...........................................................................................................................26
Table 7. Relationships Between Principals’ General Data Use and Student Achievement in Elementary and Middle Grades Mathematics and Reading........................................................................26
Table 8. Relationships Between Principal Data-Use Scales and Student Achievement in Mathematics and Reading...........................................................................................................................27
Table 9. Components and Specific Practices That Comprise Attention to Data In the Classroom.........................................................................................................................................32
Table 10. Components and Specific Practices That Comprise Attention to Data In the School...............................................................................................................................................34
Table 11. Components and Specific Aspects of Supports For Data Use....................................................................36
CHARTING SUCCESS: DATA USE AND STUDENT ACHIEVEMENT IN URBAN SCHOOLS6

CHARTING SUCCESS: DATA USE AND STUDENT ACHIEVEMENT IN URBAN SCHOOLS
CHAPTER 1INTRODUCTION

INTRODUCTION
CHARTING SUCCESS: DATA USE AND STUDENT ACHIEVEMENT IN URBAN SCHOOLS8
Overview of the StudyIn October 2008, the Council of the Great City Schools and American Institutes for Research (AIR) launched a project funded by The Bill & Melinda Gates Foundation that focused on understanding the use of interim assessment data as a lever for instructional improvement.
The goals of this project were to (1) document and understand current interim assessment data-use practices in urban school districts and (2) to test the links between data-use practices and perceptions and student achievement.
This abstract is a summary of the report that focused on the second objective: examining the empirical relationships between teacher- and school-level data use and student achievement in mathematics and reading in a study conducted in four geo-graphically varied urban school districts. By examining the extent to which certain data-use practices are related to student achievement, this study expands on the existing body of literature on the use of interim assessments to drive instructional improvement.
The full report, Charting Success: Data Use and Student Achievement in Urban Schools, can be found at www.cgcs.org, along with its companion pieces, Using Data to Improve Instruction in the Great City Schools: Documenting Current Prac-tices and Using Data to Improve Instruction in the Great City Schools: Key Dimensions of Practice.
Data-Driven Decision MakingIn recent years, interest has spiked in data-driven decision making in education—that is, using various types of student data to inform decisions in schools and classrooms (Marsh, Pane, & Hamilton, 2006). This is a natural result of significant tech-nological changes, the widespread use of test-based accountability systems under No Child Left Behind, and the increased availability of student achievement data due to accountability reforms.
The increased emphasis on data use is based on the belief that student data can be an important lever for improved teaching and learning. Specifically, the more information educators have about students, the better they will be able to understand and address students’ academic strengths and needs. As a result, many schools, school districts, and states have invested in resources and tools designed to provide teachers, principals, and other key stakeholders with access to student data through-out the school year. With the increased emphasis on broadening access to student achievement data to guide educational decision making in districts and schools, it is not surprising that such access is growing. For example, according to a nation-ally representative survey, teacher access to student data systems grew from 48 percent in 2005 to 74 percent in 2007 (U.S. Department of Education, 2009).
Studies that have examined the characteristics of high-performing schools and school districts have found that data-driven instruction and decision making are common features in many of these organizations (Datnow, Park, & Wohlsetter, 2007; Snipes, Doolittle, & Herlihy, 2002). However, despite the recent attention and investment in gathering data through com-prehensive data systems at national, state, and local levels, there is no consensus on what being data driven actually means in practice.
Council of the Great City Schools • American Institutes for Research • January 2011 9 CHARTING SUCCESS: DATA USE AND STUDENT ACHIEVEMENT IN URBAN SCHOOLS
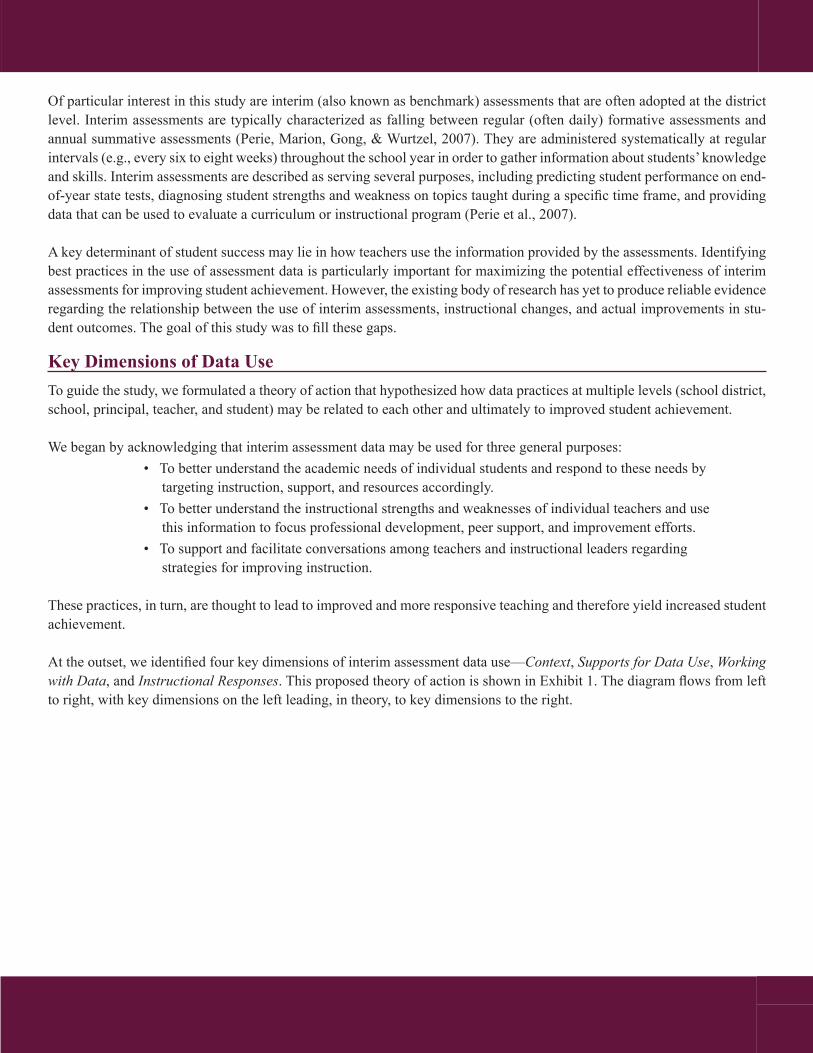
Of particular interest in this study are interim (also known as benchmark) assessments that are often adopted at the district level. Interim assessments are typically characterized as falling between regular (often daily) formative assessments and annual summative assessments (Perie, Marion, Gong, & Wurtzel, 2007). They are administered systematically at regular intervals (e.g., every six to eight weeks) throughout the school year in order to gather information about students’ knowledge and skills. Interim assessments are described as serving several purposes, including predicting student performance on end-of-year state tests, diagnosing student strengths and weakness on topics taught during a specific time frame, and providing data that can be used to evaluate a curriculum or instructional program (Perie et al., 2007).
A key determinant of student success may lie in how teachers use the information provided by the assessments. Identifying best practices in the use of assessment data is particularly important for maximizing the potential effectiveness of interim assessments for improving student achievement. However, the existing body of research has yet to produce reliable evidence regarding the relationship between the use of interim assessments, instructional changes, and actual improvements in stu-dent outcomes. The goal of this study was to fill these gaps.
Key Dimensions of Data UseTo guide the study, we formulated a theory of action that hypothesized how data practices at multiple levels (school district, school, principal, teacher, and student) may be related to each other and ultimately to improved student achievement.
We began by acknowledging that interim assessment data may be used for three general purposes: • To better understand the academic needs of individual students and respond to these needs by targeting instruction, support, and resources accordingly. • To better understand the instructional strengths and weaknesses of individual teachers and use this information to focus professional development, peer support, and improvement efforts. • To support and facilitate conversations among teachers and instructional leaders regarding strategies for improving instruction.
These practices, in turn, are thought to lead to improved and more responsive teaching and therefore yield increased student achievement.
At the outset, we identified four key dimensions of interim assessment data use––Context, Supports for Data Use, Working with Data, and Instructional Responses. This proposed theory of action is shown in Exhibit 1. The diagram flows from left to right, with key dimensions on the left leading, in theory, to key dimensions to the right.

INTRODUCTION CONT’D
CHARTING SUCCESS: DATA USE AND STUDENT ACHIEVEMENT IN URBAN SCHOOLS10
Data Use and Student Achievement in Urban Districts 1
Exhibit 1. Using Data from Interim Assessments to Improve Student Achievement
In brief, the Context factors at the far left are hypothesized to lead to the establishment of Supports for Data Use, which in turn are expected to facilitate teachers and principals Working with Data. Working with Data hypothetically leads to a change in teaching strategies or Instructional Responses, which ultimately leads to improved student achievement. Barriers to Data Use are represented with one bar below the key dimensions with dashed arrows signifying that real or perceived barriers can interrupt data use at any point in the process.
These concepts in the theory of action are composed of a number of practices and perceptions related to data use at all levels of the educational system. For the empirical study linking the key dimensions with student achievement, we focused on classroom-level data-use practices and perceptions by surveying teachers, and we focused on school-level data-use practices and perceptions by surveying principals. In the following sections, we describe the key dimensions of data use and the important components of each dimension that provided a framework for this study.
Exhibit 1. Using Data from Interim Assessments to Improve Student Achievement

Council of the Great City Schools • American Institutes for Research • Summer 2012 11 CHARTING SUCCESS: DATA USE AND STUDENT ACHIEVEMENT IN URBAN SCHOOLS
Key Dimension 1: ContextThe first key dimension broadly encompasses the various contextual and cultural factors that may be related to data use. Key elements of Context include the assessment context, the instructional context, the state and district data culture, and the school data culture. Although other contextual elements are theoretically relevant (e.g., the political or the economic context), our theory and measurement of data-use focus on factors that we hypothesized are most relevant to the use of data in school districts, schools, and classrooms.
• Assessment Context. District- and school-level goals, expectations, and policies related to developing and implementing interim assessments, including the types of assessments given and their purpose(s) as well as their perceived quality (e.g., validity and reliability).
• Instructional Context. The curricular and instructional environment in which teachers and principals collect and use data. The uniformity, focus, and history of the instructional program all have the potential to affect how data are used.
• State and District Data Culture. Attitudes, direction, and support at the state and district levels, regarding data use in general and interim assessments in particular.
• School Data Culture. Goals, norms, expectations, processes, attitudes, and leadership for using interim assessment data at the school level.
Key Dimension 2: Supports for Data UseThis dimension involves the specific elements of practice related to logistical and operational support for using data, including the infrastructure, organizational resources, time allocation, and personnel resources necessary to support using interim assessment data to guide and improve instruction.
Elements of Supports for Data Use include data infrastructure, organizational supports, and staffing and human resources.
• Data Infrastructure. District-level investment and support that translates into tools and resources that are available at the school level. It consists of two primary elements: the technological infrastructure for accessing, analyzing, and disseminating data and the content or capacity of the reports and data system
• Organizational Supports. Logistical and operational supports for data use, including scheduling time for review and discussion of interim assessment data. Although the presence of organizational supports may be a function of the data culture within a school or a school district, this dimension is focused on concrete supports that exist apart from norms, expectations, and other “soft” supports.
• Staffing and Human Resources. Human resources and training that affect a school’s capacity to use data to improve instruction. It includes staff positions (i.e., school-based data coaches), the capacity of staff to use data, and professional development available to support data use.

INTRODUCTION CONT’D
CHARTING SUCCESS: DATA USE AND STUDENT ACHIEVEMENT IN URBAN SCHOOLS12
Key Dimension 3: Working with DataThis dimension focuses on the ways that teachers and principals work individually and together to understand student data, including individual teacher attention to data, collaboration around data, and making sense of data, which refers to specific ways of reviewing assessment data to understand student performance.
Improved Knowledge. Implicit in the path from making sense of data to responding in the classroom is a change in educa-tors’ knowledge about student needs and principal and district knowledge about teacher and school needs.
Important aspects of Improved Teacher Knowledge include improved awareness and understanding of the following:
• Instructional needs and challenges of individual students • Instructional needs and challenges facing their classrooms as a whole • Teachers’ own strengths and weaknesses • Strategies and resources for addressing the needs of struggling students • Strategies for teaching and reteaching specific concepts in different ways
Important aspects of Improved Principal and District Knowledge include improved awareness and understanding of the following:
• Instructional needs and challenges facing individual classrooms or teachers and the school as a whole • Teachers’ (and schools’) strengths and weaknesses • Strategies and resources for addressing the needs of teachers and schools
Although we identify teacher and principal knowledge explicitly in the theory of action, measuring their knowledge was beyond the scope of this study.
Individual Attention to Data. Supports and practices related to the time teachers and principals spend examining their student data independently. This may include interpreting the data or reporting system; using data to identify student-, classroom-, or school-level patterns or needs; or plotting students’ strengths and weakness over time.
Making Sense of Data. Specific practices related to reviewing assessment data in order to understand student per-formance. These may have included comparing individual student scores with the performance of a larger group (e.g., class, grade level), identifying “bubble” students (students below but close to proficiency), identifying or diagnosing students with particular needs in foundational skills (e.g., literacy), identifying students for interven-tion within the classroom, or targeting students for intervention outside the classroom (supplemental or pull-out).
Collaboration Around Data. Shown in the theory of action as collaboration among teachers as well as between teachers and principals, teachers and coaches, and teachers and students, collaboration around data includes the supports and practices related to time that teachers and principals spend examining student data in collabora-tion with others.
•
•
•

Council of the Great City Schools • American Institutes for Research • Summer 2012 13 CHARTING SUCCESS: DATA USE AND STUDENT ACHIEVEMENT IN URBAN SCHOOLS
Key Dimension 4: Instructional ResponsesInstructional Responses are the ways that schools and teachers translate the improved knowledge they glean from reviewing interim assessment results and use it to change classroom-level instruction. This dimension also includes actions (e.g., interventions, professional development) implemented at the school and district levels in response to patterns and trends in student assessment data.
•
•
As shown in the theory of action (Exhibit 1), perceived Barriers to Data Use associated with any of the aforementioned key dimensions may disrupt the theoretical progression toward improved student achievement. The following list summarizes often-cited barriers in previous research:
• Lack of time to engage in data exploration and reflection (U.S. Department of Education, 2010)
• Poor assesment quality or validity (Feldman & Tung, 2001; Herman & Gribbons, 2001; Herman, Yamashiro, Lefkowitz, & Trusela, 2008; Ingram, Louis, & Schroeder, 2004; Kerr, Marsh, Ikemoto, Darilek, & Barney, 2006) • Lack of data accuracy (Wayman, Cho, & Johnston, 2007) • Lack of alignment with standards and pacing (Marsh et al., 2006; U.S. Department of Education, 2009; U.S. Department of Education, 2010)
• Lack of timeliness and accessibility of data (Clune & White, 2008; Lachat & Smith, 2005)
• Limited staff capacity (Heritage, 2007; Heritage & Bailey, 2006; Herman et al., 2008; Ingram et al.; 2004; Lachat & Smith, 2005; U.S. Department of Education, 2010; Sharkey & Murnane, 2006; Wayman et. al., 2007) • Negative perceptions of the use of interim assessment data for teacher evaluation (Clune & White, 2008; Ingram et al., 2004; Kerr et al., 2006; Marshall, 2008)
Instructional responses at the classroom/teacher level may include changing the scope, sequence, and materials used in lesson plans, establishing and/or adjusting student groups based on assessment scores, reviewing or reteaching concepts to the entire class or small groups of students, and providing supplemental interventions and support (e.g., tutoring) for struggling students.
At the school level, instructional responses to interim assessment data may involve planning professional development for teachers designed to address weaknesses evidenced by student scores, revising the school improvement plan, or implementing schoolwide interventions.
Barriers to Data Use

The overarching goal of the study was to understand the links between practices and perceptions related to using interim assessment data and student achievement. Our analysis focused on the relationships between the four key dimensions of data use and student achievement on the state assessments in reading and mathematics. We also examined the links between perceived barriers to data use and student achievement in both subjects. The analyses were conducted using a multi-level framework, meaning that we examined relationships among the data-use practices at both the school and classroom levels.
This study was designed to address two broad research questions about using student data from interim assessments.
Research Questions
1. What are the relationships between teachers’ data-use practices and perceptions and their students’ achievement?
2. What are the relationships between school polices, practices, and resources for data-driven instruction and student achievement?
To test the hypothesized links in the theory of action, we measured teachers’ and principals’ data-use practices and percep-tions using surveys administered at three points during the 2009–10 school year. The surveys measured the key dimensions of data use among teachers and principals in a sample of 193 randomly selected elementary and middle schools in four districts. The analyses examined the links between the key dimensions and student achievement on the state assessments in mathematics and reading.
Research Design
INTRODUCTION CONT’D
CHARTING SUCCESS: DATA USE AND STUDENT ACHIEVEMENT IN URBAN SCHOOLS14

CHARTING SUCCESS: DATA USE AND STUDENT ACHIEVEMENT IN URBAN SCHOOLS
CHAPTER 2METHODOLOGY
METHODOLOGY
CHARTING SUCCESS: DATA USE AND STUDENT ACHIEVEMENT IN URBAN SCHOOLS16
This section describes the methods and procedures used to address the research questions. First, we provide a description of the sample of districts, schools, principals, teachers, and students who participated in the study. Second, we describe the measures, including the surveys we developed to measure data-use practices and perceptions, and the achievement measures examined as the outcomes. Third, we summarize the procedures used to collect the data. Finally, we describe the analysis strategy we implemented with the study data.
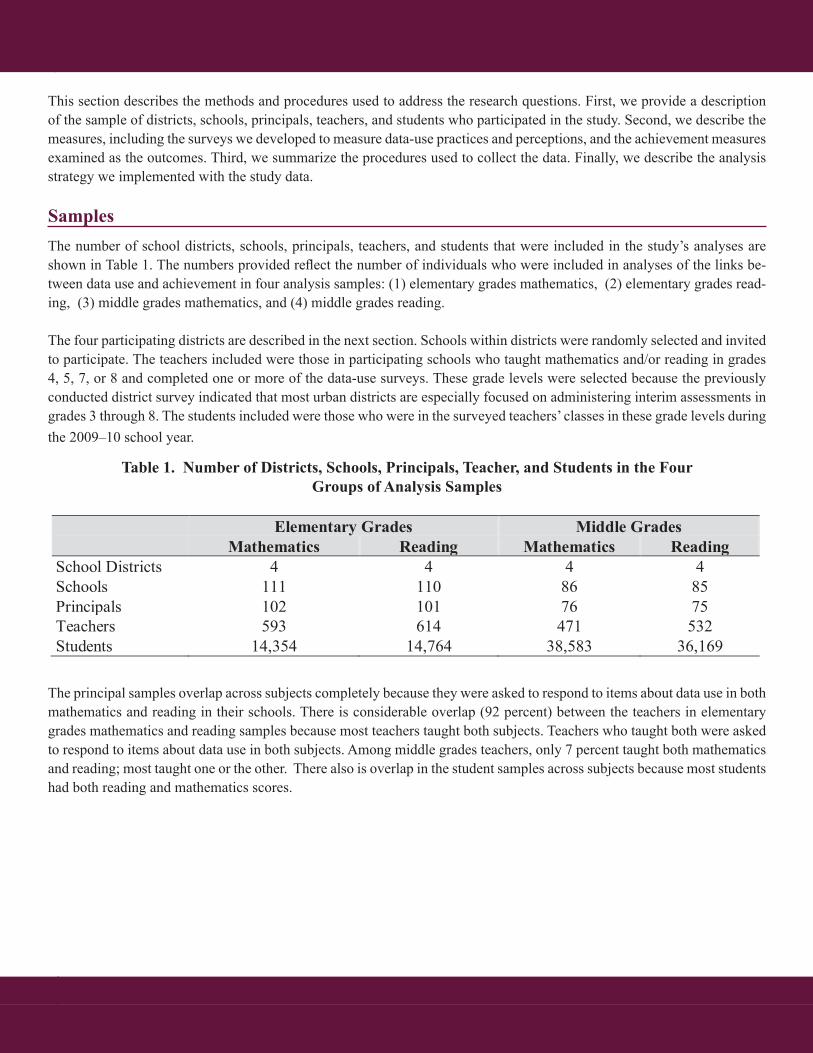
The number of school districts, schools, principals, teachers, and students that were included in the study’s analyses are shown in Table 1. The numbers provided reflect the number of individuals who were included in analyses of the links be-tween data use and achievement in four analysis samples: (1) elementary grades mathematics, (2) elementary grades read-ing, (3) middle grades mathematics, and (4) middle grades reading.
The four participating districts are described in the next section. Schools within districts were randomly selected and invited to participate. The teachers included were those in participating schools who taught mathematics and/or reading in grades 4, 5, 7, or 8 and completed one or more of the data-use surveys. These grade levels were selected because the previously conducted district survey indicated that most urban districts are especially focused on administering interim assessments in grades 3 through 8. The students included were those who were in the surveyed teachers’ classes in these grade levels during the 2009–10 school year.
Samples The number of school districts, schools, principals, teachers, and students that were included in the study’s analyses are shown in Table 1. The numbers provided reflect the number of individuals who were included in analyses of the links between data use and achievement in four analysis samples: (1) elementary grades mathematics, (2) elementary grades reading, (3) middle grades mathematics, and (4) middle grades reading.
The four participating districts are described in the next section. Schools within districts were randomly selected and invited to participate. The teachers included were those in participating schools who taught mathematics and/or reading in Grades 4, 5, 7, or 8 and completed one or more of the data-use surveys. These grade levels were selected because the previously conducted district survey indicated that most urban districts are especially focused on administering interim assessments in Grades 3 through 8. The students included were those who were in the surveyed teachers’ classes in these grade levels during the 2009–10 school year.
Table 1. Number of Districts, Schools, Principals, Teachers, and Students in the Four Groups of Analysis Samples
Elementary Grades Middle Grades Mathematics Reading Mathematics Reading
School Districts 4 4 4 4 Schools 111 110 86 85 Principals 102 101 76 75 Teachers 593 614 471 532 Students 14,354 14,764 38,583 36,169 The principal samples overlap across subjects completely because they were asked to respond to items about data use in both mathematics and reading in their schools. There is considerable overlap (92 percent) between the teachers in elementary grades mathematics and reading samples because most teachers taught both subjects. Teachers who taught both were asked to respond to items about data use in both subjects. Among middle grades teachers, only 7 percent taught both mathematics and reading; most taught one or the other. There also is overlap in the student samples across subjects because most students had both reading and mathematics scores.
Participating Districts The four districts that participated in this study were selected by drawing on data from a district-level survey that we administered to all 67 member districts of the Council of the Great City Schools in June 2009, as well as supplemental information gathered after the survey was administered.1 To be eligible for selection, districts had to have: (1) administered interim assessments continuously for the past three years, (2) planned to continue administering interim
1 In June 2009, the study team created and administered two surveys about district interim assessments, data systems, and data use in member districts. In each district, one survey was directed to the academic chief/curriculum coordinator and another to the research director. These surveys were similar in their content and scope, but modified to reflect each individual group’s role within the district in order to provide a general overview of the state of current
The principal samples overlap across subjects completely because they were asked to respond to items about data use in both mathematics and reading in their schools. There is considerable overlap (92 percent) between the teachers in elementary grades mathematics and reading samples because most teachers taught both subjects. Teachers who taught both were asked to respond to items about data use in both subjects. Among middle grades teachers, only 7 percent taught both mathematics and reading; most taught one or the other. There also is overlap in the student samples across subjects because most students had both reading and mathematics scores.
Samples
Table 1. Number of Districts, Schools, Principals, Teacher, and Students in the Four Groups of Analysis Samples

Council of the Great City Schools • American Institutes for Research • Summer 2012 17 CHARTING SUCCESS: DATA USE AND STUDENT ACHIEVEMENT IN URBAN SCHOOLS
The four districts that participated in this study were selected by drawing on data from a district-level survey that we admin-istered to all 67 member districts of the Council of the Great City Schools in June 2009, as well as supplemental information gathered after the survey was administered.1 To be eligible for selection, districts had to have:
(1) administered interim assessments continuously for the past three years, (2) planned to continue administering interim assessments for at least the next several school years, (3) administered interim assessments at least three times in a school year, and (4) established a data system that could would allow us to link school- and classroom-level data-use practices with student achievement.
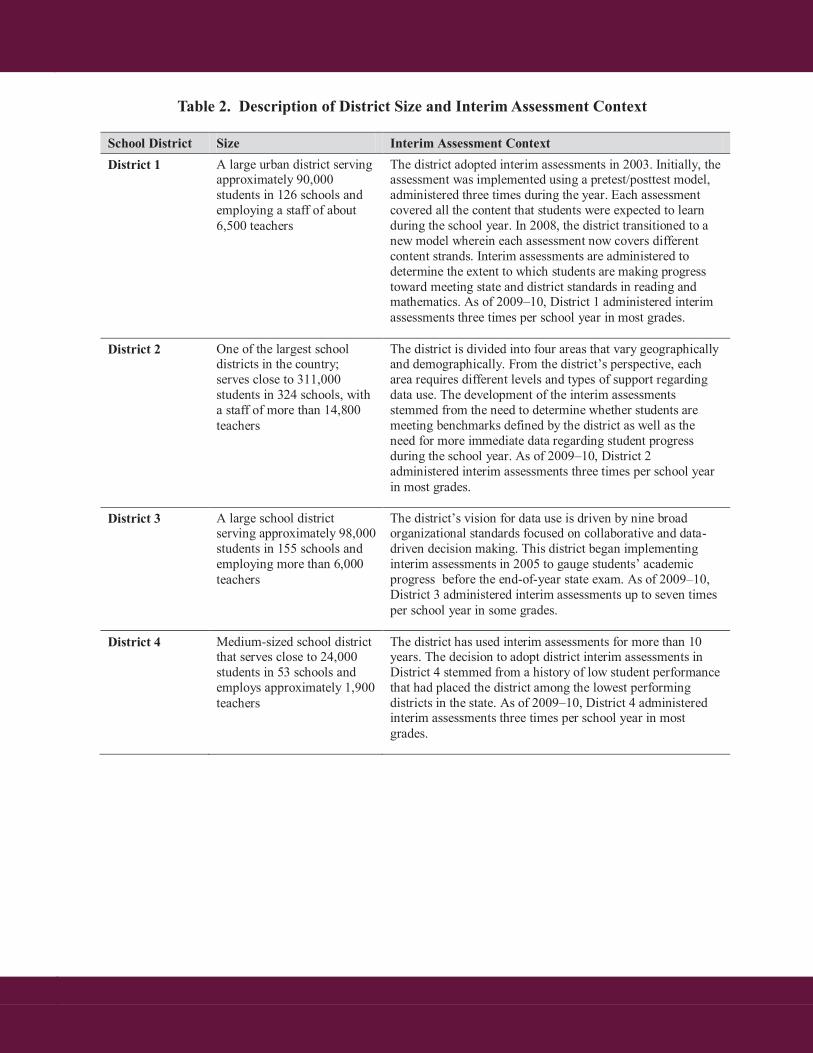
Using these criteria, we identified four districts of different sizes from varied geographic regions that agreed to participate. Each of the four districts is located in a different state. Three of the four participating districts are located in states that have high data capacity (i.e., they have in place all or nearly all of the required elements for the America COMPETES Act). Table 2 provides a brief description of each district, based on information collected by the study team prior to and during site visits conducted during the 2009–10 school year.
1In June 2009, the study team created and administered two surveys about district interim assessments, data systems, and data use in member districts. In each district, one survey was directed to the academic chief/curriculum coordinator and another to the research director. These surveys were similar in their content and scope, but modified to reflect each individual group’s role within the district in order to provide a general overview of the state of current practice in using data to inform school- and classroom-level decision making across urban districts in the U.S. The respondents represented a total of 62 of the 67 Council member districts (94 percent).
Participating Districts
METHODOLOGY CONT’D
CHARTING SUCCESS: DATA USE AND STUDENT ACHIEVEMENT IN URBAN SCHOOLS18
Table 2. Description of District Size and Interim Assessment Context
School District Size Interim Assessment Context District 1 A large urban district serving
approximately 90,000 students in 126 schools and employing a staff of about 6,500 teachers
The district adopted interim assessments in 2003. Initially, the assessment was implemented using a pretest/posttest model, administered three times during the year. Each assessment covered all the content that students were expected to learn during the school year. In 2008, the district transitioned to a new model wherein each assessment now covers different content strands. Interim assessments are administered to determine the extent to which students are making progress toward meeting state and district standards in reading and mathematics. As of 2009–10, District 1 administered interim assessments three times per school year in most grades.
District 2 One of the largest school districts in the country; serves close to 311,000 students in 324 schools, with a staff of more than 14,800 teachers
The district is divided into four areas that vary geographically and demographically. From the district’s perspective, each area requires different levels and types of support regarding data use. The development of the interim assessments stemmed from the need to determine whether students are meeting benchmarks defined by the district as well as the need for more immediate data regarding student progress during the school year. As of 2009–10, District 2 administered interim assessments three times per school year in most grades.
District 3 A large school district serving approximately 98,000 students in 155 schools and employing more than 6,000 teachers
The district’s vision for data use is driven by nine broad organizational standards focused on collaborative and data-driven decision making. This district began implementing interim assessments in 2005 to gauge students’ academic progress before the end-of-year state exam. As of 2009–10, District 3 administered interim assessments up to seven times per school year in some grades.
District 4 Medium-sized school district that serves close to 24,000 students in 53 schools and employs approximately 1,900 teachers
The district has used interim assessments for more than 10 years. The decision to adopt district interim assessments in District 4 stemmed from a history of low student performance that had placed the district among the lowest performing districts in the state. As of 2009–10, District 4 administered interim assessments three times per school year in most grades.
Table 2. Description of District Size and Interim Assessment Context

Council of the Great City Schools • American Institutes for Research • Summer 2012 19 CHARTING SUCCESS: DATA USE AND STUDENT ACHIEVEMENT IN URBAN SCHOOLS
Surveys of Teachers’ and Principals’ Data-Use Practices and PerceptionsSurveys of teacher and principal data use were developed for the study using a rigorous process that involved the following:
• A scan of more than 40 previously used surveys that measured some aspect of data use • An examination of the content and psychometric properties of potential survey items • The mapping of potential items onto the theory of action’s key dimensions of data use • Development of new items to ensure adequate coverage of each key dimension
The final surveys included primarily Likert-type items, as well as some frequency count questions to measure the extent of data-use practices. The internal reliability of each scale was moderate to high for both the teacher and principal surveys. More detail about the surveys is provided in the full report.
Measures of Teacher and Principal CharacteristicsThe teacher and principal surveys contained items on respondents’ background and demographic characteristics, including education level, race/ethnicity, and gender. The surveys also collected information about teaching experience—including the total number of years teaching and number of years teaching at the current school—for both teachers and principals. Principals were additionally asked to report the total number of years of administrator experience and the number of years they had served as a principal at their current schools.
Student InformationStudent records data were collected for a total of 86,837 students across the four districts. These data included prior achieve-ment and demographics. We also collected roster data that we used to create student-teacher links that connected students with their teachers in the data-use survey sample.
Student Characteristics and Demographics. Each district provided demographic data for students in grades 4, 5, 7, and 8 during the 2009–10 school year. Demographic information available in the district administrative records included gender, race/ethnicity, free or reduced-price lunch eligibility, special education services eligibility, and English language learner (ELL) status.
Student Achievement in Mathematics and Reading. The district-provided student records data included state assessment data in mathematics and reading from the two years prior to the study (spring 2008 and 2009) and for the year of the study (spring 2010) for all students in grades 4, 5, 7, and 8 enrolled in the participating schools in the 2009–10 school year. Because each state assessment measured student achievement differently, we standardized the student achievement data within state and grade level.
Classroom Rosters (Student-Teacher Assignments). All districts also provided classroom rosters for mathematics and read-ing classes in grades 4, 5, 7, and 8 that listed the students assigned to each teacher in each class. Specifically, the rosters included course name, teacher name, teacher ID, and student IDs for all students in the class.
The primary measures were teacher and principal surveys, district-provided classroom rosters, and administrative student records data. The following section describes the measures used in the study to link teacher and principal data use with student achievement.
Measures

2Some students had more than one reading teacher, or more than one mathematics teacher. In these cases, we randomly selected one unique student-teacher link for each student to ensure that students were linked only with one reading and one mathematics teacher in the survey sample.
METHODOLOGY CONT’D
Teacher and Principal SurveysWe surveyed teachers and school principals about their data-use practices three times during the 2009–10 school year. Sur-veys were administered online to teachers and principals in the sample of 193 randomly selected elementary and middle schools in the four participating districts. Teachers in the sampled schools were invited to participate in the surveys if they taught mathematics or reading in grades 4, 5, 7, or 8. All principals (and assistant principals, where appropriate) of the participating schools also were asked to complete the surveys. Upon completion of each online survey, teachers were sent a $25 gift card. Average response rates across all three survey administrations were high for both teachers (83 percent) and principals (87 percent).
The survey administration was timed to begin between 7 and 14 days after interim assessments were administered in each district in an effort to obtain accurate measures of teachers’ and school principals’ use of student data. In the surveys, respon-dents were asked to base their responses on the latest round of interim assessments.
Linking Teacher Survey Data to Student AchievementWe used the school, teacher, and student identifiers on the classroom rosters provided by the districts in order to link students to their own teachers and principals. We then merged the teacher and principal survey data with the achievement data of their corresponding students, creating one data file that included teachers’ and principals’ responses on the data-use survey and all relevant data for their own students, including background characteristics and multiple years of achievement data.2
Analytic StrategyWe began by examining descriptive statistics and correlations among the data-use survey scales in order to examine how the subscales functioned together and separately to measure aspects of data use. We then conducted two sets of analyses to examine how data-use practices and perceptions were related to student achievement. Because students were nested within teachers, which were in turn nested within schools, a multilevel framework was used for both sets of analyses.
The first set of analyses used structural equation modeling (SEM) to examine the relationship between a broad conceptu-alization of data use (i.e., “general” data use) and student achievement. The second set of analyses used hierarchical linear modeling (HLM; Raudenbush & Bryk, 2002) to examine the unique links between each key dimension of data use and student achievement, independent of the other key dimensions. Both types of analyses controlled for a host of background characteristics at the student, teacher, and school levels.
Data Collection Procedures
CHARTING SUCCESS: DATA USE AND STUDENT ACHIEVEMENT IN URBAN SCHOOLS20

CHARTING SUCCESS: DATA USE AND STUDENT ACHIEVEMENT IN URBAN SCHOOLS
CHAPTER 3KEY FINDINGS
KEY FINDINGS
CHARTING SUCCESS: DATA USE AND STUDENT ACHIEVEMENT IN URBAN SCHOOLS22
Descriptive statistics for teacher and principal data-use variables are presented in Tables 3 and 4. Because data-use scores were standardized, all data-use scales scores have a mean of 0 and a standard deviation of 1, where higher scores indicate higher levels of data use.
In general, scores on the key dimensions were higher in the elementary grades than in the middle grades.
•
•
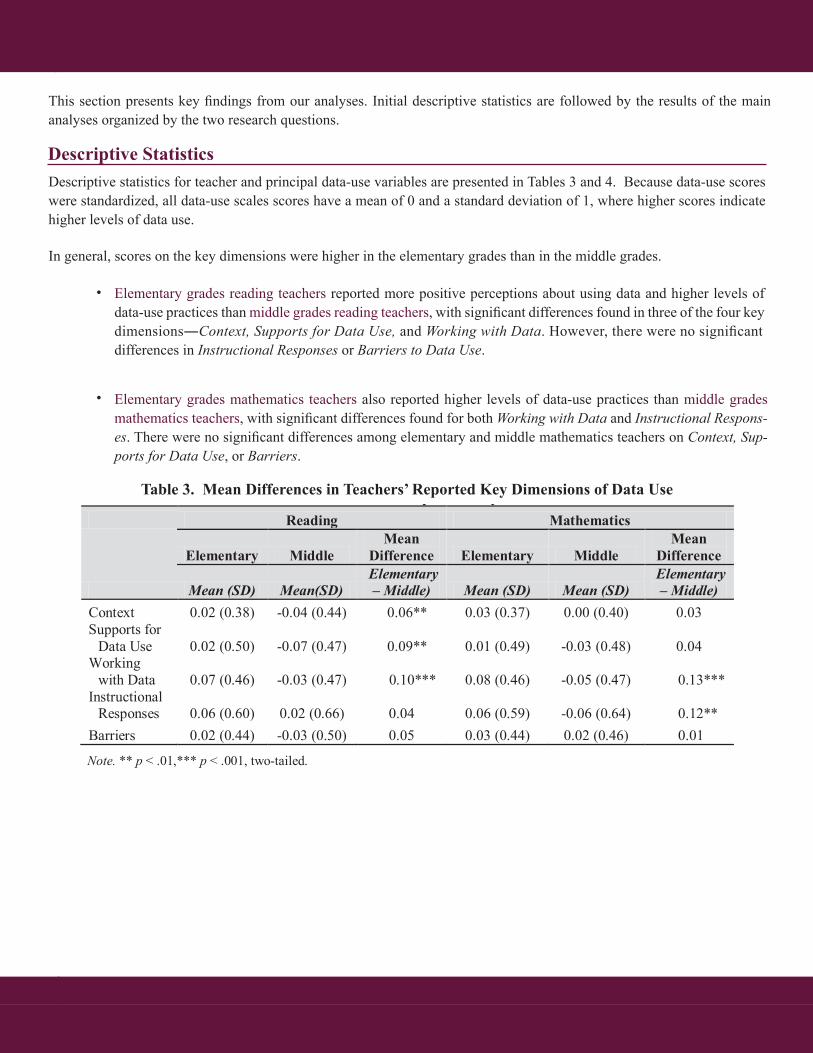
This section presents key findings from our analyses. Initial descriptive statistics are followed by the results of the main analyses organized by the two research questions.
Descriptive Statistics Descriptive statistics for teacher and principal data-use variables are presented in Tables 3 and 4. Because data-use scores were standardized, all data-use scales scores have a mean of 0 and a standard deviation of 1, where higher scores indicate higher levels of data use.
In general, scores on the key dimensions were higher in the elementary grades than in the middle grades.
Elementary grade reading teachers reported more positive perceptions about using data and higher levels of data-use practices than middle grades reading teachers, with significant differences found in three of the four key dimensions―Context, Supports for Data Use, and Working with Data. However, there were no significant differences in Instructional Responses or Barriers to data use.
Elementary grade mathematics teachers also reported higher levels of datause practices than middle grades mathematics teachers, with significant differences found for both Working with Data and Instructional Responses. There were no significant differences among elementary and middle mathematics teachers on Context, Supports for Data Use, or Barriers.
Table 3. Mean Differences in Teachers’ Reported Key Dimensions of Data Use Reading Mathematics
Elementary Middle Mean
Difference Elementary Middle Mean
Difference
Mean (SD) Mean(SD) Elementary – Middle) Mean (SD) Mean (SD)
Elementary – Middle)
Context 0.02 (0.38) -0.04 (0.44) 0.06** 0.03 (0.37) 0.00 (0.40) 0.03 Supports for
Data Use 0.02 (0.50) -0.07 (0.47) 0.09** 0.01 (0.49) -0.03 (0.48) 0.04 Working
with Data 0.07 (0.46) -0.03 (0.47) 0.10*** 0.08 (0.46) -0.05 (0.47) 0.13*** Instructional
Responses 0.06 (0.60) 0.02 (0.66) 0.04 0.06 (0.59) -0.06 (0.64) 0.12** Barriers 0.02 (0.44) -0.03 (0.50) 0.05 0.03 (0.44) 0.02 (0.46) 0.01
Note. ** p < .01,*** p < .001, two-tailed.
Descriptive Statistics
Elementary grades reading teachers reported more positive perceptions about using data and higher levels of data-use practices than middle grades reading teachers, with significant differences found in three of the four key dimensions―Context, Supports for Data Use, and Working with Data. However, there were no significantdifferences in Instructional Responses or Barriers to Data Use.
Elementary grades mathematics teachers also reported higher levels of data-use practices than middle grades mathematics teachers, with significant differences found for both Working with Data and Instructional Respons-es. There were no significant differences among elementary and middle mathematics teachers on Context, Sup-ports for Data Use, or Barriers.
This section presents key findings from our analyses. Initial descriptive statistics are followed by the results of the main analyses organized by the two research questions.
Table 3. Mean Differences in Teachers’ Reported Key Dimensions of Data Use
Council of the Great City Schools • American Institutes for Research • Summer 2012 23 CHARTING SUCCESS: DATA USE AND STUDENT ACHIEVEMENT IN URBAN SCHOOLS
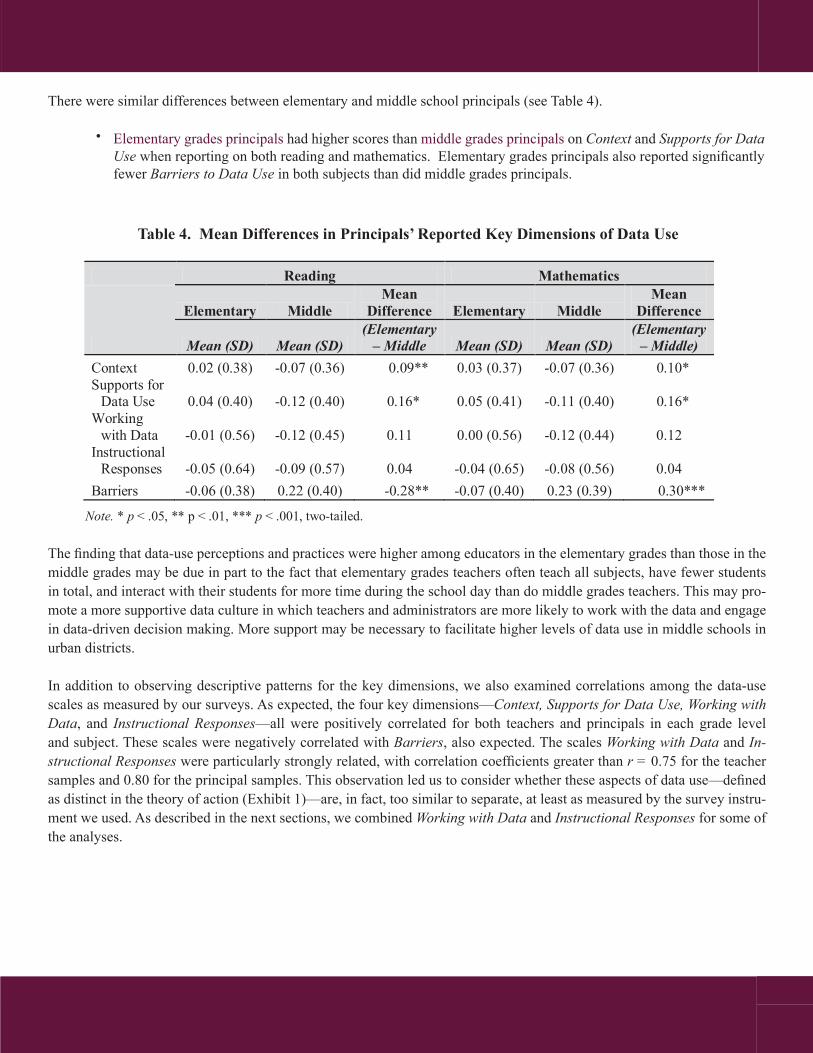
There were similar differences between elementary and middle school principals (see Table 4).
• Elementary grades principals had higher scores than middle grades principals on Context and Supports for Data Use when reporting on both reading and mathematics. Elementary grades principals also reported significantly fewer Barriers to Data Use in both subjects than did middle grades principals.
There were similar differences between elementary and middle grades principals (see Table 4).
Elementary school principals had higher scores than middle grade principals on Context and Supports for Data Use when reporting on both reading and mathematics. Elementary school principals also reported significantly fewer Barriers to using data in both subjects than did middle school principals.
Table 4. Mean Differences in Principals’ Reported Key Dimensions of Data Use
Reading Mathematics
Elementary Middle Mean
Difference Elementary Middle Mean
Difference
Mean (SD) Mean (SD) (Elementary – Middle Mean (SD) Mean (SD)
(Elementary – Middle)
Context 0.02 (0.38) -0.07 (0.36) 0.09** 0.03 (0.37) -0.07 (0.36) 0.10* Supports for
Data Use 0.04 (0.40) -0.12 (0.40) 0.16* 0.05 (0.41) -0.11 (0.40) 0.16* Working
with Data -0.01 (0.56) -0.12 (0.45) 0.11 0.00 (0.56) -0.12 (0.44) 0.12 Instructional
Responses -0.05 (0.64) -0.09 (0.57) 0.04 -0.04 (0.65) -0.08 (0.56) 0.04 Barriers -0.06 (0.38) 0.22 (0.40) -0.28** -0.07 (0.40) 0.23 (0.39) 0.30***
Note. * p < .05, ** p < .01, *** p < .001, two-tailed.
The finding that data-use perceptions and practices were higher among educators in the elementary grades than those in the middle grades may be due in part to the fact that elementary grades teachers often teach all subjects, have fewer students in total, and interact with their students for more time during the school day than do middle grades teachers. This may promote a more supportive data culture in which teachers and administrators are more likely to work with the data and engage in data-driven decision making. More support may be necessary to facilitate higher levels of data use in middle schools in urban districts.
In addition to observing descriptive patterns for the key dimensions, we also examined correlations among the data-use scales as measured by our surveys. As expected, the four key dimensions—Context, Supports for Data Use, Working with Data, and Instructional Responses—all were positively correlated for both teachers and principals in each grade level and subject. These scales were negatively correlated with Barriers, also expected. The scales Working with Data and Instructional Responses were particularly strongly related, with correlation coefficients greater than r = 0.75 for the teacher samples and 0.80 for the principal samples. This observation led us to consider whether these aspects of data use—defined as distinct in the theory of action (Exhibit 1)—are, in fact, too similar to separate, at least as measured by the survey instrument we used. As described in the next sections, we combined Working with Data and Instructional Responses for some of the analyses.
The finding that data-use perceptions and practices were higher among educators in the elementary grades than those in the middle grades may be due in part to the fact that elementary grades teachers often teach all subjects, have fewer students in total, and interact with their students for more time during the school day than do middle grades teachers. This may pro-mote a more supportive data culture in which teachers and administrators are more likely to work with the data and engage in data-driven decision making. More support may be necessary to facilitate higher levels of data use in middle schools in urban districts.
In addition to observing descriptive patterns for the key dimensions, we also examined correlations among the data-use scales as measured by our surveys. As expected, the four key dimensions—Context, Supports for Data Use, Working with Data, and Instructional Responses—all were positively correlated for both teachers and principals in each grade level and subject. These scales were negatively correlated with Barriers, also expected. The scales Working with Data and In-structional Responses were particularly strongly related, with correlation coefficients greater than r = 0.75 for the teacher samples and 0.80 for the principal samples. This observation led us to consider whether these aspects of data use—defined as distinct in the theory of action (Exhibit 1)—are, in fact, too similar to separate, at least as measured by the survey instru-ment we used. As described in the next sections, we combined Working with Data and Instructional Responses for some of the analyses.
Table 4. Mean Differences in Principals’ Reported Key Dimensions of Data Use
KEY FINDINGS CONT’D
CHARTING SUCCESS: DATA USE AND STUDENT ACHIEVEMENT IN URBAN SCHOOLS24
Research Question 1: What are the relationships between teachers’ data-use practices and perceptions and their students’ achievement?
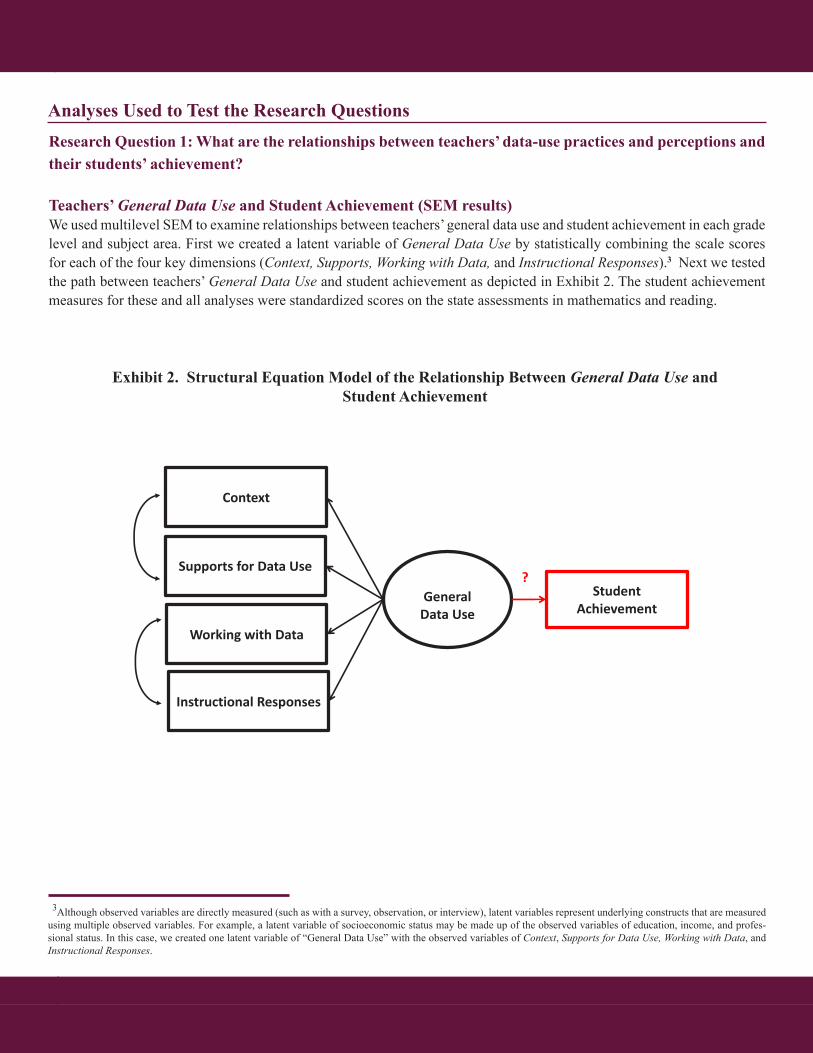
Teachers’ General Data Use and Student Achievement (SEM results)We used multilevel SEM to examine relationships between teachers’ general data use and student achievement in each grade level and subject area. First we created a latent variable of General Data Use by statistically combining the scale scores for each of the four key dimensions (Context, Supports, Working with Data, and Instructional Responses).3 Next we tested the path between teachers’ General Data Use and student achievement as depicted in Exhibit 2. The student achievement measures for these and all analyses were standardized scores on the state assessments in mathematics and reading.
3Although observed variables are directly measured (such as with a survey, observation, or interview), latent variables represent underlying constructs that are measured using multiple observed variables. For example, a latent variable of socioeconomic status may be made up of the observed variables of education, income, and profes-sional status. In this case, we created one latent variable of “General Data Use” with the observed variables of Context, Supports for Data Use, Working with Data, and Instructional Responses.
Analyses Used to Test the Research Questions
Exhibit 2. Structural Equation Model of the Relationship Between General Data Use and Student AchievementData Use and Student Achievement in Urban Districts 48
Exhibit 3.1. Structural Equation Model of the Relationship Between Teachers’ General Data Use and Student Achievement
Context
Supports for Data Use
Working with Data
Instructional Responses
General Data Use
Student Achievement
?

Council of the Great City Schools • American Institutes for Research • Summer 2012 25 CHARTING SUCCESS: DATA USE AND STUDENT ACHIEVEMENT IN URBAN SCHOOLS
Table 5 reports the coefficients of the path between teachers’ General Data Use and student achievement for each grade level and each subject (represented by the question mark shown in Exhibit 2). Higher values for coefficients represent a stronger relationship between general data use and student achievement, controlling for student covariates including prior achievement, gender, ethnicity, poverty status, and special education status.
These results indicate that teachers’ general data-use practices and perceptions are positively related to student achievement in elementary grades reading and middle grades mathematics. That is, teachers with higher levels of General Data Use (and perceptions of data supports) have students with higher state assessment achievement scores in middle grades mathemat-ics and elementary grades reading. There was no statistically significant relationship between teacher data use and student achievement in elementary grades mathematics or middle grades reading. These findings in combination partially support the theory of action.
Table 5. Relationships between Teacher General Data Use and Student Achievement in Elementary and Middle Grades Mathematics and Reading
Grade Level and Content Area Coefficient Elementary grades mathematics 0.04 Middle grades mathematics 0.10* Elementary grades reading 0.17* Middle grades reading 0.06 Note. * p < .05, two-tailed.
Table 6. Relationships between Teacher Data Use Scales and Student Achievement in Mathematics and Reading
Mathematics Reading Teacher Data Use Scales Elementary Middle Elementary Middle Context 0.03 0.04 0.03 0.06 Supports for data use 0.01 -0.01 -0.01 0.01 Attention to data in classroom 0.04 0.09** 0.06* 0.02 Barriers to data use -0.08* -0.04 -0.02 0.00 Note. ** p < .01, * p < .05, two-tailed.
Table 7. Relationships between Principal General Data Use and Student Achievement in
Elementary and Middle Grades Mathematics and Reading
Grade Level and Content Area Coefficient Elementary grades mathematics 0.17 Middle grades mathematics 0.23* Elementary grades reading -0.07 Middle grades reading 0.01 Note. * p < .05, two-tailed.
Links Between Individual Dimensions of Teacher Data Use and Student AchievementWe used HLM analyses to examine the relationship between each key dimension and student achievement. For these analyses, we examined—separately—Context, Supports for Data Use, Barriers, and a variable named Attention to Data in the Classroom, which was a combination of Working with Data and Instructional Responses. Each analysis controlled for background characteristics of the students, teachers, and schools including prior achievement. Table 6 shows the coefficients representing the relationships between each dimension of data use and student achievement for each of the grade levels and subjects.
Results indicate that some of the teacher data-use dimensions were significantly related to student achievement. Specifi-cally, in middle grades mathematics and elementary grades reading, Attention to Data in the Classroom was significantly and positively related to student achievement, such that the more teachers reported reviewing interim assessment data and responding instructionally, the higher their students’ achievement on the state test. There was also a significant negative relationship between Barriers to Data Use using data and student achievement in elementary mathematics.
Table 5. Relationships Between Teachers’ General Data Use and Student Achievement in Elemen-tary and Middle Grades Mathematics and Reading

KEY FINDINGS CONT’D
CHARTING SUCCESS: DATA USE AND STUDENT ACHIEVEMENT IN URBAN SCHOOLS26
Research Question 2: What are the relationships between schools’ policies, practices, and resources for data-driven instruction and student achievement?
Principals’ General Data Use and Student AchievementTo address the question about school-level data use, we examined links between principals’ data-use practices and percep-tions and achievement for students in their schools. As with the teacher-level analyses, we used SEM to create a latent measure of principals’ General Data Use and examine relationships between it and student achievement in each grade level and subject area (see Exhibit 2).
Table 7 reports the coefficients of the path between principals’ General Data Use and student achievement for each grade level and each subject. Higher values for coefficients represent a stronger relationship between data use and student achieve-ment. Results indicate that principals’ General Data Use was positively related to student achievement, but only in middle grades mathematics. The link between General Data Use and student achievement was not statistically significant in el-ementary mathematics, elementary reading, or middle grades reading.
Table 5. Relationships between Teacher General Data Use and Student Achievement in Elementary and Middle Grades Mathematics and Reading
Grade Level and Content Area Coefficient Elementary grades mathematics 0.04 Middle grades mathematics 0.10* Elementary grades reading 0.17* Middle grades reading 0.06 Note. * p < .05, two-tailed.
Table 6. Relationships between Teacher Data Use Scales and Student Achievement in Mathematics and Reading
Mathematics Reading Teacher Data Use Scales Elementary Middle Elementary Middle Context 0.03 0.04 0.03 0.06 Supports for data use 0.01 -0.01 -0.01 0.01 Attention to data in classroom 0.04 0.09** 0.06* 0.02 Barriers to data use -0.08* -0.04 -0.02 0.00 Note. ** p < .01, * p < .05, two-tailed.
Table 7. Relationships between Principal General Data Use and Student Achievement in
Elementary and Middle Grades Mathematics and Reading
Grade Level and Content Area Coefficient Elementary grades mathematics 0.17 Middle grades mathematics 0.23* Elementary grades reading -0.07 Middle grades reading 0.01 Note. * p < .05, two-tailed.
Table 6. Relationships Between Teacher Data-Use Scales and Student Achievement in Mathematics and Reading
Table 7. Relationships Between Principals’ General Data Use and Student Achievement in Elementary and Middle Grades Mathematics and Reading

Council of the Great City Schools • American Institutes for Research • Summer 2012 27 CHARTING SUCCESS: DATA USE AND STUDENT ACHIEVEMENT IN URBAN SCHOOLS
Links Between Each Key Dimension of Principal Data Use and Student AchievementWe used HLM analyses to examine the relationship between each key dimension at the school (principal) level and student achievement. For these analyses, we examined—separately—Context, Supports for Data Use, Barriers, and a variable named Attention to Data in the School, which was a combination of Working with Data and Instructional Responses for principals. As for the teacher analyses, each of these analyses controlled for a number of background student-, teacher-, and school-level characteristics including prior achievement at the school and student levels.
Table 8 shows the coefficients representing the relationships between each dimension of data use and student achievement for each of the grade levels and subjects.
Table 8. Relationships Between Principal Data Use Scales and Student Achievement in Mathematics and Reading
Mathematics Reading Principal Data Use Scales Elementary Middle Elementary Middle Context 0.09 0.03 0.04 -0.06 Supports for Data Use 0.11* 0.06 0.09* 0.01 Attention to Data in the School 0.10* 0.04 0.01 0.00 Barriers to Data Use -0.03 -0.02 -0.04 0.10 Note. * p < .05, two-tailed.
Principal perceptions of Supports for Data Use were positively related to student achievement in elementary mathematics and reading, and their Attention to Data in the School was positively related to student achievement in elementary math-ematics. No other dimensions of principal data use, including Context and Barriers to Data Use, were significantly related to student achievement.
Table 8. Relationships Between Principal Data-Use Scales and Student Achievement in Mathematics and Reading


CHAPTER 4DISCUSSION AND
CONCLUSION

DISCUSSION AND CONCLUSION
CHARTING SUCCESS: DATA USE AND STUDENT ACHIEVEMENT IN URBAN SCHOOLS30
We hypothesized that general and specific data-use practices and perceptions would be positively related to student achieve-ment. The findings partially supported this hypothesis. For both teachers and principals, General Data Use was related to student achievement in some grade levels and subjects. As for more specific practices and perceptions, teachers’ Attention to Data in the Classroom, principals’ Attention to Data in the School and principals’ perceptions of Supports for Data Use were related to higher student achievement in some grades and subjects. In other words, the more that teachers and princi-pals reported reviewing and analyzing student data and using this information to make instructional decisions, the higher their students’ achievement, at least in some grades and subjects. Moreover, for principals, the more they reported having support in the form of data infrastructure, adequate time for review and discussion of data, professional development, and the appropriate human resources, the higher their students’ achievement. Again, these results varied by grade and content area, with significant links observed in both elementary grades and middle grades, as well as in mathematics and reading. The following sections of the report consider these findings and their implications.
Teachers’ Data Use and Student AchievementTeachers’ General Data Use (a combination of the four key dimensions in the theory of action) was related to student achievement in elementary grades reading and middle grades mathematics. These findings suggest that the overall interim assessment process—including the context and data culture, concrete supports, and actual review and use of the data—may be a promising practice in urban districts. The magnitude of the relationships was modest, with effect sizes of 0.10 for middle grades mathematics and 0.17 for elementary reading. Shifting a student’s test score by 0.17 standard deviations could have a significant effect on his or her academic standing. For example, if a student who was at the 50th percentile at the end of grade 3 had a fourth-grade teacher who was at the mean on General Data Use, that student would be at the 57th percentile at the end of grade 4. This could be the difference between a student being categorized as below proficient and proficient on a state assessment. Also, if a student were in classrooms for multiple consecutive years with teachers who have strong data- use perceptions and practices, this positive advantage could be cumulative over time, possibly contributing substantially to the student’s academic achievement.
However, we did not find a significant relationship between teachers’ General Data Use and student achievement in elemen-tary grades mathematics or middle grades reading.4
Analyses of the unique links between the key dimensions of data use and student achievement found that teacher-reported Attention to Data in the Classroom was positively associated with student achievement in middle grades mathematics and elementary reading. That is, the more teachers reported reviewing interim assessment data and responding in the classroom, the higher their students’ achievement on the end-of-year state assessment.
4We conducted district-specific analyses to test whether the non-significant relationships were the result of averaging district-specific effects that varied from each other (e.g., some positive and some negative). We found that the district-specific relationships in each subject and grade level appeared to be relatively similar in direction and magnitude. That is, in all four districts, there was no significant relationship between teachers’ general data use and student achievement in elementary school math and middle school reading, and the district-average results reported in the Key Findings section fairly represented each participating district.
Summary of Findings
Although there was some prior evidence that using periodic assessments (formative assessments, progress monitoring, and curriculum-based measurement) may be positively related to student achievement, research on interim assessment use is limited. At the same time, significant investment has been made in interim assessment systems in school districts across the country. There is a great need for information about whether and how general and specific aspects of teachers’ and principals’ data-use practices and perceptions are linked to student achievement. This study attempted to fill this gap by measuring multiple aspects of interim assessment data use among teachers and principals, and empirically testing the links between key data-use practices and student achievement on end-of-year state assessments.

Council of the Great City Schools • American Institutes for Research • Summer 2012 31 CHARTING SUCCESS: DATA USE AND STUDENT ACHIEVEMENT IN URBAN SCHOOLS
Teachers’ Attention to Data in the Classroom was more strongly related to student achievement than their sense of the as-sessment and instructional context, data culture, or supports for data use. This key finding is consistent with previous re-search that suggests that simply having interim assessments in place is not enough, and that to be effective, educators must actually use data to identify problems, identify reasons behind the problem, and then determine how to adjust their teaching to address the problems (Anderson, Leithwood, & Strauss, 2010). By linking teachers’ data-use practices and perceptions with their own students’ achievement, this study extended prior research that suggested that working with data may help teachers better understand and identify their students’ needs (e.g., Quint, Sepanik, & Smith, 2008).
Our results indicate that teachers’ review of data and subsequent instructional responses were the data-related practices and perceptions most strongly linked to improved student achievement and can be a focus for intervention and improvement with teachers in both elementary and middle grades. To consider in a practical sense how Attention to Data in the Classroom might be improved or addressed in urban schools, it is useful to break this construct down into its component parts, and further into the specific practices and activities that comprise the component parts.
Attention to Data in the Classroom was a combination of teacher’s working with data and their data-based instructional re-sponses. There were three subscales included in Attention to Data in the Classroom: teachers’ individual attention to data, collaboration around data, and their instructional responses to data. Each of these was composed of items reflecting a number of specific practices related to teachers’ review of and response to student data. Examples of the specific practices are shown in Table 9. Any or all of the practices shown in Table 9 may contribute to or drive the significant positive link between Attention to Data in the Classroom and student achievement that we found in this study.
The positive link between Attention to Data in the Classroom and student achievement indicates that the more that teachers engage in the types of practices listed in Table 9, the higher their students’ achievement. At the component level, this means that the more that teachers engage in independent review of their data, and collaborate with others to review their students’ data, and the more they can point to specific instructional responses to data that they use with their students, the higher their students’ achievement at the end of the year.
Of course, this study was not designed to determine whether any or all of these data-use practices shown in Table 9 cause achievement to increase, but this study does provide evidence to suggest that supports that encourage these practices may hold promise for improving the use of interim assessment data, which in turn may help improve student achievement. That is, our results suggest that teachers’ review and response to interim assessment data as described above can potentially act as a lever to improve student achievement in urban districts.
Teachers’ perceived Barriers to Data Use (such as a lack of time to study and think about data, a lack of time to collabo-rate with others in analyzing and interpreting data, or a lack of timeliness in receiving students’ scores) were negatively related to student achievement—but only in elementary mathematics. Perceived Barriers to Data Use may be indicative of breakdowns with the interim assessment process specifically or may, more generally, be an indicator of systemwide or districtwide issues. Additional investigation should examine why barriers were negatively related to student achievement in elementary grades mathematics but not in other subjects and grade levels.

DISCUSSION AND CONCLUSION CONT’D
CHARTING SUCCESS: DATA USE AND STUDENT ACHIEVEMENT IN URBAN SCHOOLS32
Components of Teachers’ Attention to Data in the Classroom Concrete and Specific Attention to Data Practices
Individual Attention to Data
- Teachers’ independent review, analysis, and interpretation of their student data, such as:
o Identifying the number of students per proficiency category
o Reviewing the percent of students who mastered each separate item or groups of items on the interim assessment
o Identifying trends in content mastery at the individual student level and classroom level
- Includes frequency of review and overall amount of time spent engaging in independent review
Collaboration around Data
- Teachers’ review, analysis, and interpretation of data in collaboration with other teachers, administrators, instructional coaches, data coaches, parents, and with students.
- Frequency of participation in formal “data meetings” or professional learning communities
- Frequency of participation in informal collaborative meetings/discussions
Instructional Responses to Data
- On the basis of gaps and strengths identified in interim assessment data, instructional strategies such as:
o Adjusting lesson plans (e.g., to spend more or less time on a concept than originally planned, depending on needs identified in the data)
o Changing scope or sequence of instruction o Reteaching missed or misunderstood material or
concepts to the whole class, small groups, or individual students
o Changing teaching methodology (e.g., from lecture to activity-based)
o Changing or adapting instructional materials o Re-grouping
Heterogeneously, to mix students with different skill/mastery levels
Homogeneously, to provide remediation or acceleration to students at similar skill levels
o Providing targeted interventions for students with poor performance on interim assessments, such as referring students for tutoring within and outside of school.
Components of Teachers’ Attention to Data in the Classroom Concrete and Specific Attention to Data Practices
Individual Attention to Data
Teachers’ independent review, analysis, and interpretation of -their student data, such as:
Identifying the number of students per proficiency ocategory
Reviewing the percent of students who mastered each oseparate item or groups of items on the interim assessment
Identifying trends in content mastery at the individual ostudent level and classroom level
Includes frequency of review and overall amount of time -spent engaging in independent review
Collaboration around Data
Teachers’ review, analysis, and interpretation of data in -collaboration with other teachers, administrators, instructional coaches, data coaches, parents, and with students.
Frequency of participation in formal “data meetings” or -professional learning communities
Frequency of participation in informal collaborative -meetings/discussions
Instructional Responses to Data
On the basis of gaps and strengths identified in interim -assessment data, instructional strategies such as:
Adjusting lesson plans (e.g., to spend more or less otime on a concept than originally planned, depending on needs identified in the data)
Changing scope or sequence of instruction o Reteaching missed or misunderstood material or o
concepts to the whole class, small groups, or individual students
Changing teaching methodology (e.g., from lecture to oactivity-based)
Changing or adapting instructional materials o Re-grouping o
Heterogeneously, to mix students with different skill/mastery levels
Homogeneously, to provide remediation or acceleration to students at similar skill levels
Providing targeted interventions for students with poor operformance on interim assessments, such as referring students for tutoring within and outside of school.
Table 9. Components and Specific Practices That Comprise Attention to Data In the Classroom

Council of the Great City Schools • American Institutes for Research • Summer 2012 33 CHARTING SUCCESS: DATA USE AND STUDENT ACHIEVEMENT IN URBAN SCHOOLS
Principals’ Data-Use Practices Principals’ General Data Use (a combination of the four key dimensions) was related to student achievement in middle grades mathematics. However, there was no relationship in middle grades reading, elementary mathematics, or elementary reading. It may be possible that the adoption of an interim assessment process with an emphasis on supporting effective data use may be one area in which urban schools can intervene at the school level and positively impact student achievement, perhaps in middle grades mathematics in particular.
Analyses testing the unique links between the key dimensions of data use and student achievement found that principals’ Attention to Data in the School was positively associated with elementary school students’ mathematics scores. That is, the more principals reported reviewing interim assessment data and responding at the school level, the higher their students’ achievement on the end-of-year state assessment. Again, although this study cannot purport a causal link between these school-level processes and student achievement, this finding is consistent with previous research that suggests school-level data use may be promising for improving student achievement (Henke, 2005; U.S. Department of Education, 2010a). The magnitude of the link between principals’ Attention to Data and student achievement in elementary mathematics was edu-cationally meaningful, with an effect size of 0.10.
Again, to make this key finding actionable in terms of identifying specific practices on which schools and districts could focus when seeking to improve the use of interim assessment data, it is useful to break Attention to Data in the School down into its component parts and further, into the concrete activities that comprise the component parts.
Attention to Data in the School was a combination of principals’ review and analysis of data and their data-based responses. The three subscales included in Attention to Data in the School were principals’ individual attention to data, collabora-tion around data, and school-level responses to data. Each of these was composed of items reflecting a number of specific practices related to principals’ review of and response to student data. Examples of the specific practices are shown in Table 10. As with the classroom-level practices for teachers, any or all of the school-level practices shown in Table 10 may con-tribute to or drive the significant positive link between Attention to Data in the School and elementary math achievement that we found in this study.
Given the positive relationship between Attention to Data in the School and student achievement, the more principals engage in the types of activities shown in Table 10, the higher the math achievement of students in their schools (at the elementary level). Specifically, independent review of interim assessment data may represent a set of promising principal or school-level data-use practices. Moreover, collaboration that includes administrators—either principals or assistant prin-cipals, or both where appropriate—may be a key feature of an effective data-use process in urban schools. If supported, this type of collaboration may potentially help drive improvements in student achievement. Finally, the specific examples of school-level responses shown in Table 10 may be promising data-use activities.

DISCUSSION AND CONCLUSION CONT’D
CHARTING SUCCESS: DATA USE AND STUDENT ACHIEVEMENT IN URBAN SCHOOLS34
Components of Principals’ Attention to Data in the Classroom Concrete and Specific Attention to Data Practices
Individual Attention to Data
Principals’ independent review, analysis, and -interpretation of their student data, such as:
Identifying the percentage of students scoring at oor above the proficiency level by grade, subject, and classroom
Comparing the performance of students in their oschool versus other schools
Examining the performance of student subgroups o(e.g., students with disabilities, English learners)
Identifying changes or trends in the school’s oresults across years
Includes frequency of review and overall amount of time -spent independently reviewing data
Collaboration around Data
Principals’ review, analysis, and interpretation of data in -collaboration with other teachers, administrators, instructional coaches, data coaches, parents, and with students.
Frequency of participation in formal “data meetings” and -professional learning communities
Frequency of participation in informal collaborative -meetings/discussions
Instructional Responses to Data
On the basis of data review: - Making curriculum changes or decisions o Developing school improvement plans o Seeking professional development for teachers o
based on identified gaps in either content or pedagogical skills that are revealed in the data
Setting schoolwide student achievement goals o Evaluating programs (i.e., examining trends over o
time for students who participate in particular instructional programs/initiatives)
Table 10. Components and Specific Practices That Comprise Attention to Data In the School

Council of the Great City Schools • American Institutes for Research • Summer 2012 35 CHARTING SUCCESS: DATA USE AND STUDENT ACHIEVEMENT IN URBAN SCHOOLS
Our final key finding was that principals’ perceptions of Supports for Data Use were also positively related to student achievement in both elementary grades reading and mathematics. The literature on school-level data-use practices empha-sizes the importance of organizational supports—such as common meeting times to discuss data, the presence of a data coach, the quality of the data infrastructure, and professional development around data use—as promising dimensions of effective data use (Bulkley, Christman, Goertz, & Lawrence, 2010; Clune & White, 2008; Henke, 2005; Marsh et al., 2006; Young, 2006). Our results further indicate that these aspects of using data are in fact related to student achievement at the principal/school level, with effect sizes ranging from 0.09 to 0.11.
As with teachers’ Attention to Data in the Classroom and principals’ Attention to Data in the School, it is useful to break down Supports for Data Use into its component parts and the concrete and specific aspects of these components in order to consider ways that schools and school districts can improve their data supports.
The three subscales included in Supports for Data Use were organizational supports, staffing and human resources, and data infrastructure. In general, the more positive principals’ perceptions of these supports, the higher their students’ achievement (at the elementary school level). Table 11 shows the specific aspects of each of these three components. Any or all of the aspects shown in Table 11 may contribute or drive the significant positive link between Supports for Data Use and student achievement that we found in this study.
Any or all of these specific aspects in Table 11 may be key school-level supports that helped drive the link between princi-pals’ perceptions of their Supports for Data Use and student achievement. Further research is needed to examine the finer grained relationships, but the results of this study suggest that the concrete and specific supports described above are poten-tially promising aspects of interim assessment data use.
The observed findings for principals were in contrast to the results focused on teachers where Supports for Data Use were not a significant predictor of student achievement at either grade level or subject. Principal-reported Supports for Data Use included both the support that they provide in an administrative role as well as supports principals and teachers receive from the school district. Our findings suggest that these school and district supports hold promise as levers for change in urban schools to improve student achievement in elementary grades reading and mathematics.
However, contrary to our hypotheses, principals’ data-use practices and perceptions were not significantly correlated with middle grades students’ achievement in either mathematics or reading. These differences between elementary and middle grades should be examined in future research.
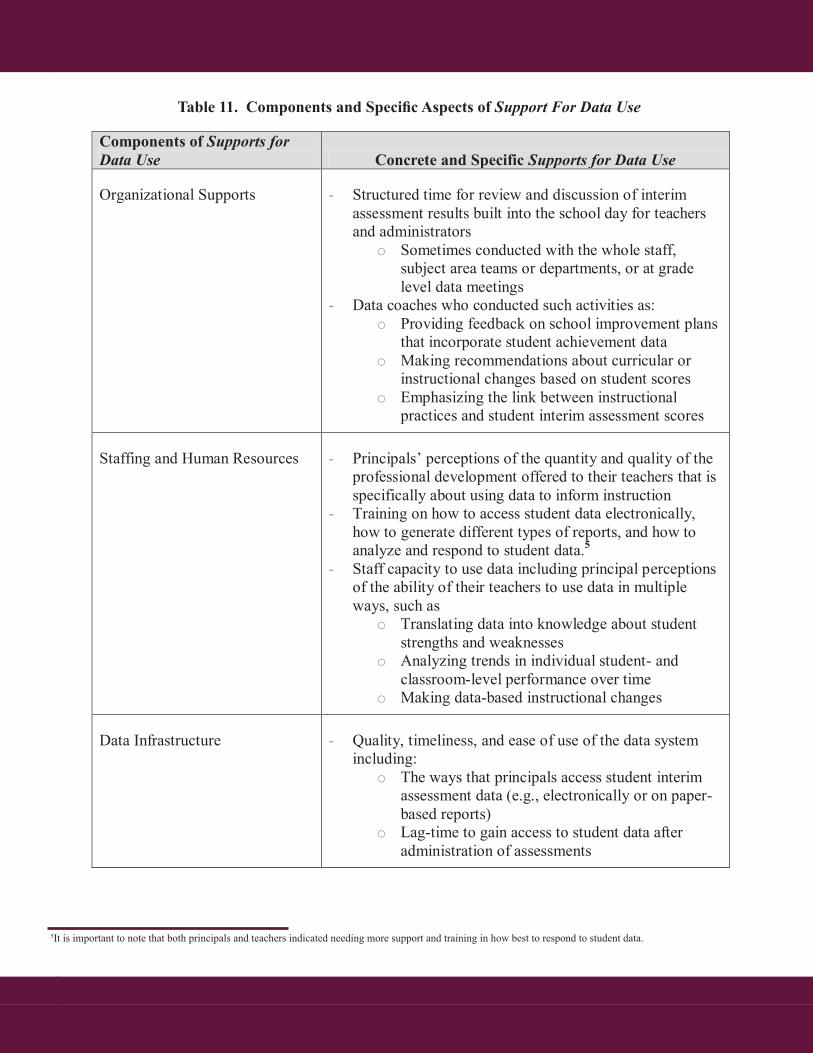
DISCUSSION AND CONCLUSION CONT’D
36 CHARTING SUCCESS: DATA USE AND STUDENT ACHIEVEMENT IN URBAN SCHOOLS
5It is important to note that both principals and teachers indicated needing more support and training in how best to respond to student data.
Components of Supports for Data Use Concrete and Specific Supports for Data Use
Organizational Supports
Structured time for review and discussion of interim -assessment results built into the school day for teachers and administrators
Sometimes conducted with the whole staff, osubject area teams or departments, or at grade level data meetings
Data coaches who conducted such activities as: - Providing feedback on school improvement plans o
that incorporate student achievement data Making recommendations about curricular or o
instructional changes based on student scores Emphasizing the link between instructional o
practices and student interim assessment scores
Staffing and Human Resources
Principals’ perceptions of the quantity and quality of the -professional development offered to their teachers that is specifically about using data to inform instruction
Training on how to access student data electronically, -how to generate different types of reports, and how to analyze and respond to student data.5
Staff capacity to use data including principal perceptions -of the ability of their teachers to use data in multiple ways, such as
Translating data into knowledge about student ostrengths and weaknesses
Analyzing trends in individual student- and oclassroom-level performance over time
Making data-based instructional changes o
Data Infrastructure
Quality, timeliness, and ease of use of the data system -including:
The ways that principals access student interim oassessment data (e.g., electronically or on paper-based reports)
Lag-time to gain access to student data after oadministration of assessments
Table 11. Components and Specific Aspects of Support For Data Use
Council of the Great City Schools • American Institutes for Research • Summer 2012 37 CHARTING SUCCESS: DATA USE AND STUDENT ACHIEVEMENT IN URBAN SCHOOLS
This study used rigorous statistical modeling to explore the relationships between the key dimensions of data use and student achievement, but it is important to note some limitations. First, the study relied on self-report survey data rather than obser-vations of actual data use and instructional practices. Based on the teacher and principal survey results, the four key dimen-sions of data use were highly correlated. Although these correlations provide some basic support for the study’s theory of action, they may be at least partially explained by measurement error due to the fact that the variables were measured using the same survey. If the key dimensions were measured separately with different techniques (e.g., a combination of survey and observations), we may have been able to obtain more refined measures of each dimension and the key elements and components within each dimension. These constructs in the theory of action provided a roadmap for designing the surveys used for this study; however, as measured, the scales (and subscales) derived from the surveys did not appear to represent highly distinct aspects of data-use practices and perceptions. Future studies may benefit from a mixed-methods approach to measuring teacher and principal data use.
A related limitation is that the analysis does not identify whether certain practices within these dimensions are more prom-ising than others. Future work also should continue to refine the measurement strategy to allow for analyses of the links between more specific data-use practices and student achievement than could be tested in this foundational study.
A third limitation of the study is that it was not designed to provide information about the implementation quality of the interim assessment process in the participating districts. For example, a teacher may report regularly attending team data meetings, but the quality or relevance of the content of those meetings is not captured in the survey responses. The survey data also do not provide information about the quality of the actual interim assessments used in the participating districts. Although we collected data about perceived alignment with the curriculum, pacing guides, and state assessments, a measure of the true degree of this alignment was beyond the scope of this study.
To partially address this limitation, we conducted a follow-up study of the alignment between the interim assessments and the state standards and pacing guides in one subject (mathematics) in one of the participating districts. The results suggest that in this one district, the interim assessments were well aligned with the state assessment. Similar alignment studies in the other participating districts would help to further ground the results of the main study.
A fourth limitation involves the generalizability of the findings. The school-based samples of principals, teachers, and stu-dents were sufficiently large in size, but there were only four districts. It is not clear whether the findings from these four districts can be generalized to other urban districts or districts in other localities (e.g., suburban or rural).
Finally, although this study provides evidence of a relationship between some key dimensions of data use and student achievement, it is essential to understand that no causal claims about the nature of these relationships can be made on the basis of this correlational study. Interim assessments and the use of their data are just one of a number of policies, practices, and interventions being implemented within schools and school districts. It is not our claim that supports for data use and attention to data use in the classroom or school directly cause improved student achievement in certain grades and subjects. Rather, this study provides foundational evidence that as some aspects of data use increase, so too does student achievement. This study does not rule out the possibility that something else caused both the level or degree of data use and the improve-ment in achievement.
Study Limitations

DISCUSSION AND CONCLUSION CONT’D
CHARTING SUCCESS: DATA USE AND STUDENT ACHIEVEMENT IN URBAN SCHOOLS38
Future research can help provide additional evidence of whether and how interim assessments can be used as a tool to in-crease student achievement. The ultimate goal would be to develop a set of standards or strategies that districts and schools can use as a guide for effective data use.
Self-report measures of data use have provided valuable information on how interim assessments are used at classroom and school levels in the selected urban districts. As already noted, these data could be further enhanced through observations of actual data-use practices. These could include observations of data meetings where staff discuss the results of interim assessments or plan instructional responses and professional development on data use. Deeper study could also include an examination of lesson plans that stem from a review of the interim assessment data, along with classroom observations to explore how these plans are implemented.
As we learn more about specific data-use practices that are associated with student achievement, another next step is to develop a more refined theory of action. This could involve developing specific data-use interventions intended to improve data use and instructional responses. Further research can also test the impact of such interventions on student achievement and identify the key mechanisms through which data use affects student learning.
Of the six significant relationships between data-use practices/perceptions and student achievement that emerged in this study’s analyses, five were found in the elementary grades. This finding suggests that something about the structure of the elementary grades may be more conducive to the successful use of interim assessments, compared with the middle grades. Further research is needed to identify key factors in the elementary grades that could be adopted or adapted in the middle grades to potentially increase the utility of interim assessments for older students. Similarly, further exploration can help achieve a better understanding of data-use differences in mathematics and reading that were revealed in this study.
Future Directions
Conclusion
With the current increase in the use of interim assessments, the need for a more comprehensive body of literature on ef-fective use of data for instructional improvement is critical. Supporters of interim assessments believe that using this type of measure on a periodic basis can lead to improved student achievement. However, despite the widespread use of these assessments, few studies actually document the relationship between data-use-related perceptions and practices and student achievement.
This study attempted to shed light on this issue by examining the relationship between key dimensions of data use and student achievement in two major content areas (reading and mathematics) and in the two grade levels (elementary and middle) in which interim assessments most often are used. The results across content areas and grade levels were mixed but suggest that some aspects of classroom- and school-level interim assessment data use are related to improvements in student achievement. The results also appear to be in line with previous research that suggests that simply having interim assess-ments may be helpful but not sufficient to produce positive changes in student achievement (e.g., see Henderson, Petrosino, Guckenburg, & Hamilton, 2007; 2009).
This study sought to begin to understand the connection between different aspects of interim assessment data use and stu-dent achievement. Given that school districts and schools are facing significant budget challenges and must make important decisions about resource allocation, it is imperative that we identify the specific dimensions of data use that are most im-portant for improving student outcomes. Many school districts are increasingly using various types of assessments and data in an effort to engage in data-driven decision making. Although the study focused primarily on the use of data from interim assessments, some of the study results may extend beyond interim assessments to provide a glimpse into the overall data

CHARTING SUCCESS: DATA USE AND STUDENT ACHIEVEMENT IN URBAN SCHOOLS
culture of participating districts. As such, this study provides a foundation for future exploration of the relationships between student achievement and other types of data that can be used for instructional and school improvement.
Finally, these findings have implications for data use policies and practices in school districts and schools. This is particu-larly important as the nation moves toward the Common Core State Standards and the assessment systems that will accom-pany them. The findings suggest that, at the very least, if schools adopt interim assessments to produce changes in student achievement, schools and districts should provide adequate support for using the data, and teachers should actively use data in the classroom—both by spending time individually and collaboratively reviewing the student data and by responding instructionally.
Although these findings do not identify the specific aspects of each dimension that are most important, it appears that data use by principals, particularly in elementary school, may be as important as teacher data use. This is in line with the find-ings from our site visits (as well as prevailing wisdom) that suggest that leadership and support from the administration are critical.
The findings of this three-year project revealed that schools are better able to work with data when they have the appropriate data infrastructure, organizational supports for the analysis and productive discussions about data, human resources (e.g., data coaches), and professional development. In addition, there are important uses for interim assessment data by stakehold-ers at all levels. These include use by district leaders to identify professional development needs and evaluate district initia-tives, use by school leaders to develop and evaluate school and staff improvement plans, and perhaps most importantly, use by teachers to inform instructional strategies. It is there in the classroom that student needs are most effectively met.
39


REFERENCES
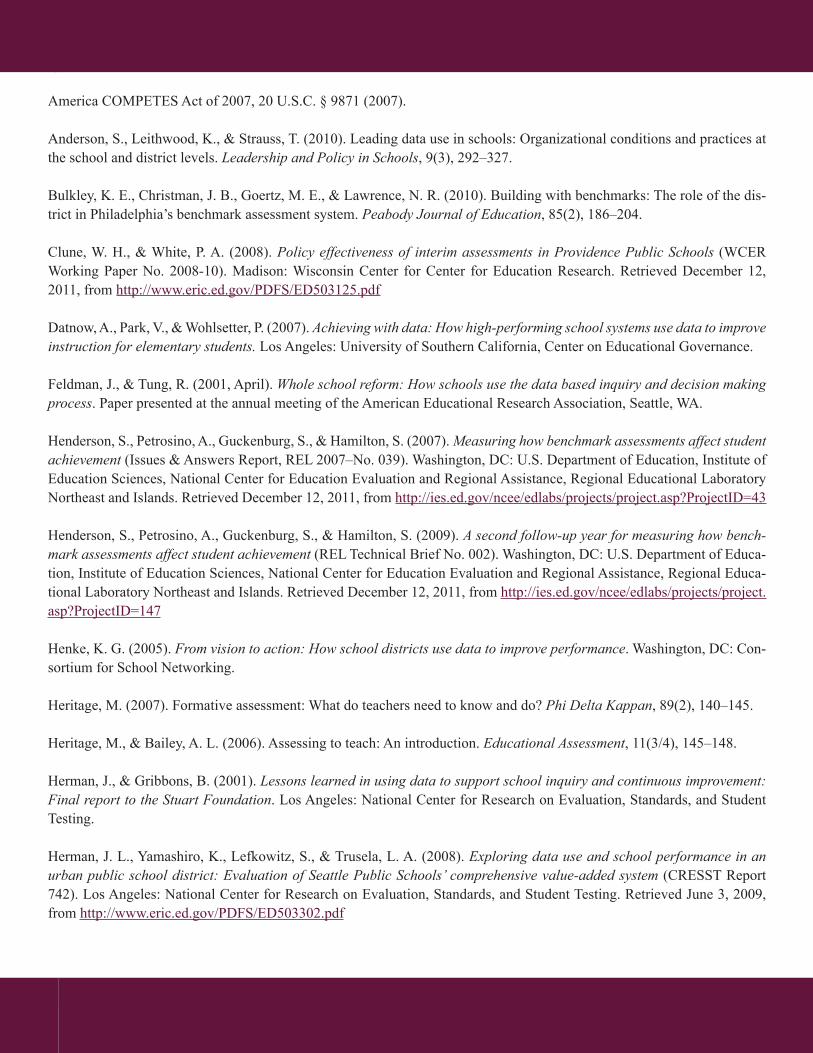
REFERENCES
America COMPETES Act of 2007, 20 U.S.C. § 9871 (2007).
Anderson, S., Leithwood, K., & Strauss, T. (2010). Leading data use in schools: Organizational conditions and practices at the school and district levels. Leadership and Policy in Schools, 9(3), 292–327.
Bulkley, K. E., Christman, J. B., Goertz, M. E., & Lawrence, N. R. (2010). Building with benchmarks: The role of the dis-trict in Philadelphia’s benchmark assessment system. Peabody Journal of Education, 85(2), 186–204.
Clune, W. H., & White, P. A. (2008). Policy effectiveness of interim assessments in Providence Public Schools (WCER Working Paper No. 2008-10). Madison: Wisconsin Center for Center for Education Research. Retrieved December 12, 2011, from http://www.eric.ed.gov/PDFS/ED503125.pdf
Datnow, A., Park, V., & Wohlsetter, P. (2007). Achieving with data: How high-performing school systems use data to improve instruction for elementary students. Los Angeles: University of Southern California, Center on Educational Governance.
Feldman, J., & Tung, R. (2001, April). Whole school reform: How schools use the data based inquiry and decision making process. Paper presented at the annual meeting of the American Educational Research Association, Seattle, WA.
Henderson, S., Petrosino, A., Guckenburg, S., & Hamilton, S. (2007). Measuring how benchmark assessments affect student achievement (Issues & Answers Report, REL 2007–No. 039). Washington, DC: U.S. Department of Education, Institute of Education Sciences, National Center for Education Evaluation and Regional Assistance, Regional Educational Laboratory Northeast and Islands. Retrieved December 12, 2011, from http://ies.ed.gov/ncee/edlabs/projects/project.asp?ProjectID=43
Henderson, S., Petrosino, A., Guckenburg, S., & Hamilton, S. (2009). A second follow-up year for measuring how bench-mark assessments affect student achievement (REL Technical Brief No. 002). Washington, DC: U.S. Department of Educa-tion, Institute of Education Sciences, National Center for Education Evaluation and Regional Assistance, Regional Educa-tional Laboratory Northeast and Islands. Retrieved December 12, 2011, from http://ies.ed.gov/ncee/edlabs/projects/project.asp?ProjectID=147
Henke, K. G. (2005). From vision to action: How school districts use data to improve performance. Washington, DC: Con-sortium for School Networking.
Heritage, M. (2007). Formative assessment: What do teachers need to know and do? Phi Delta Kappan, 89(2), 140–145.
Heritage, M., & Bailey, A. L. (2006). Assessing to teach: An introduction. Educational Assessment, 11(3/4), 145–148.
Herman, J., & Gribbons, B. (2001). Lessons learned in using data to support school inquiry and continuous improvement: Final report to the Stuart Foundation. Los Angeles: National Center for Research on Evaluation, Standards, and Student Testing.
Herman, J. L., Yamashiro, K., Lefkowitz, S., & Trusela, L. A. (2008). Exploring data use and school performance in an urban public school district: Evaluation of Seattle Public Schools’ comprehensive value-added system (CRESST Report 742). Los Angeles: National Center for Research on Evaluation, Standards, and Student Testing. Retrieved June 3, 2009, from http://www.eric.ed.gov/PDFS/ED503302.pdf
CHARTING SUCCESS: DATA USE AND STUDENT ACHIEVEMENT IN URBAN SCHOOLS42

Council of the Great City Schools • American Institutes for Research • Summer 2012 43 CHARTING SUCCESS: DATA USE AND STUDENT ACHIEVEMENT IN URBAN SCHOOLS
Ingram, D., Louis, K. S., & Schroeder, R. G. (2004). Accountability policies and teacher decision making: Barriers to the use of data to improve practice. Teachers College Record, 106, 1258–1287.
Kerr, K. A., Marsh, J. A., Ikemoto, G. S., Darilek, H., & Barney, H. (2006). Strategies to promote data use for instructional improvement: Actions, outcomes, and lessons from three urban districts. American Journal of Education, 112(4), 496–520.
Lachat, M. A., & Smith, S. (2005). Practices that support data use in urban high schools. Journal of Education for Students Placed at Risk, 10(3), 333–349.
Marsh, J. A., Pane, J. F., & Hamilton, L. S. (2006). Making sense of data-driven decision making in education: Evidence from recent RAND research. Santa Monica, CA: RAND.
Marshall, K. (2008). Interim assessments: A user’s guide. Phi Delta Kappan, 90(1), 64–68.
Perie, M., Marion, S., Gong, B., & Wurtzel, J. (2007, November). The role of interim assessments in a comprehensive as-sessment system. Washington, DC: The Aspen Institute.
Quint, J. C., Sepanik, S., & Smith, J. K. (2008). Using student data to improve teaching and learning: Findings from an evaluation of the Formative Assessments of Student Thinking in Reading (FAST-R) program in Boston elementary schools. New York: MDRC. Retrieved January 15, 2008, from http://www.mdrc.org/publications/508/full.pdf
Raudenbush, S. W., & Bryk, A. S. (2002). Hierarchical linear models: Applications and data analysis methods (2nd ed.). Thousand Oaks, CA: Sage.
Sharkey, N. S., & Murnane, R. J. (2006). Tough choices in designing a formative assessment system. American Journal of Education, 112(4), 572–588.
Snipes, J., Doolittle, F., & Herlihy, C. (2002). Foundations for success: Case studies of how urban schools improve student achievement. New York: MDRC for The Council of the Great City Schools.
U.S. Department of Education. (2009). Implementing data-informed decision making in schools: Teacher access, supports and use. Washington, DC: U.S. Department of Education, Office of Planning, Evaluation and Policy Development.
U.S. Department of Education. (2010). Use of education data at the local level from accountability to instructional improve-ment. Washington, DC: U.S. Department of Education, Office of Planning, Evaluation and Policy Development.
Wayman, J. C., Cho, V., & Johnston, M. T. (2007). The data-informed district: A district-wide evaluation of data use in the Natrona County School District. Austin, TX: University of Texas.
Young, V. M. (2006). Teachers’ use of data: Loose coupling, agenda setting, and team norms. American Journal of Educa-tion, 112(4), 521–548.

CHARTING SUCCESS: DATA USE AND STUDENT ACHIEVEMENT IN URBAN SCHOOLS44
About the Council of the Great City Schools
The Council of the Great City Schools is a coalition of 67 of the nation’s largest urban public school systems. The or-ganization’s Board of Directors is composed of the Superintendent, CEO or Chancellor of Schools, and one School Board member from each member city. An Executive Committee of 24 individuals, equally divided in number between Superin-tendents and School Board members, provides regular oversight of the 501 (c)(3) organization. The composition of the or-ganization makes it the only independent national group representing the governing and administrative leadership of urban education and the only association whose sole purpose revolves around urban schooling.
The mission of the Council is to advocate for urban public education and assist its members in their improvement and re-form. The Council provides services to its members in the areas of legislation, research, communication, curriculum and instruction, and management. The group convenes two major conferences each year; conducts studies of urban school conditions and trends; and operates ongoing networks of senior school district managers with responsibilities for areas such as federal programs, operations finance, personnel, communications, research and technology. Finally, the organization informs the nation’s policymakers, the media, and the public of the successes and challenges of schools in the nation’s Great Cities. Urban school leaders from across the country use the organization as a source of information and an umbrella for their joint activities and concerns. The Council was founded in 1956 and incorporated in 1961, and has its headquarters in Washington, D.C.
Chair of the BoardCandy Olson, Hillsborough County School Board
Chair-Elect of the BoardEugene White, Indianapolis Superintendent
Secretary/TreasurerEileen Cooper Reed, Cincinnati School Board
Immediate-past ChairWinston Brooks, Albuquerque Superintendent
Achievement Task Force ChairsEileen Cooper Reed, Cincinnati Board Member
Eric Gordon, Cleveland Superintendent

CHARTING SUCCESS: DATA USE AND STUDENT ACHIEVEMENT IN URBAN SCHOOLS


COUNCIL OF THE GREAT CITY SCHOOLS
1301 Pennsylvania Avenue, NWSuite 702Washington, DC 20004
202-393-2427202-393-2400 (fax)www.cgcs.org