charter schools and the road to college...
TRANSCRIPT

Charter Schools and the Road to College Readiness:
The Effects on College Preparation, Attendance and Choice
Prepared forThe Boston Foundation
andNewSchools Venture Fund
May 2013
U n d e r s t a n d i n g B o s t o n

Design: Kate Canfield, Canfield Design
Cover Photo: Orange Line Media
© 2013 by the Boston Foundation. All rights reserved.
The Boston Foundation The Boston Foundation, Greater Boston’s community foundation, is one of the oldest and largest community founda-
tions in the nation, with net assets of more than $800 million. In 2012, the Foundation and its donors made $88 million in
grants to nonprofit organizations and received gifts of close to $60 million. The Foundation is a partner in philanthropy,
with some 900 separate charitable funds established by donors either for the general benefit of the community or for
special purposes. The Boston Foundation also serves as a major civic leader, provider of information, convener and spon-
sor of special initiatives that address the region’s most pressing challenges. The Philanthropic Initiative (TPI), an operat-
ing unit of the Foundation, designs and implements customized philanthropic strategies for families, foundations and
corporations around the globe. Through its consulting and field-advancing efforts, TPI has influenced billions of dollars
in giving worldwide. For more information about the Boston Foundation and TPI, visit www.tbf.org or call 617-338-1700.
About NewSchools Venture Fund NewSchools Venture Fund finds and invests in education entrepreneurs: passionate innovators who expand the bound-
aries of what can be achieved for students from low-income communities. We seek entrepreneurs with the vision and
capacity to build companies that will scale to serve millions of students, teachers or schools. In addition to financial
resources, we provide our entrepreneurs hands-on support by serving on governance boards, advising on strategic
issues and making vital connections to partners, customers and funders. To fund our work, we raise philanthropic
dollars from donors who share our belief that entrepreneurs can change public education. We support and invest in both
nonprofit and for-profit organizations; any financial returns recycle back into our funds. For more about the NewSchools
Venture Fund, visit www.newschools.org.
UNDERSTANDING BOSTON is a series of forums, educational events and research sponsored by the Boston Foundation to provide
information and insight into issues affecting Boston, its neighborhoods and the region. By working in collaboration with
a wide range of partners, the Boston Foundation provides opportunities for people to come together to explore challenges
facing our constantly changing community and to develop an informed civic agenda. Visit www.tbf.org to learn more
about Understanding Boston and the Boston Foundation.

Charter Schools and the Road to College Readiness:
The Effects on College Preparation, Attendance and Choice
AuthorsJoshua D. AngristSarah R. Cohodes
Susan M. DynarskiParag A. Pathak
Christopher D. Walters
Prepared forThe Boston Foundation
andNewSchools Venture Fund

Acknowledgements
This study would not have been possible without extraordinary cooperation and assistance from the charter schools in the study, from Dr. Kamalkant Chavda and the staff of the Boston Public Schools (BPS), and from Carrie Conaway and the staff of the Massachusetts Department of Elementary and Secondary Education (DESE). We would especially like to recognize our institutional partners, who have many demands on their time and resources, but have nevertheless been more than willing to repeatedly share their expertise and data with our academic research team. This sort of partnership is not to be taken for granted; it might be unique among US states and public school districts. In their openness to sophisticated and impartial data analysis and research, BPS and DESE provide a wonderful example for our nation. We would also like to thank Annice Correia, who provided excellent research and administrative support, and Daisy Sun and Peter Hull for their expert research assistance. Finally, the research team gratefully acknowledges financial support from the Institute of Education Sciences under Grant Number R305A120269.

Preface
Boston charter schools are making a substantive difference in the lives of their students. For the Boston Foundation, recognition of this began in 2009, when we partnered with the Massa-chusetts Department of Elementary and Secondary Education to publish an Understanding Boston report that compared the results of students in Boston’s charter schools, pilot schools and traditional schools.
The report, Informing the Debate, by a team of researchers from MIT and Harvard, which used data from the state, followed individual students over time. While it showed few advantages for students attending pilot schools, which the Boston Foundation had heavily invested in at the time, it did show that charter schools—at both the middle and high school levels—had a decidedly positive impact on student achievement. The results in math achievement for middle-school students were nothing short of remarkable.
Informing the Debate helped to fuel the movement to partially lift the cap on charter schools in Massachusetts, spurred by President Barack Obama’s Race to the Top federal funding strat-egy for education, which emphasizes innovation and encourages the establishment of more charter schools. Inspired by the potential for federal funds for education, in the spring of 2009 Governor Deval Patrick announced support for in-district charter schools. On a local level, Mayor Thomas M. Menino filed legislation that would allow local school districts to open new, district-run charter schools.
In January of 2010, a major education reform act was passed in Massachusetts. Through our convening of the Race to the Top Coalition, the Boston Foundation was proud to play a key role in the passage of An Act Relevant to the Achievement Gap, which, among other advances, doubled the number of charter school seats in the state.
In February of this year, Stanford University’s Center for Research on Education Outcomes published a study showing dramatic results for Massachusetts’s charter schools—especially those in Boston. Boston charter students had gains equating more than 12 months of additional learning in a year in reading and 13 months in math.
This report, by a team from MIT’s School Effectiveness and Inequality Initiative (SEII), which includes some members from the team behind Informing the Debate, also produces powerful evidence on charter effectiveness. It focuses on Boston’s charter high schools and finds gains in MCAS, Advanced Placement and SAT scores. It also shows that students from charter high schools are more likely to attend four-year rather than two-year colleges, which means that they will be better prepared for jobs in our competitive innovation economy.
Paul S. GroganPresident and CEO The Boston Foundation


Contents
CHAPTER ONE: Introduction . . . . . . . . . . . . . . . . . . . . . . . . . . . . . . . . . . . . . . . . . . . . . . . . . . . . . . . . . . . . . . . . . . . . . . . . . . . . . . . . . . . . . . 7
CHAPTER TWO: Data Collection and Sample . . . . . . . . . . . . . . . . . . . . . . . . . . . . . . . . . . . . . . . . . . . . . . . . . . . . . . . . . . . . . . . . . . . . . . . 9School Selection . . . . . . . . . . . . . . . . . . . . . . . . . . . . . . . . . . . . . . . . . . . . . . . . . . . . . . . . . . . . . . . . . . . . . . . . . . . . . . . . . . . . . . . . . . . . 9Student Data . . . . . . . . . . . . . . . . . . . . . . . . . . . . . . . . . . . . . . . . . . . . . . . . . . . . . . . . . . . . . . . . . . . . . . . . . . . . . . . . . . . . . . . . . . . . . . . 9
CHAPTER THREE: Empirical Framework . . . . . . . . . . . . . . . . . . . . . . . . . . . . . . . . . . . . . . . . . . . . . . . . . . . . . . . . . . . . . . . . . . . . . . . . . . 13First Stage Estimates and an MCAS Benchmark . . . . . . . . . . . . . . . . . . . . . . . . . . . . . . . . . . . . . . . . . . . . . . . . . . . . . . . . . . . . . . . . 14
CHAPTER FOUR: College Preparation . . . . . . . . . . . . . . . . . . . . . . . . . . . . . . . . . . . . . . . . . . . . . . . . . . . . . . . . . . . . . . . . . . . . . . . . . . . . 17MCAS Thresholds . . . . . . . . . . . . . . . . . . . . . . . . . . . . . . . . . . . . . . . . . . . . . . . . . . . . . . . . . . . . . . . . . . . . . . . . . . . . . . . . . . . . . . . . . . 17AP Taking and Scores . . . . . . . . . . . . . . . . . . . . . . . . . . . . . . . . . . . . . . . . . . . . . . . . . . . . . . . . . . . . . . . . . . . . . . . . . . . . . . . . . . . . . . . 20SAT Taking and Scores . . . . . . . . . . . . . . . . . . . . . . . . . . . . . . . . . . . . . . . . . . . . . . . . . . . . . . . . . . . . . . . . . . . . . . . . . . . . . . . . . . . . . . 21High School Graduation . . . . . . . . . . . . . . . . . . . . . . . . . . . . . . . . . . . . . . . . . . . . . . . . . . . . . . . . . . . . . . . . . . . . . . . . . . . . . . . . . . . . . 24
CHAPTER FIVE: College Enrollment and College Choice . . . . . . . . . . . . . . . . . . . . . . . . . . . . . . . . . . . . . . . . . . . . . . . . . . . . . . . . . . . 27
CHAPTER SIX: Additional Results . . . . . . . . . . . . . . . . . . . . . . . . . . . . . . . . . . . . . . . . . . . . . . . . . . . . . . . . . . . . . . . . . . . . . . . . . . . . . . . . . 31The Peer Channel . . . . . . . . . . . . . . . . . . . . . . . . . . . . . . . . . . . . . . . . . . . . . . . . . . . . . . . . . . . . . . . . . . . . . . . . . . . . . . . . . . . . . . . . . . 31Effects on Special Education Students . . . . . . . . . . . . . . . . . . . . . . . . . . . . . . . . . . . . . . . . . . . . . . . . . . . . . . . . . . . . . . . . . . . . . . . .33
CHAPTER SEVEN: Summary and Conclusions . . . . . . . . . . . . . . . . . . . . . . . . . . . . . . . . . . . . . . . . . . . . . . . . . . . . . . . . . . . . . . . . . . . . . 37
Data Appendix . . . . . . . . . . . . . . . . . . . . . . . . . . . . . . . . . . . . . . . . . . . . . . . . . . . . . . . . . . . . . . . . . . . . . . . . . . . . . . . . . . . . . . . . . . . . . . . . 39
Technical Appendix . . . . . . . . . . . . . . . . . . . . . . . . . . . . . . . . . . . . . . . . . . . . . . . . . . . . . . . . . . . . . . . . . . . . . . . . . . . . . . . . . . . . . . . . . . . . 47
Bibliography . . . . . . . . . . . . . . . . . . . . . . . . . . . . . . . . . . . . . . . . . . . . . . . . . . . . . . . . . . . . . . . . . . . . . . . . . . . . . . . . . . . . . . . . . . . . . . . . . .50
Endnotes . . . . . . . . . . . . . . . . . . . . . . . . . . . . . . . . . . . . . . . . . . . . . . . . . . . . . . . . . . . . . . . . . . . . . . . . . . . . . . . . . . . . . . . . . . . . . . . . . . . . .53
About the Authors . . . . . . . . . . . . . . . . . . . . . . . . . . . . . . . . . . . . . . . . . . . . . . . . . . . . . . . . . . . . . . . . . . . . . . . . . . . . . . . . . . . . . . . . . . . . .55

7C h a r t e r S c h o o l s a n d t h e R o a d t o C o l l e g e R e a d i n e s s
Charter Schools in MassachusettsTwenty years ago, the Massachusetts Education Reform Act of 1993 set in motion a series of major new initia-tives to equalize funding across the Commonwealth, improve the quality of teaching, and strengthen account-ability for school performance. Among other impor-tant innovations, MERA established the Massachusetts Comprehensive Assessment System (MCAS) to inform curriculum and instruction and evaluate the perfor-mance of students, schools and districts. Also as part of the Act, the first charter schools were permitted to open in Massachusetts.
Charter schools are similar in many respects to other public schools. Because their charters are granted by the state, however, charter schools are not subject to the supervision of local school committees or super-intendents and their personnel are typically outside local collective-bargaining agreements. Charter schools are free to structure their curriculum and school envi-ronment. For instance, many charter schools fit more instructional hours into a year by running longer school days and providing instruction during the summer. In exchange for this added flexibility, charter schools are required to meet the standards and goals laid out in their charters. Schools that fail to do so may lose their right to operate as a publicly funded school. Charter schools are open to any child, free of charge. If more children want to enroll in a charter school than it has space for, an admissions lottery is held.
In 2009, the Boston Foundation partnered with the Massachusetts Department of Elementary and Second-ary Education to publish Informing the Debate, an in-depth analysis of the effect of Boston’s charter schools on standardized test scores. The present report builds on this earlier study, and is the product of a research team that includes four authors who contributed to the earlier report. This new report was produced under the auspices of MIT’s School Effectiveness and Inequality Initiative (SEII), using the same data sources and empiri-cal methods as used for the 2009 report. Specifically,
both reports rely on charter school admissions lotteries to make “apples to apples” comparisons that capture the causal effect of charter attendance.
Informing the Debate showed that Boston middle and high school charter schools boost student achievement markedly, especially in math. This new report assesses the effect of Boston’s charter high schools on student outcomes beyond MCAS test scores. We focus on outcomes that are either essential for or facilitate post-secondary schooling: high school graduation, the attain-ment of state competency thresholds, college scholarship qualification, Advanced Placement (AP) and SAT scores, college enrollment and college choice. These new results address an important critique of the research linking school performance with MCAS: as part of their effort to meet accountability standards, schools may feel pres-sure to “teach to the test” and to focus on students who are most likely to contribute to score gains. By contrast, in addition to their intrinsic significance, most of the outcomes examined here are not part of the state’s high-stakes accountability system, and therefore not subject to the same risk of strategic test preparation.
As in our earlier work, the research design used in this study exploits randomized enrollment lotter-ies at over-subscribed charter schools. By comparing randomly-admitted lottery winners and losers, instead of applicants who do and don’t chose to attend char-ters, these estimates are very likely to provide reliable measures of the average causal effect of charter atten-dance on charter students.
The Effect of Charter Schools on Postsecondary OutcomesOne of the most important questions in education research is whether the gains from interventions for which we see short-term success can be sustained. For example, in studies of pre-school interventions, gains generated by effective teachers and elementary school class size reductions often appear to fade as students
CHAPTER ONE
Introduction

8 U n d e r s t a n d i n g B o s t o n
progress through school, though some of these gains may re-emerge later in non-cognitive outcomes.1 The possibility of short-lived impacts is especially relevant in research that relies on high-stakes assessments, which create pressure on schools and educators to “teach to the test.” The fact that schools are increasingly subject to intense scrutiny and evaluation based on test results may create incentives for teacher cheating (Jacob and Levitt, 2003), highly strategic instruction (Jacob, 2007) or an instructional focus on small groups of students that are pivotal for official accountability measures (Neal and Schanzenbach, 2010).
The analysis here focuses on Boston’s charter high schools. For our purposes, an analysis of high schools is both a necessity and a virtue. It is necessary to study high schools because most students applying to char-ters in earlier grades are not yet old enough to generate data on postsecondary outcomes. Charter high schools are also of substantial policy interest: a growing body of research argues that high school may be too late for cost-effective human capital interventions (see, for example, Cunha et al., 2010). Indeed, impact analyses of interventions for urban youth have mostly generated disappointing results.2 We’re interested in ascertaining whether charter schools, which in Massachusetts are largely budget-neutral, can have a substantial impact on the life course of affected students. The set of schools studied here comes from an earlier investigation of the effects of charter attendance in Boston on test scores (Abdulkadiroglu et al., 2011). The high schools in our earlier study, which enroll the bulk of charter high school students in Boston, generate statistically and socially significant gains on state assessments in the 10th grade. We turn here to the question of whether these gains are sustained.
Summary of FindingsBoston’s over-subscribed charter schools generate impressive gains on tests taken through the Massa-chusetts Comprehensive Assessment System (MCAS). Lottery estimates show that each year spent at a charter middle school boosts MCAS scores by about a fifth of a standard deviation in English Language Arts (ELA) and more than a third of a standard deviation in math. High school gains are just as large (Abdulkadiroglu et al., 2011). These results are in line with those generated by urban charters elsewhere in Massachusetts, as we’ve shown in studies of a Knowledge is Power Program (KIPP) school in Lynn, Massachusetts (Angrist et al., 2010, 2012), and in an analysis of achievement effects in charter schools from around the state (Angrist et al., 2011a,b).3
Our new findings suggest that the achievement gains generated by Boston’s high-performing charter high schools are remarkably persistent. While the students who were randomly offered a seat at these high schools graduate at about the same rate as those not offered a seat, lottery estimates show that charter enrollment produces gains on Advanced Placement (AP) tests and the SAT. Charter attendance roughly doubles the likeli-hood that a student sits for an AP exam and increases the share of students who pass AP Calculus. Charter attendance does not increase the likelihood of taking the SAT, but it does boost scores, especially in math. Charter school attendance also increases the pass rate on the exam required for high school graduation in Massachusetts, with especially large effects on the likelihood of qualifying for a state-sponsored college scholarship. Other estimates suggest that charter atten-dance may increase college enrollment, but the number of charter applicants old enough to be in college is still too small for this result to be conclusive. By contrast, our results show that charter attendance induces a clear shift from two-year to four-year colleges, with gains most pronounced at four-year public institutions in Massachusetts.
9C h a r t e r S c h o o l s a n d t h e R o a d t o C o l l e g e R e a d i n e s s
School Selection We set out to study the effect of attendance at six char-ter high schools in Boston. Applicants to these schools comprise the sample used to construct the lottery-based estimates of charter high school achievement effects reported in our earlier study (Abdulkadiroglu et al., 2011), and they account for the bulk of charter high school enrollment in Boston today.4 Two other charter high schools serving Boston students in the same period are now closed; one school has poor records and appears unsuitable for a lottery-based analysis.
Appendix Table A1 describes features of the charter schools included in this study, as well as those of the full set of charter high schools in Boston and Boston’s traditional public schools (including exam schools). Charters are classified according to whether they cover grades 9-12 or are limited to grades 9-12. The three groups of charter schools described in Table A1 are simi-lar: Boston’s charters run a longer school year and day than traditional public schools. They also make frequent use of Saturday school. Most adhere to the No Excuses instructional approach. Panel B of Table A1 compares teacher characteristics, per-pupil expenditure and Title I eligibility. Charter teachers are younger than their tradi-tional public school counterparts: 76 percent of teachers in our applicant sample are 32 years old or younger, compared to 28 percent of public school teachers. Simi-larly, only 5 percent of (study sample) charter teachers are 49 years old or older, while 35 percent of public school teachers are at least 49. Charters spend somewhat less per-pupil than traditional public schools in Boston, though their classes are smaller (spending differences likely reflect differences in student mix, such as the number of special education and limited English profi-cient students).5 All public schools in Boston, including charter schools, qualify for Title I aid.
Student DataMassachusetts charter schools admit students by lottery when they have more applicants than seats. We collected lists of charter school applicants and information on the results of admissions lotteries from individual charter schools. Applicant lists were then matched to adminis-trative records covering all Massachusetts public school students. Our analysis sample is limited to charter appli-cants who were enrolled in a Boston Public School at the time they applied for a charter seat, and who applied for a charter school seat from fall 2002 through fall 2008. Additional information on applicant lotteries appears in the data appendix and especially Appendix Table A2.
We matched applicant records to administrative data using applicants’ names and year and grade of appli-cation.6 Among applicants eligible for our study, 95 percent were matched to state data.7 Applicants were excluded from the lottery analysis if they were disquali-fied from the lottery they entered (disqualified appli-cants mostly applied to the wrong grade). We also omit siblings of current charter students, late applicants, and some out-of-area applicants. In addition to providing demographic information and scores on state assess-ments, state administrative records include AP and SAT scores for all public school students tested in Massachusetts.
Information on college enrollment and college choice comes from the National Student Clearinghouse (NSC). The Massachusetts Department of Elementary and Secondary Education routinely requests an NSC match for Massachusetts’s high school graduates; we requested a supplemental match from the NSC for charter appli-cants in our lottery sample not covered by the state match. NSC data record enrollment spells at partici-pating postsecondary institutions, which account for 94 percent of Massachusetts undergraduates. Missing institutions mostly run small vocational and technical programs.
CHAPTER TWO
Data and Sample

10 U n d e r s t a n d i n g B o s t o n
Different types of outcomes generate different follow-up horizons, depending on when they occur. We define the relevant horizon based on each applicant cohort’s projected senior year of high school.8 The earliest information available on baseline (pre-application) characteristics is from the school year ending in the spring of 2002. Students projected to graduate from high school in the spring of 2006 therefore generate the earliest outcomes. Outcome-specific samples range over projected senior years as follows:
■ MCAS scores: These results are for students with projected graduation dates running from the spring of 2006 to the spring of 2013; the outcome here is the 10th grade MCAS. Some students retake 10th-grade MCAS tests in a later grade, a score we also see. MCAS scores are standardized to the state score distribution by grade, year, and subject.
■ AP and SAT scores: These results are for applicants with projected senior years from 2007-2012, includ-ing tests taken earlier than senior year. AP and SAT scores are analyzed in their original units (AP scores run from 1-5; SAT subject scores run from 200-800).
■ High school graduation: High school graduation data are for cohorts projected to finish in 2006-2011 (the most recent graduation year covered by state data is 2011).
■ College outcomes: These are for students with projected senior years running from 2006-2010 (the most recent cohort for which we have NSC data is the high school class of 2010).
Applicants who apply in more than one grade appear only once in our analysis, with data retained for the first application only. Baseline information for applicants for 9th grade charter entry comes from 8th grade; baseline information for applicants for 5th grade charter entry comes from 4th grade; baseline information for appli-cants for 6th grade charter entry comes from 4th grade for baseline test scores and 5th grade for demographic variables.
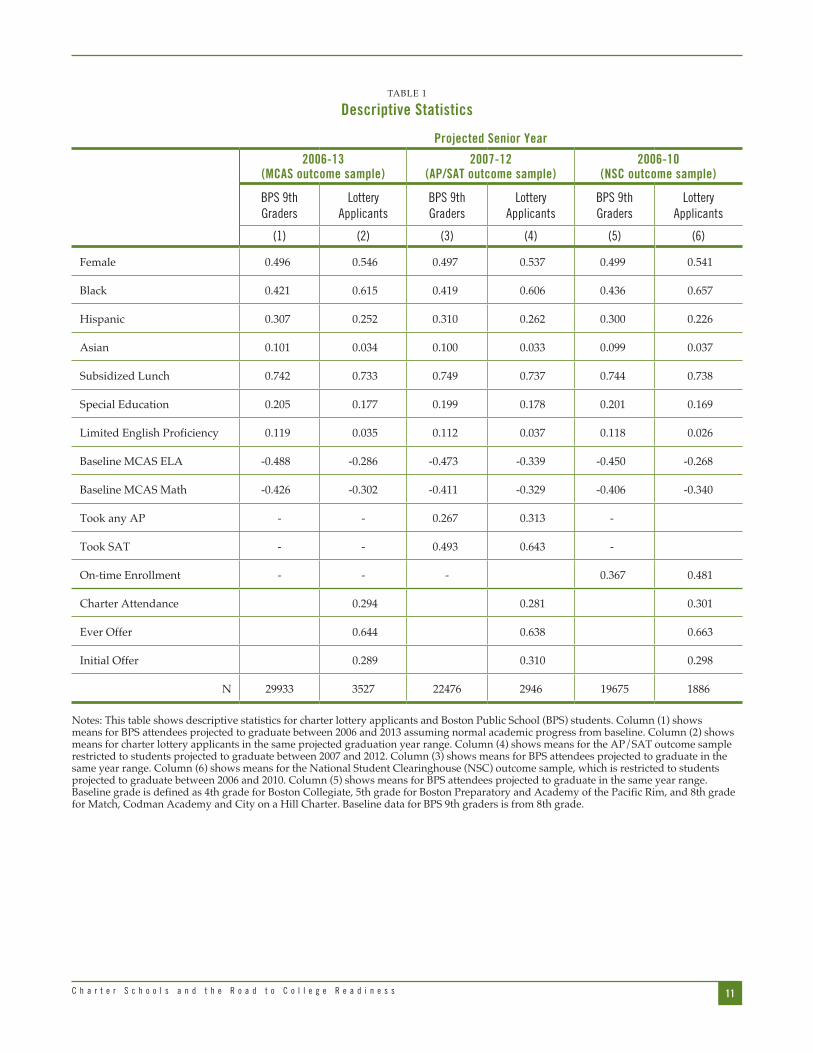
Table 1 compares charter applicants and the full sample of traditional BPS 9th graders. Applicants are dispropor-tionately Black, and have higher average baseline scores than the traditional BPS population. Limited-English Proficient students are under-represented among charter applicants, but the proportion of applicants identified as qualifying for special education services is almost as high among charter applicants as in the traditional BPS population.
11C h a r t e r S c h o o l s a n d t h e R o a d t o C o l l e g e R e a d i n e s s
TABLe 1
Descriptive Statistics
Projected Senior Year
2006-13 (MCAS outcome sample)
2007-12 (AP/SAT outcome sample)
2006-10 (NSC outcome sample)
BPS 9th Graders
Lottery Applicants
BPS 9th Graders
Lottery Applicants
BPS 9th Graders
Lottery Applicants
(1) (2) (3) (4) (5) (6)
Female 0.496 0.546 0.497 0.537 0.499 0.541
Black 0.421 0.615 0.419 0.606 0.436 0.657
Hispanic 0.307 0.252 0.310 0.262 0.300 0.226
Asian 0.101 0.034 0.100 0.033 0.099 0.037
Subsidized Lunch 0.742 0.733 0.749 0.737 0.744 0.738
Special education 0.205 0.177 0.199 0.178 0.201 0.169
Limited english Proficiency 0.119 0.035 0.112 0.037 0.118 0.026
Baseline MCAS eLA -0.488 -0.286 -0.473 -0.339 -0.450 -0.268
Baseline MCAS Math -0.426 -0.302 -0.411 -0.329 -0.406 -0.340
Took any AP - - 0.267 0.313 -
Took SAT - - 0.493 0.643 -
On-time enrollment - - - 0.367 0.481
Charter Attendance 0.294 0.281 0.301
ever Offer 0.644 0.638 0.663
Initial Offer 0.289 0.310 0.298
N 29933 3527 22476 2946 19675 1886
Notes: This table shows descriptive statistics for charter lottery applicants and Boston Public School (BPS) students. Column (1) shows means for BPS attendees projected to graduate between 2006 and 2013 assuming normal academic progress from baseline. Column (2) shows means for charter lottery applicants in the same projected graduation year range. Column (4) shows means for the AP/SAT outcome sample restricted to students projected to graduate between 2007 and 2012. Column (3) shows means for BPS attendees projected to graduate in the same year range. Column (6) shows means for the National Student Clearinghouse (NSC) outcome sample, which is restricted to students projected to graduate between 2006 and 2010. Column (5) shows means for BPS attendees projected to graduate in the same year range. Baseline grade is defined as 4th grade for Boston Collegiate, 5th grade for Boston Preparatory and Academy of the Pacific Rim, and 8th grade for Match, Codman Academy and City on a Hill Charter. Baseline data for BPS 9th graders is from 8th grade.


13C h a r t e r S c h o o l s a n d t h e R o a d t o C o l l e g e R e a d i n e s s
We estimate the effect of charter school attendance on high school graduation rates, measures of AP and SAT test-taking and scores, college enrollment and college type. As a benchmark, we also report results for 10th grade MCAS scores. The MCAS results are extended to cover two competency thresholds in Massachusetts, one for high school graduation and one for the state’s Adams Scholarship, a public university tuition waiver for public high school students.
Our lottery-based empirical strategy is motivated by the observation that charter attendance is a choice variable that may be correlated with students’ motivation, ability, or family background. This leads to selection bias. Suppose, for example, that parents who choose to send their children to a charter school are better informed or more educated than other parents. Their children may therefore be more likely to go to college even in a world without charter schools. In this scenario, we would have a positive bias in our estimate of the causal effect of charter attendance.
To eliminate selection bias, we use random offers of charter school seats to construct instrumental variables (IV) estimates. The idea behind IV is to compare out-comes between randomly selected lottery winners and losers, instead of comparing those who do and don’t choose to enroll at a charter school. We then adjust this comparison (known in econometrics as the reduced form), by dividing it by the win/loss difference in charter school attendance rates (known in econometrics as the first stage). Assuming, as seems likely, that any gaps revealed by the reduced form estimates of charter offers on outcomes are caused by the corresponding differences in charter enrollment, the ratio of reduced form to first stage estimates captures the causal effect of charter attendance. Because the comparisons here are based on random assignment, IV estimates are purged of the selection bias that may contaminate other sorts of comparisons and estimates.
To see how IV works, consider a stylized study of appli-cants to a single charter school, say Match high school. Suppose (hypothetically) that 200 applicants applied for
100 Match seats in the fall of 2006. As a consequence of over-subscription at Match, 100 applicants were offered seats randomly (again, hypothetically). The reduced form in this case is the difference, say, in the 10th grade MCAS math scores of the 100 applicants offered a seat and the 10th grade MCAS scores of the 100 applicants not offered a seat. This might be a number like .3σ; in other words, those offered a seat at Match score three-tenths of a standard deviation higher on the 10th grade math test than those not offered a seat. Because offers are randomly assigned, the reduced form is very likely to be a good measure of the causal effect of a charter offer.
We could stop with an analysis of charter offers if everyone offered a charter seat takes it and no charter seats are obtained otherwise. In practice, however, not everyone offered a seat takes the offer; some appli-cants offered a seat at Match ultimately choose to go elsewhere, perhaps attending a public school closer to where they live. At the same time, some of those not immediately offered a seat are offered one later, by virtue of the fact that they were placed on a waiting list or applied again the following year. Suppose that 80 percent of those offered a seat at Match take it, while 5 percent of those not offered a seat in this particular lottery nevertheless end up at Match eventually. The enrollment effect of an offer in Match’s 2006 lottery is therefore 0.8-0.05=0.75. Because offers are randomly as-signed, it seems fair to claim that the only reason those offered a seat at Match have higher scores is this 75 point difference in enrollment rates. The IV calculation therefore divides the reduced form effect of .3σ by the enrollment differential of .75. The resulting calculation produces
Effect of charter attendance = Reduced Form
= .3σ
= .4σFirst Stage .75
Thus, this calculation leads us to conclude that enroll-ment at Match boosts 10th grade math scores by four-tenths of a standard deviation.
CHAPTER THREE
Empirical Framework
14 U n d e r s t a n d i n g B o s t o n 15C h a r t e r S c h o o l s a n d t h e R o a d t o C o l l e g e R e a d i n e s s
First Stage Estimates and an MCAS Benchmark
An admissions offer in a charter lottery boosts charter enrollment in 9th or 10th grade by an average of 23 percentage points. This can be seen in the ever offer first stage estimates reported in Table 2. The columns labeled initial offer show that if the offer is made right away, the offer boosts charter enrollment by a further 14 points (we add the two first stage effects because the offer variables are defined so that everyone who receives an initial offer also has the ever offer variable switched on). The overall first stage effect of an offer is therefore close to 40 points for those who receive an offer on or immediately following lottery day.9
The relationship between lottery offers and charter enrollment—the size of the first stage estimates —is determined by the likelihood that an applicant chooses to accept an offer (some accepted applicants choose to attend a traditional public school, including one of Bos-ton’s pilot schools, or an exam school). Similarly, some students who receive no offer in the lotteries for which we have data receive one at a later date. As always, 2SLS estimation adjusts for slippage between offers and en-rollment in both directions, with the resulting estimates capturing causal effects for those who comply with (that is, enroll in a charter school in response to) the offers recorded in our data.
As a benchmark, Table 2 also reports 2SLS estimates similar to those reported in our earlier Boston study (Abdulkadiroglu et al., 2011), for 10th grade MCAS scores. Attendance at one of the charter high schools in our sample boosts 10th grade ELA scores by .4σ that is, four-tenths of a standard deviation, while raising math scores by more than half of a standard deviation.10
As noted above, the analysis here covers varying sets of cohorts, with less data available for an analysis of longer-term outcomes than for an analysis of MCAS scores. As a check on the representativeness of these subsamples, we also constructed 2SLS estimates of MCAS effects for the subsamples of applicants contrib-uting to our AP/SAT and college-going analyses below. Estimates of effects on 10th grade MCAS scores in the AP/SAT and college-going samples (not reported here) are similar to estimates for the full MCAS sample, sug-gesting that the short-run effects of charter attendance are similar for older and more recent cohorts.
Our empirical strategy is somewhat more involved than this stylized example suggests. The specific method used here, known as two-stage least squares (2SLS for short) is detailed in the technical appendix. Importantly, our 2SLS estimator makes use of two sources of variation in charter offers. Instead of a single variable indicating whether applicants were randomly offered a charter seat, we work with two such variables: the first, called the initial offer instrument, is a dummy variable indicat-ing offers made immediately following a charter school lottery. In addition, because some applicants who don’t receive offers on lottery day do so at a later date when their names are reached on a randomly ordered wait list, we also code a second instrument. The second instrument, called ever offer, indicates all applicants who eventually receive an offer, whether on lottery day or later. All applicants who initially receive an offer have both instruments switched on, while those who receive later offers without an initial offer have only the ever offer instrument switched on. Our lottery-based estima-tion strategy therefore makes use of two pairs of reduced form and first stage estimates. The ratio of each reduced form estimate to each first stage estimate provides an estimate of charter effects. Our 2SLS procedure combines these two estimates into a single more precise estimate of the average causal effects of charter attendance.
Lottery Balance
The lottery-based empirical strategy is predicated on the notion that random assignment in admissions lotteries balances both the observed and unobserved characteristics of those who are and are not randomly offered charter seats. Whether this is indeed true is unknowable for characteristics that we don’t get to see such as motivation, but it’s worth checking for balance in observed characteristics like race, special education status and baseline (pre-application) test scores. Con-sistent with the presumed random assignment used in charter school admissions lotteries, the demographic characteristics of those who were and were not offered a seat in a charter lottery indeed appear to be similar. This is documented in Appendix Table A3, which reports descriptive statistics for the full sample of matched ap-plicants, as well differences by offer status for the MCAS analysis sample. Columns (3) and (4) show that indi-vidual differences in mean characteristics by offer status are individually statistically insignificant; p-values for a joint test of balance are high.
TabLe 2
Lottery Estimates of Effects on 10th-Grade MCAS Scores
First Stage Outcome Mean[s.d.]
Charter Enrollment EffectEver Offer Initial Offer
Subject (1) (2) (3) (4)
Standardized eLa 0.230*** 0.140*** -0.289 0.397***
(0.042) (0.031) [0.825] (0.106)
N 3527
First-stage F 28.8
Standardized Math 0.232*** 0.140*** -0.237 0.545***
(0.041) (0.031) [0.900] (0.122)
N 3474
First-stage F 28.8
Notes: This table reports 2SLS estimates of the effects of boston charter attendance on 10th-grade MCaS test scores. The sample includes students projected to graduate between 2006 and 2013. The instrumented variable is charter attendance in 9th or 10th grade. The instruments are ever offer and initial offer dummies. Initial offer is equal to one when a student is offered a seat in any of the charter schools immediately following the lottery, while ever offer is equal to one for students offered seats at any time. Means and standard deviations in column (3) are for non-charter students. all 2SLS regressions control for risk sets, 10th grade calendar year dummies, race, sex, special education, limited english proficiency, subsidized lunch status, and a female by minority dummy. Standard errors (shown in parentheses) are clustered at the school-year level in 10th grade. The outcome mean and standard deviation in column 3 are for non-charter students.*significant at 10%; **significant at 5%; ***significant at 1%

15C h a r t e r S c h o o l s a n d t h e R o a d t o C o l l e g e R e a d i n e s s
TABLe 2
Lottery Estimates of Effects on 10th-Grade MCAS Scores
First Stage Outcome Mean[s.d.]
Charter Enrollment EffectEver Offer Initial Offer
Subject (1) (2) (3) (4)
Standardized eLA 0.230*** 0.140*** -0.289 0.397***
(0.042) (0.031) [0.825] (0.106)
N 3527
First-stage F 28.8
Standardized Math 0.232*** 0.140*** -0.237 0.545***
(0.041) (0.031) [0.900] (0.122)
N 3474
First-stage F 28.8
Notes: This table reports 2SLS estimates of the effects of Boston charter attendance on 10th-grade MCAS test scores. The sample includes students projected to graduate between 2006 and 2013. The instrumented variable is charter attendance in 9th or 10th grade. The instruments are ever offer and initial offer dummies. Initial offer is equal to one when a student is offered a seat in any of the charter schools immediately following the lottery, while ever offer is equal to one for students offered seats at any time. Means and standard deviations in column (3) are for non-charter students. All 2SLS regressions control for risk sets, 10th grade calendar year dummies, race, sex, special education, limited english proficiency, subsidized lunch status, and a female by minority dummy. Standard errors (shown in parentheses) are clustered at the school-year level in 10th grade. The outcome mean and standard deviation in column 3 are for non-charter students.*significant at 10%; **significant at 5%; ***significant at 1%


17C h a r t e r S c h o o l s a n d t h e R o a d t o C o l l e g e R e a d i n e s s
MCAS Thresholds Since 2003, high school graduation in Massachusetts has been determined in part by 10th grade MCAS scores. The initial state competency standard required students to pass the “Needs Improvement” threshold with a scaled score of 220 in both math and ELA; for the gradu-ating class of 2010, standards were increased to require a “Proficient” score of at least 240 in math, ELA, and science.11
Beginning with the high school class of 2005, the state has also used the MCAS to determine qualification for public university tuition waivers, an award known as the Adams Scholarship. Qualification for an Adams Scholarship requires MCAS scores in the “Advanced” category in either ELA or math, a score that is at least “Proficient” in subjects where the Advanced standard isn’t met and a total MCAS score in the upper quartile of the distribution of scores in a scholarship candidate’s home school district. Awardees receive tuition waivers at any Massachusetts public college or university.12
Charter school attendance has large effects on the likeli-hood that applicants meet graduation competency stan-dards and qualify for an Adams Scholarship. This can be seen in Table 3, which reports estimates separately by subject (indicating whether students met a subject specific standard or qualification) and overall. Charter attendance boosts the likelihood of meeting competency standards on a first try by 16 percentage points; this falls to 13 points when looking at whether applicants ever met competency standards. Competency gains are most dramatic for the likelihood of meeting the ELA standard. Consistent with these large gains in competency, charter attendance boosts the likelihood of qualifying for an Adams Scholarship by 18 points, a large and precisely estimated gain.13
Table 3 (pp 18-19) also suggests that charter schools shift the MCAS distribution into the upper two score categories. Specifically, the table documents large and statistically significant gains in the likelihood that char-ter applicants earn scores at a level deemed Proficient or
Advanced. The gains here remain substantial whether measured by first attempts or final scores, though only first-attempt scores are shifted out of the lowest into the second-lowest (Needs Improvement) range.
The nature of the charter-induced shift in the distribu-tion of MCAS scores emerges clearly in Figure 1. This
CHAPTER FOUR
College Preparation
FIguRe 1:
Distributions of MCAS Scaled Scores
0.005
0.010
0.015
0.020
0.025
0.030
0.035
0.040
200
220
240
.260 28
0
Scores
200
220
240
.260 28
0
Scores
Charter SchoolsTraditional Public Schools
0.005
0.010
0.015
0.020
0.025
0.030
Density
Density
First-attempt scaled grade 10 MCAS ELA score distribution
First-attempt scaled grade 10 MCAS Math score distribution
Notes: This figure plots smoothed MCAS scaled score distributions for charter lottery compliers in charter schools and traditional public schools. The Appendix describes methods for estimating complier distributions. The sample is restricted to lottery applicants projected to graduate between 2006 and 2013 assuming normal academic progress from baseline. Dotted vertical lines at scaled score 220 mark MCAS needs improvement thresholds, 240 for MCAS proficiency thresholds, and 260 for MCAS advanced thresholds.

18 U n d e r s t a n d i n g B o s t o n
TABLe 3
Lottery Estimates of Effects on MCAS Performance Categories
ELA
First Attempt Ever
Mean(1)
Enrollment Effect(2)
Mean(3)
Enrollment Effect(4)
Panel A: Consequential Score Outcomes
Meets Competency Standardsfor High School graduation
0.814 0.162*** 0.831 0.148***
(0.053) (0.053)
Panel B: MCAS Categories
Needs Improvement or Higher0.965 -0.009 0.990 -0.004
(0.024) (0.011)
Proficient or Higher 0.656 0.167*** 0.658 0.162***
(0.062) (0.062)
Advanced or Higher 0.083 0.188*** 0.083 0.188***
(0.036) (0.036)
N 3523
MATH
Panel A: Consequential Score Outcomes
Meets Competency Standardsfor High School graduation
0.760 0.112* 0.803 0.082
(0.059) (0.058)
Panel B: MCAS Categories
Needs Improvement or Higher0.915 0.081** 0.978 0.029*
(0.034) (0.015)
Proficient or Higher 0.641 0.153** 0.645 0.132**
(0.066) (0.067)
Advanced or Higher 0.314 0.260*** 0.314 0.260***
(0.062) (0.062)
N 3471

19C h a r t e r S c h o o l s a n d t h e R o a d t o C o l l e g e R e a d i n e s s
The x-axis in Figure 1 marks MCAS score category cutoffs; these occur at 20 point intervals. Charter school attendance clearly pushes the first-attempt score distri-bution to the right, into the upper three score groups. The effect of charter attendance on ELA scores is most striking: very few non-charter students achieve at an Advanced level, while the distribution for those who enroll in a charter school has substantial numbers of compliers in the Advanced group. Formal statisti-cal tests of distributional equality (not reported here) confirm that the distributional shifts documented in this figure are very unlikely to be merely a chance finding.
figure plots estimated score distributions for a subsam-ples of applicants identified as being responsive to the offer of a charter seat. This group, known in econometric terminology as the group of compliers, is defined as the set of applicants who take a charter seat when offered one in a lottery, but enroll in a traditional public school otherwise. We plot distributions for compliers because, as with our 2SLS estimates, comparisons of distribu-tions for compliers are purged of the selection bias that contaminates comparisons between those who do and don’t enroll in a charter school.14
Combined
First Attempt Ever
Mean(1)
Enrollment Effect(2)
Mean(3)
Enrollment Effect(4)
Panel A: Consequential Score Outcomes
Meets Competency Standardsfor High School graduation
0.697 0.161** 0.744 0.132*
(0.067) (0.068)
eligible for Adams Scholarship 0.151 0.183***
(0.062)
Panel B: MCAS Categories
Needs Improvement or Higher0.904 0.081** 0.976 0.022
(0.036) (0.016)
Proficient or Higher 0.538 0.157** 0.540 0.152**
(0.073) (0.075)
Advanced or Higher 0.068 0.167*** 0.068 0.167***
(0.035) (0.035)
N 3523
Lottery Estimates of Effects on MCAS Performance Categories continued
Notes: This table reports 2SLS estimates of the effects of Boston charter attendance on MCAS requirements for high school graduation, qualification for an Adams Scholarship, and attainment of MCAS score categories. The Competency Determination requires scores of 220 in eLA and math for the classes of 2006-2009, and scores of 240 for the classes of 2010-2013. A student is eligible for the Adams Scholarship if he is proficient on both tests, advanced in either subject, and scores among the top 25% of the Boston district on his first attempt. A student “needs improvement” if he scores at or above 220 on both tests; “is proficient” if he scores at or above 240 on both tests; “is advanced” if he scores at or above 260 on both tests. See Table 2 notes for additional details.*significant at 10%; **significant at 5%; ***significant at 1%
20 U n d e r s t a n d i n g B o s t o n
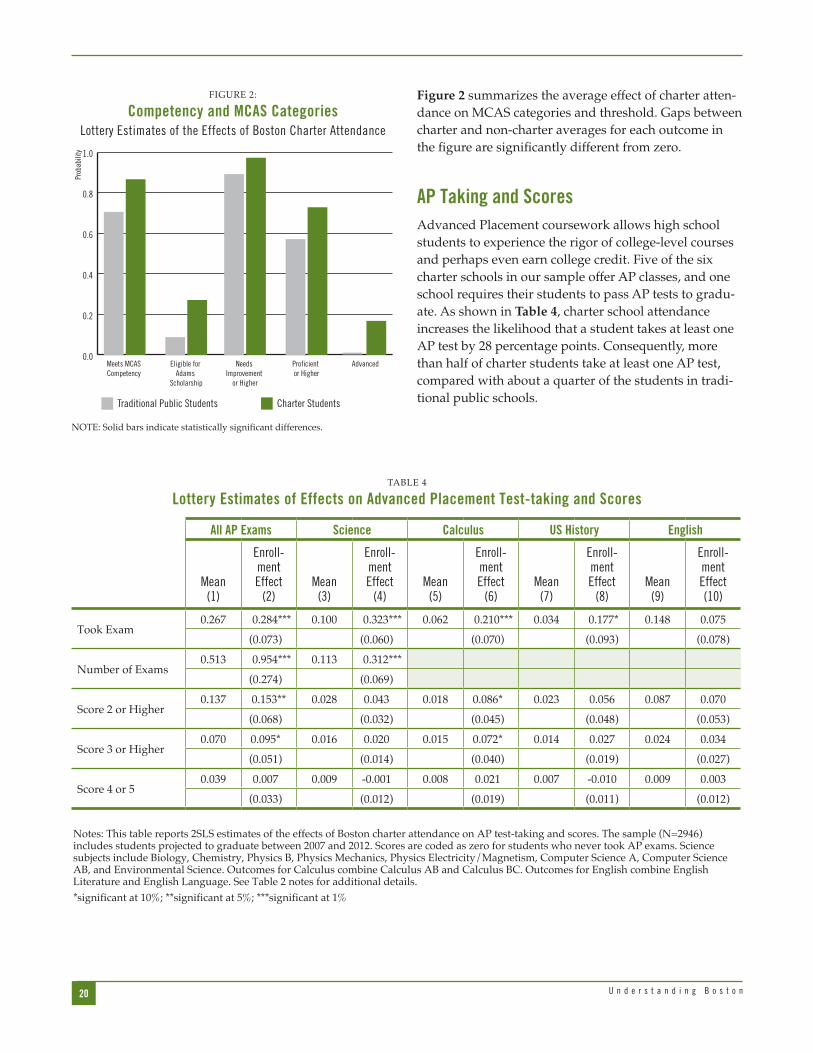
Figure 2 summarizes the average effect of charter atten-dance on MCAS categories and threshold. Gaps between charter and non-charter averages for each outcome in the figure are significantly different from zero.
AP Taking and ScoresAdvanced Placement coursework allows high school students to experience the rigor of college-level courses and perhaps even earn college credit. Five of the six charter schools in our sample offer AP classes, and one school requires their students to pass AP tests to gradu-ate. As shown in Table 4, charter school attendance increases the likelihood that a student takes at least one AP test by 28 percentage points. Consequently, more than half of charter students take at least one AP test, compared with about a quarter of the students in tradi-tional public schools.
0.0
0.2
0.4
0.6
0.8
1.0
Charter StudentsTraditional Public Students
AdvancedProficient or Higher
Needs Improvement
or Higher
Eligible for Adams
Scholarship
Meets MCAS Competency
Prob
abili
ty
FIguRe 2:
Competency and MCAS CategoriesLottery Estimates of the Effects of Boston Charter Attendance
NOTe: Solid bars indicate statistically significant differences.
TABLe 4
Lottery Estimates of Effects on Advanced Placement Test-taking and Scores
All AP Exams Science Calculus US History English
Mean(1)
Enroll-ment Effect
(2)Mean
(3)
Enroll-ment Effect
(4)Mean
(5)
Enroll-ment Effect
(6)Mean
(7)
Enroll-ment Effect
(8)Mean
(9)
Enroll-ment Effect(10)
Took exam0.267 0.284*** 0.100 0.323*** 0.062 0.210*** 0.034 0.177* 0.148 0.075
(0.073) (0.060) (0.070) (0.093) (0.078)
Number of exams0.513 0.954*** 0.113 0.312***
(0.274) (0.069)
Score 2 or Higher0.137 0.153** 0.028 0.043 0.018 0.086* 0.023 0.056 0.087 0.070
(0.068) (0.032) (0.045) (0.048) (0.053)
Score 3 or Higher0.070 0.095* 0.016 0.020 0.015 0.072* 0.014 0.027 0.024 0.034
(0.051) (0.014) (0.040) (0.019) (0.027)
Score 4 or 5 0.039 0.007 0.009 -0.001 0.008 0.021 0.007 -0.010 0.009 0.003
(0.033) (0.012) (0.019) (0.011) (0.012)
Notes: This table reports 2SLS estimates of the effects of Boston charter attendance on AP test-taking and scores. The sample (N=2946) includes students projected to graduate between 2007 and 2012. Scores are coded as zero for students who never took AP exams. Science subjects include Biology, Chemistry, Physics B, Physics Mechanics, Physics electricity/Magnetism, Computer Science A, Computer Science AB, and environmental Science. Outcomes for Calculus combine Calculus AB and Calculus BC. Outcomes for english combine english Literature and english Language. See Table 2 notes for additional details.*significant at 10%; **significant at 5%; ***significant at 1%
21C h a r t e r S c h o o l s a n d t h e R o a d t o C o l l e g e R e a d i n e s s
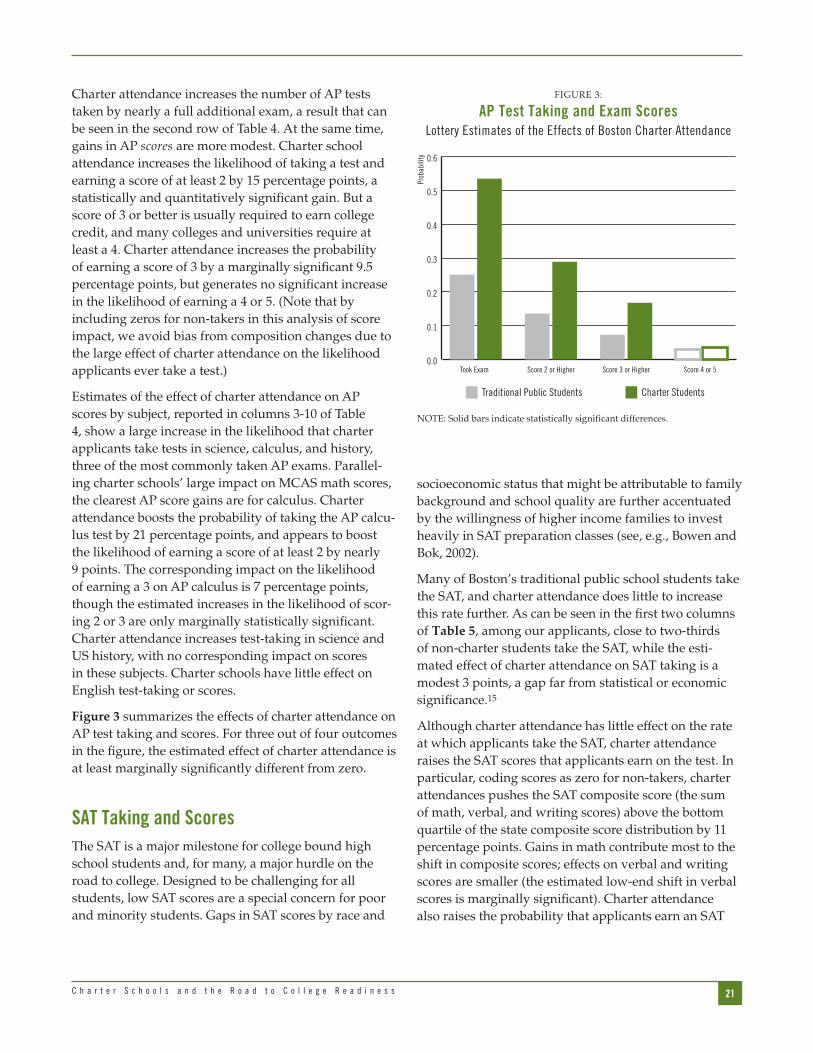
Charter attendance increases the number of AP tests taken by nearly a full additional exam, a result that can be seen in the second row of Table 4. At the same time, gains in AP scores are more modest. Charter school attendance increases the likelihood of taking a test and earning a score of at least 2 by 15 percentage points, a statistically and quantitatively significant gain. But a score of 3 or better is usually required to earn college credit, and many colleges and universities require at least a 4. Charter attendance increases the probability of earning a score of 3 by a marginally significant 9.5 percentage points, but generates no significant increase in the likelihood of earning a 4 or 5. (Note that by including zeros for non-takers in this analysis of score impact, we avoid bias from composition changes due to the large effect of charter attendance on the likelihood applicants ever take a test.)
Estimates of the effect of charter attendance on AP scores by subject, reported in columns 3-10 of Table 4, show a large increase in the likelihood that charter applicants take tests in science, calculus, and history, three of the most commonly taken AP exams. Parallel-ing charter schools’ large impact on MCAS math scores, the clearest AP score gains are for calculus. Charter attendance boosts the probability of taking the AP calcu-lus test by 21 percentage points, and appears to boost the likelihood of earning a score of at least 2 by nearly 9 points. The corresponding impact on the likelihood of earning a 3 on AP calculus is 7 percentage points, though the estimated increases in the likelihood of scor-ing 2 or 3 are only marginally statistically significant. Charter attendance increases test-taking in science and US history, with no corresponding impact on scores in these subjects. Charter schools have little effect on English test-taking or scores.
Figure 3 summarizes the effects of charter attendance on AP test taking and scores. For three out of four outcomes in the figure, the estimated effect of charter attendance is at least marginally significantly different from zero.
SAT Taking and ScoresThe SAT is a major milestone for college bound high school students and, for many, a major hurdle on the road to college. Designed to be challenging for all students, low SAT scores are a special concern for poor and minority students. Gaps in SAT scores by race and
Figure 3:
AP Test Taking and Exam ScoresLottery Estimates of the Effects of Boston Charter Attendance
NOTe: Solid bars indicate statistically significant differences.
0.0
0.1
0.2
0.3
0.4
0.5
0.6
Score 4 or 5Score 3 or HigherScore 2 or HigherTook Exam
Charter StudentsTraditional Public Students
Prob
abili
tySolid bars indicate statistically significant differences.
socioeconomic status that might be attributable to family background and school quality are further accentuated by the willingness of higher income families to invest heavily in SAT preparation classes (see, e.g., Bowen and Bok, 2002).
Many of Boston’s traditional public school students take the SAT, and charter attendance does little to increase this rate further. As can be seen in the first two columns of Table 5, among our applicants, close to two-thirds of non-charter students take the SAT, while the esti-mated effect of charter attendance on SAT taking is a modest 3 points, a gap far from statistical or economic significance.15
Although charter attendance has little effect on the rate at which applicants take the SAT, charter attendance raises the SAT scores that applicants earn on the test. In particular, coding scores as zero for non-takers, charter attendances pushes the SAT composite score (the sum of math, verbal, and writing scores) above the bottom quartile of the state composite score distribution by 11 percentage points. Gains in math contribute most to the shift in composite scores; effects on verbal and writing scores are smaller (the estimated low-end shift in verbal scores is marginally significant). Charter attendance also raises the probability that applicants earn an SAT

22 U n d e r s t a n d i n g B o s t o n
TABLe 5
Lottery Estimates of Effects on SAT Test-taking and Scores
Taking Reasoning (1600) Composite (2400)
Mean[s.d.](1)
Enrollment Effect(2)
Mean[s.d.](3)
Enrollment Effect(4)
Mean[s.d.](5)
Enrollment Effect(6)
Took SAT0.636 0.028
[0.481] (0.078)
Score Above MA Bottom Quartile
0.254 0.133** 0.254 0.115*
[0.436] (0.066) [0.436] (0.067)
Score Above MA Median
0.093 0.112** 0.083 0.099**
[0.290] (0.049) [0.275] (0.040)
Score In MA Top Quartile
0.026 0.000 0.019 -0.010
[0.160] (0.016) [0.138] (0.017)
N 2946
Average Score (For takers)
846.8 74.0** 1254.7 100.7**
[166.5] (29.1) [240.0] (43.0)
N 1895
Math (800) Verbal(800) Writing (800)
Mean[s.d.](1)
Enrollment Effect (2)
Mean[s.d.](3)
Enrollment Effect(4)
Mean[s.d.](5)
Enrollment Effect(6)
Score Above MA Bottom Quartile
0.301 0.162** 0.264 0.120** 0.279 0.106
[0.459] (0.080) [0.441] (0.060) [0.449] (0.067)
Score Above MA Median
0.117 0.143** 0.102 0.063 0.096 0.053
[0.321] (0.057) [0.303] (0.046) [0.295] (0.041)
Score In MA Top Quartile
0.033 0.046 0.025 -0.019 0.083 0.099**
[0.178] (0.028) [0.158] (0.021) [0.275] (0.040)
N 2946
Average Score (For takers)
434.3 51.1*** 412.5 22.8 408.0 26.7*
[95.5] (17.0) [87.3] (15.7) [86.7] (16.2)
N 1895
Notes: This table reports 2SLS estimates of the effects of Boston charter attendance on SAT test-taking and scores. The sample includes students projected to graduate between 2007 and 2012. Outcomes are based on the most recent score available. Means and standard deviations are for non-charter students. All other outcomes are equal to zero for non-SAT takers. Column headings show the maximum score for each subject or composite. uS average and standard deviations for 2012 are 512 (117) for math; 496 (114) for verbal; 488 (114) for writing; 1010 (214) for reasoning; 1498 (316) for composite. See Table 2 notes for additional details.*significant at 10%; **significant at 5%; ***significant at 1%

23C h a r t e r S c h o o l s a n d t h e R o a d t o C o l l e g e R e a d i n e s s
MCAS math effect reported in Table 2, suggesting that the math skills demonstrated on the MCAS carry over to the SAT. Although charter attendance has smaller effects on verbal and writing scores, the composite SAT score gain is estimated to be a little over 100 points, a large and statistically significant result. The gain here amounts to almost one-third of a standard deviation in the US composite score distribution. The correspond-ing effect on the SAT reasoning score is 74 points, also a large gain.
The effect of charter attendance on the SAT score distri-bution is summarized in Figure 4, which plots the distri-bution of SAT scores for treated and untreated charter lottery compliers (as in Figure 1, the set of compliers consists of applicants who respond to the offer of a char-
reasoning score (the sum of math and verbal) above the state median by 13 percentage points, with math again the largest contributor to this gain.
Table 5 also reports estimates of charter enrollment effects on SAT scores, estimated in samples limited to those who take the test. Because charter attendance has little effect on the decision to take the SAT, such conditional comparisons are unlikely to be biased by compositional shifts. The conditional results show that Boston’s charters have large, statistically significant effects on SAT scores, especially in math. Specifically, charter attendance boosts average math scores by 51 points, a gain that amounts to more than four-tenths of a standard deviation in the US score distribution.16 This is almost as large (in standard deviation units) as the
0.0000
0.0005
0.0010
0.0015
0.0020
600
800
1000
1200
1400
1600
1800
2000
2200
2400
Scores
0.001
0.002
0.003
0.004
0.005
200
300
400
500
600
700
800
Scores
Charter SchoolsTraditional Public Schools
0.0005
0.0010
0.0015
0.0020
0.0025
0.0030
0.0035
0.0040
200
300
400
500
600
700
800
Scores
0.0005
0.0010
0.0015
0.0020
0.0025
0.0030
0.0035
0.0040
200
300
400
500
600
700
800
Scores
Density Density
Density Density
FIguRe 4
Distributions of SAT Scores
Composite SAT score distribution
SAT Writing score distribution
Notes: This figure plots smoothed SAT score distributions for charter lottery compliers in charter schools and traditional public schools. The Appendix describes methods for estimating complier distributions. The sample is restricted to lottery applicants projected to graduate between 2007 and 2012.
SAT Reading score distribution
SAT Math score distribution

24 U n d e r s t a n d i n g B o s t o n
ter seat by enrolling; comparisons for this group have a causal interpretation). Charter school attendance causes a pronounced rightward shift in score distributions for all three SAT subjects, as well as in the distribution of composite scores. Formal statistical tests of distribu-tional equality (not reported here) suggest these shifts are very unlikely to be a chance finding. On balance, therefore, Boston charters produce impressive gains on the SAT as well as the MCAS.
High School GraduationAs we saw in Table 3, charter attendance increases the likelihood that charter applicants meet the MCAS-based standard for a high school diploma and qualify for an Adams Scholarship at the University of Massachusetts. Does charter attendance also increase high school graduation rates? Perhaps surprisingly, the estimates in Table 6 suggest not, or at least, not be enough for a statistically significant result.
The estimated effect of charter attendance on the likelihood a student graduates high school on time is a statistically insignificant (negative) effect of about -.11.17 On the other hand, looking instead at whether applicants graduate within two years of their on-time graduation date (on time graduation dates assume no grade repetition), charter attendance seems to produce an increase of four percentage points. The estimated increase in graduation rates omitting transfers and deceased students (and thereby following the official state definition of high school graduation rates) is about .10, though here too the estimates are not significantly different from zero.
The estimated effects of charter attendance on grade repetition (including partial grade repetition), also reported in Table 6, provide a possible explanation for why the gains in high school competency documented in Table 3 fail to generate clear and statistically signifi-cant increases in high school graduation rates. Charter schools appear to be more likely than traditional public schools to hold their students back or to cause them to repeat a grade. Interestingly, although grade reten-tion effects are small (and, here too, not significantly different from zero), adding repetition effects to the within-two graduation effect comes close to accounting for the change in competency rates induced by charter attendance.

25C h a r t e r S c h o o l s a n d t h e R o a d t o C o l l e g e R e a d i n e s s
TABLe 6
Lottery Estimates of Effects on High School Graduation and Grade Repetition
Excl. Transferred and Deceased
Mean(1)
Enrollment Effect(2)
Mean(3)
Enrollment Effect(4)
Graduation Outcomes
graduate On-time0.685 -0.107 0.726 -0.089
(0.067) (0.071)
N 2597 2444
graduate Within Two0.787 0.043 0.828 0.099
(0.073) (0.074)
Repeat grade for at least one semester0.203 0.078 0.193 0.068
(0.074) (0.075)
Repeat at least one entire grade, or repeat more than one grade
0.142 0.060 0.141 0.057
(0.061) (0.063)
N 1886 1777
Notes: This table reports 2SLS estimates of the effects of Boston charter attendance on high school graduation, grade repetition and scheduled test-taking. On-time graduation is equal to one if a student graduates before or in the year of his projected graduation year. The sample for on-time graduation includes students projected to graduate between 2006 and 2011. graduate within two is equal to one if a student graduates by the year following projected graduation year. grade repetition outcomes are defined in two ways: is equal to one if a student repeats a grade for at least one semester of any grade; repeats entire grade at least once or repeating more than one grade. The sample for graduate within two and grade repetition includes students projected to graduate by Spring 2011. Columns (3) and (4) remove transferred or deceased applicants. See Table 2 notes for additional details.*significant at 10%; **significant at 5%; ***significant at 1%


27C h a r t e r S c h o o l s a n d t h e R o a d t o C o l l e g e R e a d i n e s s
Boston’s charter high schools appear to boost their stu-dents’ SAT scores, AP calculus scores and AP participa-tion rates, and the likelihood that students meet gradu-ation standards and qualify for an Adams scholarship. These results suggest charters improve their students’ preparation for college. We turn here to the effects of charter attendance on the likelihood that students go to college and the type of college they attend. The college sample is necessarily smaller than the sample used to analyze effects on earlier milestones, and the findings therefore less precise and more preliminary in nature.
To allow for the fact that charter schools may increase grade repetition, thereby delaying college applications, the college analysis looks at two sets of outcomes. The first set, with results reported in the first two columns of Table 7, measures outcomes assuming students graduate high school on time, that is, assuming no grade repetition. The second set, reported in columns 3-4 of the table, look at outcomes in a longer window, allowing for delayed college enrollment of up to two years. A consequence of stretching the follow-up period in this manner is a further reduction in sample size.
The estimates in column 2 of Table 7 suggest charter at-tendance increases college enrollment by about six per-centage points in the on time sample, an estimate that rises to 13 points in the within-two sample. Although substantial, neither estimate is statistically significantly different from zero; in other words, we can’t rule out the possibility that these might be chance findings. The relative lack of precision here is a natural consequence of the fact that only about half of our charter applicants are old enough to have reached college enrollment milestones. Given the currently available sample size, college enrollment effects would have to be very large indeed (on the order of 25-30 points) for us expect a statistically significant finding. In ongoing work, we’re continuing to collect charter applicant data and plan to update published results accordingly.
Table 7 also reports results for enrollment in differ-ent sorts of post-secondary institutions. Charter school attendance shifts many students toward four-year institutions. In the on-time enrollment sample, charter attendance reduces the likelihood that a student at-tends a two-year school by 10 percentage points while increasing the probability of four-year enrollment by 16 percentage points. In the within-two sample, the four year enrollment gain is 23 percentage points.
The estimates likewise show a large shift toward four year public colleges and universities, with an estimated gain of 19 percentage points in the on-time sample and 37 percentage points in the within-two sample. The gain here is partly due to the shift toward four-year from two-year schools, while also (to a lesser extent) reflect-ing a shift out of private schools in the within-two sam-ple. Both the four-year shift and the shift toward public institutions are large enough to be significantly different from zero. The estimated decline in private enrollment in the within two sample is about 14 points, a decline that falls short of statistical significance, but nevertheless contributes to the public enrollment increase.
The last row of Panel A in Table 7 shows that much of the increase in four-year public enrollment occurs at Massachusetts public schools. This may be driven by the Adams Scholarship, which induces students to attend Massachusetts public universities; earlier, we noted that Boston charters significantly boost the probability that students qualify for this scholarship. Consistent with these results, the institution with the largest enrollment of former charter students in our sample is the Univer-sity of Massachusetts at Boston.
Panel B of Table 7 reports college enrollment effects by selectivity tier, as defined by the Barron’s ranking system. In the within-two sample, we see that charters increase enrollment at schools in the second-to-least selective Barron’s tier (“competitive” colleges). These results provide weak evidence toward moderately more selective institutions. Specifically, charter attendance appears to increase the likelihood that students
CHAPTER FIVE
College Enrollment and College Choice

28 U n d e r s t a n d i n g B o s t o n
TABLe 7
Lottery Estimates of Effects on College Enrollment
Enrolled On-time Enrolled Within Two
Mean(1)
Enrollment Effect(2)
Mean(3)
Enrollment Effect(4)
Panel A: Attendance at Any NSC-Covered School
Any0.491 0.059 0.607 0.131
(0.083) (0.120)
Two-year0.121 -0.104* 0.198 -0.095
(0.055) (0.093)
Four-year0.370 0.163** 0.409 0.225**
(0.079) (0.110)
Four-year Public0.135 0.185*** 0.129 0.367***
(0.068) (0.113)
Four-year Private0.235 -0.022 0.279 -0.142
(0.086) (0.151)
Four-year Public In MA0.114 0.140** 0.105 0.284***
(0.061) (0.100)
Panel B: Attendance at Barron’s-Ranked Schools
Lowest Selectivity Tier Only0.208 -0.009 0.305 -0.043
(0.063) (0.103)
Second Lowest Selectivity Tier Only0.193 0.052 0.188 0.183*
(0.070) (0.098)
Top Three Selectivity Tiers0.090 0.016 0.114 -0.009
(0.047) (0.080)
N 1886 1382
Notes: This table reports 2SLS estimates of the effects of Boston charter school attendance on college enrollment. On-time enrollment is defined as enrolling by the semester after projected high school graduation, while enrollment within two years is defined as enrolling within two fall semesters after projected high school graduation. The on-time enrollment sample includes students projected to graduate in 2010 or earlier. The within-two sample is restricted to students projected to graduate in 2009 or earlier, so that within-two enrollment can be observed. See Table 2 notes for additional details.*significant at 10%; **significant at 5%; ***significant at 1%

29C h a r t e r S c h o o l s a n d t h e R o a d t o C o l l e g e R e a d i n e s s
ultimately enroll in schools ranked in Barron’s second selectivity tier. This finding weighs against concerns that the shift toward public institutions comes at the expense of college selectivity.18
Figure 5 summarizes the effects of charter attendance on college attendance and institution type in the within-two sample. Significant results in the figure are for four-year enrollment variables only.
FIguRe 5
College Enrollment Within Two Years of Expected High School Graduation
Lottery Estimates of the Effects of Boston Charter Attendance
NOTe: Solid bars indicate statistically significant differences.
0.0
0.1
0.2
0.3
0.4
0.5
0.6
0.7
0.8
4-Year College2-Year CollegeAny College
Charter StudentsTraditional Public StudentsEn
rollm
ent P
roba
blili
ty


31C h a r t e r S c h o o l s a n d t h e R o a d t o C o l l e g e R e a d i n e s s
The Peer Channel Charter schools are sometimes said to generate gains by the selective retention of higher performing students (see, for example, Skinner (2009)). In other words, char-ters are said to kick out trouble-makers and stragglers, leaving a student population that’s easier to teach. Importantly, the causal interpretation of our lottery-based estimation strategy is unaffected by selective retention because we follow all winners and losers, regardless of whether they stay in charter. Moreover, the charter enrollment variable is “switched on” even for students who spend only a single day enrolled in a char-ter school. Thus, outcomes for poor performing charter students who leave the school still “count” on the char-ter side of our IV estimation strategy.
At the same time, selective retention by charter schools, if substantial, may lead to a favorable population mix that generates positive peer effects on students who remain enrolled in charters. In other words, charter schools may do well for most of their students in part because a few bad apples who would otherwise be disruptive to all, or slow the class down, are encour-aged to leave. While not invalidating the evidence of gains reported here, this peer channel has different policy implications than other explanations for charter effectiveness, such as differences in teacher training or effectiveness.
We explore the peer channel by looking directly at school switching and peer composition. School switch-ing is defined as being observed in two or more schools after a lottery application. Boston’s high school popu-lation is highly mobile: more than one-third of our applicant sample changes schools by this measure. It’s of interest to know whether the switching rate is higher for charter students than others. Peer composition is measured as the average baseline scores of grade-mates at the start of 9th and 10th grade. Because charter appli-cants are positively selected (i.e., have higher baseline scores than other BPS students, on average), we expect to see some effect of charter enrollment on peer compo-
sition (recall that charter enrollment is defined here using data from 9th grade). The evolution of peer compo-sition effects from 9th to 10th grades tells us how charter schools change the post-enrollment peer mix.
Table 8 shows that Charter enrollment raises the likeli-hood of school switching by about 12 percentage points, though this change is not significantly different from zero. As can be seen in column 2 of the table, however, the switching effect increases further to .143, a margin-ally significant finding, when switching is defined to omit natural transitional grades such as 6-to-7 (some charters have an unusual grade structure, a fact that might increase transition rates).
Might this evidence of differential switching account for the charter school gains reported here? Panel B assesses the explanatory power of the peer channel by showing the effect of charter enrollment on realized peer quality in 9th and 10th grade. Not surprisingly given the posi-tive selection of charter applicants, charter enrollment is associated with sharp gains in peer achievement in 9th grade: the effect here is close to two-tenths of a standard deviation and significantly different from zero. The peer effect would be even larger if not for the fact, docu-mented in the last row of Panel A, that charter enroll-ment reduces exam school enrollment. In other words, a likely alternative for many charter students is an exam school, which also has positively selected peers.
Importantly, the effect of charter enrollment on peer quality falls for 10th grade peers, compared with the effect of charter enrollment on 9th grade peers. This is apparent in the estimated peer effect of .1 in 10th grade peer, reported in column 4 of Table 8. In other words, the effect of charter attendance on student peer characteris-tics in 10th grade, presumably determined after the exit of “bad apples,” is, in practice, less favorable than the effect on initial peer mix. This finding weighs against the notion that charter schools act to retain good peers, though clearly charter enrollment improves average peer composition initially.19
CHAPTER SIX
Additional Results

32 U n d e r s t a n d i n g B o s t o n
TABLe 8
Estimates of Effects on School Switching and Realized Peer Quality
Mean(1)
Enrollment Effect(2)
Mean(3)
Enrollment Effect(4)
Panel A: School Switching
Any Switch to observed schools0.358 0.116
(0.085)
N 3074
Switch to observed schools omitting transitional grades
0.329 0.143*
(0.081)
N 3064
ever attend an exam school0.145 -0.099**
(0.042)
N 3194
Panel B: Peer Quality in 9th Grade and 10th Grade
Grade 9 Grade 10
Peer Baseline eLA -0.382 0.177*** -0.355 0.103
(0.065) (0.066)
N 3664 3730
Peer Baseline Math -0.378 0.164** -0.341 0.112
(0.071) (0.070)
N 3672 3742
Peer Baseline Sum of eLA and Math-0.745 0.318** -0.680 0.205
(0.132) (0.132)
N 3663 3727
Notes: This table reports 2SLS estimates of the effects of Boston charter attendance on school switching and realized peer quality. School-switching estimates are based on the sample of applicants projected to graduate between 2006 and 2012, and realized peer quality estimates are based on the MCAS outcome sample. A student switches if he is observed to be in two or more schools in any grades after lottery application. exam school attendance is equal to one if a student is observed attending an exam school any time after the lottery and zero otherwise. Peer quality is measured as the average baseline scores of other students in the same school and year. See Table 2 notes for additional details.*significant at 10%; **significant at 5%; ***significant at 1%
33C h a r t e r S c h o o l s a n d t h e R o a d t o C o l l e g e R e a d i n e s s
Effects on Special Education StudentsOne of the most important issues in the debate over school reform is whether students with special needs are well-served by schools of different types. Because char-ter seats are randomly assigned to applicants at over-subscribed schools, special education and LEP students are just as likely to be offered seats as are other appli-cants in our sample. Demographic differences in charter enrollment are therefore driven primarily by differences among applicants. There are too few LEP students in our applicant sample for a separate investigation of charter effects in this subpopulation to be fruitful, but special education students apply to charters at almost the same rate as other students in the district. We therefore explore the consequences of charter enrollment for the subsample of almost 20 percent of applicants identified as qualifying for special education services.20
The analysis here groups students by baseline special education status, that is, special education status as recorded in state administrative data in the same year that our baseline test scores were generated, before char-ter enrollment. We use a baseline definition of special education status out of a concern that charter schools might choose to reclassify students in one way or another. As it turns out, however, this concern is largely unfounded: the effect of charter enrollment on special education status is small and not significantly different from zero (see appendix Table A5 for details).
Estimated effects of charter enrollment by special educa-tion status show achievement gains at least as large for special education students as for others, as can be seen in Panel A of Table 9. Indeed, the overall effect of charter attendance on the likelihood of meeting compe-tency standards is almost entirely is due to the gains in the special education group. Gains in competency rates among special education students are an impressive 52 percentage points, in comparison with an insignificant gain of about 9 points in competency rates among other students. Charter attendance also increases Adams Scholarship attainment in the special education group, though here the gains are more modest than for others. This is not surprising since most special education students are much farther from Adams qualification to start with.
Differences in the impact of charter enrollment by special education status are less clear for AP tests than for MCAS outcomes. Panel B of Table 9 suggests char-
ter enrollment affects AP taking similarly in the two subsamples, though with a larger gain in calculus taking in the non-special-education group. Calculus score effects are also large for non-special education students, though not large enough for differences in score effects by special education status to be statistically meaning-ful. Interestingly, however, Panel C shows markedly larger SAT score gains among special education students than for other applicants.
Special education students are significantly less likely to graduate high school on time than are other students, as can be seen in the mean graduation rates reported in columns 1 and 3 of Panel D. Charter attendance seems to hold some special education students back, reduc-ing on time graduation rates in the special education subsample. The charter effect on within two graduation rates for special education students, however, is not significantly different from zero.
The sample of special education students available for a college-going analysis is small, so the resulting estimates are necessarily imprecise. As can be seen in Panel E of Table 9, however, the estimated enrollment effects at schools of all types are much larger in the special educa-tion subsample than for other students. These results are imprecise and should be seen as preliminary and suggestive; we’ll expand the analysis here as more data become available. Even now, however, findings in other areas seem reasonably conclusive: charter attendance increases the rate at which special education students meet state competency standards markedly, and appears to generate increased human capital for special educa-tion students, as evidenced by especially large gains in MCAS and SAT scores.

34 U n d e r s t a n d i n g B o s t o n
TABLe 9
Estimates of Effects by Baseline Special Education Classifications
Non Special Education Special Education
Mean(1)
Enrollment Effect(2)
Mean(3)
Enrollment Effect(4)
Panel A: 10th- Grade MCAS
Standardized eLA-0.144 0.349*** -1.007 0.572**
(0.110) (0.262)
Standardized Math-0.106 0.522*** -0.896 0.679***
(0.131) (0.245)
Meets Competency Standard (First Attempt)0.763 0.089 0.363 0.510***
(0.072) (0.131)
Adams Scholarship eligibility0.174 0.198*** 0.035 0.094*
(0.074) (0.052)
N 2850 598
Panel B: AP Outcomes
Took any AP0.309 0.276*** 0.064 0.280***
(0.083) (0.107)
Took AP Calculus0.071 0.227*** 0.019 0.130*
(0.077) (0.078)
Score 3 or Higher, any AP0.082 0.108 0.014 0.014
(0.065) (0.058)
Score 3 or Higher, Calculus0.016 0.090* 0.006 0.004
(0.050) (0.042)
N 2423 523
Panel C: SAT Outcomes
Took SAT0.673 0.067 0.458 -0.165
(0.080) (0.175)
N 2423 523
SAT Math (800)443.5 50.9*** 368.1 49.9
(19.1) (34.3)
SAT Reasoning (1600)863.6 66.0** 726.4 103.7*
(31.3) (58.3)
SAT Composite (2400)1280.4 90.0** 1070.5 164.0**
(45.4) (82.3)
N 1648 247

35C h a r t e r S c h o o l s a n d t h e R o a d t o C o l l e g e R e a d i n e s s
Notes: This table reports 2SLS estimates of the effects of Boston charter attendance on subgroups defined by baseline special education status. See Table 2 notes for additional details.*significant at 10%; **significant at 5%; ***significant at 1%
Panel D: High School Graduation
graduate On-time0.705 -0.072 0.586 -0.375**
(0.075) (0.179)
N 2145 452
graduate Within Two0.805 0.062 0.690 -0.111
(0.076) (0.219)
N 1568 318
Panel E: College Enrollment Within Two
Any0.635 0.092 0.441 0.522
(0.121) (0.697)
4-year0.440 0.178 0.224 0.874
(0.123) (0.672)
4-year Public0.147 0.348*** 0.028 0.614*
(0.121) (0.367)
N 1158 224
Non Special Education Special Education
Mean(1)
Enrollment Effect(2)
Mean(3)
Enrollment Effect(4)
Estimates of Effects by Baseline Special Education Classifications continued

37C h a r t e r S c h o o l s a n d t h e R o a d t o C o l l e g e R e a d i n e s s
Studies of many educational interventions show prom-ising short-run gains, followed by discouragingly fast fadeout. This study uses randomized entrance lotteries to ask whether the substantial short-run test score effects generated by Boston’s charter high schools translate into gains on longer-run outcomes like Advanced Placement test-taking and scores, SAT scores, college attendance and college choice. Our estimates suggest that the effects of Boston’s charters are remarkably persistent. Specifi-cally, charter attendance raises the probability that stu-dents pass high-stakes exams required for high-school graduation, boosts the likelihood that students qualify for an exam-based college scholarship, increases the frequency of AP test-taking, substantially increases SAT scores and shifts students away from two-year colleges toward four-year schools. The effect of charter atten-dance on the probability of attending a four-year public institution in Massachusetts is particularly large.
In view of often-voiced concerns about the effect of charter schools on student attrition, we explore a pos-sible explanation for these gains in the form of school switching and peer effects. Charter attendance increases school switching outside of transitional grades, but this does not accentuate the effect of charter enrollment on peer composition. If anything, charter peers become more like other peers as students progress from 9th grade to 10th grade. Motivated by concerns about how charters serve special needs students, we also report estimates for a special education subsample, a group well represented at Boston’s charter high schools. With the exception of Adams Scholarship qualification and a possible delay in high school graduation, special educa-tion students seem to get as much or more from charter attendance as does the general applicant population.
These results suggest that the short-run test score im-pacts reported in our previous work on Boston’s charter schools are not driven by strategic gaming or teaching to the test; rather, they seem to represent increases in underlying human capital, with effects that emerge in a variety of outcomes. The cohorts of lottery applicants in our sample are too young to generate reliable estimates of effects on college persistence or graduation. In future work, we plan to investigate the effects of Boston’s charter schools on later college outcomes, as well as on longer-run labor market variables like employment and earnings.
CHAPTER SEVEN
Summary and Conclusions

39C h a r t e r S c h o o l s a n d t h e R o a d t o C o l l e g e R e a d i n e s s
Data Appendix
The data used for this study come from several sources. Lists of charter applicants and lottery winners are derived from records provided by individual charter schools. Information on schools attended and student demographics come from the Student Information Management System (SIMS), a centralized database that covers all public school students in Massachusetts. Standardized test scores are from the Massachusetts Comprehensive Assessment System (MCAS). Advanced Placement (AP) and Scholastic Aptitude Test (SAT) scores are provided by the College Board. College attendance information comes from the National Student Clearinghouse (NSC). This Appendix describes each data source and details the procedures used to clean and match them.
Lottery Data
Data description and sample restrictionsOur sample of applicants is obtained from records of lotteries held at six Massachusetts charter schools between 2002 and 2009. The participating schools and lottery years are listed in Table A2. A total of 24 school-specific entry cohorts are included in the analysis. Lotteries for three participating schools, Match, Codman Academy and City on a Hill, were conducted for entry to 9th grade; two schools, Boston Preparatory and Academy of the Pacific Rim, held lotteries for 6th grade entry. Records for Boston Collegiate are from 5th grade lotteries.
The raw lottery records typically include applicants’ names, dates of birth, contact information and other information used to define lottery groups, such as sibling status. The first five rows in Table A2 show the sample restrictions we impose on the raw lottery records. We exclude duplicate applicants and applicants listed as applying to the wrong entry grade. We also drop late applicants, out-of-area applicants, and sibling applicants, as these groups are typically not included in the standard lottery process. Imposing these restrictions reduces the number of lottery records from 8,840 to 8,455.
Lottery offersIn addition to the data described above, the lottery records also include information on offered seats. We used this to define indicator variables for whether lottery participants received randomized offers. We make use of two sources of variation in charter offers, which differ in timing. The initial offer instrument captures offers made on the day of the charter school lottery. The ever offer instrument captures offers made initially or later, as a consequence of movement down a randomly sequenced waiting list. The pattern of instrument availability across schools and applicant cohorts is documented in Panel B of Appendix Table A2. In some years, all applicants eventually received offers, in which case only the initial offer instrument contributes to the analysis; these cases are recorded as having “No Variation” in the ever offer instrument. As documented in Table 1, initial and ever offer rates were 29 and 64 percent in our MCAS analysis sample. These rates were similar in the samples for other outcomes.
SIMS Data
Data descriptionOur study uses SIMS data from the 2001-2002 school year through the 2011-2012 school year. Each year of data includes an October file and an end-of-year file. The SIMS records information on demographics and schools attended for all students in Massachusetts’ public schools. An observation in the SIMS refers to a student in a school

40 U n d e r s t a n d i n g B o s t o n
in a year, though there are some student-school-year duplicates for students that switch grades or programs within a school and year. The SIMS includes a unique student identifier known as the SASID, which is used to match students from other data sources as described below.
Coding of demographics and attendanceThe SIMS variables used in our analysis include grade, year, name, town of residence, date of birth, sex, race, special education and limited English proficiency status, free or reduced price lunch and school attended. We constructed a wide-format data set that captures demographic and attendance information for every student in each year in which he or she is present in Massachusetts’ public schools. This file uses information from the longest-attended school in the first calendar year spent in each grade. Attendance ties were broken at random; this affects only 0.007 percent of records. Students classified as special education, limited English proficiency, or eligible for a free or reduced price lunch in any record within a school-year-grade retain that designation for the entire school-year-grade. The SIMS also includes exit codes for the final time a student is observed in the database. These codes are used to determine high school graduates and transfers.
We measure charter school attendance in 9th and 10th grade. A student is coded as attending a charter in his or her 9th-grade or 10th-grade year when there is any SIMS record reporting charter attendance in that year. Students who attend more than one charter school within a year are assigned to the charter they attended longest.
MCAS DataWe use MCAS data from the 2001-2002 school year through the 2011-2012 school year. Each observation in the MCAS database records a student’s test results in a particular grade and year. The MCAS outcomes of interest are math and English Language Arts (ELA) tests in grade 10. We also use baseline tests taken prior to charter application, which are from 4th grade or 8th grade depending on a student’s application grade. The raw test score variables are stan-dardized to have mean zero and standard deviation one within a subject-grade-year in Massachusetts. We also make use of scaled scores, which are used to determine whether students meet MCAS competency thresholds. Unless otherwise noted, we only use the first test taken in a particular subject and grade.
AP and SAT DataWe use AP and SAT data files provided to the Massachusetts Department of Elementary and Secondary Education by College Board. The AP and SAT files include scores on all AP exams and SAT tests for graduation cohorts 2007 through 2012; for students who took the SAT more than once, the file includes only the score for the most recent exam. The AP and SAT files also include SASID identifiers, which are used to merge these outcomes with the SIMS database.
NSC DataData on college outcomes comes from the National Student Clearinghouse (NSC) database, which captures enroll-ment for 94 percent of undergraduates in Massachusetts. We combine information from three separate searches of the NSC database:
■ A 2010 search for all students in the SIMS database between 2002 and 2009 with projected graduation years earlier than 2014, assuming normal academic progress from the last observed grade and year. Note that this search was not restricted to students who graduated high school;

41C h a r t e r S c h o o l s a n d t h e R o a d t o C o l l e g e R e a d i n e s s
■ A 2011 search of students who graduated from Massachusetts public high schools in the class of 2010;
■ A 2012 search of all students who graduated from Massachusetts public high schools in the classes of 2003 through 2010.
All students in our charter applicant sample were included in the 2010 NSC search, and Massachusetts high school graduates were included in multiple searches. College types are coded using the first attended college after the last date a student is observed in the SIMS. NSC searches were conducted using criteria like name and date of birth; the NSC files also include SASIDs, which are used to merge the college outcomes with the SIMS database.
Matching Data SetsThe MCAS, AP, SAT and NSC data files were merged to the master SIMS data file using the unique SASID identifier. The lottery records do not include SASIDs; these records were matched manually to the SIMS by name, application year and application grade. In some cases, this procedure failed to produce a unique match. We accepted some matches based on fewer criteria where the information on grade, year and town of residence seemed to make sense.
Our matching procedure successfully located most applicants in the SIMS database. The sixth row of Panel A of Table A2 reports the number of applicant records matched to the SIMS in each applicant cohort. The overall match rate across all cohorts was 94 percent (7,953/8,455).
Once matched to the SIMS, each student is associated with a unique SASID; at this point, we can determine which students applied to multiple schools in our lottery sample. Following the match, we reshape the lottery data set to contain a single record for each student. If students applied in more than one year, we keep only records associated with the earliest year of application. Our lottery analysis also excludes students who did not attend a Boston Public Schools (BPS) school at baseline, as students applying from private schools have lower follow-up rates. This restriction eliminates 22 percent of charter applicants. Of the remaining 4,511 charter applicants, 3,548 (78 percent) contribute a score to our MCAS analysis.

42 U n d e r s t a n d i n g B o s t o n
TABLe A1
Boston School Characteristics
Public High Schools
Charters Serving Grade 9-12
Charters Serving Grade 9-12 Only
Charters in the Study
Mean(1)
Mean(2)
Mean(3)
Mean(4)
Panel A: Charter School Characteristics
Number of years open - 14 15 15
Days per year 180 190 189 189
Average minutes per day 389 478 477 477
Have Saturday school - 0.71 0.75 0.75
Avg. math instruction (min) - 92.0 83.5 83.5
Avg. reading instruction (min) - 92.0 89.8 89.8
No excuses - 0.71 0.75 0.75
Panel B: Comparison with Traditional Boston Public Schools
Number of teachers 45 27 19 28
Student/teacher ratio 14.6 13.0 13.6 13.3
Proportion of teachers licensed in teaching assignment 0.97 0.63 0.71 0.58
Proportion of teachers 32 and younger 0.28 0.71 0.71 0.76
Proportion of teachers 49 and older 0.35 0.09 0.10 0.05
Proportion of core classes taught by highly qualified teachers 0.93 0.97 0.98 0.97
Avg. per-pupil expenditure $14,614* $14,277 $15,313 $13,990
Title I eligible 1 1 1 1
N (schools) 21 7 4 6
Notes: This table reports characteristics of Boston charter schools and BPS operating in academic year 2012-13. Charter school characteristics are obtained from a survey of school administrators. Panel B compares traditional charter high schools to Boston public high schools. Data on public schools are from http:\\www.doe.mass.edu. Boston public high schools include Another Course to College, Boston Arts Academy, Boston Community Leadership Academy, Boston Latin Academy, Boston Latin School, Brighton High, Boston International High, Burke High, Charlestown High, Community Academy of Science and Health, Dorchester Academy, east Boston High, The english High, excel High, Fenway High, greater egleston High, New Mission High, O’Bryant School of Math and Science, Quincy upper, Snowden International High, urban Science Academy. Data for West Roxbury Academy and TechBoston Academy are missing. Boston charters serving grade 9-12 include Academy of the Pacific Rim, Boston Preparatory, City on a Hill, Codman Academy, Boston Collegiate High, Health Careers Academy, and Match. Boston charter high schools serving grade 9-12 only are City on a Hill, Codman Academy, Match, Health Careers Academy. Statistics are based on data from 2011. *Average per-pupil expenditure is the mean of FY2010 and FY2012 per-pupil expenditures (data acquired from annual “At A glance” BPS publications) for all BPS schools, including middle schools and elementary schools. The statistic includes all salaries, instructional costs, and support services costs; it excludes all capital costs.

42 U n d e r s t a n d i n g B o s t o n 43C h a r t e r S c h o o l s a n d t h e R o a d t o C o l l e g e R e a d i n e s s
TabLe a1
Boston School Characteristics
Public High Schools
Charters Serving Grade 9-12
Charters Serving Grade 9-12 Only
Charters in the Study
Mean(1)
Mean(2)
Mean(3)
Mean(4)
Panel A: Charter School Characteristics
Number of years open - 14 15 15
Days per year 180 190 189 189
average minutes per day 389 478 477 477
Have Saturday school - 0.71 0.75 0.75
avg. math instruction (min) - 92.0 83.5 83.5
avg. reading instruction (min) - 92.0 89.8 89.8
No excuses - 0.71 0.75 0.75
Panel B: Comparison with Traditional Boston Public Schools
Number of teachers 45 27 19 28
Student/teacher ratio 14.6 13.0 13.6 13.3
Proportion of teachers licensed in teaching assignment 0.97 0.63 0.71 0.58
Proportion of teachers 32 and younger 0.28 0.71 0.71 0.76
Proportion of teachers 49 and older 0.35 0.09 0.10 0.05
Proportion of core classes taught by highly qualified teachers 0.93 0.97 0.98 0.97
avg. per-pupil expenditure $14,614* $14,277 $15,313 $13,990
Title I eligible 1 1 1 1
N (schools) 21 7 4 6
Notes: This table reports characteristics of boston charter schools and bPS operating in academic year 2012-13. Charter school characteristics are obtained from a survey of school administrators. Panel b compares traditional charter high schools to boston public high schools. Data on public schools are from http:\\www.doe.mass.edu. boston public high schools include another Course to College, boston arts academy, boston Community Leadership academy, boston Latin academy, boston Latin School, brighton High, boston International High, burke High, Charlestown High, Community academy of Science and Health, Dorchester academy, east boston High, The english High, excel High, Fenway High, Greater egleston High, New Mission High, O’bryant School of Math and Science, Quincy Upper, Snowden International High, Urban Science academy. Data for West Roxbury academy and Techboston academy are missing. boston charters serving grade 9-12 include academy of the Pacific Rim, boston Preparatory, City on a Hill, Codman academy, boston Collegiate High, Health Careers academy, and Match. boston charter high schools serving grade 9-12 only are City on a Hill, Codman academy, Match, Health Careers academy. Statistics are based on data from 2011. *average per-pupil expenditure is the mean of FY2010 and FY2012 per-pupil expenditures (data acquired from annual “at a Glance” bPS publications) for all bPS schools, including middle schools and elementary schools. The statistic includes all salaries, instructional costs, and support services costs; it excludes all capital costs.
TabLe a2
Lottery Records
Panel A: Lottery Records
Projected Senior Year 2006 2007 2008 2009 2010 2011 2012 2013 ALL
Total number of records 600 450 940 883 1117 1533 1753 1564 8840
excluding disqualified applications 600 450 940 883 1117 1530 1753 1553 8826
excluding late applications 590 446 930 880 1117 1530 1733 1553 8779
excluding applicants from outside of area 590 446 930 880 1114 1529 1733 1535 8757
excluding siblings 570 437 905 864 1101 1482 1642 1454 8455
excluding records not matched to the SIMS 509 419 858 816 1055 1395 1547 1354 7953
Reshaping to one record per student 437 419 632 594 799 1025 1100 966 5972
excluding repeat applications 437 419 629 589 778 1005 1029 914 5800
In boston schools at baseline 289 337 511 481 605 847 751 690 4511
excluding applicants without outcome scores 232 268 419 382 483 667 568 529 3548
Notes: Panel a summarizes the sample restrictions imposed for the lottery analysis. Disqualified applications are either within year and school duplicates or applications to the wrong grade. In Panel b, the notation “Not Oversubscribed” means that every applicant received an offer. “Yes” means that lottery records with information on ever offer and initial offer were available, and that some applicants did not get offers. “Incomplete Records” indicates schools and years for which lottery records are inadequate to allow reliable coding of initial or ever offers. The last row shows the number of applicants to each school. Cohorts are too young for follow-up if they don’t generate outcomes beyond MCaS in time for our study. The total number of applicants represented in Panel b is 3,548. For Match 2008 applicants, we impute initial offer using the 2007 Match initial offer cutoff.
Panel B: Comparison of Ever Offer and Initial Offer Records by Schools and Cohorts
Application Year/School
Boston Preparatory
Academy of Pacific Rim
Boston Collegiate City on a Hill Codman
Academy Match
2002ever
Not Open No RecordsYes Not Oversubscribed
No RecordsYes
Initial Yes Yes Yes
2003ever
Not Open No RecordsYes
No Records No RecordsYes
Initial Yes Yes
2004ever
Incomplete Records No RecordsYes Not Oversubscribed Yes Yes
Initial Yes Yes Yes Yes
2005ever Not Oversubscribed Yes Yes Yes
Incomplete RecordsYes
Initial Yes Yes Yes Yes Yes
2006ever Yes
Incomplete RecordsYes
Initial Yes Yes
2007ever
Too Young for Follow-up
YesNo Records
Yes
Initial Yes Yes
2008ever Not Oversubscribed Yes Yes
Initial Yes Yes Yes
2009ever Yes Yes Yes
Initial Yes Yes Yes
N 81 83 264 1923 155 2373
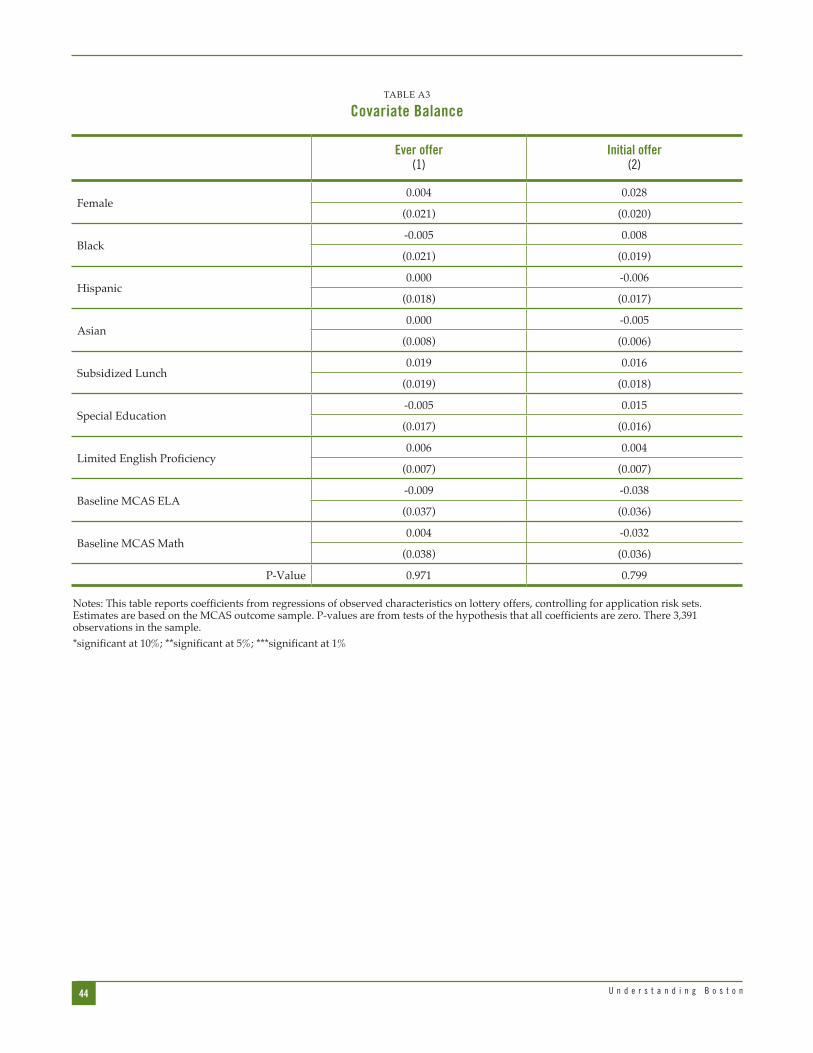
44 U n d e r s t a n d i n g B o s t o n
TABLe A3
Covariate Balance
Ever offer(1)
Initial offer(2)
Female0.004 0.028
(0.021) (0.020)
Black-0.005 0.008
(0.021) (0.019)
Hispanic0.000 -0.006
(0.018) (0.017)
Asian 0.000 -0.005
(0.008) (0.006)
Subsidized Lunch0.019 0.016
(0.019) (0.018)
Special education-0.005 0.015
(0.017) (0.016)
Limited english Proficiency0.006 0.004
(0.007) (0.007)
Baseline MCAS eLA -0.009 -0.038
(0.037) (0.036)
Baseline MCAS Math0.004 -0.032
(0.038) (0.036)
P-Value 0.971 0.799
Notes: This table reports coefficients from regressions of observed characteristics on lottery offers, controlling for application risk sets. estimates are based on the MCAS outcome sample. P-values are from tests of the hypothesis that all coefficients are zero. There 3,391 observations in the sample.*significant at 10%; **significant at 5%; ***significant at 1%
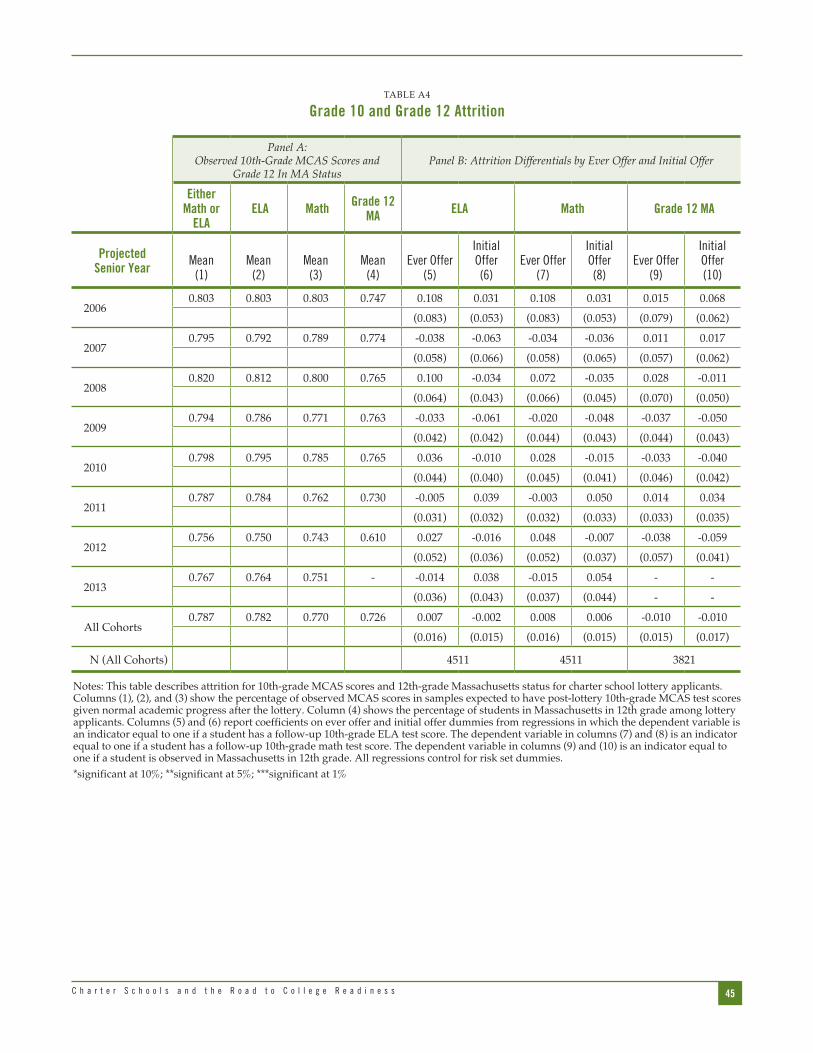
45C h a r t e r S c h o o l s a n d t h e R o a d t o C o l l e g e R e a d i n e s s
TABLe A4
Grade 10 and Grade 12 Attrition
Panel A: Observed 10th-Grade MCAS Scores and
Grade 12 In MA StatusPanel B: Attrition Differentials by Ever Offer and Initial Offer
Either Math or
ELA ELA Math Grade 12
MA ELA Math Grade 12 MA
Projected Senior Year Mean
(1)Mean
(2)Mean
(3)Mean
(4)Ever Offer
(5)
Initial Offer(6)
Ever Offer(7)
Initial Offer(8)
Ever Offer(9)
Initial Offer(10)
20060.803 0.803 0.803 0.747 0.108 0.031 0.108 0.031 0.015 0.068
(0.083) (0.053) (0.083) (0.053) (0.079) (0.062)
20070.795 0.792 0.789 0.774 -0.038 -0.063 -0.034 -0.036 0.011 0.017
(0.058) (0.066) (0.058) (0.065) (0.057) (0.062)
20080.820 0.812 0.800 0.765 0.100 -0.034 0.072 -0.035 0.028 -0.011
(0.064) (0.043) (0.066) (0.045) (0.070) (0.050)
20090.794 0.786 0.771 0.763 -0.033 -0.061 -0.020 -0.048 -0.037 -0.050
(0.042) (0.042) (0.044) (0.043) (0.044) (0.043)
20100.798 0.795 0.785 0.765 0.036 -0.010 0.028 -0.015 -0.033 -0.040
(0.044) (0.040) (0.045) (0.041) (0.046) (0.042)
20110.787 0.784 0.762 0.730 -0.005 0.039 -0.003 0.050 0.014 0.034
(0.031) (0.032) (0.032) (0.033) (0.033) (0.035)
20120.756 0.750 0.743 0.610 0.027 -0.016 0.048 -0.007 -0.038 -0.059
(0.052) (0.036) (0.052) (0.037) (0.057) (0.041)
20130.767 0.764 0.751 - -0.014 0.038 -0.015 0.054 - -
(0.036) (0.043) (0.037) (0.044) - -
All Cohorts0.787 0.782 0.770 0.726 0.007 -0.002 0.008 0.006 -0.010 -0.010
(0.016) (0.015) (0.016) (0.015) (0.015) (0.017)
N (All Cohorts) 4511 4511 3821
Notes: This table describes attrition for 10th-grade MCAS scores and 12th-grade Massachusetts status for charter school lottery applicants. Columns (1), (2), and (3) show the percentage of observed MCAS scores in samples expected to have post-lottery 10th-grade MCAS test scores given normal academic progress after the lottery. Column (4) shows the percentage of students in Massachusetts in 12th grade among lottery applicants. Columns (5) and (6) report coefficients on ever offer and initial offer dummies from regressions in which the dependent variable is an indicator equal to one if a student has a follow-up 10th-grade eLA test score. The dependent variable in columns (7) and (8) is an indicator equal to one if a student has a follow-up 10th-grade math test score. The dependent variable in columns (9) and (10) is an indicator equal to one if a student is observed in Massachusetts in 12th grade. All regressions control for risk set dummies. *significant at 10%; **significant at 5%; ***significant at 1%
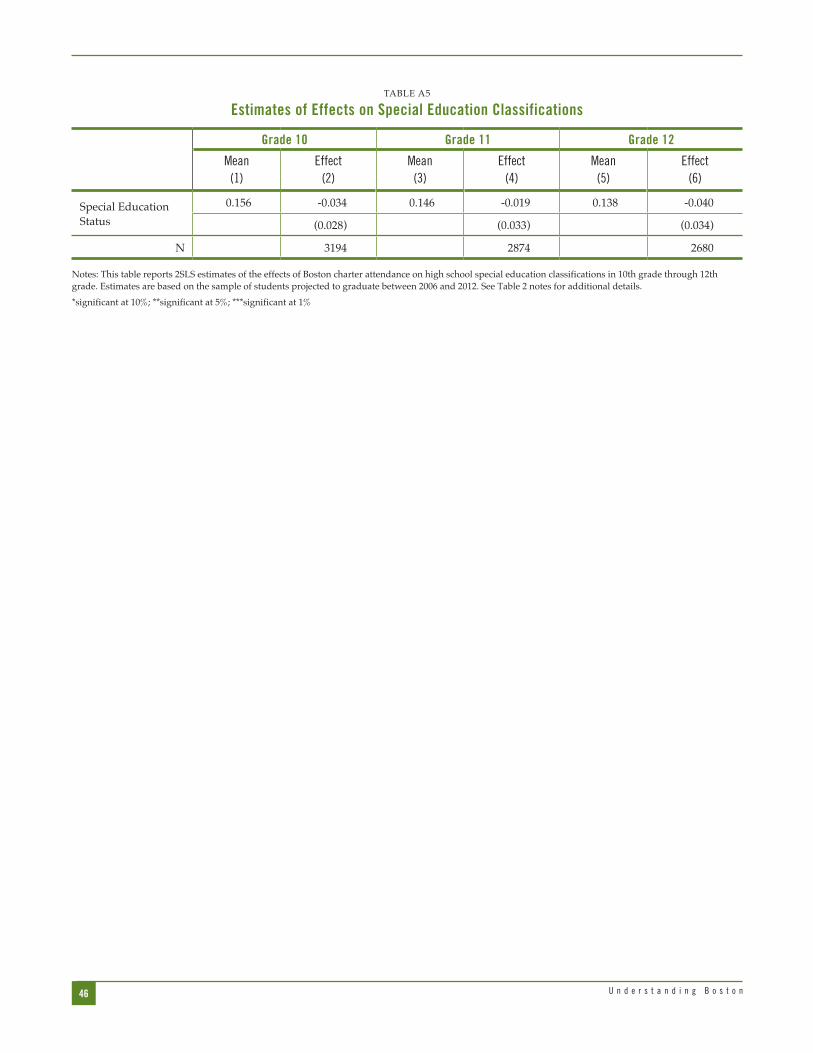
46 U n d e r s t a n d i n g B o s t o n
TABLe A5
Estimates of Effects on Special Education Classifications
Grade 10 Grade 11 Grade 12
Mean(1)
Effect(2)
Mean(3)
Effect(4)
Mean(5)
Effect(6)
Special education Status
0.156 -0.034 0.146 -0.019 0.138 -0.040
(0.028) (0.033) (0.034)
N 3194 2874 2680
Notes: This table reports 2SLS estimates of the effects of Boston charter attendance on high school special education classifications in 10th grade through 12th grade. estimates are based on the sample of students projected to graduate between 2006 and 2012. See Table 2 notes for additional details.*significant at 10%; **significant at 5%; ***significant at 1%

47C h a r t e r S c h o o l s a n d t h e R o a d t o C o l l e g e R e a d i n e s s
Technical Appendix
Two-Stage Least Squares

48 U n d e r s t a n d i n g B o s t o n

49C h a r t e r S c h o o l s a n d t h e R o a d t o C o l l e g e R e a d i n e s s

50 U n d e r s t a n d i n g B o s t o n
Abadie, A. (2002). Bootstrap Tests for Distributional Treatment Effects in Instrumental Variables Models. Journal of the American Statistical Association. 97(457).
Abadie, A. (2003). Semiparametric instrumental variable estimation of treatment response models. Journal of Econometrics. 113(2).
Abdulkadiroglu, A., Angrist, J., Dynarski, S., Kane, T. J., and Pathak, P. (2011). Accountability and Flexibility in Public Schools: Evidence from Boston’s Charters and Pilots. Quarterly Journal of Economics, 126(2): 699-748.
Anderson, M. L. (2008). Multiple Inference and Gender Differences in the Effects of Early Intervention: A Reevaluation of the Abecedarian, Perry Preschool, and Early Training Projects. Journal of the American Statistical Association, 103(484): 1481-1495.
Andrabi, T., Das, J., Ijaz Khwaja, A., and Zajonc, T. (2011). Do Value-Added Estimates Add Value? Accounting for Learning Dynamics. American Economic Journal: Applied Economics, 3(3): 29-54.
Angrist, J. D., Cohodes, S. R., Dynarski, S. M., Fullerton, J., Kane, T. J., Pathak, P. A., and Walters, C. R. (2011a). Student Achievement in Massachusetts’ Charter Schools. Center for Education Policy Research at Harvard University.
Angrist, J. D., Dynarski, S. M., Kane, T. J., Pathak, P. A., and Walters, C. R. (2010). Inputs and Impacts in Charter Schools: KIPP Lynn. American Economic Review, 100(2): 239-243.
Angrist, J. D., Dynarski, S. M., Kane, T. J., Pathak, P. A., and Walters, C. R. (2012). Who Benefits from KIPP? Journal of Policy Analysis and Management, 31(4): 837-860.
Angrist, J. D., Pathak, P. A., and Walters, C. R. (2011b). Explaining Charter School Effectiveness. Working Paper 17332, National Bureau of Economic Research, Cambridge, MA.
Banerjee, A. V., Cole, S., Duflo, E., and Linden, L. (2007). Remedying Education: Evidence from Two Randomized Experiments in India. Quarterly Journal of Economics, 122(3): 1235-1264.
Booker, K., Sass, T. R., Gill, B., and Zimmer, R. (2008). Going Beyond Test Scores: Evaluating Charter School Impact on Educational Attainment in Chicago and Florida. RAND, Santa Monica, CA.
Bowen, W. and Bok, D. (2000). The Shape of the River: Long-Term Consequences of Considering Race in College and University Admissions. Princeton University Press, Princeton, NJ.
Chetty, R., Friedman, J. N., Hilger, N., Saez, E., Schanzenbach, D. W., and Yagan, D. (2011). How Does Your Kindergarten Classroom Affect Your Earnings? Evidence from Project STAR. Quarterly Journal of Economics, 126(4): 1593-1660.
Cohodes, S. and Goodman, J. (2013). Merit Aid, College Quality, and College Completion: Massachusetts’ Adams Scholarship as an In-kind Subsidy. HKS Faculty Research Working Paper Series RWP13-005.
Bibliography

51C h a r t e r S c h o o l s a n d t h e R o a d t o C o l l e g e R e a d i n e s s
Cunha, F., Heckman, J. J., and Schennach, S. M. (2010). Estimating the Technology of Cognitive and Noncognitive Skill Formation. Econometrica, 78(3): 883-931.
Currie, J. and Thomas, D. (2000). School Quality and the Longer-Term Effects of Head Start. The Journal of Human Resources, 35(4): 755.
Deming, D. (2009). Early Childhood Intervention and Life-Cycle Skill Development: Evidence from Head Start. American Economic Journal: Applied Economics, 1(3): 111-134.
Deming, D. and Dynarski, S. M. (2010). Into College, Out of Poverty? Policies to Increase the Postsecondary Attainment of the Poor. Targeting Investments in Children: Fighting Poverty When Resources are Limited. Ed. Philip Levine and David Zimmerman. University of Chicago Press, Chicago, IL. 283-302.
Dobbie, W. and Fryer, R. G. (2011a). Are High-Quality Schools Enough to Increase Achievement Among the Poor? Evidence from the Harlem Children’s Zone. American Economic Journal: Applied Economics, 3(3): 158-187.
Dobbie, W. and Fryer, R. G. (2011b). Getting Beneath the Veil of Effective Schools: Evidence from New York City. Technical Report NBER Working Paper No. 17632, National Bureau of Economic Research, Cambridge, MA.
Dobbie, W. and Fryer, R. G. (2012). Are High Quality Schools Enough to Reduce Social Disparities? Evidence from the Harlem Children’s Zone. Unpublished manuscript, Harvard University, Cambridge, MA.
Dynarski, M. and Gleason, P. (2002). How Can We Help? What We Have Learned from Recent Federal Dropout Prevention Evaluations. Journal of Education for Students Placed At Risk, 7(1): 43-69.
Dynarski, M., Gleason, P., Rangarajan, A., and Wood, R. (1998). Impacts of Dropout Prevention Programs. Technical Report, Mathematica Policy Research, Inc., Princeton, NJ.
Dynarski, M. and Wood, R. (1997). Helping High-Risk Youths: Results for the Alternative Schools Demonstration Program. Mathematica Policy Research, Inc. Princeton, NJ.
Dynarski, S. M., Hyman, J. M., and Schanzenbach, D. W. (2011). Experimental Evidence on the Effect of Childhood Investments on Postsecondary Degree Attainment and Degree Completion. Working Paper 17553, National Bureau of Economic Research, Cambridge, MA.
Garces, E., Thomas, D., and Currie, J. (2002). Longer-Term Effects of Head Start. American Economic Review, 92(4): 999-1012.
Jacob, B. A. (2007). Test-Based Accountability and Student Achievement: An Investigation of Differential Performance on NAEP and State Assessment. Working Paper 12817, National Bureau of Economic Research, Cambridge, MA.
Jacob, B. A., Lefgren, L., and Sims, D. P. (2010). The Persistence of Teacher-Induced Learning. The Journal of Human Resources, 45(4): 915-943.
Jacob, B. A. and Levitt, S. D. (2003). Rotten Apples: An Investigation of the Prevalence and Predictors of Teacher Cheating. Quarterly Journal of Economics, 118(3): 843-877.
Kane, T. J. and Staiger, D. O. (2008). Estimating Teacher Impacts on Student Achievement: An Experimental Evaluation. Technical Report Working Paper 14607, National Bureau of Economic Research, Cambridge, MA.

52 U n d e r s t a n d i n g B o s t o n
Kemple, J. and Snipes, J. (2000). Career Academies: Impacts on Students’ Engagement and Performance in High School. MDRC. New York, NY.
Mass. Board of Higher Education (2008). Massachusetts School-to-College Report High School Class of 2005. Boston: February 2008
Neal, D. and Schanzenbach, D. W. (2010). Left Behind by Design: Proficiency Counts and Test-Based Accountability. Review of Economics and Statistics, 92(2): 263-283.
Skinner, K. J. (2009). Charter School Success or Selective Out-Migration of Low Achievers? Effects of Enrollment Management on Student Achievement. Massachusetts Teachers Association, Boston, MA.
Thernstrom, A. M. and Thernstrom, S. (2003). No Excuses: Closing the Racial Gap in Learning. Simon & Schuster, New York, NY.

53C h a r t e r S c h o o l s a n d t h e R o a d t o C o l l e g e R e a d i n e s s
Endnotes
1. See, for example, studies of the effect of Head Start by Currie and Thomas (2000), Garces et al. (2002), and Deming (2009) and investigations of class size effects by Dynarski et al. (2011) and Chetty et al., (2011). Three randomized, preschool interventions generate fading effects on cognitive test scores but may affect labor force attachment and crime (Anderson, 2008). Teacher assignment and international educational interventions also appear to generate impacts that fade (see Kane and Staiger, 2008; Jacob et al., 2010; Andrabi et al., 2011; and Banerjee et al., 2007).
2. For example, Dynarski et al. (1998) and Dynarski and Gleason (2002) document an array of discouraging findings for interventions meant to reduce dropout rates. Dynarski and Wood (1997) and Kemple and Snipes (2000) look at alternative schools and career academies, with findings that are mixed at best.
3. Since charter schools are a recent innovation, with Massachusetts’s first charter schools opening in 1995, it is not surprising that most evidence on charter effectiveness to date comes from outcomes measured while children are still enrolled in elementary and secondary school. An exception is Dobbie and Fryer (2012)’s recent lottery-based study, which follows applicants to a single charter middle school in the Harlem Children’s Zone, estimating the effects on college enrollment while also looking at non-educational outcomes related to crime and teen pregnancy. Dobbie and Fryer (2012) find that Promise Academy students are more likely to go to college, while girls are less likely to get pregnant and boys are less likely to be incarcerated. Earlier work by Booker et al. (2008) uses statistical controls and distance instruments to identify the effect of charter school attendance on high school graduation and college enrollment. Both of these empirical strategies suggest gains for charter students. We complement this earlier work with new results on postsecondary preparation and enrollment for a large cohort of charter high school students in an urban setting of considerable policy interest.
4. The six schools are Academy of the Pacific Rim, Boston Collegiate Charter School, Boston Preparatory Charter Public School, City on a Hill, Codman Academy Charter Public School, and Match Charter High School.
5. The BPS average, for example, covers all students educated under district auspices, including out-of-district special education placements, and elementary school students.
6. Birthdays, town of residence, race or ethnicity, and gender were used to distinguish duplicate matches.
7. Match rates differ little by win/loss status. Results for applicant cohorts where match rate differentials are largest are similar to those for the larger sample.
8. The projected senior year equals the year in 8th grade plus 4 for applicants to City on a Hill, Codman Academy, and Match Charter High School (schools where applicants apply for 9th grade entry), year in 4th grade plus 8 for applicants to Boston Collegiate (where applicants apply for 5th grade entry), and year in 5th grade plus 7 for applicants to Academy of the Pacific Rim and Boston Preparatory (schools where applicants apply for 6th grade entry.)
9. First stage estimates differ slightly across outcomes due to small changes in sample composition.
10. The estimates reported in Abdulkadiroglu et al. (2011) are smaller than those reported here in Table 2, because the former are scaled to measure the effect of years of charter attendance, while those reported here show an overall charter enrollment effect, without putting these in per-year terms.

54 U n d e r s t a n d i n g B o s t o n
11. See http://www.doe.mass.edu/mcas/graduation.html for details. The new rules include an exception for students who pass the Needs Improvement threshold only and also meet personal goals. We ignore this exception here.
12. Cohodes and Goodman (2013) estimate effects of Adams Scholarships on college enrollment and choice, showing these appear to increase enrollment in public universities in spite of the fact that they cover only a small portion of college costs.
13. Charter school students can earn a scholarship in either the district of attendance (the charter school) or the district of residence (Boston). The two standards differ due to the requirement for a score in the upper quartile of the district score distribution. The Adams Scholarship cutoff is defined here using BPS thresholds.
14. Complier distributions are estimated using a variation on the methods introduced by Abadie (2002; 2003). See the technical appendix for details.
15. Charter applicants are positively selected, that is, have somewhat higher baseline test scores than the general BPS population. Consequently, the SAT-taking rate among applicants of about .64 exceeds the SAT-taking rate of almost half in the overall non-charter BPS population.
16. Means (and standard deviations) of the 2012 US SAT distribution were 512 (117) in math, 496 (114) in verbal, 488 (114) in writing, 1010 (214) for SAT reasoning and 1498 (316) for the composite.
17. On time graduation dates are determined by counting from the entry grade to grade 12.
18. In a statewide sample, Cohodes and Goodman (2013) find the Adams Scholarship causes Massachusetts students to forgo more selective private campuses on average. But this results emerges only for higher-income students.
19. Our earlier study of Boston charters shows that initial peer composition is unlikely to account for positive charter effects on achievement: the interaction between school-specific gains and baseline peer achievement is negative. In other words, charters with the most value added have the worst initial peer mix.
20. Low application rates in the LEP subpopulation may also be a concern. On the other hand, the Boston-area KIPP school evaluated in Angrist, et al. (2010 and 2012) enrolls many LEP students. Our earlier results suggest that KIPP enrollment generates substantially larger achievement gains for LEP students than for the general applicant population, especially in ELA.
54 U n d e r s t a n d i n g B o s t o n 55C h a r t e r S c h o o l s a n d t h e R o a d t o C o l l e g e R e a d i n e s s
The School Effectiveness and Inequality Initiative (SEII) is a research program based at the Massachusetts Institute of Technology (MIT) and the National Bureau of Economic Research (NBER). SEII focuses on the economics of education and the connections between human capital and the American income distribution.
Josh Angrist is the Ford Professor of Economics at MIT and a Research Associate in the NBER’s programs on Children, Education, and Labor Studies. A dual U.S. and Israeli citizen, he taught at the Hebrew University of Jerusalem before coming to MIT. Angrist received his B.A. from Oberlin College in 1982 and also spent time as an undergraduate studying at the London School of Economics and as a Masters student at Hebrew University. He completed his Ph.D. in Economics at Princeton in 1989. His first academic job was as an Assistant Professor at Harvard from 1989-91. Prof. Angrist has been a leader in the development of econometric methods for the assessment of causal effects of education policies and a lead contributor to a wide range of studies using these methods. Among other things, he has examined the effects of computer-aided instruction, class size, and charter schools. Prof. Angrist is the author (with Steve Pischke) of Mostly Harmless Economics: An Empiricist’s Companion (Princeton University Press, 2009). He is a Fellow of the American Academy of Arts and Sciences, The Econometric Society, and has served on many editorial boards and as a Co-editor of the Journal of Labor Economics. He received an honorary doctorate from the University of St Gallen (Switzerland) in 2007.
Sarah Cohodes is a doctoral student in Public Policy at the Harvard University Kennedy School of Government. She is also a doctoral fellow in the Multidisciplinary Program in Inequality and Social Policy at Harvard University and an affiliated researcher with the School Effectiveness and Inequality Initiative at MIT. Prior to her studies, she worked at the Center for Education Policy Research at Harvard University and the Education Policy Center at the Urban Institute. She holds a B.A. in Economics from Swarthmore College and an Ed.M. in Education Policy and Management from the Harvard Graduate School of Education. Her research interests include the economics of education and labor economics.
Susan Dynarski is a third-generation Bostonian, having attended elementary school in Somerville (St. Catherine’s) and high school in Cambridge (Matignon). Dynarski earned her BA and MPP at Harvard and a Ph.D. in economics at MIT. Dynarski is currently a professor at the University of Michigan, where she teaches economics, statistics and education policy at the Gerald R. Ford School of Public Policy and the School of Education. She has been a professor at Harvard University and a visiting fellow at the Federal Reserve Bank of Boston. Professor Dynarski has testified on education and tax policy before the US Senate Finance Committee, the US House Ways and Means Committee and the President’s Commission on Tax Reform. She is a Faculty Research Associate at the National Bureau of Economic Research. She has been an editor of The Journal of Labor Economics and Education Finance and Policy. She sits on the boards of the Association for Public Policy and Management (APPAM), MDRC, and Association for Education Finance and Policy (AEFP). Dynarski’s research has been funded by the Institute of Education Sciences, Russell Sage Foundation, Smith-Richardson Foundation and the National Institute of Aging.
Parag Pathak is an Associate Professor of Economics at MIT and a Research Associate in the NBER’s programs on Education, Public Economics and Industrial Organization. He is also the founding co-director of the NBER Working Group on Market Design. He received his A.B., S.M. and his Ph.D in 2007 all from Harvard University. Following a stint as a junior fellow in Harvard’s Society of Fellows, Pathak joined MIT’s Department of Economics, where
About the Authors11. See http://www.doe.mass.edu/mcas/graduation.html for details. The new rules include an exception for students who pass the Needs Improvement threshold only and also meet personal goals. We ignore this exception here.
12. Cohodes and Goodman (2013) estimate effects of Adams Scholarships on college enrollment and choice, showing these appear to increase enrollment in public universities in spite of the fact that they cover only a small portion of college costs.
13. Charter school students can earn a scholarship in either the district of attendance (the charter school) or the district of residence (Boston). The two standards differ due to the requirement for a score in the upper quartile of the district score distribution. The Adams Scholarship cutoff is defined here using BPS thresholds.
14. Complier distributions are estimated using a variation on the methods introduced by Abadie (2002; 2003). See the technical appendix for details.
15. Charter applicants are positively selected, that is, have somewhat higher baseline test scores than the general BPS population. Consequently, the SAT-taking rate among applicants of about .64 exceeds the SAT-taking rate of almost half in the overall non-charter BPS population.
16. Means (and standard deviations) of the 2012 US SAT distribution were 512 (117) in math, 496 (114) in verbal, 488 (114) in writing, 1010 (214) for SAT reasoning and 1498 (316) for the composite.
17. On time graduation dates are determined by counting from the entry grade to grade 12.
18. In a statewide sample, Cohodes and Goodman (2013) find the Adams Scholarship causes Massachusetts students to forgo more selective private campuses on average. But this results emerges only for higher-income students.
19. Our earlier study of Boston charters shows that initial peer composition is unlikely to account for positive charter effects on achievement: the interaction between school-specific gains and baseline peer achievement is negative. In other words, charters with the most value added have the worst initial peer mix.
20. Low application rates in the LEP subpopulation may also be a concern. On the other hand, the Boston-area KIPP school evaluated in Angrist, et al. (2010 and 2012) enrolls many LEP students. Our earlier results suggest that KIPP enrollment generates substantially larger achievement gains for LEP students than for the general applicant population, especially in ELA.
56 U n d e r s t a n d i n g B o s t o n
he was voted tenure after three years at the age of 30. He has been awarded a Faculty Early Career Development Award from the National Science Foundation and has been invited to give the Shapley Lecture, as a distinguished game theorist under 40, at the International Meeting of the Game Theory Society in 2012. Pathak is an associate editor of the American Economic Review, has also taught at Stanford’s Graduate School of Business. His research centers on the design and evaluation of student assignment systems. Prof. Pathak has assisted with the design of New York City and Boston school assignment mechanisms currently in use. In addition to generating academic publications that study, develop, and test these systems, this work has directly affected the lives of over one million public school students in New York City and Boston. Numerous other cities are in the process of redesigning their school assignment procedures following this work.
Christopher Walters is a PhD candidate in economics at MIT. His research focuses on labor economics and the economics of education, with emphasis on school performance at the primary and early childhood levels. He received a BA in economics and philosophy from the University of Virginia and a National Science Foundation Graduate Research Fellowship in 2008. Chris will receive his PhD in June 2013 and start as an assistant professor in the Department of Economics at the University of California, Berkeley in Fall 2013.


U n d e r s t a n d i n g B o s t o n