chart patterns in today‟s...chart patterns in today‟s commodity market dissertation submitted in...
TRANSCRIPT

Effectiveness of Candlestick
Chart Patterns in today‟s
commodity market
Dissertation submitted in part fulfilment of the requirements for the degree of
MBA Finance
Sameer Bindlish 10302271
Dublin Business School
MBA Finance 2016

ii
Declaration: I, Sameer Bindlish, declare that this research is my original
work and that it has never been presented to any institution or
university for the award of Degree or Diploma. In addition, I have
referenced correctly all literature and sources used in this work and this
this work is fully compliant with the Dublin Business School‟s academic
honesty policy.
Signed: Sameer Bindlish
Date: 22 August, 2016

iii
Abstract
Japanese candlestick charts were first introduced to the Western world in 1989 by
Steve Nison. No one in the West got to know about the Japanese technical analysis
before the first edition of his textbook, and no charting packages included them
either prior to the first edition. Japanese candlestick patterns have become very
popular since then. Japanese candlestick patterns are technical trading rules that are
used to predict price directions based on the relationship between openings, high,
low and closing prices. Currently many market participants are implementing
Japanese candle patterns as part of their robust trading systems. This research
examines the profitability of four bullish and four bearish Japanese candlestick
reversal patterns in four commodities which represent both advanced and emerging
commodity markets. These commodities include Gold, Silver, Crude Oil and Natural
Gas. Further this paper will try to develop a strategy which can increase the return
over traditional way of doing a trade.

iv
Acknowledgements
I take this opportunity to express my profound gratitude and deep regards to my
guide Professor and Mentor Andrew Quinn for his exemplary guidance, monitoring
and constant encouragement throughout the course of this thesis. The blessing, help
and guidance given by him time to time shall carry me a long way in the journey of
life on which I am about to embark.
I would like to thank my parents, brother, sisters and friends for their constant
encouragement without which this assignment would not be possible for believing in
me and supporting me in difficult moments.

v
Contents
Abstract…………………………….…………………………………………………………………………..iii Acknowledgements………………………………………………………………………………………...iv 1. Introduction ..................................................................................................... 1
1.1 Problem Definition .................................................................................... 5 1.2 Objective of the research .......................................................................... 8 1.3 Dissertation Roadmap ............................................................................... 8 1.4 Scope and limitations of research ............................................................... 9 1.5 Major Contribution .................................................................................... 9
2. Literature Review ........................................................................................... 11 2.1 Literature Introduction ............................................................................... 11 2.2 Literature theme: Financial market analysis - Fundamental v/s Technical ...... 11 2.3 Literature theme: Technical analysis and its types ....................................... 15 2.4 Literature theme: Candlestick Chart Patterns ............................................... 21 2.5 Literature Conclusion ................................................................................. 31
3. Methodology .................................................................................................. 33 3.1 Methodology Introduction .......................................................................... 33 3.2 Data ......................................................................................................... 35
3.2.1 Data used ............................................................................................ 35 3.2.2 Market Selection .................................................................................. 39 3.2.3 Data Source ........................................................................................ 42
3.3 Research Methods ..................................................................................... 44 3.3.1 Targets and Stop Losses ...................................................................... 45 3.3.2 Behavioural Finance ............................................................................. 50 3.3.3 Oversold and Overbought ..................................................................... 50 3.3.4 Patterns used and strategies employed ................................................. 51
3.5 Assumptions .............................................................................................. 69 3.6 Limitations of Methodology ........................................................................ 70 4.1 Introduction .............................................................................................. 71 4.2 Results and Findings: Traditional Approach ................................................. 72 4.2.1 Overall Returns: Traditional Approach ...................................................... 75 4.3 My Strategy: Getting Odds in Favour .......................................................... 77 4.3.1 Detailed Explanation of Strategy: Bullish Engulfing Pattern ........................ 77 4.3.2 Overall Returns: My Strategy V/s Traditional Strategy ............................... 86 5.1 Discussion ................................................................................................. 91 5.1.1 Effectiveness of the Candlestick Patterns by using Traditional Approach ..... 91 5.1.2 Effectiveness of the Proprietor Strategy v/s Traditional ............................. 92 5.1.3 Major Limitation...................................................................................... 93 5.2 Conclusion ................................................................................................ 94 5.3 Significance of the research ....................................................................... 95 5.4 Future recommendations ........................................................................... 95 6.1 Individual Learning Style ............................................................................ 96 6.2 Dissertation Process................................................................................... 97 6.2.1 Undertaking the Literature review ............................................................ 97

vi
6.2.2 Writing the Methodology ......................................................................... 98 6.2.3 Primary Data Collection ........................................................................... 99 6.2.4 Data Analysis and Findings ...................................................................... 99 6.3 Conclusion ................................................................................................ 99
References ...................................................................................................... 101
Figure 1: Refining the Research Topic ................................................................... 3 Figure 2: Typical Candlestick Chart ....................................................................... 4 Figure 3: Moving Averages ................................................................................. 19 Figure 4: MACD ................................................................................................. 20 Figure 5: Candlestick: The Basic ......................................................................... 21 Figure 6: Hammer and Hanging Man ................................................................... 23 Figure 7: Engulfing Patterns ............................................................................... 25 Figure 8: Dark Cloud Cover ................................................................................. 27 Figure 9: Piercing Lines ...................................................................................... 28 Figure 10: Morning Star ...................................................................................... 29 Figure 11: Evening Star ...................................................................................... 29 Figure 12: Doji ................................................................................................... 30 Figure 13: Crude Oil Volatility ............................................................................. 41 Figure 14: How data is taken .............................................................................. 43
Graph or Pie Chart 1: Occurrence of Bullish Patterns ............................................ 72 Graph or Pie Chart 2: Occurrence of Bearish Patterns ........................................... 73 Graph or Pie Chart 3: Returns generated by Bullish Patterns ................................. 74 Graph or Pie Chart 4: returns Generated by Bearish Patterns ................................ 75 Graph or Pie Chart 5: Crude Oil: Behaviour after Bullish Engulfing Pattern ............. 78 Graph or Pie Chart 6: Natural Gas: Behaviour after Bullish Engulfing Pattern ......... 81 Graph or Pie Chart 7: Gold: Behaviour after Bullish Engulfing Pattern .................... 83 Graph or Pie Chart 8: Silver: Behaviour after Bullish Engulfing Pattern .................. 85
Table 1: General Returns based on Time Frame ................................................... 38 Table 2: Returns: Traditional Approach ............................................................... 76 Table 3: Crude Oil: Behaviour after Bullish Engulfing Pattern ................................ 78 Table 4: Natural Gas: Behaviour after Bullish Engulfing Pattern............................. 81 Table 5: Gold: Behaviour after Bullish Engulfing Pattern ....................................... 84 Table 6: Silver: Behaviour after Bullish Engulfing Pattern ...................................... 85 Table 7: Returns: My Strategy vs. Traditional ...................................................... 87
Appendix 1: Research files submitted ................................................................ 103
1
1. Introduction
According to Investopedia.com (10), the financial market is a broad term
describing any marketplace where trading of securities including equities, bonds,
currencies and derivatives and Commodities including precious metals, energy and
agricultural products occurs. Although some financial markets are very small with
little activity, some financial markets including the New York Stock Exchange (NYSE)
and the Forex markets trade trillions of dollars of securities daily.
The financial market place has advanced altogether amid the most recent
decade. Investment and hedging strategies have changed likewise. Market
participants or investors have been using different strategies that would enable them
to generate maximum returns with minimum risk. Investment fund managers and
risk managers, for example, consult fundamental analysis, value investing strategy,
technical analysis and any other possible tool they could add to their trading-
strategies portfolio (Aisha A.A, 2013, P.4).
According to Duy Tan Vo (2009), Professional and practitioner traders try to
trade in the ways they think is the best to have a steady income. They try to find
profit, weather it is short term or long term. Traders or investors start their day
“reading the Financial Times” and they keep themselves updated with the financial
market news, trends etc. or on the news channels or on the investors websites. In
other words, they are trying to analyse the market in order to make better trades
than their peers and make profit.
2
“Financial Market Analysis deals with the performance of a particular financial
market(s)”(economywatch.com). Analysis of the financial markets has gotten to
be one of the principle exercises covering a large number of variables both inside
the market sector and outside it. For example, when the government of the nation
where the market is located, declares another policy measure it will have significant
effect on the market. “Financial market analysis has become a highly specialized
activity confined to select groups of experts known as technical analysts“.
There are broadly two types of Analysis to understand the financial market.
1. Fundamental Analysis
2. Technical Analysis
According to Jan Ivar Larsen (2010), “Fundamental analysis is the traditional
approach involving a study of organization fundamentals such as revenues and
expenses, annual growth rates, market position. Technical analysis, on the other
hand, is absolutely based on the study of historical prices and trends.” There are
various types of Technical Analysis involved too predict the market based upon the
historical price and trends. Each have different techniques and each generate
different profitability according to the market they have been used. There is a huge
evidence that technical analysis is been used widely, however, some traders or
market analysts returns or prices are not predictable and therefore, technical
analysis cannot be used to predict the future prices. This debate continues for over
fifty years (Benjamin.R, 2005, P.1).
3
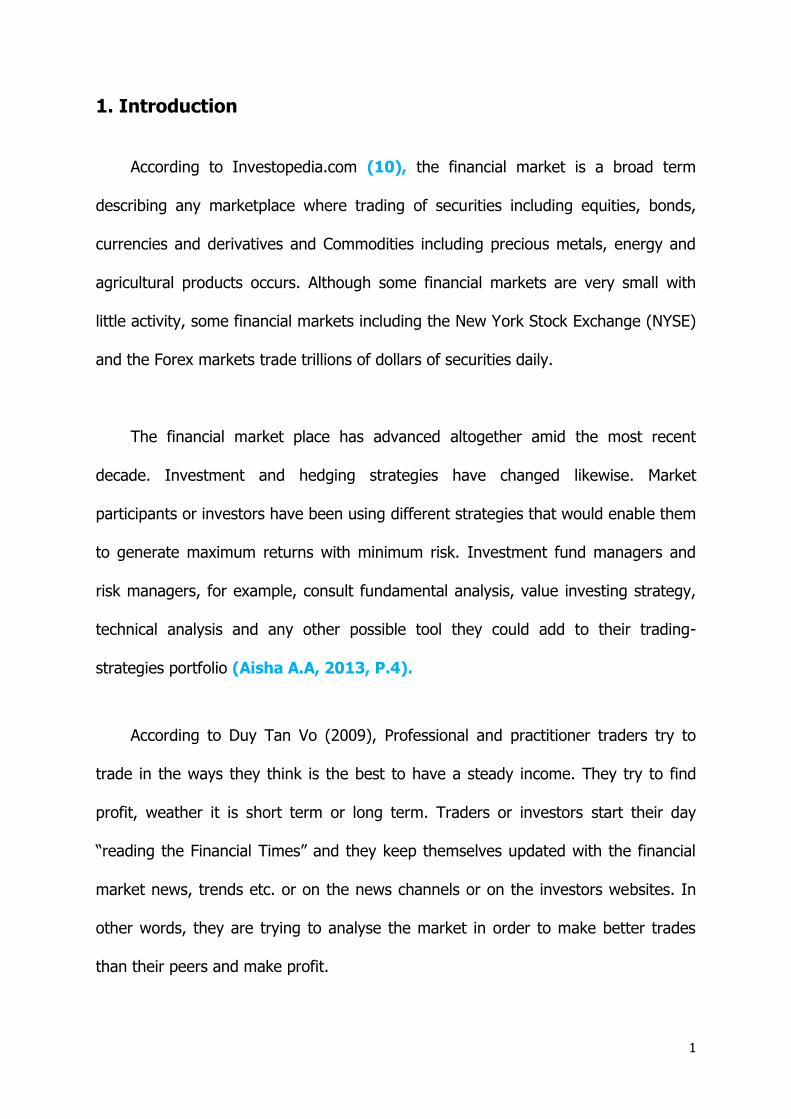
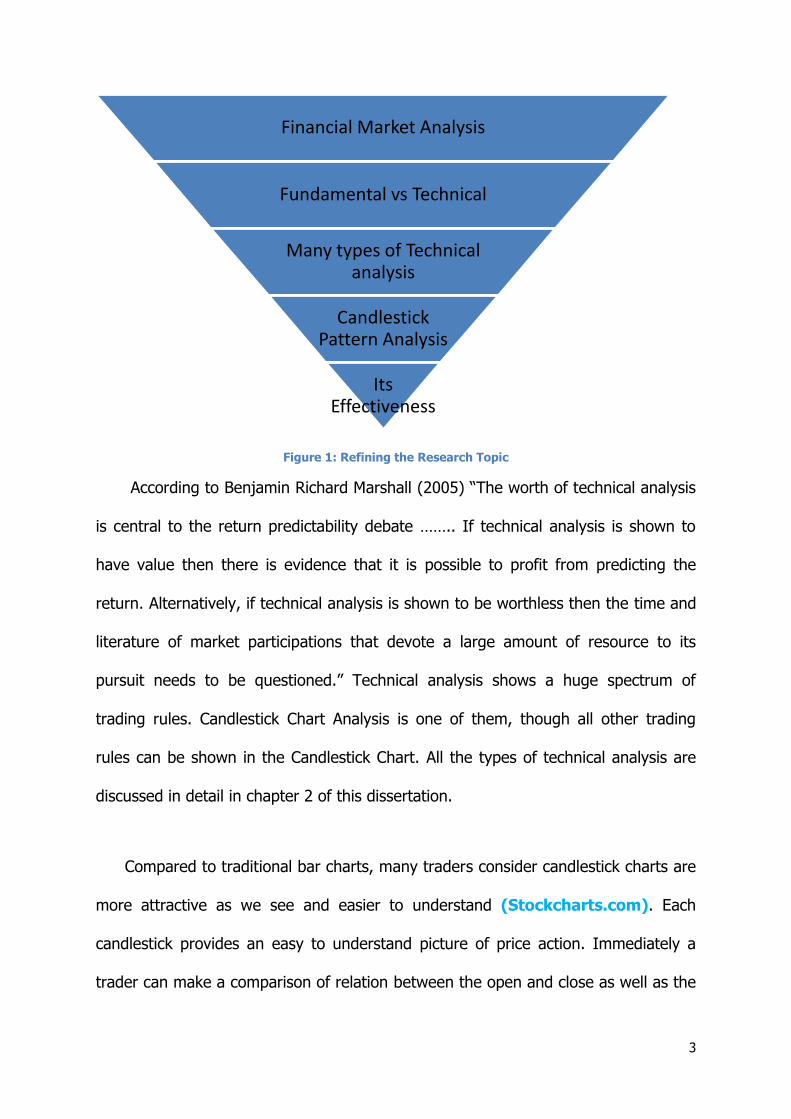
Figure 1: Refining the Research Topic
According to Benjamin Richard Marshall (2005) “The worth of technical analysis
is central to the return predictability debate …….. If technical analysis is shown to
have value then there is evidence that it is possible to profit from predicting the
return. Alternatively, if technical analysis is shown to be worthless then the time and
literature of market participations that devote a large amount of resource to its
pursuit needs to be questioned.” Technical analysis shows a huge spectrum of
trading rules. Candlestick Chart Analysis is one of them, though all other trading
rules can be shown in the Candlestick Chart. All the types of technical analysis are
discussed in detail in chapter 2 of this dissertation.
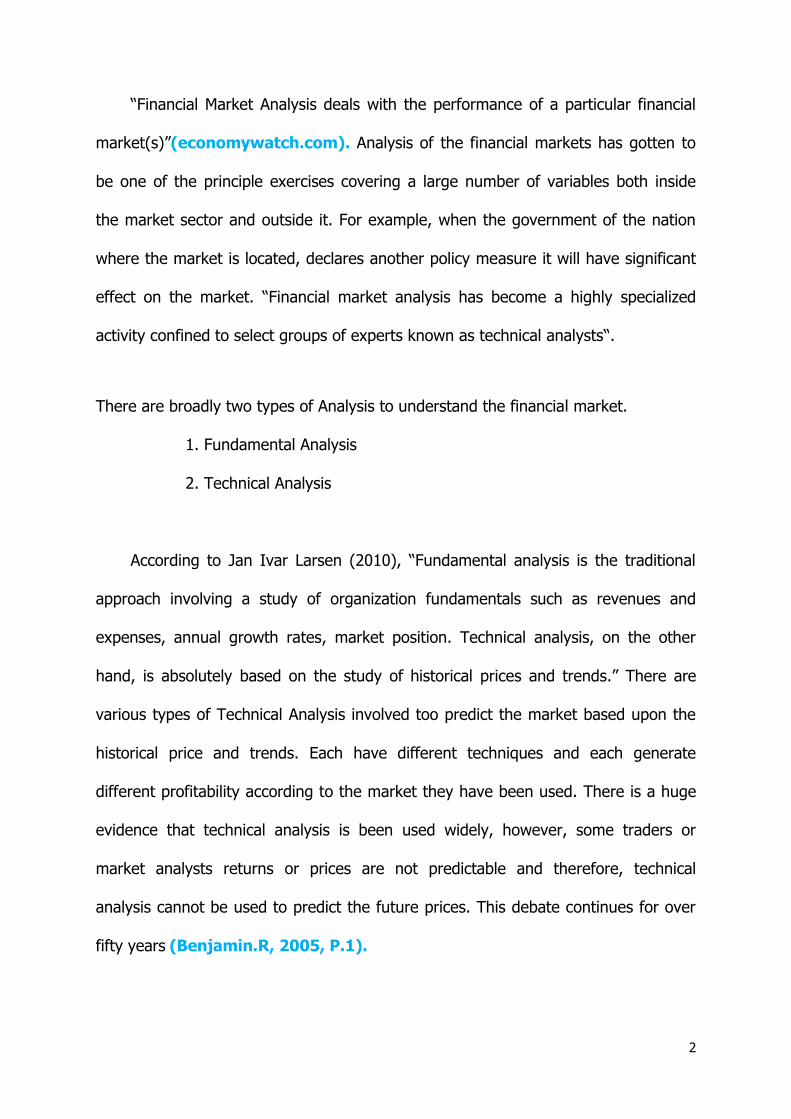
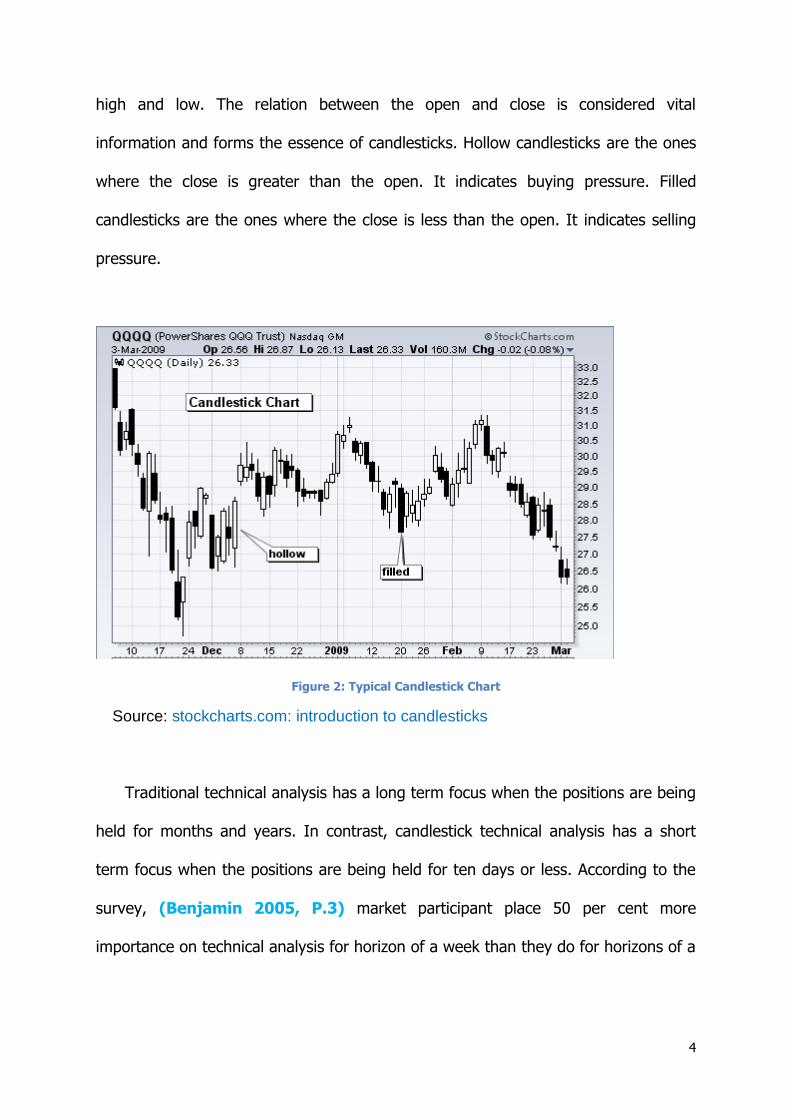
Compared to traditional bar charts, many traders consider candlestick charts are
more attractive as we see and easier to understand (Stockcharts.com). Each
candlestick provides an easy to understand picture of price action. Immediately a
trader can make a comparison of relation between the open and close as well as the
Financial Market Analysis
Fundamental vs Technical
Many types of Technical analysis
Candlestick Pattern Analysis
Its Effectiveness
4
high and low. The relation between the open and close is considered vital
information and forms the essence of candlesticks. Hollow candlesticks are the ones
where the close is greater than the open. It indicates buying pressure. Filled
candlesticks are the ones where the close is less than the open. It indicates selling
pressure.
Figure 2: Typical Candlestick Chart
Source: stockcharts.com: introduction to candlesticks
Traditional technical analysis has a long term focus when the positions are being
held for months and years. In contrast, candlestick technical analysis has a short
term focus when the positions are being held for ten days or less. According to the
survey, (Benjamin 2005, P.3) market participant place 50 per cent more
importance on technical analysis for horizon of a week than they do for horizons of a
5
year. Hence, candlestick technical analysis has its own importance which requires to
be studied.
Candlestick technical analysis was first introduced to western world by Steve
Nison in 1991 when he wrote his book titled Japanese Candlestick Charting
Techniques: A Contemporary Guide to the Ancient Investment Techniques of the Far
East. According to him, the system was completely unknown to the west and
doubted that Japanese were trying to keep it a secret or there may be lack of
information in the United States and other western countries. However, since its
introduction, trader have started to know about the candlestick chart patterns and
they have started use this knowledge widely.
There are different Financial Market Sectors including equities, bonds,
currencies and derivatives and Commodities. In this thesis, I will research on
profitability or effectiveness of Candlestick chart patterns in different commodities.
There are different commodities including precious metals like Gold, Silver, Copper,
Nickel etc. energies like Crude Oil, and Natural Gas and Agricultural commodities like
wheat, Cotton etc. In this thesis, I would include four commodities: Crude Oil,
Natural Gas, Gold and Silver. The reasons for selecting these commodities are
discussed in detail further in this dissertation.
1.1 Problem Definition
Commodity markets are one of the main targets for most of the market
participants. Market participants who access commodity market include traders, fund

6
managers, pension fund managers, banks, corporate and other financial institutions.
As per Steve Nison, since the introduction of candlestick chart to the western world,
candlestick technical analysis is widely used, available in almost every software and
online charting package. However, the effectiveness of these candlestick chart
patterns in today‟s highly competitive market (in our research we are dealing in
commodity market), considering the fact that candlestick chart patterns were based
upon human behaviour and that has changed a lot at the time when traders have all
knowledge access to candlestick chart patterns, needs to be researched.
The competiveness of trading in commodity market has increased globally.
According to the report published by the McKinsey and company (2012), in Geneva
alone, the number of commodity trading companies increased from 200 in 2006 to
400 in 2011 with many new players in the industry. This resulted in higher liquidity,
stronger competition and an erosion of trading margins. Because of higher
competitive pressure, traders now take more risk as locking in trading margins in
well-hedged positions becomes more difficult. This new behaviour of the traders
would affect the effectiveness of the candlestick chart patterns which was built on
the trial and error experiments based upon the human behaviour towards the
financial market for over past 200 years (Nison provides evidence of its use from
18th century).
The traders have more access and knowledge of candlestick chart patterns as
ever before. There is need for research weather market tends to react immediately
after the trend or pattern is formed due to the fact that traders are more

7
knowledgeable and have more access to candlestick chart patterns. Also, due to the
fact that nowadays, trading is done electronically, traders can buy or sell
immediately. Due to all these, a condition of Overbought or Oversold market can be
formed. An oversold asset is often considered to have a selling price that is too low
in comparison to the actual value of the asset and an overbought asset is often
considered to have a buying price that is too high in comparison to the actual value
of the asset (Investopedia.com, 12). Oversold or Overbought are generally
formed when market prices become very low or high respectively in shorter period
of time. Typically, market oversell or overbought due to an overreaction on the part
of investors regarding a piece of news or other information. During such conditions,
the market generally tends to reverse. This reversal due to Overbought or
Overbought can affect candlestick chart patterns and needs to be researched.
Considering the competitiveness and change in Human Behaviour, different
strategies are been developed by the traders and investors regularly. They try to put
all odds in favour before entering the trade. A biggest example could be keeping
target always more than stop losses, and if they can‟t do this, they don‟t trade even
if all analysis is favouring them. This approach is termed as Probability based Trade.
According to Futursmag.com, “probability-based trader is an individual who uses
historical data to assist, but not necessarily control, all elements of the trade
decision including selection, entry and exit criteria. In essence, it‟s a blend of both
discretionary and system trading that maximizes the advantages of each, while
minimizing the disadvantages of both.”

8
In this research, an example will be done on one of the trading pattern, for all
four commodities selected for research. The purpose of performing such an example
is to examine that a strategy can be developed better than existing technical
analysis, in this competitive environment.
1.2 Objective of the research
The main objectives of the research are as follow:
a. To examine the effectiveness or predictive power of four bullish and four bearish
Japanese candlestick patterns to forecast price movements or returns in four
selected commodities: Crude Oil, Natural Gas, Gold and Silver, by defining the
traditional approach for entry and exit strategies.
b. Try to examine that a strategy can be developed better than existing technical
analysis, in this competitive trading environment.
c. To contribute to the literature by providing an additional research on importance
of defining a trading strategy by each trader parallel to the exiting analysis.
d. To raise awareness of profitable trading strategies in commodity market that can
provide good trading opportunities for market participants, and can help them make
investment and hedging decisions.
1.3 Dissertation Roadmap
The remainder of the thesis is organised as follows: Chapter 2 contains a
review of the relevant literature. Chapter 3 contains Research Methodology and
Methods used to carry out the research. Chapter 4 includes analysis of the data and
relevant findings out of the data analysed. Chapter 5 discusses the relevant findings

9
which we could find after analysing the data. Chapter 6 concludes the research and
provides future recommendations. Chapter 7 contains the personal reflection.
1.4 Scope and limitations of research
Scope and Limitations are important part of any research. There are certain
limitations or boundaries for any research after which the research doesn‟t hold.
Following are the certain scope of this research:
Research is helpful for all the financial instruments including Equity, Bonds,
Forex, etc., though it had been done on commodity.
An approach to the trading strategy defined can be used for defining
strategies after other technical analysis as well, though it had been defined
after formation of candlestick patterns.
Following are the certain limitations of this research:
This research is limited to a specific Time Frame, in this thesis we used Daily
Time frame. For other time frames, intraday, weekly or monthly, a different
approach needs to be considered. For example, for Weekly and Monthly Time
Frame, other strong technical come into picture and for intraday, volatility
indicators play a big role.
As far as traditional entry and exit approach is considered, this research is
limited to defined Patterns.
1.5 Major Contribution
This research puts light on the importance of defining a trading strategy
parallel to the various existing strategies.

10
Research questions the traditional approach adopted after candlestick chart
pattern formation. Instead, it examines that a strategy can be developed to
increase profit by combing own approach with the traditional approach.

11
2. Literature Review
2.1 Literature Introduction
The Debate as to how one shall predict the return of particular asset continues
and will continue forever. The importance of this debate to the global economy has
resulted in the huge researches been done in the area of predicting return on the
particular asset. Assets are traded in market which we call as Financial Market.
The literature review is divided into three sections. The first section will briefly
introduce the financial market. It will describe the ways (fundamental and technical)
by which financial market is been analysed clearly stating the difference between
fundamental market analysis and technical market analysis. The second section
details the basics of the Technical analysis and briefly describes the different types
of technical analysis including the candlestick chart analysis. At last, third section will
emphasize more focus on candlestick chart analysis and detail different techniques
or patterns used in candlestick chart analysis.
2.2 Literature theme: Financial market analysis - Fundamental v/s
Technical
2.2.1 Financial Market
A financial market in a broad term describes any marketplace where buyers
and sellers indulge in the trade of assets such as equities, currencies, bonds and
derivatives. Financial markets basically involve transparent pricing, costs and fees,

12
basic regulations on trading and market forces determining the prices of securities
that trade.
Traders or investor weather new or practitioners, try to analyse the market to
predict the future price of a particular asset. Each wants to earn more and more
profit, in the greediness, they don‟t know the exact time to sell or exit from the
trade. It requires practise with knowledge to know when to enter and when to exit.
There are broadly two types of Analysis to understand the financial market.
1. Fundamental Analysis
2. Technical Analysis
2.2.2 Fundamental Analysis v/s Technical Analysis
In General, Fundamental analysis is the traditional approach involving a study
of organization fundamentals such as revenues and expenses, market position,
annual growth rates. Technical analysis, on the other hand, is absolutely based on
the study of historical prices and trends (8). There has always been a debate on
which methodology is better than the other one and whether they substitute or
supplement each other. The difference between the two can be understood on the
basis of Charts vs. Financial Statements, Time Horizon and Trading Versus Investing.
1. Charts vs. Financial Statements: Fundamental analysts focus on security
market price and its true values. In particular, they assess all the factors that
can affect the security market price in order to determine the intrinsic value

13
of that security. If the intrinsic value is below the market price, this means
that the security is overpriced and should be liquidated. However, if the
intrinsic value is above the market the price, it means that the security is
under-priced and it should be added to the portfolio (Aisha A.A, 2013, P.16).
Hence, fundamental analysis is concerned on the financial statements like
balance sheet, cash flow statement and income statement.
Technical analysis on the other hand sees the movement of the prices
and compares it with the historical trends. It has nothing to do with the
financial statements of the company or economic conditions of the nation.
Technical Analysts believe that prices are trade in trends and historical
patterns repeat themselves. They believe that the fundamental factors of the
securities are discounted and accounted for in the market price itself. The
recognition of historical price movements to forecast future directions goes
back to a number of editorials written by Charles Dow published between
1900 and 1902 in Wall Street Journal. These publications have encouraged
further research and revisit of existing literature to assess the profitability of
technical analysis (Aisha A.A, 2013, P.16).
2. Time Horizon: Fundamental analysis relatively consider long term approach
while technical analysis is spread between the short term as well as long
term. In fact the numbers for fundamental analysis comes in longer time
horizon like quarterly or annually whereas the numbers for technical analysis
are shown into the charts within minutes.

14
3. Trading Versus Investing: In general technical analysis is used for making
short trades and profiting in the short term where the investment and risk
involved is much lower. Fundamental analysis on the other hand is used for
investing and the risk involved is generally higher.
The literature shows evidence of a growing success of using technical and
fundamental analyses as complements in the trading strategy and investment
decisions. In fact, both analyses forecasting the market attempt to resolve the same
issue of determining future price directions. The fundamental analyst examines the
cause of the market direction, whereas the technical analyst studies the effect. At
the start of major market moves, usually fundamental analysts are not able to
explain what the market tends to do. This is the market stage when the two
approaches fail to agree with each other. However, at some stage later, the two
approaches do come back into sync, but not that early enough for the trader to
react. Another explanation for the discrepancies between the two is that market
price movements tend to lead fundamentals. Since the known fundamentals have
already been accounted for in the market, prices are currently responding to
unfamiliar fundamentals. History records that some of the major bull and bear
markets have started with little or zero perceived change in the fundamentals. At the
time these changes became familiar, the fresh trend is already in place. With the
passage of time, technical analysts can develop growing confidence in their price
chart signals and they become among the minority who can spot a change in trend
directions. They know at some stage that the reasons for that trend reversal will
become known to others.

15
2.3 Literature theme: Technical analysis and its types
2.3.1 Technical Analysis
Technical Analysis is been widely used nowadays. Investors, who rely on
technical analysis, have some advantages with respect to fundamental analysis. The
main advantage is that technical analysis is cheaper and can be applied more easily
on securities than fundamental analysis. Since technical analysis only uses historical
information, which is nowadays easily attainable on public databanks. Also
fundamental analysis in general is more complex, with use of firm specific factors,
although one can make technical analysis as complex as it can be.
According to Murphy (cited by Jan Ivar Larsen 2010, P.19), the technical
analysis is based on the three arguments. These are:
1. Market action discounts everything.
2. Prices move in trends.
3. History repeats itself.
Market action discounts everything: According to Murphy (cited by Jan Ivar
Larsen 2010, P.19) market action is defined as the sources of information
available to the investors i.e. Price and Volume data. By making an assumption that
market action discounts everything we are essentially assuming that everything that
could influence the price (that is, fundamentals, psychology, politics etc.) is
integrated and reflected in the price and volume data. In other words if the trend is
upwards i.e. if prices are increasing, than investor will think that whatever the
16
reason may be, demand is exceeding supply i.e. fundamentals are positive. Hence, it
makes trade based upon best price available.
Prices move in trends: The concept of trend is the most essential idea in the
technical analysis. Most technical indicators are designed to identify and follow
existing trends. Traders basically are looking for when doing technical analysis is
patterns in the price data that signal continuations or reversals in trend. During
continuation of the trend, the trader keeps his position. During reversal of the trend,
the trader exits its position making suitable profit. For example, if we hold a
particular stock or a commodity in an uptrend, we look for continuations in the
uptrend to confirm our position, and reversals so that we can exit the position before
The stock goes into a downtrend, thereby maximizing potential profits. When
analysing and picking stocks we thus look for stocks that are trending, try to analyse
the strength of the trend, and either buy or sell depending on our current position.
Thus, for the methods in technical analysis to have any value, we have to assume
that prices do form in trends.
History Repeats Itself: When trading with technical analysis traders examine
stock price data for price patterns that in some way predict the direction of price in
the future. They consequently have to assume that price patterns form with a
certain regularity and that price patterns that have been successful in the past will
be successful in the future. As financial markets are fuelled by human actions and
expectations, Murphy (1999) (cited in Jan Ivar Larsen 2010, P.20) attributes the

17
formation of regular and predictive price patterns and price calculations to a study in
human psychology and group dynamics which is the basis for behavioural finance.
2.3.2 Behavioural Finance
Behavioural finance looks at finance from a broader social science perspective,
including theory from psychology and sociology. Human desires, goals, motivations,
errors and overconfidence are thus included as factors that affect finance. It follows
hence that investors cannot be viewed as utility maximizing agents with rational
expectations. Rather, when two investors are confronted with the same price
information, their reactions will be different, and they will value the information in
different ways. When a trader buys a stock at a certain price p it is certainly with
expectations that it will rise. In much the same way, the seller at price p is probably
expecting the price to drop. Only one of them can win and make a profit. This
difference in valuation is what drives market changes, trends, and profitable
situations.
2.3.3 Types of Technical Analysis
Subjective Technical Analysis v/s Objective Technical Analysis
Technical analysis can be classified into two categories: subjective and objective
technical analysis (TA). Subjective TA refers to methods and patterns of analysis that
cannot be clearly defined. This leads to the conclusion that technical analysts are
open to personal views and interpretations when they use their technical trading

18
rules. This means that it is possible for different analysts using the same method of
same data sets, to have different findings. Thus, subjective trading rules cannot be
tested and they are exempted from empirical examinations. Examples of subjective
TA can include Gann Lines, trend channels, price chart patterns and divergences. On
the other hand, objective TA is clearly defined. When an objective trading rule is
applied on a market data set, its signals are very clear and there is no room for
ambiguity. This helps simulating technical methods on different historical data and
identifying their performance level accuracy. In other words, it allows back testing.
Thus, any objective method can be repeatable; it enables technical analysts and
academicians to re-test previous findings of profitable technical trading rules and
perhaps refute current statistical evidence. Examples of objective TA include moving
average crosses. (Aronson, 2007 cited in Aisha.A.A, P.21)
In a nutshell, one can distinguish between subjective and objective TA through using
the programmability criterion; that is, a method is considered objective only if it can
be implemented in a computer programme that can generate clear market positions.
Any other technical trading methods that cannot be programmed become subjective
by default. Subjective TA can be eliminated either through a shift into objective
methods or rejection. (Aronson, 2007 cited in Aisha.A.A, P.21)
Investors analyse the market by using different technical indicators based upon
trends, averages, relative strength, charting techniques, support and resistance etc.
The below shows a broad classification (9):

19
1. Stock Trends: To know the trend is important, however, it is very difficult for
the trader to find the trend as stock or a commodity can never fall or rise
continuously. They change their trends time to time. Generally, lower highs
and lower lows mean a downtrend, whereas higher highs and higher lows
indicate an uptrend (7). Trade lines are generally used to identify the trend.
2. Moving averages: Investors plot the 200-day moving average on the price
chart. A buy signal comes when the price of the stock rises above the moving
average line, and sell signal comes when the price falls below the moving
average line. One can also look the 50-day moving average or the 10-day
moving average. Trading is a game of probability. So, investor arrive at their
own methods to decide which parameters suit you the best.
Figure 3: Moving Averages
3. Relative strength Index (RSI): RSI compares the magnitude of recent gains to
recent losses to see if an asset is oversold or overbought. It is plotted on
specific scale usually 0-100. If the value is above 70, the stock is considered

20
as overbought and if the value is less than 30, the stock is considered as
oversold.
4. Moving average convergence divergence (MACD): The MACD consists of two
line, fast line and slow line. The difference between two lines is the moving
averages like slow line may consist of 9 day moving average while fast line
may be the difference between 26 day moving average and 12 day moving
average (It is generally the standard). The signals are shown when one line
crosses the other.
Figure 4: MACD
5. Fibonacci Retracement: It is based on the theory or assumption that market
retrace whenever it reaches to specific number or percentages, the best
known of which are 38.2%, 50% and 61.8%. So, when the market retraces
38%, it will generate either a sell or a buy call depending on the trend.
6. Support and Resistance: Market trend to reverse trend when it approaches
support or resistance areas. Support and resistance are the areas where
market had reversed in the history.

21
7. Candlestick Chart Patterns: These patterns are set of patterns shown by the
market when it is plotted in the candlestick chart (discussed in detail in next
section of literature review).
2.4 Literature theme: Candlestick Chart Patterns
2.4.1 Candlestick Chart: The Basic
The technique candlestick chart was developed in Japan and is comparatively
to the rest of the world include Europe and Third world countries like India. The
traditional bar chart lines and candlestick chart lines use the same data; it is easy to
see that they are drawn differently (Nison 1991, P.21).
Figure 5: Candlestick: The Basic
Source: Stockchart.com
The thick part that represents the opening and closing of the session forms the
real body. The thin lines above and below the real body are the shadows. These
shadows represent the session's price extremes. The shadow above the real body is

22
called the upper shadow and the shadow under the real body is known as the lower
shadow. The black or red candlestick represents that market opened high and closed
low. The white or green body represents that market opened low and closed at high.
2.4.2 Candlestick Chart: Reversal Patterns
A trend reversal signal shows that the previous trend is likely to change, but
that does not mean that it will necessarily reverse (Nison 1991, P.27). Trend may
reverse also and continue also; however, trend will stop during the reversal signal.
Reversal signal is just the alarming situation for the investors that become alert, the
trend may reverse. Most investors do mistake here only entering trade thinking that
trend will reverse after reversal signal.
Recognizing the emergence of reversal patterns can be a valuable skill.
Successful trading entails having both the trend and probability on your side. The
reversal indicators are the market's way of providing a road sign, such as "Caution—
Trend in Process of Change." In other words, the market's psychology is in
transformation. You should adjust your trading style to reflect the new market
environment. There are many ways to trade in and out of positions with reversal
indicators.
An important principle is to place a new position (based on a reversal signal)
only if that signal is in the direction of the major trend. Let us say, for example, that
in a bull market, a top reversal pattern appears. This bearish signal would not
warrant a short sale. This is because the major trend is still up. It would, however,

23
signal a liquidation of longs. If there was a prevailing downtrend, this same top
reversal formation could be used to place short sales.
Hammer and Hanging-man Lines: It is shown by candlesticks with long lower
shadows with small real body (real body may be black or white). If it appears during
downtrend than it is termed as „Hammer‟ and if it appears in uptrend than it is
termed as „Hanging-man‟ (Nison 1991, P.28-29). It signifies that the market had
touched the low and has reversed significantly during the session emphasizing that
trend will reverse for the further sessions to come.
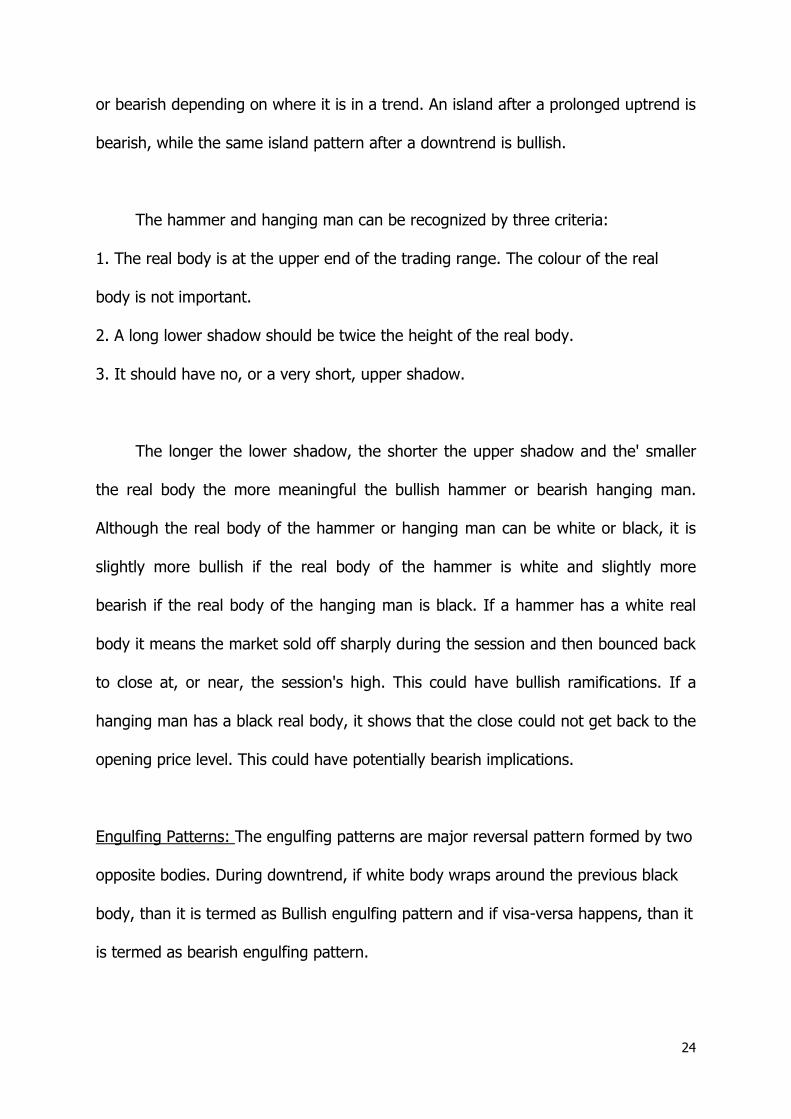
Figure 6: Hammer and Hanging Man
Source: Nison 1991, P.30
It may seem unusual that the same candlestick line can be both bullish and
bearish. Yet, for those familiar with Western island tops and island bottoms you will
recognize that the identical idea applies here. The island formation is either bullish
24
or bearish depending on where it is in a trend. An island after a prolonged uptrend is
bearish, while the same island pattern after a downtrend is bullish.
The hammer and hanging man can be recognized by three criteria:
1. The real body is at the upper end of the trading range. The colour of the real
body is not important.
2. A long lower shadow should be twice the height of the real body.
3. It should have no, or a very short, upper shadow.
The longer the lower shadow, the shorter the upper shadow and the' smaller
the real body the more meaningful the bullish hammer or bearish hanging man.
Although the real body of the hammer or hanging man can be white or black, it is
slightly more bullish if the real body of the hammer is white and slightly more
bearish if the real body of the hanging man is black. If a hammer has a white real
body it means the market sold off sharply during the session and then bounced back
to close at, or near, the session's high. This could have bullish ramifications. If a
hanging man has a black real body, it shows that the close could not get back to the
opening price level. This could have potentially bearish implications.
Engulfing Patterns: The engulfing patterns are major reversal pattern formed by two
opposite bodies. During downtrend, if white body wraps around the previous black
body, than it is termed as Bullish engulfing pattern and if visa-versa happens, than it
is termed as bearish engulfing pattern.

25
There are three criteria for an engulfing pattern:
1. The market has to be in a clearly definable uptrend or downtrend, even if the
trend is short term.
2. Two candlesticks comprise the engulfing pattern. The second real body must
engulf the prior real body (it need not engulf the shadows).
3. The second real body of the engulfing pattern should be the opposite colour
of the first real body. (The exception to this rule is if the first real body of the
engulfing pattern is so small it is almost a doji (or is a doji). Thus, after an
extended downtrend, a tiny white real body engulfed by a very large white
real body could be a bottom reversal. In an uptrend, a minute black real body
enveloped by a very large black real body could be a bearish reversal
pattern).
Figure 7: Engulfing Patterns
Source: Nison 1991, P.39
Some factors that would increase the likelihood that an engulfing pattern
would be an important reversal indicator would be:

26
1. If the first day of the engulfing pattern has a very small real body and the second
day has a very long real body. This would reflect a dissipation of the prior trend's
force and then an increase in force behind the new move.
2. If the engulfing pattern appears after a protracted or very fast move. A protracted
trend increases the chance that potential buyers are already long. In this instance,
there may be less of a supply of new longs in order to keep the market moving up. A
fast move makes the market overextended and vulnerable to profit taking.
3. If there is heavy volume on the second real body of the engulfing pattern. This
could be a blow off.
4. If the second day of the engulfing pattern engulfs more than one real body.
Dark cloud Cover and Piercing Pattern: Dark Cloud Cover is formed by two
candlesticks, on the first day, a white body is formed and on the second day the
session opens higher than the previous high and closes near to the low of previous
candlestick. Piercing pattern is just opposite to the dark cloud cover.
The following is a list of some factors that intensify the importance of dark-
cloud covers:
1. The greater the degree of penetration of the black real body‟s closes into the prior
white real body, the greater the chance for a top. If the black real body covers the
prior day's entire white body, a bearish engulfing pattern would occur. The dark-
cloud cover's black real body only gets partially into the white body. Think of the
dark-cloud cover as a partial solar eclipse blocking out part of the sun (that is,

27
covers only part of the prior white body). The bearish engulfing pattern can be
viewed as a total solar eclipse blocking out the entire sun (that is, covers the entire
white body). A bearish engulfing pattern, consequently, is a more meaningful top
reversal. If a long, white real body closes above the highs of the dark-cloud cover,
or the bearish engulfing pattern, it could presage another rally.
2. During a prolonged uptrend, if there is a strong white day which opens on its low
(that is, a shaven bottom) and closes on its high (that is, a shaven head) and the
next day reveals a long black real body day, opening on its high and closing on its
low, then a shaven head and shaven bottom black day have occurred.
3. If the second body (that is, the black body) of the dark-cloud cover opens above
a major resistance level and then fails, it would prove the bulls were unable to take
control of the market.
4. If, on the opening of the second day there is very heavy volume, a buying blow
off could have occurred. For example, heavy volume at a new opening high could
mean that many new buyers have decided to jump aboard ship. Then the market
sells offs.
Figure 8: Dark Cloud Cover
Source: Nison 1991, P.44

28
Figure 9: Piercing Lines
Source: Nison 1991, P.49
2.4.3 Candlestick Chart: Stars
A star is a small real body that gaps away from large real body. The colour of
the star is not important and they occur at tops and bottoms. The star is a part of
four reversal patterns (Nison 1991, P.56):
1. The morning star: It is a reversal pattern from the bottom. It consists of tall,
black real body followed by a small real body which gaps lower. These two
candlesticks for the pattern. The third candlestick is a white real body that
moves up and is in the range of first candlestick. This pattern signifies that
the bulls have taken the control and market shall trend upwards.

29
Figure 10: Morning Star
Source: Nison 1991, P.57
2. The evening Star: The evening star is just opposite to the morning star i.e. it
is a bearish pattern. It occurs in the same way as the morning star but at the
top and candlesticks colour is just opposite.
Figure 11: Evening Star
Source: Nison 1991, P.59
Some factors that would increase the likelihood that an evening or morning
star could be a reversal would include:
1. If there is a gap between the first candlestick's and star's real bodies and then in
the star's and third candlestick's real bodies;
2. If the third candlestick closes deeply into the first candlestick's real body;

30
3. If there is light volume on the first candlestick session and heavy volume on the
third candlestick session. This would show a reduction of the force for the prior
trend and an increase in the direction force of the new trend.
3. The Doji Star: A doji is represented by a small real body with shadows at both
the directions. The doji signifies that the market is in unstable condition i.e. it
does not know where it has to go. It occurs when nearly half of the investors
are predicting one direction and other half is predicting the other direction. A
doji acts in its own ways depending on when it occurs. Doji is just a warning
that trend may change; it is confirmed only after the preceding candlestick.
Doji during top of uptrend and bottom of downtrend mark reversal and doji
during the sideways trend (i.e. market is neither showing uptrend nor
downtrend) has no meaning.
Figure 12: Doji
Source: Nison 1991, P.65
4. The Shooting Star and inverted-hammer: It is again a two line pattern which
gives warning for a trend reversal from top. It has a small real body at the
lower end with a long upper shadow. As with all stars, the colour of the real

31
body may be black or white, it is not important. The shooting star pictorially
tells us that the market opened near its low, then strongly gained pace and
finally it came back to close near the opening. In other words, that session's
rally could not be sustained. A shooting star shaped candlestick after a
downturn could be a bullish signal. Such a line is called an inverted hammer.
2.4.4 Candlestick Chart: More Candlestick Chart Patterns
The further candlestick chart patterns rely on the fact that all the basic
patterns discussed above can be combined to form numerous chart patterns. Further
technical indicators discussed in technical analysis part of literature review, can also
be clubbed into the candlestick chart to predict the market. The technique depends
upon the investor to investor and the time horizon which investor is looking for. The
basic chart patterns are been discussed in the above section of literature review.
2.5 Literature Conclusion
As shown in the above in the literature review, there are numerous techniques
involved to predict the market. Some traders prefer fundamentals more while other
prefers technical analysis more. It is been shown that there were various traditional
technical analysis which western world and third world investors were using before
the introduction of candlestick chart patterns in 1991 by Steve Nison. The
candlestick charts formed additional technical analysis over the top of other
traditional analysis. Since its introduction, it has grown significantly.

32
However, with its growing interest, it has started to become competitive as
well. Using different approaches and strategies apart from traditional approach for
entry and exit becomes necessity for the traders and investors. Since the
introduction of candlestick chart, it has opened the doors of study of its effectiveness
in various financial markets. In our thesis, we are using this technique in commodity
market. We will try to define a strategy which shall be used above the traditional
approach.

33
3. Methodology
3.1 Methodology Introduction
The choice of Data and Methodology is most important to any research. The
technical trading rules vastly depend upon the given data chosen and the
methodology employed (Benjamin.R, 2005, P.60). Many technical trading rules
are been criticised due to the fact that technical rules behave differently for different
securities or commodities for different set of data. They behave differently for
different methodologies. In my research, careful consideration is given for the choice
of data and the methodology employed, so that such criticism does not come in this
dissertation.
Targets and stop losses are most important for a trader. For a good trade,
target should be more than the stop loss placed. This is due to the fact that even if
you are wrong for half of the cases (probability of 50 %); you make less loss and
earn more profit. In my research, for each of the pattern, proper stop loss and
target price is defined.
The human behaviour changes every second. Humans adapt to the situations
and change their behaviour accordingly. The methodology will also detail the
importance of behavioural finance in defining the trading strategy. The traders have
more access and knowledge of candlestick chart patterns as ever before. There is
need for research weather market tends to react immediately after the trend or
pattern is formed due to the fact that traders are more knowledgeable and have

34
more access to candlestick chart patterns. Also, due to the fact that nowadays,
trading is done electronically, traders can buy or sell immediately. Due to all these, a
condition of Overbought or Oversold market can be formed.
Apart from choice of Data and Methodology, Assumptions and Limitations are
important part of any research. Without Assumptions, the research cannot be carried
out and there are certain limitations or boundaries for any research after which the
research doesn‟t hold. According to Dr. Simon, Assumptions in your study are things
that are somewhat out of your control, but if they disappear your study would
become irrelevant and cannot be carried out. And Limitations are potential
weaknesses in your study and are out of your control. We find limitations in almost
everything we do. In my research, efforts have been made to notify all assumptions
made during carrying out research and to notify all limitations of the methodologies
been carried out. Proper justification shall be given for the notified assumptions and
limitations.
This section of the research starts with detailed description of the data chosen
with proper reasoning. We are using data for the four commodities: Gold, Silver,
Natural Gas and Crude oil. These four are the most commonly traded commodities
with high volumes. After that, detailed description of the methodology employed is
illustrated. There are eight Japanese candlestick reversal patterns used in the
analysis: four bullish patterns and four bearish patterns. The eight candle patterns
are tested for each of the four commodities chosen. The bullish patterns include the
hammer, the piercing lines, the doji star and the bullish engulfing, whereas the

35
bearish patterns include the hanging man, the dark-cloud cover, the shooting star
and bearish engulfing. Methodology includes when and where to buy (open or
close), where to place target and where to place stop loss. This includes outline of
the candlestick signal formed by open, close, high and low prices on a given day.
The section also states an example done after formation of one of the trading
pattern, for all four commodities selected for research. The purpose of performing
such an example is to examine that a strategy can be developed better than existing
technical analysis, in this competitive environment. Eventually, this section states the
assumptions and limitations for the research methods carried with proper
justification for all notified assumptions and limitations.
3.2 Data
This section is further divided into three sections. Section 1 puts light on the
type data used: Daily chart, Intraday Chart, Weekly chart or Monthly chart. In this
research we will be using Daily Chart. The section 1 will detail the reasons behind
selecting Daily chart and also detail the reasons behind not selecting other charts.
Section 2 explains the reasons behind selecting the four commodities: Gold, Silver,
Crude oil and Natural Gas in our research. Section 3 will list down the sources where
the data has been taken.
3.2.1 Data used
For an analysis and formation of candlestick pattern, four types of data for a
commodity or a security is most important: High, Low, Open and Close. These may
be for different time frames: Daily, Weekly, Monthly, and Hourly and so on.

36
However, time frame is very important. The effectiveness of the candlestick pattern
increases as the time frame increases (Apurva, 2014). For example, candlestick
pattern in Daily chart will be more effective than in hourly chart. According to
Apurva, charts can be constructed based on different time-frames. Following are the
ways charts can be constructed and there related benefits:
1. Intraday Chart: Intraday charts give you a detailed picture for the day's
movement. These charts can be used to view a single day's movement from
session opening to closing or many days intraday movement from opening to
closing. This chart is used to plot price movements during a trading session.
It would consist of all the data points between a market opening and closing.
The intraday chart basically is useful for intraday traders who have fewer
margins available and can trade only in day. However, the return for the
intraday traders is very less in long term perspective. The data for intraday in
the format of High, Low, Open and Close is available to the best of my
knowledge only for that particular day or few previous days. This data will not
be enough for carrying out research for the higher confidence level.
Moreover, intraday patterns are out of scope of our research as we need to
carry out research for maximizing the returns and in Intraday, returns are
very less and are based upon higher degree of speculations more rather than
technology.
2. Daily Chart: According to Apurva (2014), psychologically, daily price
movements are what affect the most to anyone in the financial markets. A

37
daily chart represents High, Low, Open and Close for the different sessions of
a security or a commodity (in our case, for different days). A lot of analysis is
done during the time when market is close. Hence, technically, all the analysis
is done on daily chart and more volume comes (and with volume more
confidence) when a pattern is formed in a daily chart. Another advantage of
looking at daily charts is that it makes our trading less emotional as it adds
only one new piece of information every day. So we can sit back and take a
prudent decision without worrying for tracking price change every minute.
Focusing on daily charts helps you avoid two biggest mistakes a common
trader does i.e. overtrading and overanalysing (Apurva, 2014). The data for
High, Low, Open and Close is easily available and accessible in many financial
websites. In my research, we are dealing with four commodities: Gold, Silver,
Crude Oil and Natural Gas. The data for these commodities is been taken
from the website: Investing.com. The detailed list will be listed in part 3 of
this section. The average return figures on daily charts fall into the category
that we can carry out our research.
3. Weekly chart: Weekly charts plot a whole week's price data. So a weekly
candle opening price would be Monday's open, and close would be Friday's
closing level. The highest and lowest that the stock or index may have
travelled during the whole week will become the high and low for the weekly
candle. The candles are less sensitive to price movements compared to the
daily chart. That's because it combines 5 days data points into 1 week. This
helps focus more on the trend rather than its sensitivity. Hence a stronger

38
trend is generated in weekly chart rather than Daily chart. However, signals
from weekly chart are very less and hence it sometimes frustrates Traders.
Therefore, In general, Traders don‟t trade on weekly basis. However, they
may refer to weekly chart or monthly chart for confirmation of trend. In our
research, weekly chart is out of scope of research as the number of trading
signals will be very less and hence data will be very small which will give
lower confidence.
4. Monthly Chart: Monthly charts are prepared using the same principles that are
used for preparation of weekly charts. The opening price of the first trading
day of a month's open is considered as the opening level for month. And the
last trading day's close is considered as closing level for the month. These
charts are mostly used by investors with a longer horizon. Again monthly
chart is out of scope of our research for the same reasons as weekly chart.
According to Apurva, Ideal Chart timeframes based upon market participation is as
follows:
Table 1: General Returns based on Time Frame
Market Participant Time in Position
Expected Returns in % per trade
Chart used for
Trend Determination
Entry & Exit Points
Long term investor Months to years 30% and higher Monthly Weekly
Intermediate term trader
Weeks to months
12%-30% Weekly Daily
Swing trader 3-20 days 6% - 20% Daily Hourly
Day trader Hours 0.5% - 2% Hourly 10 minute
Micro trader Seconds to minutes
A few pips 5 minute 1 minute
39
3.2.2 Market Selection
According to Rabah.A and others (2001), it had long been argued that market
pressures would eventually select those traders who are better adapted to the
prevailing conditions. It is therefore very important to test particular conditions (in
our case particular trading strategy) for particular market. Different markets differ
from each other in many ways like Volatility, Volume etc. For example Forex market
and commodity market is generally considered as more risky than the equity market.
However, it is also a fact that more the risk, more are the chances of return.
In our research, we are testing candlestick patterns on the few commodities:
Crude oil, Gold, Silver and Natural Gas. Commodity market is considered as
reasonably volatile and has reasonably well enough volume for the testing of the
candlestick patterns. Unlike equity market, commodity market is considered to follow
more technical trading rules rather than fundamental rules. Take for example crude
oil; nobody in the present scenario would have thought that Crude Oil prices will
drop from $100 per barrel to $35 per barrel (Mar-April, 2016) considering strong
fundamentals of strong demand. However, according to the basic technical trading
rule, history repeats itself. Hence, we see prices over here. Commodity market is
also considered reasonably volatile which suits to test the candlestick patterns. We
have selected two high volatile commodities: Crude Oil and Natural Gas and two
commodities which have volatility not that much high: Gold and Silver.
Gold: Since its discovery, gold has been considered a currency and an investment,
used to create political power and settle trades. In 1946, after World War II ended,

40
the Bretton Woods conference fixed the price of gold at $35 per ounce. Trading Gold
hence became pointless (tradegoldonline.com). This action culminated in 1974,
when the United States lifted a 41-year ban on the private ownership of gold by U.S.
citizens, allowing individuals to profit from trading gold. After that, the volatility
started in Gold-trading. Although, the Gold is not considered that much volatile as
energy commodities: Crude Oil and Natural Gas. However, the prices of gold started
to increase right after ban was lifted and skyrocketed to 2200 % increase in 1980‟s.
And then it dropped till 1999. Hence Volatility is not out of question either but in
general, it is considered low volatile.
Silver: For more than four thousand years, silver has been regarded as a form of
money and store of value. However, since the end of the silver standard, the value
of silver started to fluctuate. Its prices were however remained in proportion with
the gold. The average gold/silver price ratio during the 20th century, however, was
47:1 (17). In the gold lines, Silver prices also skyrocketed in 1980‟s and dropped
after that till 1999. Silver is considered more volatile than Gold, however it is
considered much less volatile than energy commodities: Crude Oil and Natural Gas.
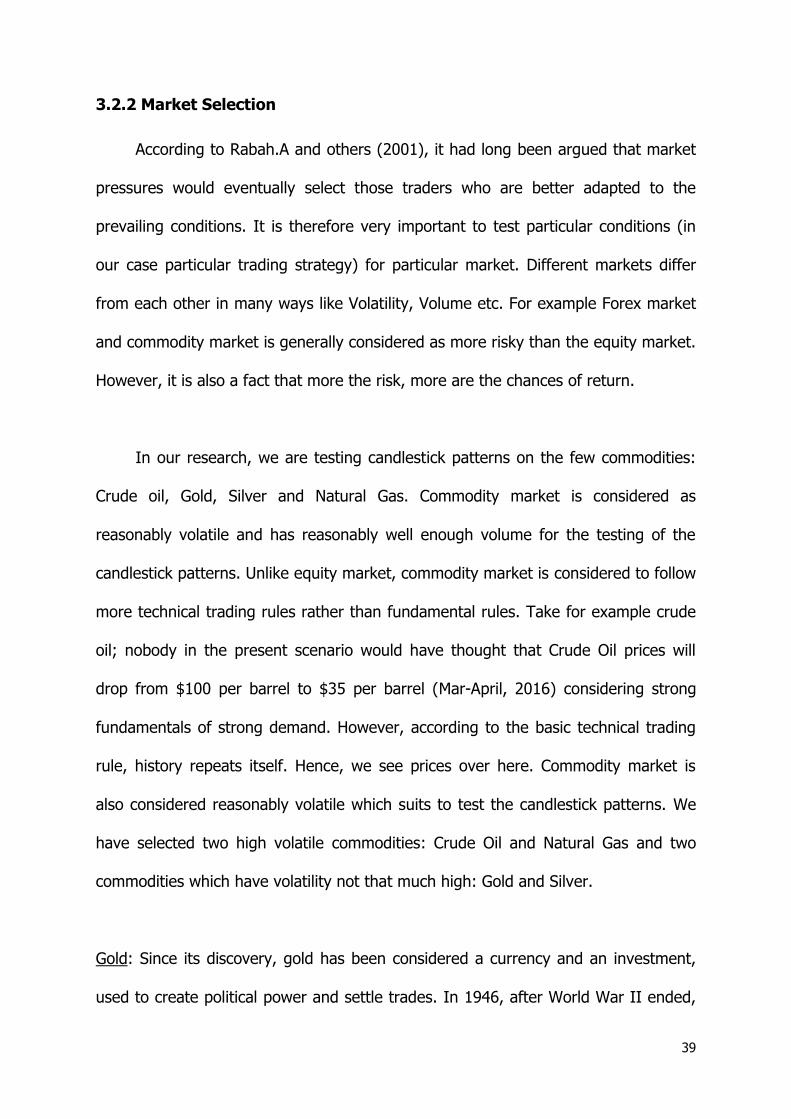
Crude Oil: Crude Oil is considered to be amongst the volatile commodity. According
to energyxxi.org, much of volatility of Crude Oil can be related to tensions in
the Middle East related to the Arab Spring. The political and in some cases
military upheavals in Libya, Egypt, Syria, and other countries, the boycott of
Iranian crude oil in response to its nuclear weapons program, and the risk of
terrorist attacks all have conspired to make oil markets more volatile. Greater

41
oil production from the United States, Canada, and other politically stable
countries, therefore, provides a critical hedge against price volatility. Crude Oil prices
are also greatly affected by the inventories. Inventory reports for crude oil generally
come on Wednesday of every week. However, it may come earlier and later days
depending upon the situation. During the inventory days, the Volatility is generally
high.
Figure 13: Crude Oil Volatility
Source: energyxxi.org
42
Natural Gas: On the lines of Crude oil, Natural Gas is also considered to be most
Volatile Commodity. The Volume in Natural Gas Trading is less as compared to
Crude Oil and hence, it is considered to be more volatile than crude oil. Natural Gas
prices are greatly affected by the variation in natural gas storage, production,
imports or delivery constraints (eia.gov). Natural Gas is more volatile on inventory
days which in general fall on every Thursday of a week. The day however can
change depending upon situation.
Although other commodities can also be chosen for our research, however, these
four commodities have the higher volumes as compared to other commodities like
Cooper or Nickel etc. Candlestick pattern or technical analysis work well when
volume involved is more. Hence, this made me to choose these four commodities. I
further chose two high volatile commodities: Crude Oil and Natural Gas and two not
that much volatile commodity: Gold and Silver, to bring some variation in my
research.
3.2.3 Data Source
For an analysis and formation of candlestick pattern, four types of data for a
commodity or a security is most important: High, Low, Open and Close. These may
be for different time frames: Daily, Weekly, Monthly, and Hourly and so on. This
particular type of data can be found on various financial instrument websites. In our
research, we will be taking data from the following website: Investing.com

43
The data can be taken for the particular instrument from the “Historical Data”
section listed under “General” tab. Below is the snapshot from where and how the
data is been taken:
Figure 14: How data is taken
Source: Investing.com

44
3.3 Research Methods
According to Park and Irvin (2004, P.1); “The art of technical analysis, for it
is an art, is to identify a trend reversal at a relatively early stage and ride on that
trend until the weight of the evidence shows or proves that the trend has reversed”.
The main purpose of a trading system is to have a positive return on the long run.
Early studies revealed that technical analysis cannot predict the future entirely,
negative returns are unavoidable. To reduce the risk a stop-loss is used in the
defined trading strategy for each pattern. The entry strategy is defined for each
pattern whenever a pattern is formed. Description of Patterns used will be given in
this section.
The trading rules within technical analysis can be divided in objective and
subjective trading rules. The objective trading rules consist a mathematically
approach of historical prices. The subjective trading rule approaches the historical
prices by drawing support and resistances. Since the subjective aspect of technical
analysis cannot be computed on the Microsoft excel, objective trading rules will be
used in this thesis. Hence, support and resistance will not be in the picture in this
thesis anywhere.
The number of trading signals is also important for a trading system. Less
number generates frustration and that may lead to loss. Such behaviour can be
understood by the behavioural finance in trading. Also due to increase in
competitiveness and more access and knowledge to candlestick patterns, there are
chances of change in behaviour of a trader and there are also chances of

45
overbought and oversold conditions. The entry and exit strategy defined will
consider these factors as well.
This section starts with the importance of well-defined entry and exit
strategies with proper targets and stop losses. It will detail which factors shall be
taken into consideration and which factors are out of scope of this research. Than
the section will through some light on behavioural finance and define Oversold and
Overbought situations. Eventually the section will define the patterns used entry and
exit strategies will be defined for each pattern considering above discussed factors.
3.3.1 Targets and Stop Losses
A stop loss is the point or price beyond which if the current price of the stock
or a commodity goes, then you reverse your earlier position. A stop loss order
instructs your broker to sell when the price hits a certain point or price. The purpose
of stop loss is that you want to get out of the stock or a commodity before it falls
any further and it indicates maximum loss you are willing to absorb. Suppose you
have bought one commodity at $100 for a target of 105 or more. This places the
profit potential at 5%.But what about the loss potential or the exit strategy? The
above trade means you are ready to accept a profit of $5 per trade but have not
assumed of the condition in case the commodity goes down. The purpose of the
stop loss is to define the maximum loss you are willing to take for a profit potential
of $5 on a $100 commodity in this case. So for example if you have assigned a stop
loss of $97.5, then it suggests that you are willing to lose not more than $2.5 or

46
2.5% on a $100 commodity. Now if the commodity moves down you will not lose
more than $2.5 and this puts a limitation on your downside. Hence, stop losses
reduces loss if we are wrong and gives a chance of earning more if we are right.
Statistical performance of a trading signal has been difficult to obtain. The fact
that there have been severe misunderstandings by most investors of when a signal
is truly a signal has been a deterrent (Stephen.W.B 2002, P.3). Assuming that the
probabilities of making a profit from a signal is above 50%, maybe 60% or even
more, these doesn‟t guarantee a profit. The profit depends upon when you take
profit and when you exit if our trades are not going in our way. Ideally stop losses
should be placed at fewer gaps compared to the target. This is due to the fact that
even if you are wrong for half of the cases (probability of 50 %); you make less loss
and earn more profit.
According to Kotak Securities (22), below are the few factors to decide where to put
stop loss:
1. The amount we are willing to loose is the most important factor. Some say
that 2% is an ideal stop loss. Yet this can be tempered by other stop loss
strategy considerations, such as how much money you have in the position. If
you have a large amount of money in a position, 2% may be much more than
your willingness to lose. If so, you should set stop loss strategy accordingly.
However, if your account is small and you're not well diversified, a 2% stop
may be so tight that you stop out of the position almost immediately. If this is
47
the case, trader should think seriously about whether you have enough
money to trade.
2. Another stop loss strategy to take into account is how risky a trader believes
the trade to be. If he thinks the trade is a sure winner and market conditions
are favourable, he may give the position more room to move. But if he thinks
it's got only a fair chance of working out, or if the position has serious
potential to drop, he shall set a tight stop loss strategy.
3. It is also important to consider how volatile the position is. If the position
routinely moves up and down in a range of 15% or more over the course of
the day, you can't set tight stop loss strategy. If you do, you'll be taken out
by the position's normal volatility. If the position is choppy but too risky to
trade without tight stop loss strategy, you'd better look for a better position to
trade. If you have reason to be confident that the position will move upward
even if it swings around a bit first, it doesn't make sense to set a tight stop
loss strategy because you'll just stop out as it swings. However, if you think it
might possibly move up but will definitely drop if it slips below a certain price,
then tight stop loss strategy is a must.
4. Market conditions should always be an important part of your decision. If the
market is trending sharply upwards, tight stops may not be necessary. If
you're trying to go long in a bearish market, tight stops are absolutely
necessary. If the market is choppy that is if it has no clear direction or if it's
full of nervousness and fear, then use tight stop loss strategy.

48
There are other factors apart from these that shall prove to be the good
strategy. According to Stephen.W.B, 2002, if a trade is placed, and the basis of
being in the trade disappears immediately, then the trade should be liquidated
immediately. A good rule of thumb for protecting a newly established position is: If
the close of the entry day, the day after the formation of the buy signal, is more
than one-half way down the body of the previous day, close the position. Statistically
this represents that the sellers still have the upper hand. However, keep in mind that
a buy signal did form at the bottom of the trend.
Considering the above factors, a good stop less and target needs to be defined
differently for each pattern. Moreover, different commodities will respond to these
strategies differently as Volatility and Liquidity will come into picture.
The other important factor apart from Stop Loss and Target is when to enter
the trade. Not every trade is going to shoot straight up after the buy signal appears.
There will be many entry points that fit the perfect buying conditions, yet fade just
after you fill your position. As our data is based upon Close and Open positions,
hence either we can enter on the close, or we can enter on the next day opening
depending upon other factors like after confirmation of signal etc. The other entry
points are out of scope of this research.
Trail Stop Loss (Not in scope of research): Another important concept is Trail
Stop Loss. One of the greatest features of a trailing stop is that it allows you to

49
specify the amount you are willing to lose without limiting the amount of profit you
will take. According to Investopedia (23), let‟s assume following scenario:
Purchase Price = $10
Last Price at Time of Setting Trailing Stop = $10.05
Trailing Amount = 20 cents
Immediate Effective Stop Loss Value = $9.85
If the market price climbs to $10.97, your trailing-stop value will also rise to $10.77.
If the last price now drops to $10.90, your stop value will remain intact at $10.77. If
the price continues to drop, this time to $10.76, it will penetrate your stop level,
immediately triggering a market order. Your order would be submitted based on a
last price of $10.76. Assuming that the bid price was $10.75 at the time, the position
would be closed at this point and price. The net gain would be 75 cents per share
less commissions.
The Trail stop loss is based entirely upon highs or lows and dips or gains
respectively on a particular day. Hence, intraday prices needed to be tracked for trail
Stop loss. Therefore, Trail Stop Loss is out of the scope of this research. However,
this concept can be used in revising stop losses after day close if the target is not
reached that particular day. This will be suggested in further research and will not
be done in this research thesis.

50
3.3.2 Behavioural Finance
As discussed in the literature review under the section of technical analysis,
behavioural finance looks at finance from a broader social science perspective,
including theory from psychology and sociology. Human desires, goals, motivations,
errors and overconfidence are thus included as factors that affect finance.
Behavioural Finance is the main reason that gives birth to importance of defining a
trading strategy above the traditional approach. In this research, results are been
discussed in the Chapter 5 in the perspective that behavioural finance exits and
needs to be given importance.
3.3.3 Oversold and Overbought
The traders have more access and knowledge of candlestick chart patterns as
ever before. There is need for research weather market tends to react immediately
after the trend or pattern is formed due to the fact that traders are more
knowledgeable and have more access to candlestick chart patterns. Also, due to the
fact that nowadays, trading is done electronically, traders can buy or sell
immediately. Due to all these, a condition of Overbought or Oversold market can be
formed. An oversold asset is often considered to have a selling price that is too low
in comparison to the actual value of the asset and an overbought asset is often
considered to have a buying price that is too high in comparison to the actual value
of the asset (Investopedia.com, 12). Oversold or Overbought are generally
formed when market prices become very low or high respectively in shorter period
of time. Typically, market oversell or overbought due to an overreaction on the part
of investors regarding a piece of news or other information. During such conditions,

51
the market generally tends to reverse. This reversal due to Overbought or
Overbought can affect candlestick chart patterns and needs to be researched.
3.3.4 Patterns used and strategies employed
The two main objectives of this research apart from others discussed before
are to study the effectiveness of Candlestick Chart Patterns as defined by Steve
Nison by placing reasonable Targets and Stop Losses and second is to examine the
fact that a trading strategy can be developed to increase the return considering
present market competitiveness and immediate reaction or response of traders. This
section will detail the Candlestick Patterns used for our research, strategies
employed for testing by placing reasonable Targets and Stop Losses and will detail
my strategies referred in this research as “My Strategy” used for each pattern to
develop a model to maximise profit for each commodity. The strategy is developed
for one of the Pattern: Bullish engulfing Pattern for all four commodities. This is
done for the purpose of proving that a strategy can be developed above traditional
approach to give better returns. The strategies for other pattern should be
researched further and that will come under further recommendation section. The
results for strategy developed for each commodity will be explained in the Chapter
4: Data Analysis and Findings.
The Candlestick signals are in existence today because of their statistical
probabilities. As can be imagined, the signals would not be in existence today if they
did not produce profits. The purpose for utilizing the Candlestick signals developing
the trading strategy is to put as many probabilities in your favour as possible. The

52
basis of my strategy to develop a trading model for each commodity against each
pattern is based upon “Probability Based Trader” (Futuresmag.com).
According to Futursmag.com, “probability-based trader is an individual who
uses historical data to assist, but not necessarily control, all elements of the trade
decision including selection, entry and exit criteria. In essence, it‟s a blend of both
discretionary and system trading that maximizes the advantages of each, while
minimizing the disadvantages of both.”
Benefits of probability trading include:
Compensates for lack of trading experience
Excellent check and balance for discretionary decisions
Minimizes emotion
However, all methods have drawbacks, and probability trading is no different:
Requires years of historical data
Requires significant spread sheet or programming skills, or access to third-
party data
Can be difficult to interpret conflicting data
So Basic question arises how we will use historical data and try to put odds in
our favour. Let‟s assume a XYZ bullish trading pattern (meaning market shall trend
up) is formed on a day. Now based upon the historical data we can check, how
many times market opens above the last day close prices, how many times market
goes to at least 10 % or 20 % or 30 % and so on below close on next day, etc. etc.
53
Based upon this data we can decide where we need to buy so that all the odds are
in our favour and we are able to reduce loss as much as possible.
There are eight Japanese candlestick reversal patterns used in the analysis:
four bullish patterns and four bearish patterns. The eight candle patterns are tested
for each of the seven foreign currencies. The bullish patterns include the hammer,
the piercing lines, the Inverted Hammer and the bullish engulfing, whereas the
bearish patterns include the hanging man, the dark-cloud cover, the shooting star
and bearish engulfing. The reason of selecting these patterns is that they are very
popular and most of them are considered major reversal patterns. Another reason is
the ability to transform these candlestick patterns and practice them in a scientific
manner through using excel formulas that can describe and identify the patterns,
and enable back testing.
3.3.4.1 Bullish Engulfing Pattern
The bullish engulfing pattern is a major reversal signal that consists of two real
bodies of opposite colours. The market is in a downtrend; then a long white candle
closes higher and engulfs the previous black candle. This shows that the bulls have
taken over from the bears and that the buying pressure becomes stronger than the
selling pressure. As discussed in Literature review chapter in detail, there are three
criteria for an engulfing pattern:
1. The market has to be in a clearly definable downtrend and the first candle
real body should be black.

54
2. Two candlesticks comprise the engulfing pattern. The second real body must
engulf the prior real body (it need not engulf the shadows).
3. The second real body of the engulfing pattern should be the opposite colour
of the first real body i.e. it should be white.
Formula Defined in Excel: Using IF and AND excel functions, the following formulas
represent four columns: Column A represents Date, Column B represents Close,
Column C represents Open, Column D represents High and Column E represents
Low. If the formula start on line or row 4 that represents today; line 5 represents
yesterday, line 6 represents the day before yesterday and line 3 represents
tomorrow.
Formula Used:
IF ( AND ( ( C5 > B5) , ( B4 > C4 ) , (B4 > C5 ) , ( B5 > C4 ) ) , 1 , "")
Traditional Strategy: According to Steve Nison, ideally Market trends upward after
the formation of Bullish engulfing Pattern and chances are there for Gap up as well.
Hence, ideally a trader should make a position just before a close to expect good
returns. The trend vanishes if market closes below half the length of engulfing
candle at any preceding day. There is a greater probability that market will at least
move up from the close equal to length of engulfing candle. Target should be placed
accordingly. In our research we will be testing the Effectiveness of Bullish Engulfing
Pattern by making position near close (for ease we will always take price at close for
55
analysis) and placing target above close equal to length of engulfing candle and Stop
Loss below half the length of the candle. This also gives us the edge that Target will
be two times the stop loss which should be ideally used in our research as defined in
Target and Stop Loss section.
For example, for a close of 100 and length of engulfing candle equal to 1, Target =
101, Stop Loss = 99.5. However, on a particular day if market crosses both the
points i.e. 101 and 99.5 in the above example, than profit of loss will be decided by
Judging by the close on that day. If market closed near 99.5 than it should have hit
the target = 101 first and hence profit occurred and visa-versa. If by chance market
closes in middle after hitting both target and stop loss and no good judgement can
be made, than we vanish that trade and write profit/Loss = 0.
According to the above Traditional strategy, the Bullish Pattern will be tested for
6 years data for different commodities and results on returns and other things will
be analysed on the Data Analysis Section of Chapter 4. However, results for each
commodity will be different and may be negative as well depending upon number of
factors. Hence, in order to maximize the profit a strategy termed as “My Strategy” is
used to develop a model to maximise profit for each commodity. That is explained as
below:
My Strategy: As discussed, it will be a model to develop specific strategies for
different commodities to maximize the profit. Hence the bases of model will be
explained below and the analysis to define a strategy will be done in the Data

56
analysis section of this thesis. Further, this strategy will be developed only for this
pattern for all commodities with an objective of importance of developing a strategy
above traditional approach.
For Bullish Engulfing pattern, it is important to check the following things:
1. How many times market opens positive next day.
2. How many times market goes below 10 %, 20 % and so on of the close
3. How many times market if opened negative went below 50 %. This gives us
an indication that we can sell for at least target equal to 50 % of the length
of candle if market opens negative next day even after Bullish Pattern is
there. This is because of uncertainties of pattern validation when market
opened negative.
4. How many times market after opening negative and reaching below 50 % of
close, re-bounced (within next two days) to confirm the pattern and reached
50 % (of the length of candle) above the close without reaching 100 % (of
the length of candle) below the close. This will define a strategy to buy below
50 % of close for target 50 % above close, keeping the formula for Target =
2 times stop loss intact.
The calculations of the above stated points is done on the excel sheet for the data of
each commodities and submitted with this research thesis. The results and Analysis
for different commodities is explained in the Data Analysis section.

57
3.3.4.2 Bearish Engulfing Pattern
The bearish engulfing pattern is a major reversal signal that consists of two
real bodies of opposite colours. The market is in a uptrend; then a long black candle
closes higher and engulfs the previous white candle. This shows that the bears have
taken over from the bulls and that the selling pressure becomes stronger than the
buying pressure. Same criteria follows for bearish pattern as bullish engulfing
pattern but in opposite direction.
Formula Defined in Excel: Using IF and AND excel functions, the following formulas
represent four columns: Column A represents Date, Column B represents Close,
Column C represents Open, Column D represents High and Column E represents
Low. If the formula start on line or row 4 that represents today; line 5 represents
yesterday, line 6 represents the day before yesterday and line 3 represents
tomorrow.
Formula Used:
IF (AND ( ( C5 < B5 ), ( B4 < C4 ), ( B4 < C5 ), ( B5 <C4 ) ), 1,"")
Traditional Strategy: On the similar lines of Bullish engulfing Pattern, in our research
we will be testing the Effectiveness of Bearish Engulfing Pattern by making position
near close (for ease we will always take price at close for analysis) and placing
target below close equal to length of engulfing candle and Stop Loss above half the
length of the candle. This also gives us the edge that Target will be two times the

58
stop loss which should be ideally used in our research as defined in Target and Stop
Loss section.
For example, for a close of 100 and length of engulfing candle equal to 1, Target =
99, Stop Loss = 100.5. However, on a particular day if market crosses both the
points i.e. 99 and 100.5 in the above example, than profit of loss will be decided by
Judging by the close on that day. If market closed near 100.5 than it should have hit
the target = 99 first and hence profit occurred and visa-versa. If by chance market
closes in middle after hitting both target and stop loss and no good judgement can
be made, than we vanish that trade and write profit/Loss = 0.
According to the above Traditional strategy, the Bearish Engulfing Pattern will be
tested for 6 years data for different commodities and results on returns and other
things will be analysed on the Data Analysis Section of Chapter 4. However, results
for each commodity will be different and may be negative as well depending upon
number of factors.
3.3.4.3 Piercing Lines Pattern
The piercing lines are a two-day bullish pattern that signals a bottom reversal
after a downtrend. The first candlestick is a black body and the second day is a long
white body. The second day opens with a downside gap, below the low of the
previous day and closes higher and above the mid-point of the first black body. The
greater the penetration of the white bodies into the previous black body, the greater
the chance for bottom reversal. An ideal pattern requires a second day penetration
59
of more than 50% of the prior black real body. The psychology behind this pattern is
that the market is in a downtrend reflected in the first bearish black body. On the
next day, the market opens lower with a gap reflecting more bearish sentiment.
Suddenly the bulls take over and manage to close the market not only at previous
close but higher into the previous body mid-point or even slightly higher. The bears
will have their second thoughts about their short positions. The longs will see that
the new lows could not hold and probably it is time to go for long positions.
Formula Defined in Excel: Using IF and AND excel functions, the following formulas
represent four columns: Column A represents Date, Column B represents Close,
Column C represents Open, Column D represents High and Column E represents
Low. If the formula start on line or row 4 that represents today; line 5 represents
yesterday, line 6 represents the day before yesterday and line 3 represents
tomorrow.
Formula Used:
IF (AND ((B5<C5), (((B5+C5)/2) <=B4), (C4<B4), (B4<C5), (C4<B5)), 1,"")
Traditional Strategy: On traditional approach, in our research we will be testing the
Effectiveness of Piercing Lines Pattern by making position near close (for ease we
will always take price at close for analysis) and placing target above close equal to
length of Piercing candle (penetrating Candle) and Stop Loss below half the length
of the candle. This also gives us the edge that Target will be two times the stop loss

60
which should be ideally used in our research as defined in Target and Stop Loss
section.
For example, for a close of 100 and length of Piercing candle equal to 1, Target =
101, Stop Loss = 99.5. However, on a particular day if market crosses both the
points i.e. 101 and 99.5 in the above example, than profit of loss will be decided by
Judging by the close on that day. If market closed near 99.5 than it should have hit
the target = 101 first and hence profit occurred and visa-versa. If by chance market
closes in middle after hitting both target and stop loss and no good judgement can
be made, than we vanish that trade and write profit/Loss = 0.
According to the above Traditional strategy, the Piercing Lines Pattern will be tested
for 6 years data for different commodities and results on returns and other things
will be analysed on the Data Analysis Section of Chapter 4. However, results for each
commodity will be different and may be negative as well depending upon number of
factors.
3.3.4.4 Dark Cloud Cover
The dark-cloud cover is the opposite formation of the piercing lines pattern. It
is a two-day bearish pattern that signals a top reversal after an uptrend. The first
day is a long white real body. The second day opens above the high of the previous
day but closes near the low of the day within the previous day white body. The
greater degree of penetration into the previous day body, the more likely a top
reversal will take place. Some technical analysts require more than 50% penetration

61
of the second day close to the previous white real body. The psychology behind this
pattern is that the bulls are in full control when the second day open with an upside
gap; however, the bulls lose control and no continuation of the rally takes place.
Then the market closes near the close and the bulls will have a second thought
about their long positions.
Formula Defined in Excel: Using IF and AND excel functions, the following formulas
represent four columns: Column A represents Date, Column B represents Close,
Column C represents Open, Column D represents High and Column E represents
Low. If the formula start on line or row 4 that represents today; line 5 represents
yesterday, line 6 represents the day before yesterday and line 3 represents
tomorrow.
Formula Used:
IF (AND ((B5>C5), (((B5+C5)/2)>=B4), (C4>B4), (B4>C5), (C4>B5)), 1,"")
Traditional Strategy: On traditional approach, in our research we will be testing the
Effectiveness of Dark Cloud Cover Pattern by making position near close (for ease
we will always take price at close for analysis) and placing target below close equal
to length of Penetrating candle and Stop Loss above half the length of the candle.
This also gives us the edge that Target will be two times the stop loss which should
be ideally used in our research as defined in Target and Stop Loss section.

62
For example, for a close of 100 and length of engulfing candle equal to 1, Target =
99, Stop Loss = 100.5. However, on a particular day if market crosses both the
points i.e. 99 and 100.5 in the above example, than profit of loss will be decided by
Judging by the close on that day. If market closed near 100.5 than it should have hit
the target = 99 first and hence profit occurred and visa-versa. If by chance market
closes in middle after hitting both target and stop loss and no good judgement can
be made, than we vanish that trade and write profit/Loss = 0.
According to the above Traditional strategy, the Dark Cloud Cover Pattern will be
tested for 6 years data for different commodities and results on returns and other
things will be analysed on the Data Analysis Section of Chapter 4. However, results
for each commodity will be different and may be negative as well depending upon
number of factors.
3.3.4.5 The Hammer
The hammer is the third bullish candlestick pattern; it is a one-day pattern.
The body of the hammer can be white or black, but it is more bullish if the body is
white because it closes at the high. The hammer has a long lower shadow and
closes near the high of the session. The psychology behind this pattern is that the
market sells off sharply during the session but then bounces back at the close near
to the small body‟s high. The hammer may have no upper shadow or a very small
one enforcing bullish implications. This clearly shows that the bears have lost control
and they are now having second thoughts. The main characteristic of the bullish

63
hammer is that the lower shadow should be at least twice or three times the height
of the body.
Formula Defined in Excel: Using IF and AND excel functions, the following formulas
represent four columns: Column A represents Date, Column B represents Close,
Column C represents Open, Column D represents High and Column E represents
Low. If the formula start on line or row 4 that represents today; line 5 represents
yesterday, line 6 represents the day before yesterday and line 3 represents
tomorrow.
Formula Used:
For White body formation:
IF (AND ((B4>C4), ((C4-E4)>3*(B4-C4)), ((D4-B4) <0.3*(C4-E4))), 1,"")
For Black body formation:
IF (AND ((C4>B4), ((B4-E4)>3*(C4-B4)), ((D4-C4) <0.3*(B4-E4))), 1,"")
Traditional Strategy: On traditional approach, in our research we will be testing the
Effectiveness of Hammer Pattern by making position near close (for ease we will
always take price at close for analysis) and placing target above close equal to 2
times the length of lower shadow and Stop Loss below the lower shadow i.e. below
low. However, this doesn‟t ensure that target will be two times the stop loss. Placing
tight stop loss doesn‟t make sense according to phycology of the pattern. Hence this
is the major drawback of this pattern as the length of shadow can be as long as it
can be. There is no control over that. Hence Stop loss definition will be a major
concern.

64
For example, for a close of 100 and low of 98.8 and length of Shadow equal to 1,
Target = 102, Stop Loss = 98.8. However, on a particular day if market crosses
both the points i.e. 102 and 98.8 in the above example, than profit of loss will be
decided by Judging by the close on that day. If market closed near 98.8 than it
should have hit the target = 102 first and hence profit occurred and visa-versa. If by
chance market closes in middle after hitting both target and stop loss and no good
judgement can be made, than we vanish that trade and write profit/Loss = 0.
According to the above Traditional strategy, the Hammer Pattern will be tested for 6
years data for different commodities and results on returns and other things will be
analysed on the Data Analysis Section of Chapter 4. However, results for each
commodity will be different and may be negative as well depending upon number of
factors.
3.3.4.6 The Shooting Star
It is a one-day pattern with a small real body and a long upper shadow. The
small body can be white or black. This pattern looks like a shooting star with its tail
glowing in the sky. An ideal shooting star day opens with an upside gap, but this gap
is not always important. This pattern indicates that the market is rejecting a higher
high.
Formula Defined in Excel: Using IF and AND excel functions, the following formulas
represent four columns: Column A represents Date, Column B represents Close,

65
Column C represents Open, Column D represents High and Column E represents
Low. If the formula start on line or row 4 that represents today; line 5 represents
yesterday, line 6 represents the day before yesterday and line 3 represents
tomorrow.
Formula Used:
For Black body formation:
IF (AND ((B4<C4), ((D4-C4)>3*(C4-B4)), ((B4-E4) <0.3*(D4-C4))), 1,"")
For White body formation:
IF (AND ((C4<B4), ((D4-B4)>3*(B4-C4)), ((C4-E4) <0.3*(D4-B4))), 1,"")
Traditional Strategy: On traditional approach, in our research we will be testing the
Effectiveness of Shooting Star Pattern by making position near close (for ease we
will always take price at close for analysis) and placing target below close equal to 2
times the length of Upper shadow and Stop Loss above the upper shadow i.e. above
high. However, this doesn‟t ensure that target will be two times the stop loss.
Placing tight stop loss doesn‟t make sense according to phycology of the pattern.
Hence this is the major drawback of this pattern as the length of shadow can be as
long as it can be. There is no control over that. Hence Stop loss definition will be a
major concern.
For example, for a close of 100 and low of 101.2 and length of Shadow equal to 1,
Target = 98, Stop Loss = 101.2. However, on a particular day if market crosses
both the points i.e. 98 and 101.2 in the above example, than profit of loss will be
decided by Judging by the close on that day. If market closed near 101.2 than it

66
should have hit the target = 98 first and hence profit occurred and visa-versa. If by
chance market closes in middle after hitting both target and stop loss and no good
judgement can be made, than we vanish that trade and write profit/Loss = 0.
According to the above Traditional strategy, the shooting star Pattern will be tested
for 6 years data for different commodities and results on returns and other things
will be analysed on the Data Analysis Section of Chapter 4. However, results for each
commodity will be different and may be negative as well depending upon number of
factors.
3.3.4.7 The Hanging Man
The hanging man looks like a hammer; however, it forms after an uptrend
rather than a decline. Since the long lower shadow has a bullish implication, it is
best to wait for a bearish confirmation with this pattern. A lower opening below the
body of the hanging man on the second day and a lower close will be a good
confirmation of a top reversal. The psychology behind this is that when the market
closes on the next day below the body of the hanging man, the bulls who bought on
the open or close of the hanging man day will be left hanging with a bad position,
and are now more nervous for potential big losses. Thus, they may decide to cut
their losses and liquidate, adding more selling pressure.
Formula Defined in Excel: Using IF and AND excel functions, the following formulas
represent four columns: Column A represents Date, Column B represents Close,
Column C represents Open, Column D represents High and Column E represents

67
Low. If the formula start on line or row 4 that represents today; line 5 represents
yesterday, line 6 represents the day before yesterday and line 3 represents
tomorrow. Column N and O represents weather the Hammer is formed or not as
hammer becomes hanging man after bearish confirmation.
Formula Used:
IF (AND (OR (N5=1, O5=1), C4<C5, C4<B5, B4<C5, B4<B5), 1,"")
Traditional Strategy: On traditional approach, in our research we will be testing the
Effectiveness of Hanging Man Pattern by making position near close (for ease we will
always take price at close for analysis) and placing target below close equal to 2
times the length of lower shadow and Stop Loss above the previous day high when
hammer was formed. However, this doesn‟t ensure that target will be two times the
stop loss. Placing tight stop loss doesn‟t make sense according to phycology of the
pattern. Hence this is the major drawback of this pattern as the length of shadow
can be as long as it can be. There is no control over that. Hence Stop loss definition
will be a major concern.
According to the above Traditional strategy, the shooting star Pattern will be tested
for 6 years data for different commodities and results on returns and other things
will be analysed on the Data Analysis Section of Chapter 4. However, results for each
commodity will be different and may be negative as well depending upon number of
factors.

68
3.3.4.8 Inverted Hammer
The Inverted hammer is just opposite to the hanging man and formed after
the shooting star and looks like shooting star. Since the long upper shadow has a
bearish implication, it is best to wait for a bullish confirmation with this pattern. A
higher opening above the body of the inverted hammer on the second day and a
higher close will be a good confirmation of a reversal.
Formula Defined in Excel: Using IF and AND excel functions, the following formulas
represent four columns: Column A represents Date, Column B represents Close,
Column C represents Open, Column D represents High and Column E represents
Low. If the formula start on line or row 4 that represents today; line 5 represents
yesterday, line 6 represents the day before yesterday and line 3 represents
tomorrow. Column Q and R represents weather the shooting star is formed or not as
Shooting star becomes inverted hammer after bullish confirmation.
Formula Used:
IF (AND (OR (Q5=1, R5=1), C4>C5, C4>B5, B4>C5, B4>B5), 1,"")
Traditional Strategy: On traditional approach, in our research we will be testing the
Effectiveness of Inverted Hammer Pattern by making position near close (for ease
we will always take price at close for analysis) and placing target above close equal
to 2 times the length of upper shadow and Stop Loss below the previous day low
when shooting star was formed. However, this doesn‟t ensure that target will be two
times the stop loss. Placing tight stop loss doesn‟t make sense according to
phycology of the pattern. Hence this is the major drawback of this pattern as the
69
length of shadow can be as long as it can be. There is no control over that. Hence
Stop loss definition will be a major concern.
According to the above Traditional strategy, the Inverted Hammer Pattern will be
tested for 6 years data for different commodities and results on returns and other
things will be analysed on the Data Analysis Section of Chapter 4. However, results
for each commodity will be different and may be negative as well depending upon
number of factors.
3.5 Assumptions
Without Assumptions, the research cannot be carried out. Following are the
assumptions used to carry out the research:
On a particular day if market crosses both the points Target and Stop Loss,
than profit of loss will be decided by Judging by the close on that day. If it
closed near stop loss that means target should have hit first and Vice-versa.
If by chance market closes in middle after hitting both target and stop loss
and no good judgement can be made, than we vanish that trade and write
profit/Loss = 0.
If we make trade near close of the day, we shall assume that no volatility
happened at closing time, and pattern was formed as intended. Further, for
calculations, we shall assume the close price.
If for buy trade, market opens above the target or below the stop loss, than
targets and stop loss are written as next day open price for calculations and
also for getting real trade scenario where gap opening are common.

70
Mutually inclusive patterns are not considered. Even if one pattern occurs
immediately after another which contradicts the former, both the patterns are
calculated for returns separately. However, such scenarios are very rare.
3.6 Limitations of Methodology
Following are the certain limitations of the methodology:
As the returns are calculated on the basis of defined Target and Stop
Losses, this research limits to the point where market is running at some
time concept of Trail Stop Loss gives a good return. Trail Stop loss is out
of scope for this research. The reasons have been discussed in the Target
and Stop Loss section of this Methodology.
Research limits on considering Supports and resistance as this research is
completely based upon setting targets and Stop Losses according to the
length of candle. Subjective nature of support and resistance can‟t be
taken.

71
4. Data Analysis and Findings
4.1 Introduction
This Section of the thesis will display the results of our research and would put
light on certain findings. The basic things which we need to see are:
1. Number of times the different patterns, four bullish and four bearish patterns
had occurred for different commodities.
2. The returns given by different patterns for different commodities if we use
traditional strategy for buy and sell and keeping Targets and stop losses.
3. Based on Probability Based strategy discussed, we need to see the data
regarding how many times market opens above the last day close prices for
bullish pattern and Visa-Versa for bearish pattern, how many times market
goes to at least 10 % or 20 % or 30 % and so on below close on next day for
bullish pattern and Visa-Versa for bearish pattern, etc. etc. Based upon this
data we can decide where we need to buy so that all the odds are in our
favour and we are able to reduce loss as much as possible.
4. The above finding discussed in point 3 can also be helpful to put light on
volatility of a certain commodity.
5. Finally, we need to try and find out the strategy for trading for a particular
commodity to give good returns for each pattern.
This section starts with showing the results for number of occurrence of
different Bullish and Bearish Patterns for different commodities. Than it

72
highlight the returns generated by different Bullish and Bearish Patterns for
different commodities. Eventually, the data for different commodities
approach or behaviour after formation of different pattern will be shown
based upon the question like how many times market opened positive next
day, etc. etc. This will lead to finding a strategy that can be used for that
particular commodity for trading after a particular pattern is formed.
4.2 Results and Findings: Traditional Approach
0
20
40
60
80
100
Number of
times
Crude
Oil
NG Gold Silver
Commodity
Occurrence of Bullish Patterns
Bullish Engulfing
Piercing Lines
Hammer
Inverted Hammer
Graph or Pie Chart 1: Occurrence of Bullish Patterns
For the Bullish Patterns, it shall be seen that the number of times Bullish
Engulfing Pattern and the Hammer Pattern formed is more than the other two
patterns, Piercing Lines and Inverted Hammer. Usually this is expected also as
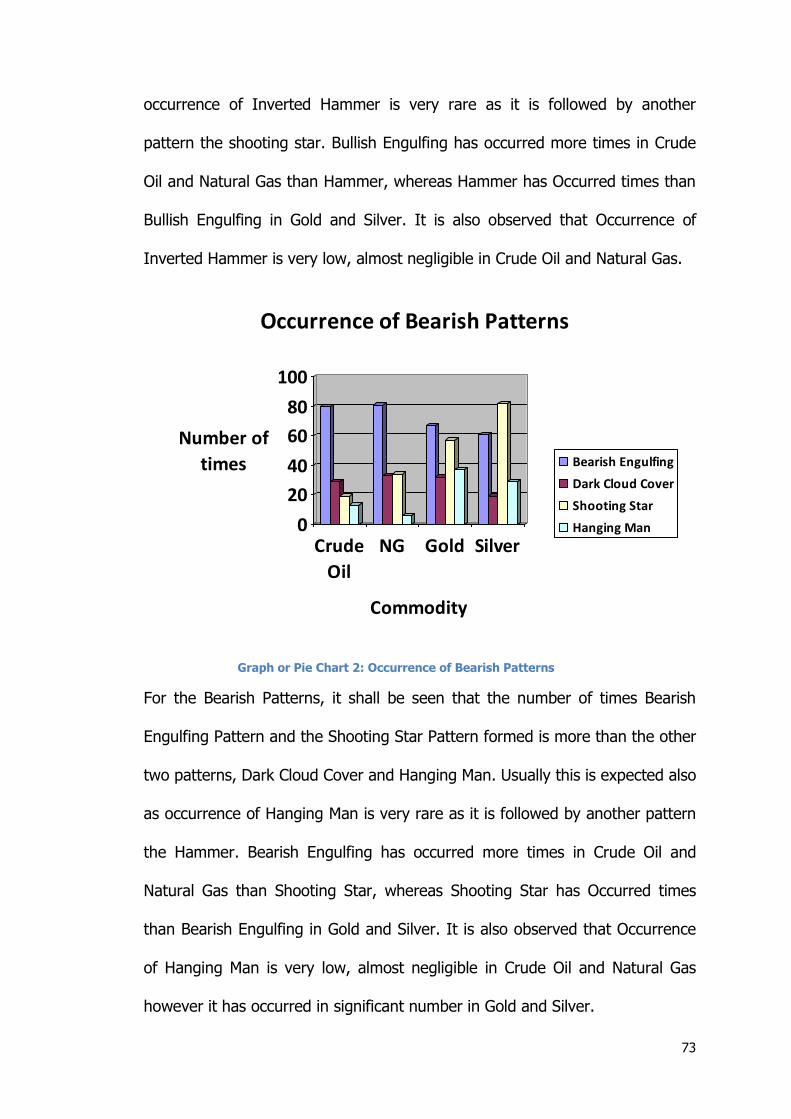
73
occurrence of Inverted Hammer is very rare as it is followed by another
pattern the shooting star. Bullish Engulfing has occurred more times in Crude
Oil and Natural Gas than Hammer, whereas Hammer has Occurred times than
Bullish Engulfing in Gold and Silver. It is also observed that Occurrence of
Inverted Hammer is very low, almost negligible in Crude Oil and Natural Gas.
0
20
40
60
80
100
Number of
times
Crude
Oil
NG Gold Silver
Commodity
Occurrence of Bearish Patterns
Bearish Engulfing
Dark Cloud Cover
Shooting Star
Hanging Man
Graph or Pie Chart 2: Occurrence of Bearish Patterns
For the Bearish Patterns, it shall be seen that the number of times Bearish
Engulfing Pattern and the Shooting Star Pattern formed is more than the other
two patterns, Dark Cloud Cover and Hanging Man. Usually this is expected also
as occurrence of Hanging Man is very rare as it is followed by another pattern
the Hammer. Bearish Engulfing has occurred more times in Crude Oil and
Natural Gas than Shooting Star, whereas Shooting Star has Occurred times
than Bearish Engulfing in Gold and Silver. It is also observed that Occurrence
of Hanging Man is very low, almost negligible in Crude Oil and Natural Gas
however it has occurred in significant number in Gold and Silver.

74
-20
-10
0
10
20
30
Return in
Percentage
Crude
Oil
Natural
Gas
Gold Silver
Commodity
Returns Generated by Bullish Patterns
Bullish engulfing
Piercing Lines
Hammer
Inverted Hammer
Graph or Pie Chart 3: Returns generated by Bullish Patterns
For Bullish Patterns, it is seen that Natural Gas responds to traditional
approach the most with maximum returns as high as 24 % returns for 6 year
data followed by Silver. Crude Oil however responds to Hammer with returns
of 19 % for 6 years data and inverted hammer but gives negative returns for
the other two which is as low as -16 % for 6 years data. The response of Gold
towards the Bullish Patterns is not there. It neither gives significant positive
returns nor negative. For the patterns, Hammer is the most consistent giving
maximum returns and Piercing lines are the worst giving negative returns for
all the commodities. Bullish Engulfing however worked well for Natural Gas
and Silver, but performed worst for crude oil and Gold.

75
It is observed that for the Bearish Patterns, all the commodities gave mixed
observations for different patterns. None of the commodities gave significant
positive returns if we take all patterns together. However, Bearish engulfing
and Hanging Man performed well as compared to other patterns. In fact
Bearish Engulfing Pattern outperformed with more than 14 % return for 6
years data for the commodities Crude Oil, Natural Gas and Gold. It is also
observed that Gold did respond for the different bearish patterns unlike as it
did for Bullish Patterns.
4.2.1 Overall Returns: Traditional Approach
The traditional Approach gave a very good overall return of 84.9 % for 6
years data for 4 commodities. Per Year return would be 84.9/6 = 14.15 % for
four commodities. Hence, on an average each commodity can generate a
-20
-10
0
10
20
30
Crude OilNatural GasGold Silver
Returns in Percentage
Commodity
Returns Generated by Bearish Patterns
Bearish Engulfing
Dark Cloud Cover
Shooting Star
Hanging Man
Graph or Pie Chart 4: returns Generated by Bearish Patterns

76
return of about 14.15/4 = 3.5 % per year from the traditional approach. Below
is the excel chart:
Table 2: Returns: Traditional Approach
Pattern Commodity Traditional Return (6 years)
Bullish Engulfing Pattern
Crude Oil -16.10%
Natural Gas 7.71%
Gold -2.46%
Silver 9.37%
Piercing Lines
Crude Oil -7.06%
Natural Gas -3.84%
Gold 0.70%
Silver 1.87%
Dark Cloud Cover
Crude Oil -6.60%
Natural Gas -11.77%
Gold -1.60%
Silver 1.23%
Bearish Engulfing Pattern
Crude Oil 14.40%
Natural Gas 26.55%
Gold 14.90%
Silver -13.19%
The Hammer
Crude Oil 19.06%
Natural Gas 28.08%
Gold 0.53%
Silver 17.47%
The Shooting Star
Crude Oil -11.48%
Natural Gas -11.16%
Gold -6.71%
Silver -3.59%
The Hanging Man
Crude Oil -6.10%
Natural Gas 9.07%
Gold 7.93%
Silver 13.73%
The Inverted Hammer
Crude Oil 9.56%
Natural Gas 6.57%
Gold 0.79%
Silver -2.97%
Total 84.89%
Per Year return per commodity 3.54%

77
4.3 My Strategy: Getting Odds in Favour
As discussed, we need to put question against each commodity after pattern
formation that how we will use historical data and try to put odds in our favour. Let‟s
assume a XYZ bullish trading pattern (meaning market shall trend up) is formed on a
day. Now based upon the historical data we can check, how many times market
opens above the last day close prices, how many times market goes to at least 10 %
or 20 % or 30 % and so on below close on next day, etc. etc. Based upon this data
we can decide where we need to buy so that all the odds are in our favour and we
are able to reduce loss as much as possible.
This section will answer such questions for each Pattern against each
commodity. This section will also try to put light on Volatility of different
commodities. After a strategy will be made and would be tested and will be shown in
Detail for one scenario: Bullish Engulfing Pattern. After that the results which I get
for defining strategies for other patterns will be shown.
4.3.1 Detailed Explanation of Strategy: Bullish Engulfing Pattern
From the results is was found that the Bullish Engulfing worked well for Natural
Gas and Silver, but performed worst for crude oil and Gold. Hence we need to find
out this answer. The occurrence was not a problem as it occurred in significant
number of times.

78
1. Crude Oil: Number of Bullish engulfing Signal generated by Crude Oil is 73.
Below is the table and pie chart showing the behaviour of crude oil next day/s
of the pattern formation:
4245
49
5562
22
38
28
2331
32 12
-50% -40%
-30% -20%
-10% -100%
60% 80%
100% Open +
opened - and went -50 % opened - and went -50 %, returned back without touching -100 %
Graph or Pie Chart 5: Crude Oil: Behaviour after Bullish Engulfing Pattern
Table 3: Crude Oil: Behaviour after Bullish Engulfing Pattern
-50%
-40%
-30%
-20%
-10%
-100% 60% 80% 100%
Open +
opened - and went
-50 %
opened - and went -50 %,
returned back without touching -100 % (for next 2
days)
opened - and went -50 %, and went -
100% without touching
+100 % (for next 2 days)
42 45 49 55 62 22 38 28 23 31 32 12 23
Volatility Report: it is observed that the Crude oil can reach to -50 % and
rebound to +50 % in a single day. Evermore, it can reach to +100 % and -

79
100 % in a single day with significant number of times. Hence, it can hit
targets or stop loss on next day itself. Hence, it is a Volatile commodity.
It is observed that market opened Positive in 31 times out of 73 and it opened
negative (73-31) = 42 times out of 73. Further it is observed that out of 42
times when it opened negative, 32 times it went to -50 %. Hence it seems
that as pattern confirmation is not reached by positive open, it pushes to at
least 50 % following selling pressure.
The Strategy 1: Buy if market opens positive with traditional Target and Stop
loss and Sell when market opens negative with target -50 % and Stop loss
+50 % from close. The strategy is been tested in the excel file and is been
submitted with the research thesis.
Result Strategy 1: The result while adopting this strategy was exceptional. The
return of the Crude Oil from Bullish Engulfing Pattern went from negative 16.1
% to positive 16.3 %. This is 32 % difference. This would be further discussed
in the discussion session.
Further, it is observed that 23 out of 32 cases, market after reaching -50%
further reaches to -100 % and 12 out of 32 cases it rebounds. Hence from this
two strategies come out.

80
Strategy 2: After Bullish engulfing Pattern is formed, Buy next day if market
opens up, Otherwise sell as pattern is uncertain with target equal to length of
candle and stop loss half the length. However, for this strategy compared to
strategy 1, we are increasing target for half the stop loss. This is very risky,
but still we shall calculate the result.
Result Strategy 2: The return of the Crude Oil from Bullish Engulfing Pattern
went from 16.3 % through strategy 1 to 12.47 % positive. This is 4 % less.
Hence, need to put second thoughts on this strategy.
Strategy 3: After Bullish engulfing Pattern is formed, buy next day if market
opens up, otherwise sell as pattern is uncertain and market will go at least half
the candle considering selling pressure as market is already at high compared
to previous day and is uncertain. Rebuy at -50 % with targets of +50 % and
stop loss -100 %
Result Strategy 3: The return went from 16.3 % through strategy 1 to 23.43
% positive. This is 8 % more. Hence, this strategy is best out of the three
observed.
2. Natural Gas: Number of Bullish engulfing Signal generated by Natural Gas is
47. Below is the table and pie chart showing the behaviour of crude oil next
day/s of the pattern formation:

81
Graph or Pie Chart 6: Natural Gas: Behaviour after Bullish Engulfing Pattern
Table 4: Natural Gas: Behaviour after Bullish Engulfing Pattern
-50%
-30%
-100% 60% 100%
Open +
opened - and went
-50 %
opened - and went -50 %,
returned back without touching -100 % (for next 2
days)
opened - and went -50 %, and went -
100% without touching
+100 % (for next 2 days)
Opened + and went to
+100 %
24 29 15 23 12 24 14 0 12 10
Volatility Report: Similar to crude oil, it is observed that the Natural Gas can
reach to +100 % and -100 % in a single day with significant number of times.
Hence, it can hit targets or stop loss on next day itself. Hence, it is a Volatile
commodity.
24
29
15 23
12
24
14
12 10 0
-50%
-30%
-100%
60%
100%
Open +
opened - and went -50 %
opened - and went -50 %, and went -100% without touching +100 % (for next 2 days)
opened + and went +100 %
opened - and went -50 %, returned back without touching -100 %

82
Similar observations have been made in Natural Gas as in crude oil as far as
Bullish Engulfing Pattern is concerned. However there is one unique
observation for Natural Gas that when it went to -50 % than it never returned
to +50% without touching -100 % for next two days, however, it may
happen like in 5 or 6 days it may rebound without touching -100%. Strategy 2
employed for Crude Oil Shall work better for Natural Gas however strategy 3
shall not work. Hence, testing two strategies same as first two strategies for
crude oil.
The Strategy 1: Buy if market opens positive with traditional Target and Stop
loss and Sell when market opens negative with target -50 % and Stop loss
+50 % from close.
Result Strategy 1: Natural Gas gave good return of 23.38 % as compared to
7.71 % from traditional approach.
Strategy 2: After Bullish engulfing Pattern is formed, Buy next day if market
opens up, Otherwise sell as pattern is uncertain with target equal to length of
candle and stop loss half the length. However, for this strategy compared to
strategy 1, we are increasing target for half the stop loss. This is very risky,
but still we shall calculate the result.

83
Result Strategy 2: The return increased from 23.38 % through strategy 1 to
32.91 % positive. This is 9 % more. This is the maximum return achieved out
of any strategies.
3. Gold: Number of Bullish engulfing Signal generated by Gold is 56. Below is
the table and pie chart showing the behaviour of crude oil next day/s of the
pattern formation:
Graph or Pie Chart 7: Gold: Behaviour after Bullish Engulfing Pattern
22
30
11 19
11
26
14
11 5 2
-50%
-30%
-100%
60%
100%
Open +
opened - and went -50 %
opened - and went -50 %, and went -100% without touching +100 % (for next 2 days)
opened + and went +100 %
opened - and went -50 %, returned back without touching -100 %

84
Table 5: Gold: Behaviour after Bullish Engulfing Pattern
-50%
-30%
-100% 60% 100%
Open +
opened - and went
-50 %
opened - and went -50 %,
returned back without touching -100 % (for next 2
days)
opened - and went -50 %, and went -
100% without touching
+100 % (for next 2 days)
Opened + and went to
+100 %
22 30 11 19 11 26 14 2 11 5
Volatility Report: Gold is observed to be less volatile as compared to crude oil
and natural gas. The number of instances it reaches to -50 % and rebound to
+100 % in a single day is very less only 2.
Further, the data of Gold is seen to be widespread. It is not affected by Bullish
pattern as equal number of cases it is going to +100 % and -100 % and 22
times out of 56 it reached -50 % and 19 times +60 % which is also
considerably equal. It is also not affected weather the market opens positive
or negative after pattern formation. Hence, no strategy seems to be developed
as far as probability based approach is considered. It seems trend can be
generated by variety of approaches apart from candle sticks including Moving
averages or other technical indicators, however putting odds in our favour
seems difficult as Gold react to Pattern formation very less.
Based upon traditional approach, Gold gave negative return of 2.46 % and
developing strategy for increasing this return seems difficult.

85
4. Silver: Number of Bullish engulfing Signal generated by Silver is 63. Below is
the table and pie chart showing the behaviour of crude oil next day/s of the
pattern formation:
Graph or Pie Chart 8: Silver: Behaviour after Bullish Engulfing Pattern
Table 6: Silver: Behaviour after Bullish Engulfing Pattern
-50%
-30%
-100% 60% 100%
Open +
opened - and went
-50 %
opened - and went -50 %,
returned back without touching -100 % (for next 2
days)
opened - and went -50 %, and went -
100% without touching
+100 % (for next 2 days)
Opened + and went to
+100 %
27 35 21 26 18 34 19 0 19 12
The data of Silver is seen to be widespread. It is not affected by Bullish
pattern as considerably equal number of cases it is going to +100 % and -100
27
35
21
26 18
34
19
19
12 0
-50%
-30%
-100%
60%
100%
Open +
opened - and went -50 %
opened - and went -50 %, and went -100% without touching +100 % (for next 2 days)
opened + and went +100 %
opened - and went -50 %, returned back without touching -100 %

86
% and considerably equal number of cases it is going to +60 % and -50 %. It
is also not affected weather the market opens positive or negative after
pattern formation. However, a unique observation is seen that, when market
goes to -50 %, it doesn‟t rebound there to +100 %. It touches -100 % all the
time.
The Strategy 1: Buy if market opens positive with traditional Target and Stop
loss and Sell when market opens negative with target -100 % and Stop loss
+50 % from close. We are unsure whether this strategy will work or not as
equal number of times market went +60% as -50%, but still we shall try as no
other strategy seems possible due to widespread data.
Result Strategy 1: This strategy didn‟t work in case of the Silver giving return
of 4.25 % which is less compared to 9.37% which we got from traditional
approach.
4.3.2 Overall Returns: My Strategy V/s Traditional Strategy
This Section of the thesis will brief out all the observations made and strategies
developed for all the patterns briefly. If no significant observation can be made, we
will write down that no strategy can be made. Further, if number of Signals are less
for a pattern, than a data is not interpreted as it can generate biasness.

87
Table 7: Returns: My Strategy vs. Traditional
Pattern Commodity Observation Strategy Return for 6 years
Traditional Return (6
years)
Max returns out of all strategies including
Traditional (6 years)
Bullish Engulfing Pattern
Crude Oil
Opened Positive in 31 times out of 73 and opened
negative 42
Buy if open positive with
traditional Target and Stop loss and Sell if
opens negative with target -50 % and Stop loss
+50 %
16.30%
-16.10% 23.43%
23 out of 32 cases, market
after reaching -50% further
reaches to -100 % and 12 out of 32 cases it rebounds
Buy if open positive and Sell if opens
negative with target -100 % and Stop loss
+50 %
12.47%
Buy if open positive and Sell
if opens negative with target -50 % and Stop loss
+50 %. Rebuy at -50 % with
targets of +50 % and stop loss
-100 %
23.43%
Natural Gas
Similar observation as in
Crude Oil
Buy if open positive and Sell if opens
negative with target -50 % and Stop loss
+50 %
23.38%
7.71% 32.91%
went to -50 % than it never
returned to +50% without touching -
100 % for next two days
Buy if open positive and Sell if opens
negative with target -100 % and Stop loss
+50 %
32.91%
Gold
Data is widespread, no strategy seems possible
N/A N/A -2.46% -2.46%

88
Silver
When market goes to -50 %, it doesn’t rebound there to +100 %. It touches -100 % all the time.
Buy if market opens positive and Sell when market opens negative with target -100 % and Stop loss +50 %
4.25% 9.37% 9.37%
Piercing Lines
Crude Oil
16 Times out of 32 market went to -100 % compared to 11 times for +100 %
Selling at close instead of buy, T= - 100%, SL=+50 %
1.80%
-7.06% 15.14% 25 times out of 32, market went to -50 % compared to only for +60 %
buy at -50 % with S/L -100 % and Target = +100 %
15.14%
Natural Gas
22 times out of 27, market went to -50 %
buy at -50 % with S/L -100 % and Target = +100 %
0.46% -3.84% 0.46%
Gold 18 times out of 30, market reaches -50 %
buy at -50 % with S/L -100 % and Target = +100 %
2.95% 0.70% 2.95%
Silver
Less number of Trading signals generated, only 13.
No strategy: as less than 20 numbers can generate biasness when we interpret data
N/A 1.87% 1.87%
Dark Cloud Cover
Crude Oil 23 times out of 29, market reaches +50 %
Sell at +50 % with S/L +100 % and Target = -80 %
0.80% -6.60% 0.80%
Natural Gas
16 out of 33 times, market went to 100 % compared 12 times for -100 %
Buy instead of sell with target +100 % and SL -50 %
26.50% -11.77% 26.50%
Gold
21 out of 32 times, market went to +50 %, and 11 times to +100 % compared 15 times for -60 %
Buy instead os sell with target +100 % and SL -50 %
1% -1.60% 1%
Silver
Less number of Trading signals generated, only 19.
No strategy: as less than 20 numbers can generate biasness when we interpret data
N/A 1.23% 1.23%
Bearish Crude Oil No unique N/A N/A 14.40% 14.40%

89
Engulfing Pattern
Natural Gas
observation. Data seems to behave
like traditional way
N/A N/A 26.55% 26.55%
Gold N/A N/A 14.90% 14.90%
Silver
Data is widespread, no strategy seems possible
N/A N/A -13.19% -13.19%
The Hammer
Crude Oil
46 out of 54 times, market opened or went below -10 % of traditional target
Buy at open with target 2 times length of shadow above open and SL below shadow.
21.87%
19.06% 21.87%
42 out of 54 times, market opened or went below -20 % of traditional target
Buy at next day at -20 %, Sl below shadow, Target 2 times the shadow
15.10%
Natural Gas
No unique observation. Data seems to behave like traditional way
N/A N/A 28.08% 28.08%
Gold
22 times out of 90 market went -100 % very next day compared to 14 times for +100 %
Sell instead of buy with T=-100% and SL=+50%
27.36% 0.53% 27.36%
Silver
No unique observation. Data seems to behave like traditional way
N/A N/A 17.47% 17.47%
The Shooting Star
Crude Oil
Market is behaving opposite to the trend 65 % of the time. SL is some cases more than target.
Buy instead of Sell with T=+100% and SL=-50%
29.53% -11.48% 29.53%
Natural Gas
Market is behaving opposite to the trend 55 % of the time. SL is some cases more than target.
Buy instead of Sell with T=+100% and SL=-50%
43.38% -11.16% 43.38%
Gold
Data is widespread, no strategy seems possible
N/A N/A -6.71% -6.71%
Silver
No unique observation. Data seems to behave like traditional way
N/A N/A -3.59% -6.71%
The Hanging Crude Oil As number of No strategy: as N/A -6.10% -6.10%

90
Man Natural Gas
Trading signals are less for the
Hanging Man as and the inverted
Hammer it is formed after the hammer and the
shooting star respectively
less number of trading signals can generate
biasness when we interpret
data
N/A 9.07% 9.07%
Gold N/A 7.93% 7.93%
Silver N/A 13.73% 13.73%
The Inverted Hammer
Crude Oil N/A 9.56% 9.56%
Natural Gas
N/A 6.57% 6.57%
Gold N/A 0.79% 0.79%
Silver N/A -2.97% -2.97%
Total 84.89% 348.71%
Per Year return per commodity
3.54% 14.53%
Clearly it is seen that per year return per commodity increased from 3.54 % in
Traditional Approach to 14.53 % in my strategy developed.
91
5. Discussion, Conclusion and Recommendations
This section of the thesis will interpret the findings and critically discuss on the
basis of objectives of the research. It will discuss the implications of the findings, and
discuss the limitations pertaining to the findings of the research. Further, this will
conclude and recommend further researches that shall be done.
5.1 Discussion
This section will interpret the findings while addressing the major objectives of
the research and would highlight the major limitations pertaining to the findings of
the research.
5.1.1 Effectiveness of the Candlestick Patterns by using Traditional Approach
From the results we have seen that there is no consistency of returns
generated by the different patterns. Some patterns give good returns while, others
give negative to very less returns. Moreover, different commodities behave
differently with the patterns. Considering all things, traditional approach has been
able to generate returns of 84.89 % for 6 years employed for 4 commodities. Hence
on average, it generates a return of 3.54 % per year per commodity.
Considering the fact that financial markets are risky, 3.54 % per year return by
one commodity is not sufficient enough. So we need to see which patterns doesn‟t
give returns for certain commodity and why?

92
The commodity market may not be behaving like traditional way due to many
factors:
1. Volatility: It is seen those volatile commodities: Crude Oil and Natural Gas
respond to patterns more as compared to non-volatile commodities: Gold and
Silver.
2. Changing Human Behaviour: Traders now play safe. They trade only when
they are sure they will get returns. They see how many odds are in favour.
Hence, after formation of a particular pattern, they trade and take profit on
immediate jump. They don‟t wait for targets. In fact, if they want to trade for
long period, they buy on dips for bullish pattern and Visa-Versa.
3. Role of Intraday Traders: Their role is most important. These intraday trades
drives market up and down on a single day and hence make it difficult to
generate consistence return
4. Patterns behaving opposite: This is the most common case for Piercing and
dark Cloud Cover Pattern as these are not considered very strong patterns.
Due to their opposite behaviour, traditional returns generated become
negative.
5.1.2 Effectiveness of the Proprietor Strategy v/s Traditional
Considering the above discussion, it becomes extremely important to develop a
trading strategy by keeping odds in the favour. As shown from the results, when we
do so, the returns increase from 84.89 % for traditional approach to 348.71 %. This

93
may be noted that it is 14.53 % per year per commodity return a hefty increase
from 3.53 % compared to traditional approach.
Now, how this much return is possible, the question comes to the mind. There
are factors that led to generate these returns:
1. S/l and Target: While developing a strategy, a careful consideration was
made that enter a trade to keep Stop loss as low as possible while keeping
the target same as defined by traditional approach. This was done by
interpreting that how many times the data at least go to a certain points.
Accordingly, we enter a trade.
2. Making opposite Trade: If a certain pattern is behaving opposite way than
accordingly an opposite trade is been made to generate a return.
5.1.3 Major Limitation
Every strategy developed has a limitation. We need to be careful about that
Major Limitation: The strategy developed was by interpreting the given data. Hence,
from the given data, anybody can generate the return. However, this strategy shall
be back tested for another set of data. For example: this strategy is been developed
from 6 years data 2010-2016. However, it may be back tested for the years 2000-
2010. This shall be important to gain confidence.
It may be possible that for the other set of data, the similar returns will not
generate. If that happens, than a strategy will not be validated. However, chances
for that are low as already it is tested for 6 years.

94
5.2 Conclusion
As it been seen, the traditional approach of Candlestick Patterns is not that
much effective compared to the risks involved. It gives only 3.53 % return per year
per commodity, which is very less compared to the risk involved. However, it is
possible to develop a strategy for generating better return when candlestick patterns
are formed.
To brief, these are the following conclusions drawn:
1. Key Implication of the Study: Traditional Approach is not that much
effective to generate return. It should be mixed with certain proprietor
approaches that should be developed by a trader itself before entering a
trade.
2. Recommended Approach to solve problem: It is possible to develop a
strategy to increase the returns. However, that needs to be back tested with
another set of data.
3. The change in trader approach has vanished the effectiveness of the
Traditional Approach of Candle Stick Patterns. This traditional approach was
developed by studying the data of past so many years, doesn‟t hold good
enough now.

95
5.3 Significance of the research
In spite of the limitations of my research methods and findings, my research
constitutes a valuable contribution to the field of study in the following ways.
Firstly, my research narrows the gap in the literature.
Secondly, the return generated from the proprietor trading strategy
developed is exceptional which makes this research worth reading.
5.4 Future recommendations
My research findings and implications provide a lot of space for further research.
First of all, it opens the doors for researching on the proprietor strategy
developed and back testing it with the other set of data.
Second, it opens doors to use similar approach to develop a strategy for other
technical indicators as well.
Third, it is worth researching that non-effective strategies or technical
indicators can also be used in own way and made effective.

96
6. Reflection
The purpose of this reflection is to critically evaluate the changes that have
occurred in my personal learning style as a result of undertaking this Masters
programme, specifically with regard to the dissertation process.
Reflective learning is a process whereby individuals learn by reflecting on the
experiences they have had, drawing conclusions from these experiences and
identifying how this learning can be applied in different learning and professional
development situations. The strengths and weaknesses of my learning style has
influenced and impacted the approach that I have taken to this research. The
learning experiences, both negative and positive, I believe have contributed to my
awareness of how I adapt and respond to the challenges of conducting research.
6.1 Individual Learning Style
In terms of my personal style I would describe myself as a motivated, self-
directed and independent learner. My learning style is most closely aligned with the
Reflector style of learning- one of the four learning styles developed by Honey and
Mumford (Malone, 2002). I like to gather as much data as is available to me and
think about it thoroughly from a number of perspectives before coming to a
conclusion. The thorough collection and analysis of data is very important to reflector
learners. However given the volume of data and differing perspectives it can be
challenging for reflectors to reach definitive conclusions. This is certainly a scenario

97
that I identify with and as a result I procrastinate in terms of forming an opinion
based on what I have read.
6.2 Dissertation Process
In order to present a succinct overview of my learning experiences during the
research period they are presented according to the main stages of the dissertation
process. My learning style is critically analysed together with the challenges that I
encountered and the manner in which I overcame them.
After conducting initial research in the area of Candlestick Technical Analysis I
decided on marketing as my research topic. Satisfied with the broad topic for
research purposes, I then encountered some difficulties in framing the correct
approach for the methodology. Based on the guidance of my supervisor I refined my
research aim, decided on a quantitative approach and devised research
methodologies in a way that would provide for greater depth and breadth.
6.2.1 Undertaking the Literature review
In order to gain a broad understanding of my research topic I conducted an
extensive review of the literature. This was undertaken in the early stage of the
dissertation process. I was very enthusiastic about this aspect of the dissertation as I
enjoy locating and collecting information and I was particularly interested in
ascertaining what was contained in the literature with regard to Candlestick Patterns

98
and profitability they can generate. However as part of this process I found that I
was attempting to source all information on the topic and review it methodically. This
is quite typical of my learning style whereby I immerse myself in as much literature
as possible in order to get as wide a perspective on the subject matter or topic as
possible. As a result I was losing sight of the purpose of the literature review. In
order to overcome this however, I had to remind myself that it requires a critical
analysis of key texts and studies on a subject area. I constantly reminded myself of
the research objectives of my study in order to focus the literature search and
reading. In order that the literature review did not consume too much of the time
available to me to complete the dissertation I set a very strict deadline in order that
the literature review was completed and did not infringe on the timeframe available
for other stages in the research.
6.2.2 Writing the Methodology
This section of the dissertation was most interesting. I enjoyed the scientific
research methods module which presented a number of research philosophies and
approaches that underpin research. I stayed intact with my initial approach: that is
quantitative analysis. This proved right as well as I am able to generate exceptional
results that would not have been possible by Qualitative research. This part was most
time consuming as defining the correct Methodology is most important for any
research.
99
6.2.3 Primary Data Collection
The data collection was not difficult for my research as data pertaining to my
research was daily high, low, close and open of four commodities: Gold, Silver, Crude
Oil and Natural Gas. This type of data is easily available in financial websites. The
main time spent was on analysing the data as the amount of data was very much.
6.2.4 Data Analysis and Findings
In presenting the findings and analysis I found that it was a challenge to
critically analyse the data and interpret it in such a way that the maximum return can
be generated. Skills developed in my previous degree helped a lot. I am an Engineer
from background and Engineers are quite good in maths and stats. This typical skill
helped me a lot to critically analyse the data and be able to generate the good
returns out of it.
6.3 Conclusion
This reflective learning exercise has provided me with a very worthwhile
opportunity to critically examine my strengths and weaknesses in terms of my overall
learning style and how this impacted on my dissertation experience. I enjoy research
work and the processes associated with it and I would like to work in a research role
in the future.
I look forward to apply my findings to start a trading on a commodity platform
and make a career as a good proprietor trader. I understand this career is suited to
top 10 % of the professionals and it is very risky, however, being associated with a

100
proprietor trading firm reduces the risk and sustainability can be generated by
learning more from the experiences of other professional traders.
In the end, I would like to say that this MBA Finance Course has sharpened my
skills to a great level. Now I see myself way ahead, than I was 1 year back. The
skills generated by the degree can never be vanished.

101
References
1. Duy Tan.V (2009): The Profitability of Candlestick Chart Patterns: A Study on
The AEX-index
2. Steve .N (1991): Japanese candlestick charting techniques: A Contemporary
Guide to the Ancient Investment Techniques of the Far East
3. Jan Ivar. L (2010, Norwegian University of Science and Technology):
Predicting Stock Prices Using Technical Analysis and Machine Learning.
4. Benjamin. R (2005, Massey University, New Zealand): Candlestick Technical
Trading Strategies: Can They Create Value for Investors?
5. Aisha. A.A (2013, The British University, Dubai): Do Japanese Candlestick
Patterns Help Identify Profitable Trading Opportunities? An Analysis on
Selected Forex Markets
6. McKinsey and Company (2012): Commodity trading at a strategic crossword
7. Stockcharts.com: Available at:
http://stockcharts.com/school/doku.php?id=chart_school:chart_analysis:introd
uction to candlesticks (Accessed: 10/July/2016)
8. Investopedia.com : Available at:
http://www.investopedia.com/university/technical/techanalysis2.asp
(Accessed: 10/July/2016)
9. Businesstoday.in: Available at:
http://www.businesstoday.in/moneytoday/stocks/technical-analysis-
tools/story/21155.html (Accessed: 20/July/2016)
10. Investopedia.com : Available at:
http://www.investopedia.com/terms/f/financial-market.asp (Accessed:
1/August/2016)
11. Economywatch.com : Available at: http://www.economywatch.com/stock-
markets-in-world/financial-market-analysis.html (Accessed: 1/August/2016)
12. Investopedia.com : Available at:
http://www.investopedia.com/terms/o/oversold.asp (Accessed:
1/August/2016)
13. Dr.Simon.M (2011): Assumptions, Limitations and Delimitations

102
14. Apurva.S (2014): The secret to choosing the perfect chart time frame,
Available at:
https://www.dailyprofithunter.com/detail.aspx?date=12/10/2014&story=61&tit
le=The-secret-to-choosing-the-perfect-chart-time-frame (Accessed:
5/August/2016)
15. Rabah.A and others (2001): Market Selection and Survival of Investment
Strategies
16. Tradegoldonline.com : Available at: http://www.tradegoldonline.com/the-
history-of-trading-gold/ (Accessed: 3/August/2016)
17. "Study of the report enters the ratio production and price since 1900 of the
gold and the silver". Dani2989.com. Archived from the original on September
6, 2013. Retrieved September 29, 2010.
18. Energyxxi.org: CRUDE OIL PRICE VOLATILITY, Available at:
http://www.energyxxi.org/sites/default/files/file-tool/MetricoftheMonth-
MAY12CrudeOilPriceVolatility.pdf (Accessed: 5/Aug/2016)
19. Eia.gov: Available at:
https://www.eia.gov/pub/oil_gas/natural_gas/feature_articles/2007/ngprivolati
lity/ngprivolatility.pdf (Accessed: 5/Aug/2016)
20. Park, C., and S. Irwin, 2004: The Profitability of Technical Analysis: A Review,
AgMAS Project Research Report 2004-04.
21. Stephen.W.B (2002): Profitable Candlestick Entry and Exit Strategies, How To
Recognize The Exact Right Time To Buy Or Sell.
22. http://kotaksecurities.blogspot.ie: Available at:
http://kotaksecurities.blogspot.ie/2012/07/importance-of-maintaining-stop-
loss-30000.html (Accessed: 5/Aug/2016)
23. Investopedia.com : Available at:
http://www.investopedia.com/articles/trading/08/trailing-stop-loss.asp
(Accessed: 1/August/2016)
24. Futuresmag.com: Available at:
http://www.futuresmag.com/2011/09/30/probability-trading-best-both-
worlds?page=4 (Accessed: 1/August/2016)

103
25. Malone, S.A (2002): Learning Skills for Managers: Practical Tools and
Techniques to Turbo-Charge your Career
Appendix 1: Research files submitted
S.No Research Files Submitted Contents in the file
1 Crude Oil.xlsx Testing 8 different patterns for Crude Oil
including strategies developed to increase return
2 Natural Gas.xlsx Testing 8 different patterns for Natural Gas
including strategies developed to increase return
3 Gold.xlsx Testing 8 different patterns for Gold including
strategies developed to increase return
4 Silver.xlsx Testing 8 different patterns for Silver including
strategies developed to increase return
5 Returns Generated.xlsx Returns Generated by different patterns by
traditional approach and proprietor approach

104