chart #2 april temperature
TRANSCRIPT
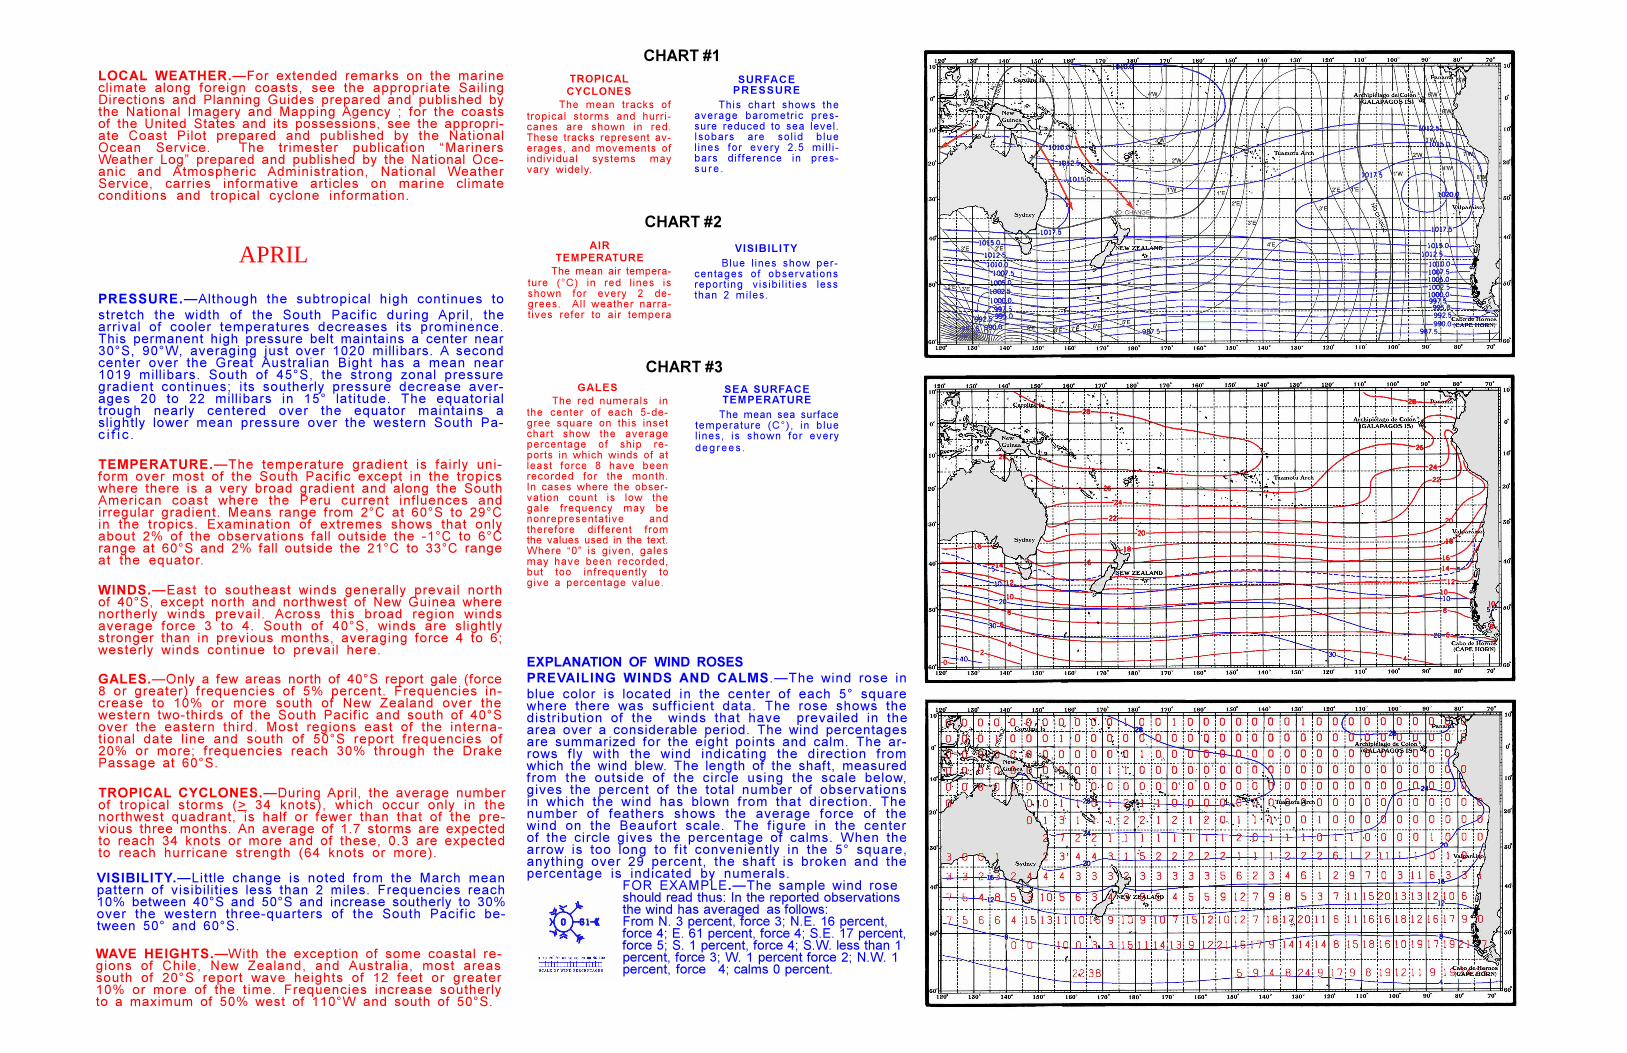
TROPICALCYCLONES
The mean tracks oftropical storms and hurri-canes are shown in red.These tracks represent av-erages, and movements ofindividual systems mayvary widely.
AIRTEMPERATURE
The mean air tempera-ture (°C) in red lines isshown for every 2 de-grees. All weather narra-tives refer to air tempera
GALES The red numerals inthe center of each 5-de-gree square on this insetchart show the averagepercentage of ship re-ports in which winds of atleast force 8 have beenrecorded for the month.In cases where the obser-vation count is low thegale frequency may benonrepresentative andtherefore different fromthe values used in the text.Where �0� is given, galesmay have been recorded,but too infrequently togive a percentage value.
SEA SURFACETEMPERATURE
The mean sea surfacetemperature (C°), in bluelines, is shown for everydegrees .
VISIBILITY Blue l ines show per-centages of observationsreporting visibil i t ies lessthan 2 miles.
SURFACEPRESSURE
This chart shows theaverage barometric pres-sure reduced to sea level.Isobars are solid bluelines for every 2.5 mil l i-bars difference in pres-s u r e .
LOCAL WEATHER.�For extended remarks on the marineclimate along foreign coasts, see the appropriate SailingDirections and Planning Guides prepared and published bythe National Imagery and Mapping Agency ; for the coastsof the United States and its possessions, see the appropri-ate Coast Pilot prepared and published by the NationalOcean Service. The trimester publication �MarinersWeather Log� prepared and published by the National Oce-anic and Atmospheric Administration, National WeatherService, carries informative articles on marine climateconditions and tropical cyclone information.
PRESSURE.�Although the subtropical high continues tostretch the width of the South Pacific during April, thearrival of cooler temperatures decreases its prominence.This permanent high pressure belt maintains a center near30°S, 90°W, averaging just over 1020 millibars. A secondcenter over the Great Australian Bight has a mean near1019 millibars. South of 45°S, the strong zonal pressuregradient continues; its southerly pressure decrease aver-ages 20 to 22 millibars in 15° latitude. The equatorialtrough nearly centered over the equator maintains aslightly lower mean pressure over the western South Pa-c i f i c .
VISIBILITY.�Little change is noted from the March meanpattern of visibilities less than 2 miles. Frequencies reach10% between 40°S and 50°S and increase southerly to 30%over the western three-quarters of the South Pacific be-tween 50° and 60°S.
TEMPERATURE.�The temperature gradient is fairly uni-form over most of the South Pacific except in the tropicswhere there is a very broad gradient and along the SouthAmerican coast where the Peru current influences andirregular gradient. Means range from 2°C at 60°S to 29°Cin the tropics. Examination of extremes shows that onlyabout 2% of the observations fall outside the -1°C to 6°Crange at 60°S and 2% fall outside the 21°C to 33°C rangeat the equator.
WINDS.�East to southeast winds generally prevail northof 40°S, except north and northwest of New Guinea wherenortherly winds prevail. Across this broad region windsaverage force 3 to 4. South of 40°S, winds are slightlystronger than in previous months, averaging force 4 to 6;westerly winds continue to prevail here.
GALES.�Only a few areas north of 40°S report gale (force8 or greater) frequencies of 5% percent. Frequencies in-crease to 10% or more south of New Zealand over thewestern two-thirds of the South Pacific and south of 40°Sover the eastern third. Most regions east of the interna-tional date line and south of 50°S report frequencies of20% or more; frequencies reach 30% through the DrakePassage at 60°S.
TROPICAL CYCLONES.�During April, the average numberof tropical storms (> 34 knots), which occur only in thenorthwest quadrant, is half or fewer than that of the pre-vious three months. An average of 1.7 storms are expectedto reach 34 knots or more and of these, 0.3 are expectedto reach hurricane strength (64 knots or more).
WAVE HEIGHTS.�With the exception of some coastal re-gions of Chile, New Zealand, and Australia, most areassouth of 20°S report wave heights of 12 feet or greater10% or more of the time. Frequencies increase southerlyto a maximum of 50% west of 110°W and south of 50°S.
APRIL
CHART #1
CHART #2
CHART #3
EXPLANATION OF WIND ROSESPREVAILING WINDS AND CALMS.�The wind rose inblue color is located in the center of each 5° squarewhere there was sufficient data. The rose shows thedistribution of the winds that have prevailed in thearea over a considerable period. The wind percentagesare summarized for the eight points and calm. The ar-rows fly with the wind indicating the direction fromwhich the wind blew. The length of the shaft, measuredfrom the outside of the circle using the scale below,gives the percent of the total number of observationsin which the wind has blown from that direction. Thenumber of feathers shows the average force of thewind on the Beaufort scale. The figure in the centerof the circle gives the percentage of calms. When thearrow is too long to fit conveniently in the 5° square,anything over 29 percent, the shaft is broken and thepercentage is indicated by numerals.
FOR EXAMPLE.�The sample wind roseshould read thus: In the reported observationsthe wind has averaged as follows:From N. 3 percent, force 3; N.E. 16 percent,force 4; E. 61 percent, force 4; S.E. 17 percent,force 5; S. 1 percent, force 4; S.W. less than 1percent, force 3; W. 1 percent force 2; N.W. 1percent, force 4; calms 0 percent.
