charge transfer tuning by chemical substitution and
TRANSCRIPT

4118 | Phys. Chem. Chem. Phys., 2015, 17, 4118--4126 This journal is© the Owner Societies 2015
Cite this:Phys.Chem.Chem.Phys.,
2015, 17, 4118
Charge transfer tuning by chemical substitutionand uniaxial pressure in the organic complextetramethoxypyrene–tetracyanoquinodimethane†
Milan Rudloff,a Kai Ackermann,a Michael Huth,*a Harald O. Jeschke,b Milan Tomic,b
Roser Valentı,b Benedikt Wolfram,c Martin Broring,c Michael Bolte,d
Dennis Chercka,e Martin Baumgartene and Klaus Mullene
In the search for novel organic charge transfer salts with variable degrees of charge transfer we have
studied the effects of two modifications of the recently synthesized donor–acceptor system [tetra-
methoxypyrene (TMP)]–[tetracyanoquinodimethane (TCNQ)]. One is of chemical nature by substituting the
acceptor TCNQ molecules by F4TCNQ molecules. The second consists in simulating the application of
uniaxial pressure along the stacking axis of the system. In order to test the chemical substitution, we have
grown single crystals of the TMP–F4TCNQ complex and analyzed its electronic structure via electronic
transport measurements, ab initio density functional theory (DFT) calculations and UV/VIS/IR absorption
spectroscopy. This system shows an almost ideal geometrical overlap of nearly planar molecules stacked
alternately (mixed stack) and this arrangement is echoed by a semiconductor-like transport behavior with
an increased conductivity along the stacking direction. This is in contrast to TMP–TCNQ which shows a
less pronounced anisotropy and a smaller conductivity response. Our band structure calculations confirm
the one-dimensional behavior of TMP–F4TCNQ with pronounced dispersion only along the stacking axis.
Infrared measurements illustrating the CRN vibration frequency shift in F4TCNQ suggest however no
improvement in the degree of charge transfer in TMP–F4TCNQ with respect to TMP–TCNQ. In both
complexes about 0.1e is transferred from TMP to the acceptor. Concerning the pressure effect, our DFT
calculations on the designed TMP–TCNQ and TMP–F4TCNQ structures under different pressure conditions
show that application of uniaxial pressure along the stacking axis of TMP–TCNQ may be the route to follow
in order to obtain a much more pronounced charge transfer.
1 Introduction
Organic charge transfer (CT) systems offer both a playgroundfor studying fundamental solid state properties and a materialclass that in recent years has become extremely attractive formodern organic electronic devices, such as organic thin filmtransistors.1–6 The electrostatic bonding of two differentorganic molecules, donor (D) and acceptor (A), gives rise to arich electronic behavior. This feature combined with the vast
flexibility chemists have concerning molecular design makes itpossible to gain access to such phenomena as unconventionalsuperconductivity, ferroelectricity, spin liquid or metal-to-insulator transitions, to mention a few.7–9 Charge transfercompounds tend to form one- or two-dimensional structures(stacks or layers) that lead to a simple differentiation betweensystems composed of segregated stacks of the donor andacceptor and systems where the donor and acceptor are mixedwithin the stacks. The vast majority of CT compounds are of thelatter mixed-stack type and have long been considered as amaterial class of reduced significance in basic and appliedresearch, as the geometrical arrangement and the resultingmolecular orbital overlap lead to semiconducting or insulatingbehavior. However, this view needs revision in several respects.Ambipolar charge-transport properties have been predicted byelectronic structure calculations in selected mixed-stack systemswith mobility values that would rival the best single-componentorganic semiconductors, such as rubrene or pentacene.10,11
Moreover, a growing group of mixed-stack CT systems shows
a Goethe-Universitat, Physikalisches Institut, Frankfurt am Main, Germany.
E-mail: [email protected] Goethe-Universitat, Institut fur Theoretische Physik, Frankfurt am Main, Germanyc Technische Universitat Carolo Wilhelmina, Institut fur Anorganische und
Analytische Chemie, Braunschweig, Germanyd Goethe-Universitat, Institut fur Anorganische und Analytische Chemie,
Frankfurt am Main, Germanye Max-Planck-Institut fur Polymerforschung, Mainz, Germany
† CCDC 1002047. For crystallographic data in CIF or other electronic format seeDOI: 10.1039/c4cp04461d
Received 2nd October 2014,Accepted 22nd December 2014
DOI: 10.1039/c4cp04461d
www.rsc.org/pccp
PCCP
PAPER

This journal is© the Owner Societies 2015 Phys. Chem. Chem. Phys., 2015, 17, 4118--4126 | 4119
a temperature- and/or pressure driven transition into a ferro-electric or an antiferroelectric state associated with a pro-nounced increase of the charge transfer degree, the so-calledneutral–ionic (NI) transition.12 The NI-transition is widelytunable by pressure (in single crystals)13 or biaxial strain (inclamped thin films)14–16 and may even be associated with amultiferroic state in which a, typically, antiferromagnetic orderparameter couples to the electrical polarization.17 With a viewon strengthening the material basis for this class of mixed-stack systems, several challenges have to be overcome. Despitethe fact that most of the organic CT systems crystallize in amixed-stack variant, the conditions for the establishment of atemperature-driven NI-transition are rather stringent. Roughlyspeaking, starting from a moderate initial charge transferdegree of about 0.3 to 0.4 from the donor to the acceptor thegain of Madelung energy under thermal contraction as thematerial cools down must be sufficient to overcompensatethe generally still positive difference in the ionization energyof the donor and the electron affinity of the acceptor. Underthese conditions a spontaneous increase of the charge transferdegree, usually in conjunction with D–A dimerization and a lossof inversion symmetry, can occur leading to an (anti-) ferro-electric state. At the beginning of a systematic identification ofpossible candidates for a NI-transition lies the proper selectionof the donor and acceptor species based on their respectivemolecular energies, as has been suggested by Torrance (V-shapeddiagram).18 It has to be noted, though, that a good match of themolecular energies does not guarantee a NI-transition to occur. Byway of proper modification of the functional groups of either thedonor or the acceptor fine-tuning of the respective ionizationenergies and electron affinities can be done. However, inco-crystallizing the donor and acceptor a possible change of theresulting crystal structure as compared to the mother compoundis hard to prevent and not predictable. Pressure-based tuning ofthe mother compound, ideally leaving the crystal structureunchanged, is an attractive alternative, albeit technically non-trivial and thus not suitable as a screening method for theidentification of new NI-transition systems. Here the questionarises as to which approaches with anticipatory quality can bedeveloped that allow one to identify possible candidates before-hand, once a promising mother compound is identified.
In this work we present a combined experimental and theore-tical study on the electronic properties of the new mixed-stackorganic CT compound [tetramethoxypyrene (TMP)]–[tetrafluoro-tetracyanoquinodimethane (F4TCNQ)] which was derived fromthe previously synthesized TMP–TCNQ mixed-stack system byway of enhancing the acceptor qualities of TCNQ by halogensubstitution. The pyrene TMP and the TCNQ structure (see Fig. 1)both offer a multitude of possible functional modifications thatallow one to investigate how specific changes affect the structuraland electronic properties of the CT compound. TMP–F4TCNQ hasa triclinic crystal structure with virtually ideal geometrical overlapof the donor and acceptor resulting in a pronounced anisotropyof the electronic properties, as deduced from temperature-dependent conductivity measurements and density functionaltheory calculations. This structure differs from that of the mother
compound TMP–TCNQ which is far less anisotropic. Somewhatcounter-intuitively, the degree of charge transfer of TMP–F4TCNQ isnot enhanced as compared to that of TMP–TCNQ but even reducedfrom about 0.2 to 0.1, according to the observed shifts in the CRNstretching mode as seen in IR absorption spectroscopy as well as inthe density functional theory (DFT) calculations. By analyzing thecharge distribution of the two complexes, we propose a possibleexplanation of these observations. Finally by simulating the effectof uniaxial pressure on these two compounds within the DFTcalculations, we predict a pronounced increase of the chargetransfer degree for TMP–TCNQ whereas TMP–F4TCNQ appears tobe mostly unaffected. This band-structure-based approach of asimulated pressure experiment may represent an efficient strategyto identify possible candidates for NI-transition systems based onnewly synthesized mixed-stack organic charge transfer systems ofsuitable initial charge transfer degree.
2 Methods2.1 Experimental methods
2.1.1 Synthesis and structure determination. TMP wassynthesized at the Max Planck Institute for Polymer Researchwith a purity of better than 95%. F4TCNQ was purchased fromSigma-Aldrich with a purity of Z97%.
Single crystals of TMP–F4TCNQ were grown in solutionby slow evaporation of the solvent. TMP and F4TCNQ wereseparately solubilized in dichloromethane (DCM) in equimolaramounts (ca. 10 mg). Both solutions were carefully mixed in aglass beaker which was then covered with aluminum foil tolimit the evaporation rate. Black, needle-like crystals could beextracted after one to two weeks.
The structure determination was based on a 0.41 � 0.06 �0.06 mm sized crystal. X-ray data were recorded at T = 173 K ona STOE IPDS II two-circle-diffractometer using Mo-Ka radiationand a Genix 3D multilayer optics monochromator. SHELXS9719
was used for structure solution while refinement was carriedout with SHELXL97. Further information on data collection andstructure refinement is given in Table 1. Crystallographic datafor TMP–F4TCNQ have been deposited with the CambridgeCrystallographic Data Centre.20
Computer programs: X-AREA (Stoe & Cie, 2001), SHELXS97(Sheldrick, 2008), SHELXL97 (Sheldrick, 2008), XP in SHELXTL-Plus (Sheldrick, 2008).
Fig. 1 Molecular structure of TMP (left) and F4TCNQ (right). The fourmethoxy groups provide TMP with donor properties while the four cyanogroups combined with four fluorine atoms give F4TCNQ its acceptorfunctionality.
Paper PCCP

4120 | Phys. Chem. Chem. Phys., 2015, 17, 4118--4126 This journal is© the Owner Societies 2015
2.1.2 Electrical conductivity measurements. Single crystalswere placed on a custom-made carrier chip and electricallycontacted with conducting graphite paste. 50 mm thick goldwires were attached to the paste and soldered to contact pins onthe carrier chip. On the small crystals two-probe measurementsproved to be sufficient, because the sample resistance domi-nated by far the contact and wiring resistances. Low tempera-ture measurements were performed in an Oxford 4He cryostatwith a Keithley 2636A two-channel sourcemeter. Within thecryostat the carrier chip was mounted in a variable temperatureinsert (VTI). The temperature was measured using a calibratedresistance thermometer (Cernox).
2.1.3 Infrared spectroscopy. Infrared spectroscopy wasapplied to powder material from solution growth in the caseof TMP–F4TCNQ and the as-supplied powder in the caseof F4TCNQ as a reference. Spectra were recorded at roomtemperature using a Bruker Vertek 70 FT-IR spectrometerbetween 600 and 4000 cm�1. All measurements were performedwith a resolution of 2 cm�1.
2.1.4 UV-VIS/IR spectroscopy. Spectra were recorded insolution (DCM) on a Perkin-Elmer Lambda 900 UV/VIS/NIRspectrometer. A concentration of 10�4 mol l�1 was used forabsorption between 0.1 and 1 in the wavelength region ofexperimental interest.
2.2 Theoretical methods
We performed ab initio density functional theory calculationsfor the TMP–F4TCNQ complex. The full potential local orbital(FPLO) basis set21 with the generalized gradient approxi-mation functional in its PBE form22 was used. We employed a
10 � 10 � 10 k mesh and analyzed the band structure by fittingthe bands near the Fermi level to a tight binding Hamiltonian23
H ¼X
i
eicyi ci þ
X
ij
tijcyi cj (1)
with the operators c†i (ci) creating (annihilating) electrons at site i,
onsite energies ei and transfer integrals tij. We checked the unique-ness of the resulting fit using projective Wannier functions.24
We simulated uniaxial pressure along the stacking directionby scaling the lattice parameter a of both TMP–TCNQ andTMP–F4TCNQ in small steps and fully relaxing all internalcoordinates using the projector augmented wave (PAW) basisand generalized gradient approximation functional as imple-mented in the Vienna ab initio simulation program (VASP).25,26
We used a 6 � 6 � 6 k mesh for TMP–TCNQ and a 4 � 4 � 4 kmesh for TMP–F4TCNQ, with a plane wave cutoff of 500 eV.
3 Results3.1 Crystal structure
The synthesized TMP–F4TCNQ crystals showed a triclinic struc-ture with mixed stacks formed along their a-axis (see Table 1).Fig. 2 illustrates the packing arrangement from differentperspectives.
All stacks have a common stacking axis. Along the stacks, TMPand F4TCNQ lie almost perfectly on top of each other: Theirrespective planes (ignoring the methoxy groups) lie nearlyperpendicular to the stacking direction while the geometricalcenters of TMP and F4TCNQ molecules are positioned on acommon axis. The mean plane-to-plane separation is about 3.35 Å.
3.2 Electrical conductivity
Electrical conductivity measurements for one typical crystal areillustrated in Fig. 3. The crystal shown here had dimensions ofroughly 360 � 90 � 50 mm. Current–temperature curves wererecorded with an applied voltage of 100 V, corresponding to amaximum electrical field of 11 kV cm�1, for two distinctdirections along the crystal, one parallel to its long axis andone perpendicular to it. The long axis corresponded to thestacking direction of the molecules (a-axis). We note that theroom temperature conductivity is more than one order ofmagnitude larger in the stacking direction than in perpendi-cular orientation.
Both s(T) characteristics show a thermally activated (Arrhenius)behavior but with different activation energies Ea (see Fig. 4). Thisbehavior was only visible at T 4 220 K as the resistance at lowertemperatures became too high for the measurement setup. Forcurrent flow along the stacking axis a value of Ea = 0.98 eV wascalculated based on the fit performed in Fig. 4. The perpendiculardirection gave a value of Ea = 0.84 eV.
3.3 Degree of charge transfer
In general, the fraction of charge (r, in units of e) transferredfrom the donor to the acceptor (in the ground state) can beestimated by the frequency shift of the CRN stretching modesfor which in most cases the shift grows linearly with the charge
Table 1 Experimental details and crystal structure data for TMP–F4TCNQ
Crystal dataChemical formula C20H18O4�C12F4N4
Mr 598.50Crystal system, space group Triclinic, P%1Temperature (K) 173a, b, c (Å) 6.8078(13), 10.6592(18), 10.840(2)a, b, g (1) 61.373(13), 71.958(14), 84.063(14)V (Å3) 655.6(2)Z 1Radiation type Mo Kam(mm�1) 0.12Crystal size (mm) 0.41 � 0.06 � 0.06
Data collectionDiffractometer STOE IPDS II two-circle-
diffractometerAbsorption correction Multi-scan X-AREA (Stoe & Cie, 2001)Tmin, Tmax 0.952, 0.993No. of measured, independentandobserved [I 4 2s(I)] reflections
5551, 2305, 1500
Rint 0.096(sin y/l)max (�1) 0.595
RefinementR[F2 4 2s(F2)], wR(F2), S 0.055, 0.138, 0.95No. of reflections 2305No. of parameters 201H-atom treatment H-atom parameters constrainedDrmax, Drmin (e �3) 0.25, �0.25
PCCP Paper

This journal is© the Owner Societies 2015 Phys. Chem. Chem. Phys., 2015, 17, 4118--4126 | 4121
transfer degree.27,28 The absorption of IR (infrared) radiation ofisolated F4TCNQ was measured as a reference. The spectrum
shown in Fig. 5 illustrates IR bands at 2217 cm�1 and 2228 cm�1
corresponding to the modes b2u and b1u.Both values are in close agreement with the results from
other measurements.29,30 The spectrum for TMP–F4TCNQshows two weak bands at 2213 cm�1 and 2224 cm�1 thatprobably correspond to the modes visible in the F4TCNQspectrum being red-shifted by 3–4 cm�1 due to the chargetransfer. Based on these numbers and on the n values for fullyionized F4TCNQ,29 r can be calculated with a simple relation-ship given in ref. 27. The results for the charge transfer degreeare 0.12 in the case of b1u and 0.09 for b2u.
3.4 Charge transfer transition energy
Fig. 6 shows two absorption peaks of TMP and F4TCNQ insolution in the region of interest: the left one at 592 nm corre-sponds to an energy of 2.1 eV, and the right one at 1132 nmcorresponds to 1.1 eV. The latter presumably originates fromthe characteristic charge transfer transition which is typicallyassociated with a broad peak shape like in our case.
The peak at 2.1 eV could stem from intramolecular transi-tions in donor or acceptor (neutral or ionized) molecules that
Fig. 2 Structure of TMP–F4TCNQ viewed along the (a) b- and (b) a-axis.
Fig. 3 Temperature-dependent conductivity measured on the TMP–F4TCNQ crystal (shown with contacts in the optical micrograph (inset))for two different directions.
Fig. 4 Arrhenius plot and the corresponding linear fit (dashed lines) forboth s(T) measurements.
Fig. 5 IR absorption caused by the CN stretching vibrations in TMP–F4TCNQ compared to that in F4TCNQ. Both curves are an average over 16scans.
Paper PCCP

4122 | Phys. Chem. Chem. Phys., 2015, 17, 4118--4126 This journal is© the Owner Societies 2015
generally appear at higher energies than the CT transition. Thesame very likely applies to the strong absorption partly visiblein the leftmost position of the figure. Here, one can refer to themeasurements performed on neutral TMP (thin films)31 thatshowed an optical gap of 3.167 eV (392.7 nm). Similar peakenergies were found for other donors/acceptors in the neutralor ionized state.18,31–33
3.5 Electronic structure
Fig. 7 shows the band structure of TMP–F4TCNQ in a largeenergy window. Coordinates of the high symmetry points areG = (0,0,0), X = (0.5,0,0), U = (0.5,0,0.5), R = (0.5,0.5,0.5),V = (0.5,0.5,0), Y = (0,0.5,0), T = (0,0.5,0.5), Z = (0,0,0.5) in unitsof the reciprocal lattice vectors. The electronic structure forTMP–F4TCNQ is calculated in a primitive cell containing oneformula unit and it is characterized by well separated singlebands of predominant TMP or F4TCNQ origin, respectively.These bands are a result of the hybridization between thehighest occupied molecular orbital (HOMO) of TMP and thelowest unoccupied molecular orbital (LUMO) of F4TCNQ (seeref. 34 for details). The band below the Fermi level is mostly ofTMP origin (donor) with some hybridization with F4TCNQwhile the band above the Fermi level is of F4TCNQ origin
(acceptor) with some hybridization with TMP. The bands arenarrow and only show dispersion along paths where the kx
coordinate is changing (for a visualization of the k path, seeFig. 8). This indicates that the system is very one-dimensionalalong the a direction which is the stacking direction (compareFig. 2). The GGA band gap is Eg = 0.26 eV. Correlation effectsbeyond the GGA approximation, like local electronic inter-actions U or nonlocal Coulomb correlations V, have not beenincluded in the calculations and could play a role in theestimation of the band gap. However, the DFT (GGA) resultsshould be reliable in providing the trend that TMP–F4TCNQ hasa narrower gap than TMP–TCNQ.
In Fig. 9 we show the density of states (DOS) for TMP–F4TCNQ. The effect of the charge transfer is seen in the lowestunoccupied states of F4TCNQ which show some degree ofhybridization with the highest occupied states of TMP. Conse-quently, the highest occupied states of TMP–F4TCNQ havesome admixture of F4TCNQ/cyano group character, and thelowest unoccupied states have contributions from TMP.
The charge transfer can be quantified using the charges onthe atoms as obtained from the charge density; these numberscan be corroborated by integrating parts of the density of states
Fig. 6 Absorption spectrum of TMP–F4TCNQ. Data were recorded frompartly reacted TMP and F4TCNQ in solution.
Fig. 7 Band structure of TMP–F4TCNQ with a DFT gap of Eg = 0.26 eV.
Fig. 8 Brillouin zone and the chosen k path for triclinic TMP–F4TCNQ.
Fig. 9 Density of states of TMP–F4TCNQ. The Fermi level is indicated by adashed line. Contributions of TMP are shown in blue, of F4TCNQ in red, ofthe cyano groups in green and of the methoxy groups in purple.
PCCP Paper
This journal is© the Owner Societies 2015 Phys. Chem. Chem. Phys., 2015, 17, 4118--4126 | 4123
shown in Fig. 9. Note that both ways to determine the chargetransfer involve different approximations and should not beexpected to give exactly the same result. Analysis of the chargetransfer yields a value of 0.20 electrons per formula unit fromTMP to F4TCNQ. This agrees roughly with 0.24 electronsF4TCNQ-contribution to the highest occupied TMP-derivedbands of TMP–F4TCNQ (Fig. 9) and with 0.31 electronsTMP-contribution to the lowest unoccupied F4TCNQ-derivedbands. Comparison of this result with the charge transferobtained from measurements (previous section) shows a dis-agreement that will be discussed below.
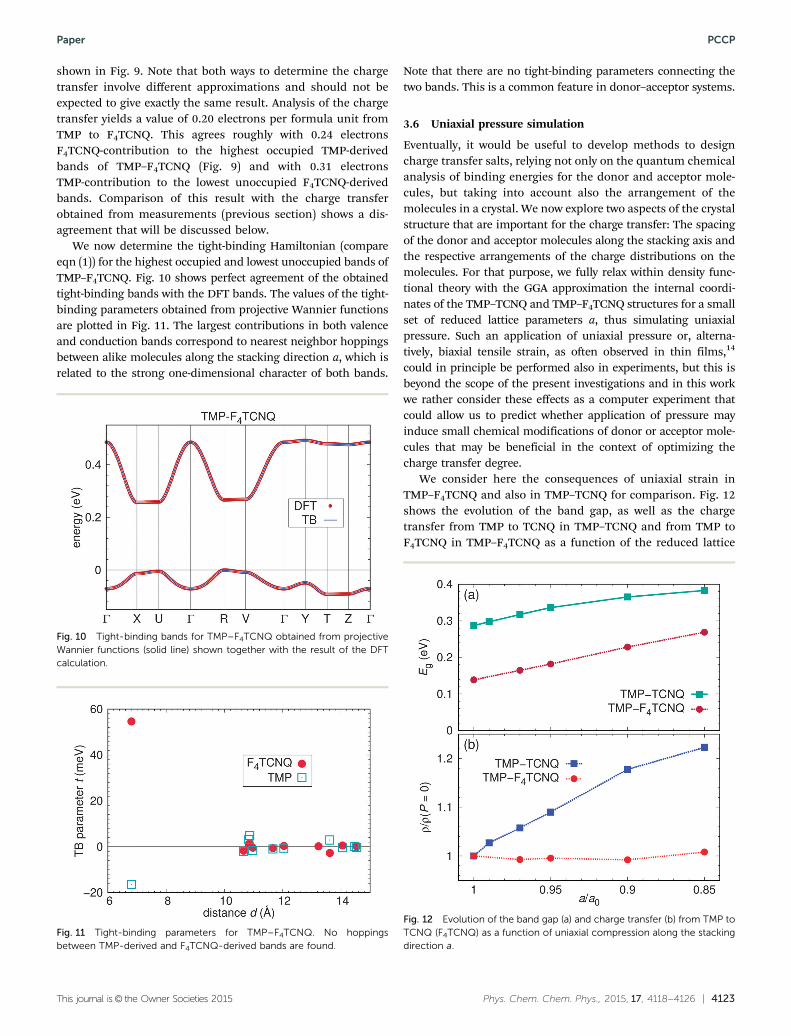
We now determine the tight-binding Hamiltonian (compareeqn (1)) for the highest occupied and lowest unoccupied bands ofTMP–F4TCNQ. Fig. 10 shows perfect agreement of the obtainedtight-binding bands with the DFT bands. The values of the tight-binding parameters obtained from projective Wannier functionsare plotted in Fig. 11. The largest contributions in both valenceand conduction bands correspond to nearest neighbor hoppingsbetween alike molecules along the stacking direction a, which isrelated to the strong one-dimensional character of both bands.
Note that there are no tight-binding parameters connecting thetwo bands. This is a common feature in donor–acceptor systems.
3.6 Uniaxial pressure simulation
Eventually, it would be useful to develop methods to designcharge transfer salts, relying not only on the quantum chemicalanalysis of binding energies for the donor and acceptor mole-cules, but taking into account also the arrangement of themolecules in a crystal. We now explore two aspects of the crystalstructure that are important for the charge transfer: The spacingof the donor and acceptor molecules along the stacking axis andthe respective arrangements of the charge distributions on themolecules. For that purpose, we fully relax within density func-tional theory with the GGA approximation the internal coordi-nates of the TMP–TCNQ and TMP–F4TCNQ structures for a smallset of reduced lattice parameters a, thus simulating uniaxialpressure. Such an application of uniaxial pressure or, alterna-tively, biaxial tensile strain, as often observed in thin films,14
could in principle be performed also in experiments, but this isbeyond the scope of the present investigations and in this workwe rather consider these effects as a computer experiment thatcould allow us to predict whether application of pressure mayinduce small chemical modifications of donor or acceptor mole-cules that may be beneficial in the context of optimizing thecharge transfer degree.
We consider here the consequences of uniaxial strain inTMP–F4TCNQ and also in TMP–TCNQ for comparison. Fig. 12shows the evolution of the band gap, as well as the chargetransfer from TMP to TCNQ in TMP–TCNQ and from TMP toF4TCNQ in TMP–F4TCNQ as a function of the reduced lattice
Fig. 10 Tight-binding bands for TMP–F4TCNQ obtained from projectiveWannier functions (solid line) shown together with the result of the DFTcalculation.
Fig. 11 Tight-binding parameters for TMP–F4TCNQ. No hoppingsbetween TMP-derived and F4TCNQ-derived bands are found.
Fig. 12 Evolution of the band gap (a) and charge transfer (b) from TMP toTCNQ (F4TCNQ) as a function of uniaxial compression along the stackingdirection a.
Paper PCCP

4124 | Phys. Chem. Chem. Phys., 2015, 17, 4118--4126 This journal is© the Owner Societies 2015
parameter a; a0 = a(P = 0) corresponds to the lattice parameter aat ambient pressure. Note that the structures for different a/a0
were obtained by relaxing the internal coordinates of thecomplexes within DFT. For TMP–TCNQ and a/a0 = 1 the relaxedstructure shows only small differences with respect to theexperimental structure. For the calculated charge transfer inthe relaxed structure we obtain an offset of about 0.2 withrespect to the value deduced from the DFT calculations relyingon the experimental crystal structure. For TMP–F4TCNQ thecorresponding offset is about 0.1. In the representation of theuniaxial strain effects on the charge transfer, shown inFig. 12(b), the results are normalized to the value calculatedfor the relaxed structures at zero strain. Interestingly, we finddifferent trends in TMP–TCNQ and TMP–F4TCNQ: In TMP–TCNQ, the charge transfer increases approximately linearlywith compression along a, while in TMP–F4TCNQ it staysconstant. For a more detailed analysis, we show in Fig. 13 thedensities of states for all values of the a/a0 ratio. As expected,the overall band width increases as a function of pressure inboth cases. However, if we focus on the states directly below theFermi level that correspond mostly to the highest occupiedmolecular orbitals of TMP, we see an important difference:While the dispersion corresponding to these states significantlyincreases with uniaxial compression in TMP–TCNQ, it remainsnearly unchanged in TMP–F4TCNQ. In the next section we will
discuss possible reasons for this different behavior related tothe differences in the charge density arrangement of the twocompounds.
4 Discussion
The crystal structure of TMP–F4TCNQ with its simple and clearstacking arrangement of donor–acceptor molecules gives rise toa markedly reduced dimensionality of its electronic transportcharacteristics. This is confirmed by both our conductivitymeasurements and band structure calculations. The dispersionvisible only along kxJa is reflected in an appreciable increase ofthe conductivity along the stacking axis. This one-dimensionalcharacter is a common phenomenon in CT systems but notnecessarily pronounced in mixed-stack CT systems. However,we observe that an almost perfect one-dimensional geometrydoes not necessarily lead to an optimized interaction thatpromotes maximum conductivity. The semiconductor-likebehavior of s(T) below room temperature in TMP–TCNQ ispronounced due to the rather high activation energies. Theconductivity is further limited by the rather small chargetransfer, if one takes into account that high s-values shouldnot be expected for r o 0.4.35
In order to further analyze the influence of the geometry ofthe stacking on the conductivity behavior as well as the role ofthe specific acceptor F4TCNQ in more detail, we compare inthis section the electronic properties of TMP–F4TCNQ andTMP–TCNQ.31,34
TMP–TCNQ shows a mixed-stack arrangement like TMP–F4TCNQ but the low dimensionality is far less pronounced.34,36
TMP and TCNQ molecules are tilted against the stacking axis byslightly different angles, i.e. their planes are less parallelcompared to the TMP–F4TCNQ geometry. Within the stacks,they are shifted along b and c so that the geometrical centersof adjacent molecules do not coincide when one plane isprojected onto another. This shift becomes particularly apparentwhen comparing the distribution of excess charges viewed alongthe stacking axis, as shown in Fig. 14. By introducing the fluor inF4TCNQ a significant increase of negative excess charge at theacceptor ring position occurs which seems to act as a strongdocking point for the positive excess charge located at the ringclose to the methoxy groups of the donor. This leads to a ring-centering effect in the donor–acceptor stacking of TMP–F4TCNQwhich also has the consequence of improving the planarity of theF4TCNQ molecule. In TMP–TCNQ the planarity of the TCNQstructure is reduced when compared with F4TCNQ as the CNgroups show stronger twists with respect to the central ring andeven the ring itself is not really planar. From these observationswe draw two conclusions relating to the molecular overlap andthe associated conductivity, as well as the expected behaviorunder applied uniaxial pressure along the stacking axis.
First, planarity is generally regarded as a relevant factor forhigher conductivity due to the increase of the molecular orbitaloverlap integrals.8 The reduced planarity and lateral offset inthe ring stacking in TMP–TCNQ are therefore reflected by
Fig. 13 Density of states (DOS) of (a) TMP–TCNQ and (b) TMP–F4TCNQfor different degrees of uniaxial compression along the stacking direction a.
PCCP Paper

This journal is© the Owner Societies 2015 Phys. Chem. Chem. Phys., 2015, 17, 4118--4126 | 4125
significantly reduced conductivity values and the absence of anobservable anisotropy when compared to TMP–F4TCNQ. Infact, the exact room-temperature value(s) of the conductivityfor different directions of a mm-sized TMP–TCNQ single crystalcould not be determined as its resistance exceeded the isolationresistance of our setup. Nevertheless, we can state an upperlimit of about 10�11 S cm�1. The fundamental differencesbetween TMP–TCNQ and TMP–F4TCNQ are confirmed by theband structure calculations. TMP–TCNQ bands are narrowerand show weak dispersion in all directions. The bandwidth isonly 0.1 eV while it is 0.25 eV for TMP–F4TCNQ (see Fig. 15).
Second, with regard to the expected behavior of the chargetransfer degree under uniaxial compression, the near-ideal planarity
and ring-stacking of TMP–F4TCNQ seem to preclude a significantincrease of the donor–acceptor hybridization, as clearly sug-gested by the results of the DFT calculations shown in Fig. 12.For TMP–TCNQ, on the other hand, a significant increase of theplanarity of the acceptor molecules under uniaxial pressuremay be expected, as well as possible lateral rearrangementsleading to improved ring stacking. In this case, a clear tendencyfor a growing charge transfer degree should be expected, asstrongly suggested by the DFT calculations. We consider thesepredictions to be a robust feature despite the fact that thecalculated degrees of charge transfer, in particular for the fullyrelaxed structures, do not agree very well with the experimentalvalues obtained from analyzing the CN vibration frequencyshifts. We conclude this section with some comments in thisdirection.
Regarding the degree of charge transfer in TMP–TCNQ theCN vibration showed a frequency shift from 2227 cm�1 (pureTCNQ) to 2221 cm�1 indicating a charge transfer of 0.14. In thiscase, the theoretical analysis of charges, relying on the experi-mental crystal structure, produced a nearly perfect agreementas an overall charge transfer of 0.13 from TMP to TCNQ wasfound. It agrees roughly with 0.16 electrons TCNQ contributionto the highest occupied TMP-derived bands of TMP–TCNQ, andwith 0.21 electrons TMP contribution to the lowest unoccupiedTCNQ-derived bands (experimental structure). In the case ofTMP–F4TCNQ the agreement between theoretical (ca. 0.2–0.3)and the extracted values from infrared measurements (0.12) isnot as good. Considering that the absolute CN vibrationfrequency shifts are rather small, the error margins for theexperimentally deduced charge transfer values are about 0.05.In addition, the observed changes in r derived from the DFTcalculations when allowing for full relaxation, in particular forTMP–TCNQ, indicate that already subtle changes in the crystalstructure can lead to substantial changes. Taking this together,the deduced absolute values for the charge transfer degree in theTMP–TCNQ and TMP–F4TCNQ systems have to be consideredwith caution. However, the predicted uniaxial pressure trendsand their rationalization with a view to the stacking arrangementand excess charge distributions provide valuable insight intothe somewhat counter-intuitive trends observed when goingfrom TMP–TCNQ to TMP–F4TCNQ. This work has shown thatsimple arguments that the significantly larger electron affinity ofF4TCNQ (ca. 5.2 eV) in comparison to that of TCNQ (ca. 4.8 eV)8
should lead to an increased charge transfer do not hold. Thepresent comparison also forms an interesting analogy to similarinvestigations like the one by Torrance,37 who contrastedHMTTF–TCNQ with HMTTF–F4TCNQ. In their study the differentacceptors led to isostructural CT systems but with very differentdegrees of charge transfer. As a result HMTTF–F4TCNQ becomesa Mott insulator while HMTTF–TCNQ is an organic metal.
5 Conclusion
We have investigated the structural and electronic transportproperties of the new charge transfer compound TMP–F4TCNQ
Fig. 14 Distribution of charges in (a) F4TCNQ, (b) TMP, (c) TCNQ,(d) TMP–F4TCNQ and (e) TMP–TCNQ. Spheres are drawn with the volumeproportional to the excess charge (positive in blue and green and negativein yellow and red) on each atom. In (d) and (e), the actual alignment of thedonor and acceptor from the crystal structure is shown.
Fig. 15 Band structure of TMP–TCNQ with a DFT gap of Eg = 0.37 eV.
Paper PCCP

4126 | Phys. Chem. Chem. Phys., 2015, 17, 4118--4126 This journal is© the Owner Societies 2015
in the form of single crystals. Both crystal and band structuresshow a pronounced reduction of dimensionality as the nearlyperfect geometrical overlap of molecules along the mixed donor–acceptor stacks leads to a one-dimensional transport character-istics. The predictions are qualitatively confirmed by themeasurement of anisotropic, semiconductor-like electrical con-ductivity that is largest in the stacking direction. Based on IRspectroscopy a small charge transfer of about 0.1 was foundwhile theoretical values as well as some general considerationsconcerning the maximization of charge transfer suggest a highervalue. In comparison, the related CT complex TMP–TCNQ,introduced in recent publications,31,34 shows clear structuraldifferences. They result in a more isotropic transport behaviourwith a significant overall reduction of electrical conductivityowing to the loss of the apparently optimized molecular overlapfound in TMP–F4TCNQ. At the same time our theoretical studyon the evolution of the charge transfer degree in TMP–(F4)TCNQsuggests that for TMP–TCNQ a significant increase under uni-axial pressure along the stacking axis should occur whereas nosuch effect is expected for TMP–F4TCNQ. Whether TMP–TCNQmay be a candidate for a pressure-induced neutral–ionic transi-tion remains for future resolution.
Acknowledgements
We thank V. Solovyeva, R. Rommel, M. Schmidt and S. Beko forexperimental support as well as helpful discussions. This work wasfunded through SFB/TR 49 by the Deutsche Forschungsgemeinschaft.
References
1 S. Liu, J. Shi, E. W. Forsythe, S. M. Blomquista and D. Chiu,Synth. Met., 2009, 159, 1438–1442.
2 K. Shibata, H. Wada, K. Ishikawa, H. Takezoe and T. Mori,Appl. Phys. Lett., 2007, 90, 193509.
3 S. Horiuchi, T. Hasegawa and Y. Tokura, J. Phys. Soc. Jpn.,2006, 75, 051016.
4 T. Mori, J. Phys.: Condens. Matter, 2008, 20, 184010.5 Y. Takahashi, T. Hasegawa, Y. Abe, Y. Tokura, K. Nishimura
and G. Saito, Appl. Phys. Lett., 2005, 86, 063504.6 Y. Takahashi, T. Hasegawa, Y. Abe, Y. Tokura and G. Saito,
Appl. Phys. Lett., 2006, 88, 073504.7 S. Roth and D. Carroll, One-Dimensional Metals, Wiley-VCH,
2004.8 G. Saito and Y. Yoshida, Bull. Chem. Soc. Jpn., 2007, 80,
1–137.9 S. Horiuchi and Y. Tokura, Nat. Mater., 2008, 7, 357–366.
10 L. Zhu, Y. Yi, Y. Li, E.-G. Kim, V. Coropceanu and J.-L.Bredas, J. Am. Chem. Soc., 2012, 134, 2340–2347.
11 I. Shokaryev, A. J. C. Buurma, O. D. Jurchescu, M. A.Uijttewaal, G. A. de Wijs, T. T. M. Palstra and R. A. de Groot,J. Phys. Chem. A, 2008, 112, 2497–2502.
12 S. Horiuchi, R. Kumai, Y. Okimoto and Y. Tokura, Chem.Phys., 2006, 325, 78–91.
13 M. H. Leme-Cailleau, M. L. Cointe, H. Cailleau, T. Luty,F. Moussa, J. Roos, D. Brinkmann, B. T. C. Ayache andN. Karl, Phys. Rev. Lett., 1997, 79, 1690.
14 M. Huth, A. Rippert, R. Sachser and L. Keller, Mater. Res.Express, 2014, 1, 046303.
15 V. Solovyeva and M. Huth, Synth. Met., 2011, 161, 976.16 V. Solovyeva, K. Keller and M. Huth, Thin Solid Films, 2009,
517, 6671.17 M. Filatov, Phys. Chem. Chem. Phys., 2013, 13, 144.18 J. B. Torrance, J. E. Vazquez, J. J. Mayerle and V. Y. Lee, Phys.
Rev. Lett., 1981, 46, 253–257.19 G. M. Sheldrick, Acta Crystallogr., Sect. A: Cryst. Phys., Diffr.,
Theor. Gen. Crystallogr., 2008, 64, 112–122.20 Publication No. CCDC 1002047.21 K. Koepernik and H. Eschrig, Phys. Rev. B: Condens. Matter
Mater. Phys., 1999, 59, 1743.22 J. P. Perdew, K. Burke and M. Ernzerhof, Phys. Rev. Lett.,
1996, 77, 3865.23 H. C. Kandpal, I. Opahle, Y.-Z. Zhang, H. O. Jeschke and
R. Valent, Phys. Rev. Lett., 2009, 103, 067004.24 A. C. Jacko, H. Feldner, E. Rose, F. Lissner, M. Dressel,
R. Valent and H. O. Jeschke, Phys. Rev. B: Condens. MatterMater. Phys., 2013, 87, 155139.
25 G. Kresse and J. Hafner, Phys. Rev. B: Condens. Matter Mater.Phys., 1993, 47, R558.
26 G. Kresse and J. Furthmuller, Phys. Rev. B: Condens. MatterMater. Phys., 1996, 54, 11169.
27 A. Salmeron-Valverde, J. G. Robles-Martnez and A. Zehe,Cryst. Res. Technol., 1994, 29, 703–706.
28 J. S. Chappell, A. N. Bloch, W. A. Bryden, M. Maxfield, T. O.Poehler and D. O. Cowan, J. Am. Chem. Soc., 1981, 103, 2442–2443.
29 M. Meneghetti and C. Pecile, J. Chem. Phys., 1986, 84, 4149–4162.30 P. Pingel, L. Zhu, K. S. Park, J.-O. Vogel, S. Janietz, E.-G. Kim,
J. P. Rabe, J.-L. Bredas and N. Koch, J. Phys. Chem. Lett.,2010, 1, 2037–2041.
31 K. Medjanik, S. Perkert, S. Naghavi, M. Rudloff, V. Solovyeva,D. Chercka, M. Huth, S. A. Nepijko, T. Methfessel, C. Felser,M. Baumgarten, K. Mullen, H.-J. Elmers and G. Schonhense,Phys. Rev. B: Condens. Matter Mater. Phys., 2010, 82, 245419.
32 J. B. Torrance, B. A. Scott, B. Welber, F. B. Kaufman andP. E. Seiden, Phys. Rev. B: Condens. Matter Mater. Phys., 1979,19, 730–741.
33 G. Qian, B. Dai, M. Luo, D. Yu, J. Zhan, Z. Zhang, D. Ma andZ. Y. Wang, Chem. Mater., 2008, 20, 6208–6216.
34 K. Medjanik, D. Chercka, P. Nagel, M. Merz, S. Schuppler,M. Baumgarten, K. Mullen, S. A. Nepijko, H.-J. Elmers,G. Schonhense, H. O. Jeschke and R. Valent, J. Am. Chem.Soc., 2012, 134, 4694–4699.
35 A. Salmeron-Valverde, J. G. Robles-Martnez, J. Garca-Serrano,R. Gomez, R. M. Ridaura, M. Quintana and A. Zehe, Mol. Eng.,1999, 8, 419–426.
36 S. Kawano, M. Baumgarten, D. Chercka, V. Enkelmann andK. Mullen, Chem. Commun., 2013, 49, 5058.
37 J. B. Torrance, J. J. Mayerle, K. Bechgaard, B. D. Silvermanand Y. Tomkiewicz, Phys. Rev. B: Condens. Matter Mater.Phys., 1980, 22, 4960–4965.
PCCP Paper