characterization of welding arc and weld pool formation in vacuum gas hollow tungsten arc welding
TRANSCRIPT
Ct
Da
b
a
ARR2AA
KAACAWV
1
fiwot((spusfsta
Gttst
0h
Journal of Materials Processing Technology 213 (2013) 143–152
Contents lists available at SciVerse ScienceDirect
Journal of Materials Processing Technology
journa l homepage: www.e lsev ier .com/ locate / jmatprotec
haracterization of welding arc and weld pool formation in vacuum gas hollowungsten arc welding
.W. Choa, S.H. Leeb, S.J. Naa,∗
Department of Mechanical Engineering, KAIST, 291 Daehak-ro, Yuseong-gu, Daejeon 305-701, Republic of KoreaWelding Research Part, Samsung Heavy Industries Co., 530 Jangpyeong-dong, Keoje, Gyeongsangnam-do 656-710, Republic of Korea
r t i c l e i n f o
rticle history:eceived 29 June 2012eceived in revised form8 September 2012ccepted 29 September 2012vailable online 8 October 2012
a b s t r a c t
An experimental method is suggested to obtain the effective arc radii for various welding conditionsin vacuum gas hollow tungsten arc welding. The irradiance distribution of welding arc next above theanode workpiece is obtained by applying Abel inversion algorithm to the CCD arc image, and then used todetermine the distribution of arc heat flux, arc pressure and current density from the physical relationsof arc irradiance, temperature and current density in gas tungsten arc welding. The resultant arc modelsare then adopted to simulate the gas hollow tungsten arc welding process for various gas flow rates.
eywords:bel inversionrc heat flux distributionurrent densityrc pressure
© 2012 Elsevier B.V. All rights reserved.
eld pool simulationacuum GHTAW
. Introduction
In welding industry, computational fluid dynamics (CFD) andnite element method (FEM) are used to simulate the molten poolshich are largely influenced by arc heat flux model. Among vari-
us arc heat flux models, Gaussian arc heat flux model, containinghe arc efficiency (�), current (I), voltage (V) and effective radius�r), was widely used in the numerical simulation. Zhang et al.2004) simulated heat and fluid flow in filet welding with quasiteady state assumption and Hu and Tsai (2008) describe moltenool dynamics in V-groove GMAW (gas metal arc welding) by vol-me of fluid (VOF) method. However, these studies conducted theimulations with the effective radii from 2 mm to 4 mm withouturther consideration of the material shape and flow rate of thehielding gas. For the better welding simulation results, the effec-ive radius of Gaussian arc heat flux model should be calculatedccurately.
Tsai and Eagar (1985) made a heat and current flux model ofTAW (gas tungsten arc welding) from the temperature distribu-
ion of the water flow and Abel inversion which are affected from
he current, arc length and composition of shielding gas. With theimilar method, Lu and Kou (1988) obtained a Gaussian distribu-ion of the power and current density. Nerovnyi and Khakhalev∗ Corresponding author. Tel.: +82 42 350 3216; fax: +82 42 350 3256.E-mail address: [email protected] (S.J. Na).
924-0136/$ – see front matter © 2012 Elsevier B.V. All rights reserved.ttp://dx.doi.org/10.1016/j.jmatprotec.2012.09.024
calculated the heat flux distribution of GHTAW (gas hollow tung-sten arc welding) from the temperature of water flow with thesplit anode in vacuum. This method, however, may bring largeerrors because it did not consider the heat loss and the effect ofgap between the copper blocks. The calculation of the arc heat fluxmodel by variable experiments is useful to apply, but the under-standing of arc physics is necessary for the more comprehensivemodel. Wu et al. (1997), Murphy et al. (2009) and Amakawa et al.(1998) used the heat transfer mechanism between the anode andanode boundary which contains electron flow, conduction and con-vection in GTAW. Recently, Tanaka et al. (2002) and Sansonnenset al. (2000) calculated the temperature and current density in theentire arc region with the ambipolar diffusion effect.
Previous Abel inversion method normally used the spline func-tion or basis set of the data. Bockasten (1961) fitted the data bythe 3rd order polynomial, Deutsch and Beniaminy (1983) con-ducted the Abel inversion by the piecewise cubic spline to fit theexperimental data. These methods, however, took so long time tocalculate and brought inaccurate errors. Cho and Na (2005) solvedthese problems and proposed a faster and more accurate Abel inver-sion method with the area matrix which adopted the axisymmetricand elliptically symmetric arc plasma model. Accordingly, theyobtained the distribution of GTA arc plasma temperature by apply-
ing the Abel inversion method to the CCD camera images of GTAarcs.VOF (volume of fluid) model which tracks the free surface tocheck the molten pool flow could express the complex welding
144 D.W. Cho et al. / Journal of Materials Proces
pni
d(ctcbsGcao
2
pcaepFGTp
wqpa
Fm
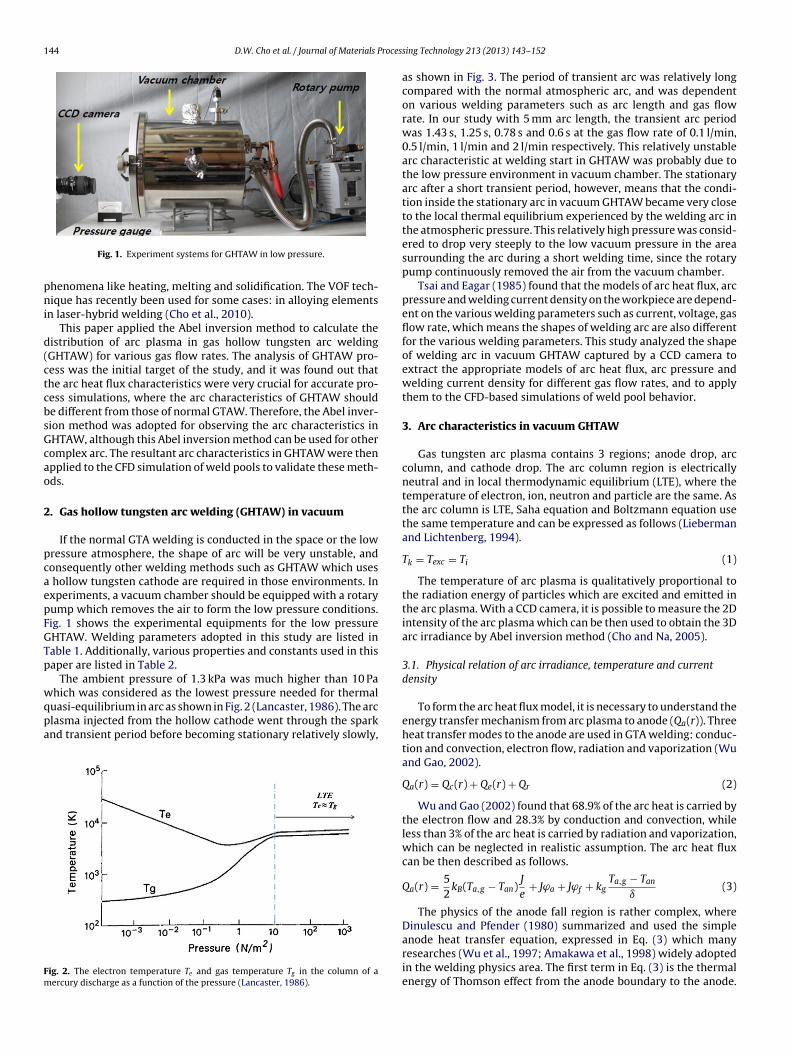
Fig. 1. Experiment systems for GHTAW in low pressure.
henomena like heating, melting and solidification. The VOF tech-ique has recently been used for some cases: in alloying elements
n laser-hybrid welding (Cho et al., 2010).This paper applied the Abel inversion method to calculate the
istribution of arc plasma in gas hollow tungsten arc weldingGHTAW) for various gas flow rates. The analysis of GHTAW pro-ess was the initial target of the study, and it was found out thathe arc heat flux characteristics were very crucial for accurate pro-ess simulations, where the arc characteristics of GHTAW shoulde different from those of normal GTAW. Therefore, the Abel inver-ion method was adopted for observing the arc characteristics inHTAW, although this Abel inversion method can be used for otheromplex arc. The resultant arc characteristics in GHTAW were thenpplied to the CFD simulation of weld pools to validate these meth-ds.
. Gas hollow tungsten arc welding (GHTAW) in vacuum
If the normal GTA welding is conducted in the space or the lowressure atmosphere, the shape of arc will be very unstable, andonsequently other welding methods such as GHTAW which useshollow tungsten cathode are required in those environments. Inxperiments, a vacuum chamber should be equipped with a rotaryump which removes the air to form the low pressure conditions.ig. 1 shows the experimental equipments for the low pressureHTAW. Welding parameters adopted in this study are listed inable 1. Additionally, various properties and constants used in thisaper are listed in Table 2.
The ambient pressure of 1.3 kPa was much higher than 10 Pa
hich was considered as the lowest pressure needed for thermaluasi-equilibrium in arc as shown in Fig. 2 (Lancaster, 1986). The arclasma injected from the hollow cathode went through the sparknd transient period before becoming stationary relatively slowly,
ig. 2. The electron temperature Te and gas temperature Tg in the column of aercury discharge as a function of the pressure (Lancaster, 1986).
sing Technology 213 (2013) 143–152
as shown in Fig. 3. The period of transient arc was relatively longcompared with the normal atmospheric arc, and was dependenton various welding parameters such as arc length and gas flowrate. In our study with 5 mm arc length, the transient arc periodwas 1.43 s, 1.25 s, 0.78 s and 0.6 s at the gas flow rate of 0.1 l/min,0.5 l/min, 1 l/min and 2 l/min respectively. This relatively unstablearc characteristic at welding start in GHTAW was probably due tothe low pressure environment in vacuum chamber. The stationaryarc after a short transient period, however, means that the condi-tion inside the stationary arc in vacuum GHTAW became very closeto the local thermal equilibrium experienced by the welding arc inthe atmospheric pressure. This relatively high pressure was consid-ered to drop very steeply to the low vacuum pressure in the areasurrounding the arc during a short welding time, since the rotarypump continuously removed the air from the vacuum chamber.
Tsai and Eagar (1985) found that the models of arc heat flux, arcpressure and welding current density on the workpiece are depend-ent on the various welding parameters such as current, voltage, gasflow rate, which means the shapes of welding arc are also differentfor the various welding parameters. This study analyzed the shapeof welding arc in vacuum GHTAW captured by a CCD camera toextract the appropriate models of arc heat flux, arc pressure andwelding current density for different gas flow rates, and to applythem to the CFD-based simulations of weld pool behavior.
3. Arc characteristics in vacuum GHTAW
Gas tungsten arc plasma contains 3 regions; anode drop, arccolumn, and cathode drop. The arc column region is electricallyneutral and in local thermodynamic equilibrium (LTE), where thetemperature of electron, ion, neutron and particle are the same. Asthe arc column is LTE, Saha equation and Boltzmann equation usethe same temperature and can be expressed as follows (Liebermanand Lichtenberg, 1994).
Tk = Texc = Ti (1)
The temperature of arc plasma is qualitatively proportional tothe radiation energy of particles which are excited and emitted inthe arc plasma. With a CCD camera, it is possible to measure the 2Dintensity of the arc plasma which can be then used to obtain the 3Darc irradiance by Abel inversion method (Cho and Na, 2005).
3.1. Physical relation of arc irradiance, temperature and currentdensity
To form the arc heat flux model, it is necessary to understand theenergy transfer mechanism from arc plasma to anode (Qa(r)). Threeheat transfer modes to the anode are used in GTA welding: conduc-tion and convection, electron flow, radiation and vaporization (Wuand Gao, 2002).
Qa(r) = Qc(r) + Qe(r) + Qr (2)
Wu and Gao (2002) found that 68.9% of the arc heat is carried bythe electron flow and 28.3% by conduction and convection, whileless than 3% of the arc heat is carried by radiation and vaporization,which can be neglected in realistic assumption. The arc heat fluxcan be then described as follows.
Qa(r) = 52
kB(Ta,g − Tan)J
e+ Jϕa + Jϕf + kg
Ta,g − Tan
ı(3)
The physics of the anode fall region is rather complex, whereDinulescu and Pfender (1980) summarized and used the simple
anode heat transfer equation, expressed in Eq. (3) which manyresearches (Wu et al., 1997; Amakawa et al., 1998) widely adoptedin the welding physics area. The first term in Eq. (3) is the thermalenergy of Thomson effect from the anode boundary to the anode.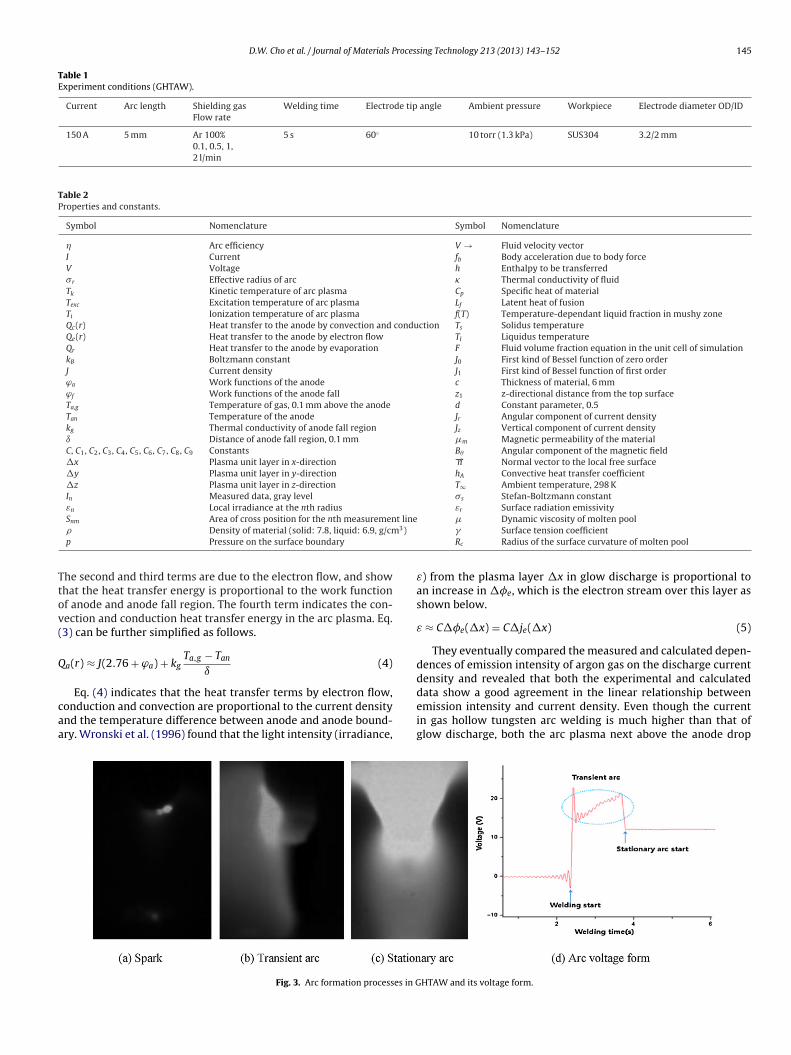
D.W. Cho et al. / Journal of Materials Processing Technology 213 (2013) 143–152 145
Table 1Experiment conditions (GHTAW).
Current Arc length Shielding gasFlow rate
Welding time Electrode tip angle Ambient pressure Workpiece Electrode diameter OD/ID
150 A 5 mm Ar 100%0.1, 0.5, 1,2 l/min
5 s 60◦ 10 torr (1.3 kPa) SUS304 3.2/2 mm
Table 2Properties and constants.
Symbol Nomenclature Symbol Nomenclature
� Arc efficiency V → Fluid velocity vectorI Current fb Body acceleration due to body forceV Voltage h Enthalpy to be transferred�r Effective radius of arc � Thermal conductivity of fluidTk Kinetic temperature of arc plasma Cp Specific heat of materialTexc Excitation temperature of arc plasma Lf Latent heat of fusionTi Ionization temperature of arc plasma f(T) Temperature-dependant liquid fraction in mushy zoneQc(r) Heat transfer to the anode by convection and conduction Ts Solidus temperatureQe(r) Heat transfer to the anode by electron flow Tl Liquidus temperatureQr Heat transfer to the anode by evaporation F Fluid volume fraction equation in the unit cell of simulationkB Boltzmann constant J0 First kind of Bessel function of zero orderJ Current density J1 First kind of Bessel function of first orderϕa Work functions of the anode c Thickness of material, 6 mmϕf Work functions of the anode fall z1 z-directional distance from the top surfaceTa,g Temperature of gas, 0.1 mm above the anode d Constant parameter, 0.5Tan Temperature of the anode Jr Angular component of current densitykg Thermal conductivity of anode fall region Jz Vertical component of current densityı Distance of anode fall region, 0.1 mm �m Magnetic permeability of the materialC, C1, C2, C3, C4, C5, C6, C7, C8, C9 Constants B� Angular component of the magnetic field�x Plasma unit layer in x-direction −→n Normal vector to the local free surface�y Plasma unit layer in y-direction hA Convective heat transfer coefficient�z Plasma unit layer in z-direction T∞ Ambient temperature, 298 KIn Measured data, gray level �s Stefan-Boltzmann constantεn Local irradiance at the nth radius εr Surface radiation emissivity
t line3)
Ttov(
Q
caa
Snm Area of cross position for the nth measuremen Density of material (solid: 7.8, liquid: 6.9, g/cmp Pressure on the surface boundary
he second and third terms are due to the electron flow, and showhat the heat transfer energy is proportional to the work functionf anode and anode fall region. The fourth term indicates the con-ection and conduction heat transfer energy in the arc plasma. Eq.3) can be further simplified as follows.
a(r) ≈ J(2.76 + ϕa) + kgTa,g − Tan
ı(4)
Eq. (4) indicates that the heat transfer terms by electron flow,onduction and convection are proportional to the current densitynd the temperature difference between anode and anode bound-ry. Wronski et al. (1996) found that the light intensity (irradiance,
Fig. 3. Arc formation processes in G
� Dynamic viscosity of molten pool� Surface tension coefficientRc Radius of the surface curvature of molten pool
ε) from the plasma layer �x in glow discharge is proportional toan increase in ��e, which is the electron stream over this layer asshown below.
ε ≈ C��e(�x) = C�je(�x) (5)
They eventually compared the measured and calculated depen-dences of emission intensity of argon gas on the discharge currentdensity and revealed that both the experimental and calculated
data show a good agreement in the linear relationship betweenemission intensity and current density. Even though the currentin gas hollow tungsten arc welding is much higher than that ofglow discharge, both the arc plasma next above the anode dropHTAW and its voltage form.
146 D.W. Cho et al. / Journal of Materials Processing Technology 213 (2013) 143–152
ht inte
zdliaFa
tadfa
�
ε
aifm1si5ra
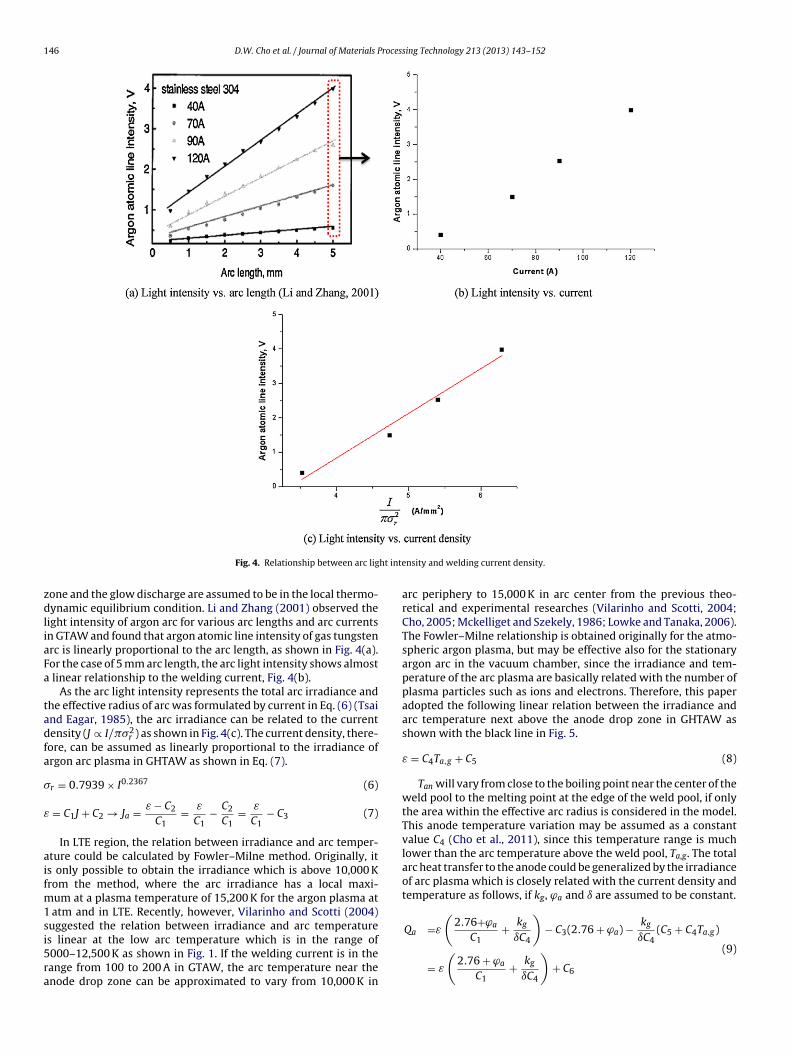
Fig. 4. Relationship between arc lig
one and the glow discharge are assumed to be in the local thermo-ynamic equilibrium condition. Li and Zhang (2001) observed the
ight intensity of argon arc for various arc lengths and arc currentsn GTAW and found that argon atomic line intensity of gas tungstenrc is linearly proportional to the arc length, as shown in Fig. 4(a).or the case of 5 mm arc length, the arc light intensity shows almostlinear relationship to the welding current, Fig. 4(b).
As the arc light intensity represents the total arc irradiance andhe effective radius of arc was formulated by current in Eq. (6) (Tsaind Eagar, 1985), the arc irradiance can be related to the currentensity (J ∝ I/ �2
r ) as shown in Fig. 4(c). The current density, there-ore, can be assumed as linearly proportional to the irradiance ofrgon arc plasma in GHTAW as shown in Eq. (7).
r = 0.7939 × I0.2367 (6)
= C1J + C2 → Ja = ε − C2
C1= ε
C1− C2
C1= ε
C1− C3 (7)
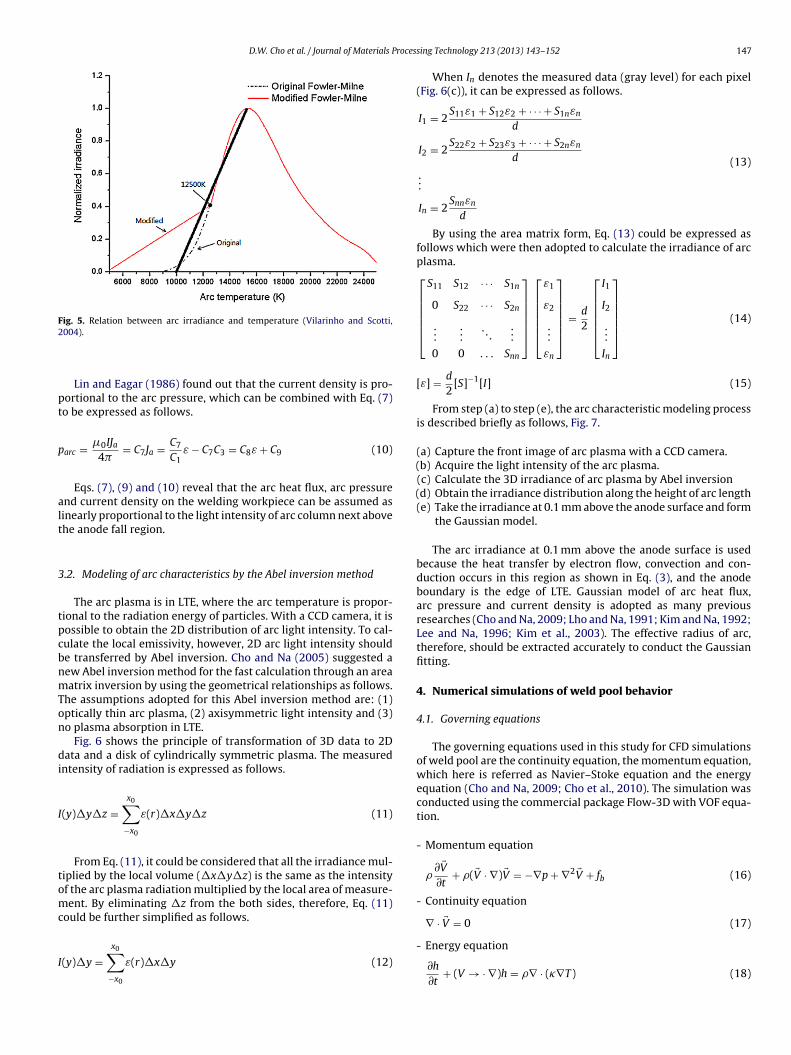
In LTE region, the relation between irradiance and arc temper-ture could be calculated by Fowler–Milne method. Originally, its only possible to obtain the irradiance which is above 10,000 Krom the method, where the arc irradiance has a local maxi-
um at a plasma temperature of 15,200 K for the argon plasma atatm and in LTE. Recently, however, Vilarinho and Scotti (2004)
uggested the relation between irradiance and arc temperature
s linear at the low arc temperature which is in the range of000–12,500 K as shown in Fig. 1. If the welding current is in theange from 100 to 200 A in GTAW, the arc temperature near thenode drop zone can be approximated to vary from 10,000 K innsity and welding current density.
arc periphery to 15,000 K in arc center from the previous theo-retical and experimental researches (Vilarinho and Scotti, 2004;Cho, 2005; Mckelliget and Szekely, 1986; Lowke and Tanaka, 2006).The Fowler–Milne relationship is obtained originally for the atmo-spheric argon plasma, but may be effective also for the stationaryargon arc in the vacuum chamber, since the irradiance and tem-perature of the arc plasma are basically related with the number ofplasma particles such as ions and electrons. Therefore, this paperadopted the following linear relation between the irradiance andarc temperature next above the anode drop zone in GHTAW asshown with the black line in Fig. 5.
ε = C4Ta,g + C5 (8)
Tan will vary from close to the boiling point near the center of theweld pool to the melting point at the edge of the weld pool, if onlythe area within the effective arc radius is considered in the model.This anode temperature variation may be assumed as a constantvalue C4 (Cho et al., 2011), since this temperature range is muchlower than the arc temperature above the weld pool, Ta,g. The totalarc heat transfer to the anode could be generalized by the irradianceof arc plasma which is closely related with the current density andtemperature as follows, if kg, ϕa and ı are assumed to be constant.
Q =ε
(2.76+ϕa + kg
)− C (2.76 + ϕ ) − kg (C + C T )
a C1 ıC43 aıC4
5 4 a.g
= ε
(2.76 + ϕa
C1+ kg
ıC4
)+ C6
(9)
D.W. Cho et al. / Journal of Materials Proces
Fig. 5. Relation between arc irradiance and temperature (Vilarinho and Scotti,2
pt
p
alt
3
tpcbnmTon
di
I
tomc
I
(
(
- Energy equation
004).
Lin and Eagar (1986) found out that the current density is pro-ortional to the arc pressure, which can be combined with Eq. (7)o be expressed as follows.
arc = �0IJa4
= C7Ja = C7
C1ε − C7C3 = C8ε + C9 (10)
Eqs. (7), (9) and (10) reveal that the arc heat flux, arc pressurend current density on the welding workpiece can be assumed asinearly proportional to the light intensity of arc column next abovehe anode fall region.
.2. Modeling of arc characteristics by the Abel inversion method
The arc plasma is in LTE, where the arc temperature is propor-ional to the radiation energy of particles. With a CCD camera, it isossible to obtain the 2D distribution of arc light intensity. To cal-ulate the local emissivity, however, 2D arc light intensity shoulde transferred by Abel inversion. Cho and Na (2005) suggested aew Abel inversion method for the fast calculation through an areaatrix inversion by using the geometrical relationships as follows.
he assumptions adopted for this Abel inversion method are: (1)ptically thin arc plasma, (2) axisymmetric light intensity and (3)o plasma absorption in LTE.
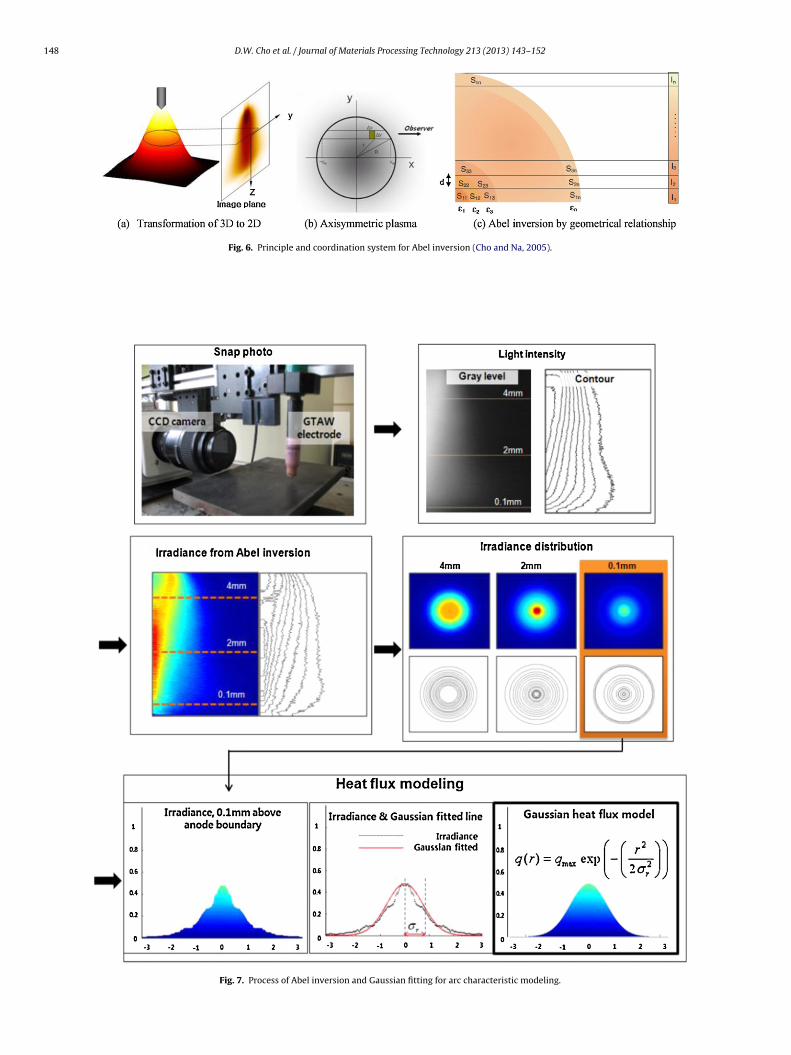
Fig. 6 shows the principle of transformation of 3D data to 2Data and a disk of cylindrically symmetric plasma. The measured
ntensity of radiation is expressed as follows.
(y)�y�z =x0∑
−x0
ε(r)�x�y�z (11)
From Eq. (11), it could be considered that all the irradiance mul-iplied by the local volume (�x�y�z) is the same as the intensityf the arc plasma radiation multiplied by the local area of measure-ent. By eliminating �z from the both sides, therefore, Eq. (11)
ould be further simplified as follows.
x0∑
(y)�y =−x0
ε(r)�x�y (12)
sing Technology 213 (2013) 143–152 147
When In denotes the measured data (gray level) for each pixel(Fig. 6(c)), it can be expressed as follows.
I1 = 2S11ε1 + S12ε2 + · · · + S1nεn
d
I2 = 2S22ε2 + S23ε3 + · · · + S2nεn
d
...
In = 2Snnεn
d
(13)
By using the area matrix form, Eq. (13) could be expressed asfollows which were then adopted to calculate the irradiance of arcplasma.⎡⎢⎢⎢⎢⎣
S11 S12 · · · S1n
0 S22 · · · S2n
......
. . ....
0 0 . . . Snn
⎤⎥⎥⎥⎥⎦
⎡⎢⎢⎢⎢⎣
ε1
ε2
...
εn
⎤⎥⎥⎥⎥⎦ = d
2
⎡⎢⎢⎢⎢⎣
I1
I2
...
In
⎤⎥⎥⎥⎥⎦ (14)
[ε] = d
2[S]−1[I] (15)
From step (a) to step (e), the arc characteristic modeling processis described briefly as follows, Fig. 7.
(a) Capture the front image of arc plasma with a CCD camera.b) Acquire the light intensity of the arc plasma.
(c) Calculate the 3D irradiance of arc plasma by Abel inversiond) Obtain the irradiance distribution along the height of arc length
(e) Take the irradiance at 0.1 mm above the anode surface and formthe Gaussian model.
The arc irradiance at 0.1 mm above the anode surface is usedbecause the heat transfer by electron flow, convection and con-duction occurs in this region as shown in Eq. (3), and the anodeboundary is the edge of LTE. Gaussian model of arc heat flux,arc pressure and current density is adopted as many previousresearches (Cho and Na, 2009; Lho and Na, 1991; Kim and Na, 1992;Lee and Na, 1996; Kim et al., 2003). The effective radius of arc,therefore, should be extracted accurately to conduct the Gaussianfitting.
4. Numerical simulations of weld pool behavior
4.1. Governing equations
The governing equations used in this study for CFD simulationsof weld pool are the continuity equation, the momentum equation,which here is referred as Navier–Stoke equation and the energyequation (Cho and Na, 2009; Cho et al., 2010). The simulation wasconducted using the commercial package Flow-3D with VOF equa-tion.
- Momentum equation
∂ �V∂t
+ ( �V · ∇) �V = −∇p + ∇2 �V + fb (16)
- Continuity equation
∇ · �V = 0 (17)
∂h
∂t+ (V → · ∇)h = ∇ · (�∇T) (18)
148 D.W. Cho et al. / Journal of Materials Processing Technology 213 (2013) 143–152
Fig. 6. Principle and coordination system for Abel inversion (Cho and Na, 2005).
Fig. 7. Process of Abel inversion and Gaussian fitting for arc characteristic modeling.
rocessing Technology 213 (2013) 143–152 149
-
4
-
-
-
sft
J
J
B
F
F
4
ta
Table 3Effective radius along the gas flow rate (GHTAW).
Gas flow rate [l/min] 0.1 0.5 1.0 2.0
D.W. Cho et al. / Journal of Materials P
where
h = CpT + f (T)Lf (19)
f (T) =
⎡⎢⎢⎣
0 (T ≤ Ts)
T − Ts
Tl − Ts(Ts < T < Tl)
1 (Tl ≤ T)
(20)
VOF equation
dF
dt= ∂F
∂t+ ( �V · ∇)F = 0 (21)
.2. Welding process models
Arc heat flux modelThe arc heat flux model in Eq. (22) is assumed to impact the
workpiece top surface perpendicularly and regarded as the topsurface boundary condition. In this study, the modified heat fluxmodel Qa(r) which adopted the variable effective radius of arcplasma was applied, Average values of voltage and current, mea-sured in experiments are used for simulations as follows.
Qa(r) = �VI
2 �2r
exp
(−
(r2
2�2r
))(22)
The efficiency parameter of the energy transfer to the anode inEq. (22) could reach 0.7–0.86 of the discharge energy in GHTAW(Nerovnyi and Khakhalev, 2008). This study, therefore, adoptedthe arc efficiency of 0.8 for numerical simulations of weld pooldynamics.Arc pressure model
This study assumed that the distribution of the arc pressurewould follow the distribution of current density. The pressure ofthe arc plasma can be modeled by a Gaussian model with thesame effective radius of arc heat flux as follows.
parc(x, y) = �0I2
4 2�2r
exp
(−
(r2
2�2r
))(23)
Here, �0 is the magnetic permeability of free space.Electromagnetic force (EMF) model
To determine the electromagnetic force (EMF), the current den-ity and self-induced magnetic field should be used for the bodyorce (Kou and Sun, 1985). Eqs. from (24)–(26) have the same effec-ive arc radius as the arc heat flux model.
z = Ia2
∞∫0
�J0(�r) exp
(−�2�2
r
4d
)sinh[�(c − z)]
sinh(�c)d� (24)
r = Ia2
∞∫0
�J1(�r) exp
(−�2�2
r
4d
)cosh[�(c − z)]
sinh(�c)d� (25)
� = �mIa2
∞∫0
J1(�r) exp
(−�2�2
r
4d
)sinh[�(c − z)]
sinh(�c)d� (26)
z = JzB� (27)
r = −JzB� (28)
.3. Other welding models
The arc heat flux, arc pressure and EMF models are affected fromhe effective radius of the arc. Some welding models such as buoy-ncy force and drag force of arc plasma, however, do not always
Effective radius (mm), �r 5.45 3.55 2.70 2.30
consider the effective radius of arc. In this study, the same modelswere used for these terms as in the previous studies (Cho and Na,2009; Cho et al., 2010).
4.4. Boundary conditions
The arc heat flux and arc pressure models are used as bound-ary conditions for the top free surface. On the boundary, energy isbalanced with the arc heat flux (Qarc), heat loss from convection,radiation and evaporation. It can be expressed as follows:
k∂T
∂−→n = Qarc − hA(T − T∞) − �sεr(T4 − T4∞) − qvap (29)
Eq. (30) is used to calculate the pressure boundary conditions.
−p + 2�∂T
∂−→n = −Parc − �
Rc(30)
5. Results and discussion
5.1. Arc characteristics in GHTAW
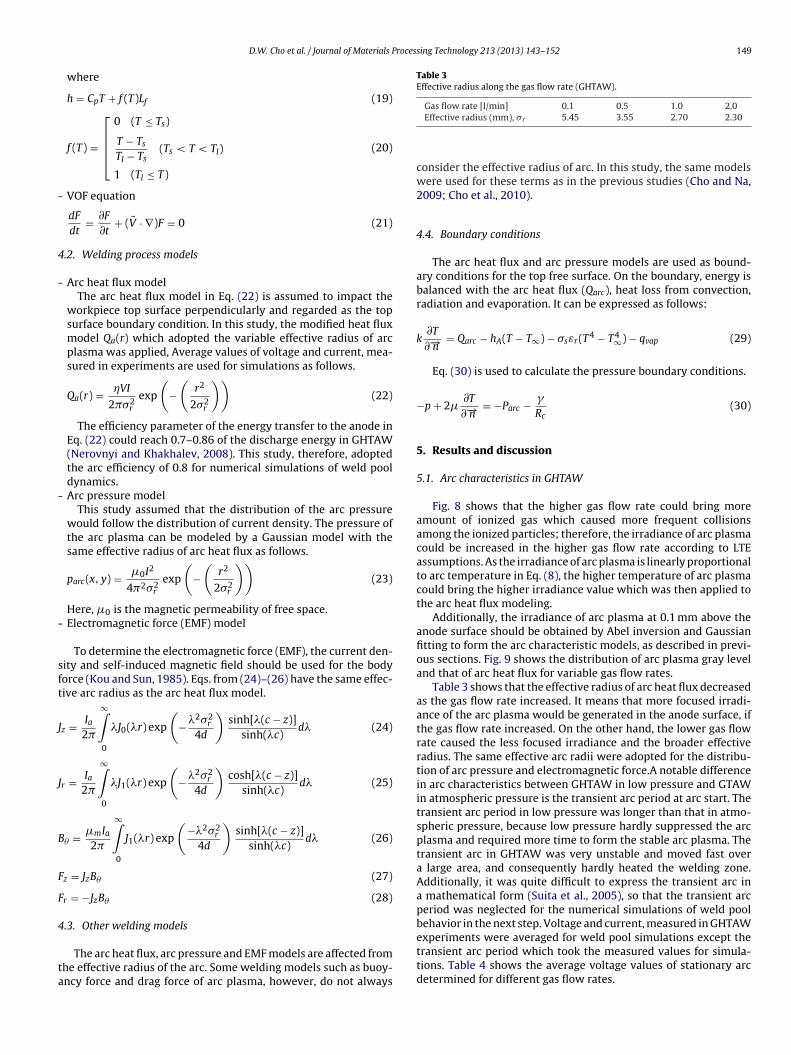
Fig. 8 shows that the higher gas flow rate could bring moreamount of ionized gas which caused more frequent collisionsamong the ionized particles; therefore, the irradiance of arc plasmacould be increased in the higher gas flow rate according to LTEassumptions. As the irradiance of arc plasma is linearly proportionalto arc temperature in Eq. (8), the higher temperature of arc plasmacould bring the higher irradiance value which was then applied tothe arc heat flux modeling.
Additionally, the irradiance of arc plasma at 0.1 mm above theanode surface should be obtained by Abel inversion and Gaussianfitting to form the arc characteristic models, as described in previ-ous sections. Fig. 9 shows the distribution of arc plasma gray leveland that of arc heat flux for variable gas flow rates.
Table 3 shows that the effective radius of arc heat flux decreasedas the gas flow rate increased. It means that more focused irradi-ance of the arc plasma would be generated in the anode surface, ifthe gas flow rate increased. On the other hand, the lower gas flowrate caused the less focused irradiance and the broader effectiveradius. The same effective arc radii were adopted for the distribu-tion of arc pressure and electromagnetic force.A notable differencein arc characteristics between GHTAW in low pressure and GTAWin atmospheric pressure is the transient arc period at arc start. Thetransient arc period in low pressure was longer than that in atmo-spheric pressure, because low pressure hardly suppressed the arcplasma and required more time to form the stable arc plasma. Thetransient arc in GHTAW was very unstable and moved fast overa large area, and consequently hardly heated the welding zone.Additionally, it was quite difficult to express the transient arc ina mathematical form (Suita et al., 2005), so that the transient arcperiod was neglected for the numerical simulations of weld poolbehavior in the next step. Voltage and current, measured in GHTAWexperiments were averaged for weld pool simulations except the
transient arc period which took the measured values for simula-tions. Table 4 shows the average voltage values of stationary arcdetermined for different gas flow rates.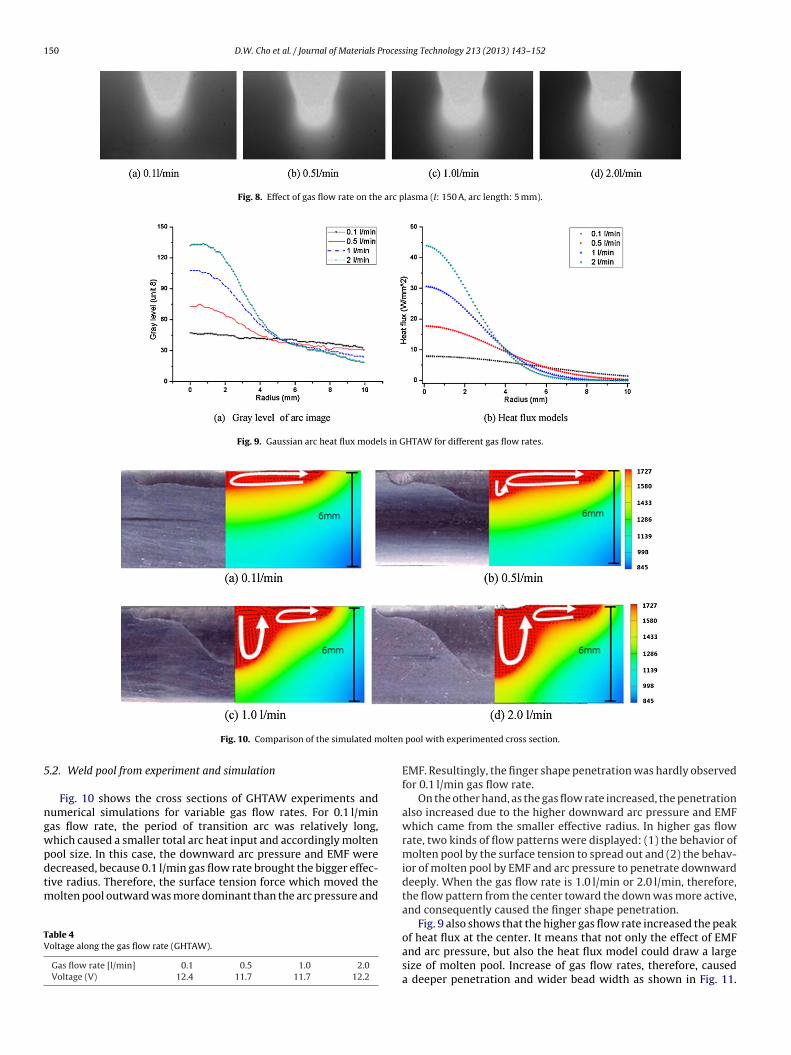
150 D.W. Cho et al. / Journal of Materials Processing Technology 213 (2013) 143–152
Fig. 8. Effect of gas flow rate on the arc plasma (I: 150 A, arc length: 5 mm).
Fig. 9. Gaussian arc heat flux models in GHTAW for different gas flow rates.
olten
5
ngwpdtm
TV
Fig. 10. Comparison of the simulated m
.2. Weld pool from experiment and simulation
Fig. 10 shows the cross sections of GHTAW experiments andumerical simulations for variable gas flow rates. For 0.1 l/minas flow rate, the period of transition arc was relatively long,hich caused a smaller total arc heat input and accordingly moltenool size. In this case, the downward arc pressure and EMF were
ecreased, because 0.1 l/min gas flow rate brought the bigger effec-ive radius. Therefore, the surface tension force which moved theolten pool outward was more dominant than the arc pressure and
able 4oltage along the gas flow rate (GHTAW).
Gas flow rate [l/min] 0.1 0.5 1.0 2.0Voltage (V) 12.4 11.7 11.7 12.2
pool with experimented cross section.
EMF. Resultingly, the finger shape penetration was hardly observedfor 0.1 l/min gas flow rate.
On the other hand, as the gas flow rate increased, the penetrationalso increased due to the higher downward arc pressure and EMFwhich came from the smaller effective radius. In higher gas flowrate, two kinds of flow patterns were displayed: (1) the behavior ofmolten pool by the surface tension to spread out and (2) the behav-ior of molten pool by EMF and arc pressure to penetrate downwarddeeply. When the gas flow rate is 1.0 l/min or 2.0 l/min, therefore,the flow pattern from the center toward the down was more active,and consequently caused the finger shape penetration.
Fig. 9 also shows that the higher gas flow rate increased the peak
of heat flux at the center. It means that not only the effect of EMFand arc pressure, but also the heat flux model could draw a largesize of molten pool. Increase of gas flow rates, therefore, causeda deeper penetration and wider bead width as shown in Fig. 11.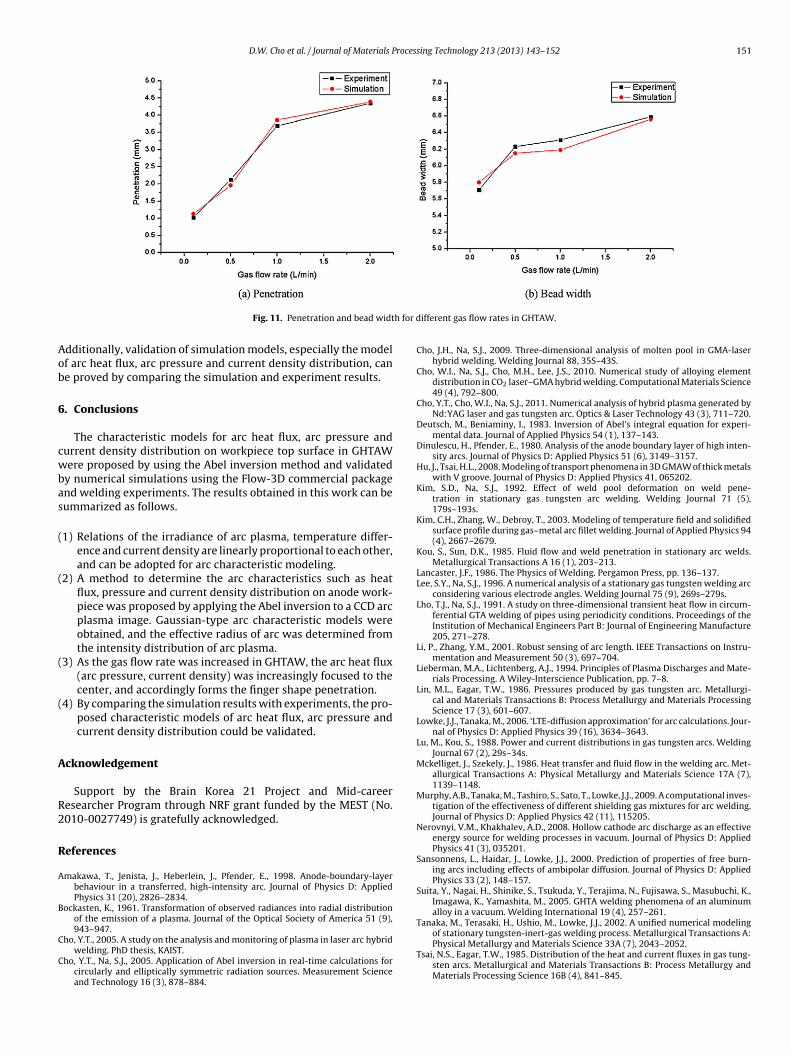
D.W. Cho et al. / Journal of Materials Processing Technology 213 (2013) 143–152 151
h for d
Aob
6
cwbas
(
(
(
(
A
R2
R
A
B
C
C
Fig. 11. Penetration and bead widt
dditionally, validation of simulation models, especially the modelf arc heat flux, arc pressure and current density distribution, cane proved by comparing the simulation and experiment results.
. Conclusions
The characteristic models for arc heat flux, arc pressure andurrent density distribution on workpiece top surface in GHTAWere proposed by using the Abel inversion method and validated
y numerical simulations using the Flow-3D commercial packagend welding experiments. The results obtained in this work can beummarized as follows.
1) Relations of the irradiance of arc plasma, temperature differ-ence and current density are linearly proportional to each other,and can be adopted for arc characteristic modeling.
2) A method to determine the arc characteristics such as heatflux, pressure and current density distribution on anode work-piece was proposed by applying the Abel inversion to a CCD arcplasma image. Gaussian-type arc characteristic models wereobtained, and the effective radius of arc was determined fromthe intensity distribution of arc plasma.
3) As the gas flow rate was increased in GHTAW, the arc heat flux(arc pressure, current density) was increasingly focused to thecenter, and accordingly forms the finger shape penetration.
4) By comparing the simulation results with experiments, the pro-posed characteristic models of arc heat flux, arc pressure andcurrent density distribution could be validated.
cknowledgement
Support by the Brain Korea 21 Project and Mid-careeresearcher Program through NRF grant funded by the MEST (No.010-0027749) is gratefully acknowledged.
eferences
makawa, T., Jenista, J., Heberlein, J., Pfender, E., 1998. Anode-boundary-layerbehaviour in a transferred, high-intensity arc. Journal of Physics D: AppliedPhysics 31 (20), 2826–2834.
ockasten, K., 1961. Transformation of observed radiances into radial distributionof the emission of a plasma. Journal of the Optical Society of America 51 (9),943–947.
ho, Y.T., 2005. A study on the analysis and monitoring of plasma in laser arc hybridwelding. PhD thesis, KAIST.
ho, Y.T., Na, S.J., 2005. Application of Abel inversion in real-time calculations forcircularly and elliptically symmetric radiation sources. Measurement Scienceand Technology 16 (3), 878–884.
ifferent gas flow rates in GHTAW.
Cho, J.H., Na, S.J., 2009. Three-dimensional analysis of molten pool in GMA-laserhybrid welding. Welding Journal 88, 35S–43S.
Cho, W.I., Na, S.J., Cho, M.H., Lee, J.S., 2010. Numerical study of alloying elementdistribution in CO2 laser–GMA hybrid welding. Computational Materials Science49 (4), 792–800.
Cho, Y.T., Cho, W.I., Na, S.J., 2011. Numerical analysis of hybrid plasma generated byNd:YAG laser and gas tungsten arc. Optics & Laser Technology 43 (3), 711–720.
Deutsch, M., Beniaminy, I., 1983. Inversion of Abel’s integral equation for experi-mental data. Journal of Applied Physics 54 (1), 137–143.
Dinulescu, H., Pfender, E., 1980. Analysis of the anode boundary layer of high inten-sity arcs. Journal of Physics D: Applied Physics 51 (6), 3149–3157.
Hu, J., Tsai, H.L., 2008. Modeling of transport phenomena in 3D GMAW of thick metalswith V groove. Journal of Physics D: Applied Physics 41, 065202.
Kim, S.D., Na, S.J., 1992. Effect of weld pool deformation on weld pene-tration in stationary gas tungsten arc welding. Welding Journal 71 (5),179s–193s.
Kim, C.H., Zhang, W., Debroy, T., 2003. Modeling of temperature field and solidifiedsurface profile during gas–metal arc fillet welding. Journal of Applied Physics 94(4), 2667–2679.
Kou, S., Sun, D.K., 1985. Fluid flow and weld penetration in stationary arc welds.Metallurgical Transactions A 16 (1), 203–213.
Lancaster, J.F., 1986. The Physics of Welding. Pergamon Press, pp. 136–137.Lee, S.Y., Na, S.J., 1996. A numerical analysis of a stationary gas tungsten welding arc
considering various electrode angles. Welding Journal 75 (9), 269s–279s.Lho, T.J., Na, S.J., 1991. A study on three-dimensional transient heat flow in circum-
ferential GTA welding of pipes using periodicity conditions. Proceedings of theInstitution of Mechanical Engineers Part B: Journal of Engineering Manufacture205, 271–278.
Li, P., Zhang, Y.M., 2001. Robust sensing of arc length. IEEE Transactions on Instru-mentation and Measurement 50 (3), 697–704.
Lieberman, M.A., Lichtenberg, A.J., 1994. Principles of Plasma Discharges and Mate-rials Processing. A Wiley-Interscience Publication, pp. 7–8.
Lin, M.L., Eagar, T.W., 1986. Pressures produced by gas tungsten arc. Metallurgi-cal and Materials Transactions B: Process Metallurgy and Materials ProcessingScience 17 (3), 601–607.
Lowke, J.J., Tanaka, M., 2006. ‘LTE-diffusion approximation’ for arc calculations. Jour-nal of Physics D: Applied Physics 39 (16), 3634–3643.
Lu, M., Kou, S., 1988. Power and current distributions in gas tungsten arcs. WeldingJournal 67 (2), 29s–34s.
Mckelliget, J., Szekely, J., 1986. Heat transfer and fluid flow in the welding arc. Met-allurgical Transactions A: Physical Metallurgy and Materials Science 17A (7),1139–1148.
Murphy, A.B., Tanaka, M., Tashiro, S., Sato, T., Lowke, J.J., 2009. A computational inves-tigation of the effectiveness of different shielding gas mixtures for arc welding.Journal of Physics D: Applied Physics 42 (11), 115205.
Nerovnyi, V.M., Khakhalev, A.D., 2008. Hollow cathode arc discharge as an effectiveenergy source for welding processes in vacuum. Journal of Physics D: AppliedPhysics 41 (3), 035201.
Sansonnens, L., Haidar, J., Lowke, J.J., 2000. Prediction of properties of free burn-ing arcs including effects of ambipolar diffusion. Journal of Physics D: AppliedPhysics 33 (2), 148–157.
Suita, Y., Nagai, H., Shinike, S., Tsukuda, Y., Terajima, N., Fujisawa, S., Masubuchi, K.,Imagawa, K., Yamashita, M., 2005. GHTA welding phenomena of an aluminumalloy in a vacuum. Welding International 19 (4), 257–261.
Tanaka, M., Terasaki, H., Ushio, M., Lowke, J.J., 2002. A unified numerical modeling
of stationary tungsten-inert-gas welding process. Metallurgical Transactions A:Physical Metallurgy and Materials Science 33A (7), 2043–2052.Tsai, N.S., Eagar, T.W., 1985. Distribution of the heat and current fluxes in gas tung-sten arcs. Metallurgical and Materials Transactions B: Process Metallurgy andMaterials Processing Science 16B (4), 841–845.

1 roces
V
W
52 D.W. Cho et al. / Journal of Materials P
ilarinho, L.O., Scotti, A., 2004. Proposal for a modified Fowler–Milne methodto determine the temperature profile in TIG welding at low currents. Jour-
nal of the Brazilian Society of Mechanical Sciences and Engineering 26 (1),34–39.ronski, Z., Sielanko, J., Sullivan, J.L., 1996. Studies of light emission from cathodematerial in the plasma phase of a glow discharge. Journal of Physics D: AppliedPhysics 29 (6), 1509–1514.
sing Technology 213 (2013) 143–152
Wu, C.S., Gao, J.Q., 2002. Analysis of the heat flux distribution at the anode of a TIGwelding arc. Computation Materials Science 24 (3), 323–327.
Wu, C.S., Ushio, M., Tanaka, M., 1997. Analysis of the TIG welding arc behavior.Computational Materials Science 7 (3), 308–314.
Zhang, W., Kim, C.H., Debroy, T., 2004. Heat and fluid flow in complex joints duringgas metal arc welding. Part II: application to fillet welding of mild steel. Journalof Applied Physics 95 (9), 5220–5229.