characterization of water uptake by organic coatings used for the corrosion protection of steel
TRANSCRIPT
Int. J. Electrochem. Sci., 7 (2012) 8444 - 8457
International Journal of
ELECTROCHEMICAL SCIENCE
www.electrochemsci.org
Characterization of Water Uptake by Organic Coatings Used
for the Corrosion Protection of Steel as Determined from
Capacitance Measurements
C. Moreno1, S. Hernández
1, J.J. Santana
2, J. González-Guzmán
1, R.M. Souto
1,3, S. González
1,3,*
1 Department of Physical Chemistry, University of La Laguna, E-38200 La Laguna, Tenerife, Canary
Islands, Spain 2 Department of Process Engineering, University of Las Palmas de Gran Canaria, Campus
Universitario de Tafira, E-35017 Las Palmas de Gran Canaria, Canary Islands, Spain 3 Instituto de Materiales y Nanotecnologías, University of La Laguna, E-38200 La Laguna, Tenerife,
Canary Islands, Spain *E-mail: [email protected]
Received: 6 July 2012 / Accepted: 2 August 2012 / Published: 1 September 2012
Water absorption by a coating on a metal is a major factor affecting its corrosion protection efficiency.
It is usually determined from the increase of coating capacity with time, which is taken as a measure of
the water volume ratio in the system. In this communication, the early stages of water uptake by three
paint systems applied on galvanized steel have been investigated. The models proposed by Brasher and
Kingsbury (BK), and the discrete (DM) and the continuous (CM) models proposed by Bellucci and
Nicodemo, were employed to evaluate water absorption. It has been found that the amount of water
adsorbed in the coating depended on both the nature and the thickness of the film, though different
results were delivered by these methods, with convergence occurring only in the saturation stage. Next,
water diffusion coefficients were determined, and they were observed to vary with the thickness of the
polymer film regardless their actual composition. The time evolution of the diffusion coefficients
could be adequately described using the DM model.
Keywords: organic coatings; corrosion protection; water uptake; EIS; diffusion coefficients.
1. INTRODUCTION
The main causes for the degradation of metal-coating systems are blister formation and
delamination, both of them leading to losses in the adhesion of the coating to the metal substrate. The
common results of those processes are that the underlying metal gets in direct contact with the
aggressive environment, and the onset of metal corrosion reactions. Blister formation processes

Int. J. Electrochem. Sci., Vol. 7, 2012
8445
originate from the transport of aggressive species from the environment, namely water and oxygen,
through the coating. Water diffuses through the polymeric matrix almost immediately the coated metal
enters in contact with the aqueous environment. Adhesion losses at the metal-polymer interface
eventually occur, and the onset of metal corrosion reactions will happen at the buried metal surface.
All these changes can be monitored in real time by means of electrochemical impedance spectroscopy
(EIS) because water uptake by the coating produces changes in the dielectric properties of the material.
The increased coating permittivity associated with this process can be followed from the changes in the
coating capacitance with time. The earliest works in this field were performed by Wormwell and
Brasher [1], Brasher and Kingsbury [2], and Gentles [3] in the 1950’s, though actually they employed
a variation of the equation originally proposed by Hartshorn et al. [4]. Following them, numerous
workers have employed EIS to determine the water content of organic coatings applied on metals [1,5-
15].
The theoretical model employed in those studies is rather simple. It considers the coating as a
dielectric, whose capacitance, Cpf, is directly proportional to its relative dielectric constant, ε, the
dielectric constant of vacuum, ε0 (namely 8.854x10
-14 F cm
-1), and the area of the capacitor, A. In this
context, the considered area coincides with the exposed area under the organic coating, and it is
inversely proportional to the thickness of the coating, d:
d
AC pf
0 (1)
At typical ambient temperatures (i.e., 293-298 K), the dielectric constant of a polymeric coating
is comprised between 3 and 8, whereas that of water is much higher, namely 80.2 – 82.2 in the same
temperature range [16]. Thus, water uptake by the coating will produce a major increase in its
dielectric constant, with the consequent increase of the coating capacitance.
The most widely employed model for the quantification of water uptake by a coating was
derived by Brasher and Kingsbury [2], and the relevant equation is:
w
t
CC
K
log
log0
(2)
where Ct and C0 give the capacitance for a time t and for the dry coating, respectively; εw is the
dielectric constant of water at the working temperature; and Φ is the water content expressed as its
volume fraction in the coating. Water absorption occurs in a greater extent immediately after the
coating is exposed to the aqueous environment. This is the reason that electrochemical impedance
spectra should be collected during a short period of time to allow for the time variation of the system to
be followed with the highest number of data while the system is maintained under fixed experimental
conditions.
Unfortunately, discrepancies are found between the water uptake data determined using
Brasher and Kingsbury’s equation and those obtained by other techniques, particularly gravimetric

Int. J. Electrochem. Sci., Vol. 7, 2012
8446
methods, due to the pore distribution in the system. Indeed, the coating capacitance does not
exclusively depend on the amount of water, but on the way water enters the coating [17], which may
lead to wrong estimates of water penetration in coatings. To overcome this problem, some authors
have recommended the combined use of gravimetric and capacitance measurements [18]. Some
alternative models have also been proposed for the estimation of water uptake using electrochemical
techniques. Among them, Bellucci and Nicodemo have proposed the “discrete model” (DM), and the
“continuous model” (CM) [9]. In the DM model, the coating is taken as a homogeneous layer that can
be described in terms of a single RC time constant. Conversely, the CM method regards the coating to
be constituted by individual layers of thickness δd; thus, the equivalent circuit consists of an infinite
number of capacitors placed in series. Applying the Brasher–Kingsbury’s equation to these models, the
absorbed water ratio can be calculated using the following equations:
0
0
CC
CCt
S
(3)
t
t
S C
C
CC
CC
0
0
(4)
where ΦS represents Φ at saturation, and C∞ is the capacitance value for the saturated coating.
The main achievement of these models is that diffusion coefficients for water transport in the
coating can be determined, whereas their weakness is the impossibility to produce absolute values for
water penetration. For the former, we must consider equation (2) to hold for the system, thus:
eC
Ct 0
(5)
where α is a constant given by α = 2.3 log εw. For t → 0, it results that Φ → 0, leading to:
nt BtC
C 11
0
(6)
This equation allows the capacitance value at the beginning of exposure to be determined.
When n = ½, a Fickian diffusion system holds, and the diffusion coefficient D can be readily
determined using equation (6). Reordering this equation for the case of small values of water
penetration, leads to:
M
M
CC
CC t
S
t
0
0 (7)

Int. J. Electrochem. Sci., Vol. 7, 2012
8447
where L is the thickness of the organic coating expressed in cm, t is the immersion time given
in s, and D is the Fickian diffusion coefficient in cm2 s
-1. The term at the left of the equation is named
the dimensionless capacitance of the film (DFC). Since there is a relationship between the terms Mt
and M∞ given by:
21
21
214D
L
t
M
M t
(8)
the diffusion coefficient can be determined from the combination of equations (7) and (8):
0
021
21
214
CC
CCD
L
t t
(9)
In the case that the water uptake ratio is not small, the approximation employed in equation (6)
is not valid, and equation (9) should then be transformed into:
0
021
21
21
loglog
loglog4
CC
CCD
L
t t
(10)
By taking the paint coating to be composed by layers of thickness Δx, and each layer to
contribute individually to the total capacitance of the system (i.e., as considered in the model CM), the
following relationship between C0 and Ct applies:
L
t
dxeLCC 0
0
11 (11)
Though this equation is not easily solved because of the complex character of function Φ(x)
[19,20], the diffusion coefficient can still be determined taking into account the proposals of Bellucci
and Nicodemo [9], from:
00
021
21
214
C
C
CC
CCD
L
t t
(12)
where the term L
t21
214
is named ½
, and the term at the left in the equation is now the DFC.
In this paper, three different paint systems applied on galvanized steel have been investigated in
order to evaluate the water uptake characteristics of these polymer layers. This parameter was
determined from the time evolution of the coating capacitance upon exposure of the coated metal
samples in 3 wt.% NaCl aqueous solution. Electrochemical impedance spectroscopy in the frequency
range 0.5-50 kHz was employed to determine the coating capacitance, and its variation with time. The

Int. J. Electrochem. Sci., Vol. 7, 2012
8448
measured capacitance data were analyzed using Brasher-Kingsbury, discrete (DM), and compact (CM)
models for water absorption, and the results supplied by these models were subsequently compared for
discussion.
2. EXPERIMENTAL
Galvanized steel plates were employed as metallic substrates. Metal surfaces were carefully
washed in acetone, ethanol and doubly distilled water, and then dried prior to the coating process.
Three commercial paint systems from Sigma Coatings B.V. (Amsterdam, The Netherlands) were
considered, and they are given in Table 1.The samples were spray painted, and then allowed to cure at
room temperature and humidity for five days prior to testing. The thickness of the dry coatings was
measured with a Mega-Check FN Coating-Thickness-meter (List-Magnetik GmbH, Germany).
Table 1. Characteristics of the coatings and convention for reference in the text.
Paint system A Paint system B Paint system C
Primer Polyamide – Epoxy
(Sigmacover 280)
Polyamide – Epoxy
(Sigmacover 280)
Polyamide – Epoxy
(Sigmacover 280)
Sealing - Polyamide – Epoxy
(Sigmacover 435)
Polyamide – Epoxy
(Sigmacover 435)
Topcoat - - Polyurethane-aliphatic
(Sigmadur 550)
Total thickness (µm) 60 185 244
The test solution was a 3 wt.% NaCl aqueous solution, open to air, held at room temperature.
The time of exposure was ca. 40 hours, which was long enough for the water saturation stage to be
attained by all the paint systems. A three-electrode cell arrangement was used in the experiments. The
electrochemical cell was a flat-cell provided with a sufficiently large stainless steel counter electrode
that was positioned parallel to the 13 cm2 working electrode surface. A saturated calomel electrode
(SCE) was employed as reference electrode.
Electrochemical impedance spectroscopy data were acquired using a computer-controlled
EG&G Model 5210 lock-in amplifier connected with an EG&G Model 283A potentiostat. The
impedance spectra contained 10 points (logarithmic spaced) in the frequency range of 50 kHz – 0.5
kHz, using a 15 mV amplitude of sinusoidal voltage. The data quality acquisition was established in
four cycles at each frequency, thus providing good signal-to-noise ratios at all frequencies. The
software used to acquire and analyze the data allowed representation of the data in terms of both Bode
(logarithm of the impedance modulus |Z| and phase angle as a function of the logarithm of the
frequency f) and Nyquist (imaginary component of the impedance as a function of the real component)
plots. The impedance spectra were modeled using Yeum’s “ZsimpWin 2.00” software [21].

Int. J. Electrochem. Sci., Vol. 7, 2012
8449
3. RESULTS AND DISCUSSION
The water uptake by the coated samples was investigated by EIS during immersion tests of the
samples in aerated 3 wt.% NaCl solution at ambient temperature.
Figure 1. Time dependence of the coating capacitance, C, and the coating resistance, R, values
determined coated galvanized steel during immersion in 3 wt.% NaCl aqueous solution. The
corresponding paint systems are indicated in the graphs.

Int. J. Electrochem. Sci., Vol. 7, 2012
8450
The frequency of the AC potential perturbation ranged from 50 kHz to 0.5 kHz, thus allowing a
new spectrum to be collected every 6.8 minutes. This acquisition rate was considered to deliver enough
data for a detailed description of the water uptake process to be attained. The obtained impedance
spectra were then modelled using a single time constant (RC) equivalent circuit to deliver the coating
resistance R and capacitance C as a function of time. The time dependence of these impedance
parameters for the three paint systems under consideration is plotted in Figure 1.
These two impedance components exhibit opposite trends with time, namely the coating
resistance continuously decreases whereas the coating resistance increases with the elapse of time,
similarly to previous reports in the literature [22]. The increase of coating capacitance with time occurs
at a faster rate upon immersion in the electrolyte, and progressively slows down until a saturation stage
was attained at sufficiently long times. The saturation stage was reached after 1300 min (ca. 22 hours)
for the paint system A, which was the thinnest and only consisted of the primer, while it took more
than 2200 minutes (ca. 37 hours) in the case of both multilayer paint systems B and C. Additionally,
differences were also found in the values of the maximum capacitances attained by the various paint
systems. Paint system A exhibited the highest value of 1590 pF at saturation, whereas the capacitance
for paint system B amounted only to 425 pF. This smaller capacitance value could be expected because
the polymeric film applied on the galvanized steel is about three times thicker than that attained for
paint system A. Thicker films should allow greater amount of water to be absorbed, thus leading to
smaller capacitance values. The same trend occurred when paint system C was considered next, though
the capacitance decrease was smaller this time (cf. Table 2).
Table 2. Parameters obtained during the modeling of water uptake by the coated metal systems using
Brasher-Kingsbury, DM and CM models.
System C (pF) R (MΩ) Φ D·1010
(cm2 s
-1)
DM model CM model
A 1590 0.461 8.19 1.05 1.10
B 425 3.37 9.76 5.54 5.56
C 202 7.91 7.24 9.18 9.83
On the other hand, an exponential decay of the coating resistance upon immersion in the test
electrolyte occurred for all the systems. The coating resistance values at their saturation stage are also
given in Table 2. Each layer contributes to the barrier properties for corrosion protection of the metal,
the main contribution arising from the sealing layer (i.e., paint system B).
After the coating capacitance value for saturation was obtained for each coating system, the
corresponding water uptake could also be calculated from these capacitance data using a suitable
model to describe the physicochemical process. In this way, water uptake values could be determined
as a function of immersion time using equation (2) according to the Brasher-Kingsbury model [2],
whereas equations (3) and (4) had to be considered in the case of the discrete (DM) and the continuous

Int. J. Electrochem. Sci., Vol. 7, 2012
8451
(CM) models [9]. Figure 2 depicts the time dependence of water absorption for each of the paint
systems as indicated in the graph. The water uptake values at saturation are also given in Table 2.
Figure 2. Time dependence of water uptake (Brasher-Kingsbury model) and water uptake percentage
relative to saturation (CM and DM models) for the paint systems indicated in the graphs.
They are smaller than 10% in the three systems, being the lowest for paint system C (namely
7.24%), followed by paint system A (8.19%), whereas the highest (9.76%) was found for paint system
Int. J. Electrochem. Sci., Vol. 7, 2012
8452
B. The decrease in water uptake occurring when the third polymeric layer is applied on the coated
metal (paint system C) has been attributed to the formation of a more compact film at the surface due
to the polyurethane-aliphatic resin. This sealing property is effective enough to compensate for the
general trend to higher water uptakes by thicker films, though low capacitance values were also
measured for paint system C (cf. Figure 1).
On the other hand, the coating resistance increases in the sequence paint system A < paint
system B < paint system C as result of two combined factors. First, there is an increase of coating
thickness and compactness that follows this sequence. Secondly, the application of the polyurethane-
based topcoat supplies increased barrier properties to the system against the penetration of water and
other chemical species from the environment, which is evidenced by the big increase in the values of
the coating resistance when passing from paint system B to paint system C.
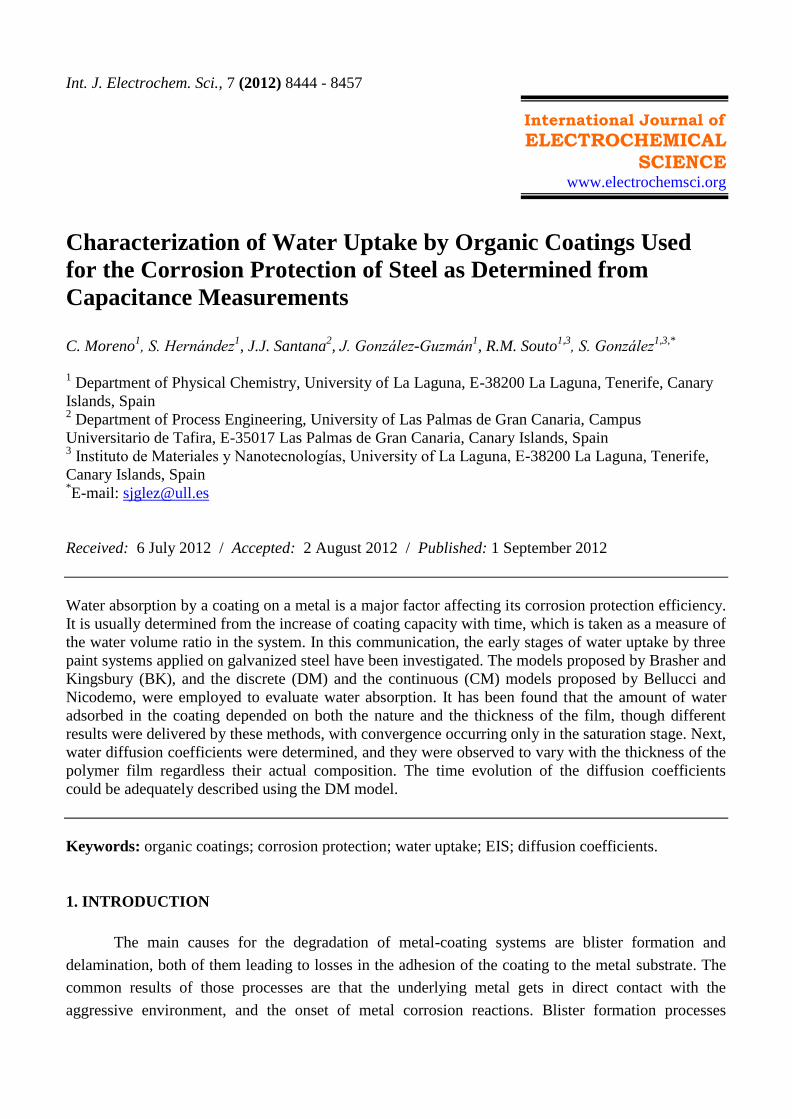
Figure 3. Time dependence of the differences between the relative water transport data determined
with the models DM and CM. The differences are expressed in the form (CMvalue-
DMvalue)/DMvalue. The corresponding paint systems are indicated in the graph.
Further inspection of Figure 2 allows additional observations to be made. Though the curves
produced using the various theoretical models seem to lie in close proximity to each other, a careful
observation shows that differences already exist at this stage. Indeed, they even occur between the data
obtained using DM and CM models. In all the cases, the water uptake with respect to the saturation
value is bigger with the CM model than for DM. Since these methods do not provide an absolute value
for water uptake but rather a percentage of the saturation value [9], we have determined the variation
percentage of model CM with respect to model DM for each paint system, which are plotted in Figure
3. The differences were represented as a function of immersion time using the ratio:

Int. J. Electrochem. Sci., Vol. 7, 2012
8453
value
valuevalue
DM
DMCM (13)
Convergence between the two models occurs at a shorter time for paint system A (ca. 1200
min), whereas convergence for paint systems B and C only occurs at the end of the experiment. This
means that convergence is only attained for the water saturated films.
Linear relationships were found when the differences given by equation (13) were plotted
against the water uptake values determined with the Brasher-Kingsbury model (see Figure 4). More
interestingly, the slopes of these plots are almost the same for the three paint systems, namely -5.035
for system A, -5.125 for system B, and -5.006 for system C. We conclude that the variation of these
parameters, which are related to water uptake by the coatings, is very similar for the three systems, and
the differences found in the calculations with models DM and CM must arise from both the number of
polymer layers involved and their composition.
Figure 4. Time dependence of the differences between the relative water transport data determined
with the models DM and CM expressed in terms of the amount of water adsorbed by the films
according to the Brasher-Kingsbury model. The differences are expressed in the form (CMvalue-
DMvalue)/DMvalue. The corresponding paint systems are indicated in the graph.
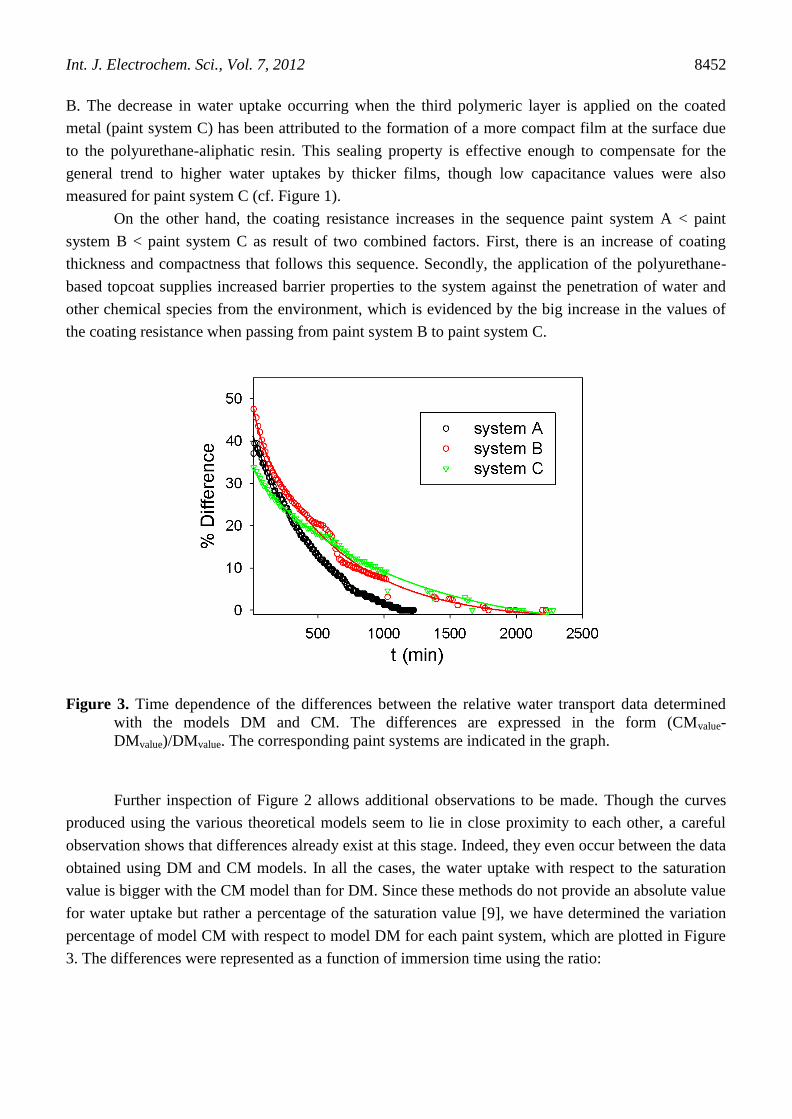
The use of DM and CM models allowed for the diffusion coefficients of water in the three paint
systems to be estimated as well. The time evolution of the DFC has been plotted for all the paint
systems in Figure 5. The DFC values show a quick evolution at the beginning of the experiments in the
three systems. This fact can be interpreted by considering that the flux of water, n, through a paint film
that is due to a concentration gradient in one dimension, x, can be given by [19]:
Int. J. Electrochem. Sci., Vol. 7, 2012
8454
x
CDn
(14)
where D is the diffusion coefficient. For a non-compressible system such as those under
consideration, the time evolution of the water flux will be then provided by:
x
CD
xt
C (15)
where t is the immersion time. Since the coatings were water-free prior to immersion in the test
environment, the concentration gradient would be maximum at the most external layer in direct contact
with the solution, and the fastest changes had to be observed at the beginning of the experiments. Yet,
the different physicochemical description of the metal/polymer system given by the models DM and
CM is responsible for the major differences observed in these plots in the short exposure range,
especially for immersion times shorter than 500 min.
Int. J. Electrochem. Sci., Vol. 7, 2012
8455
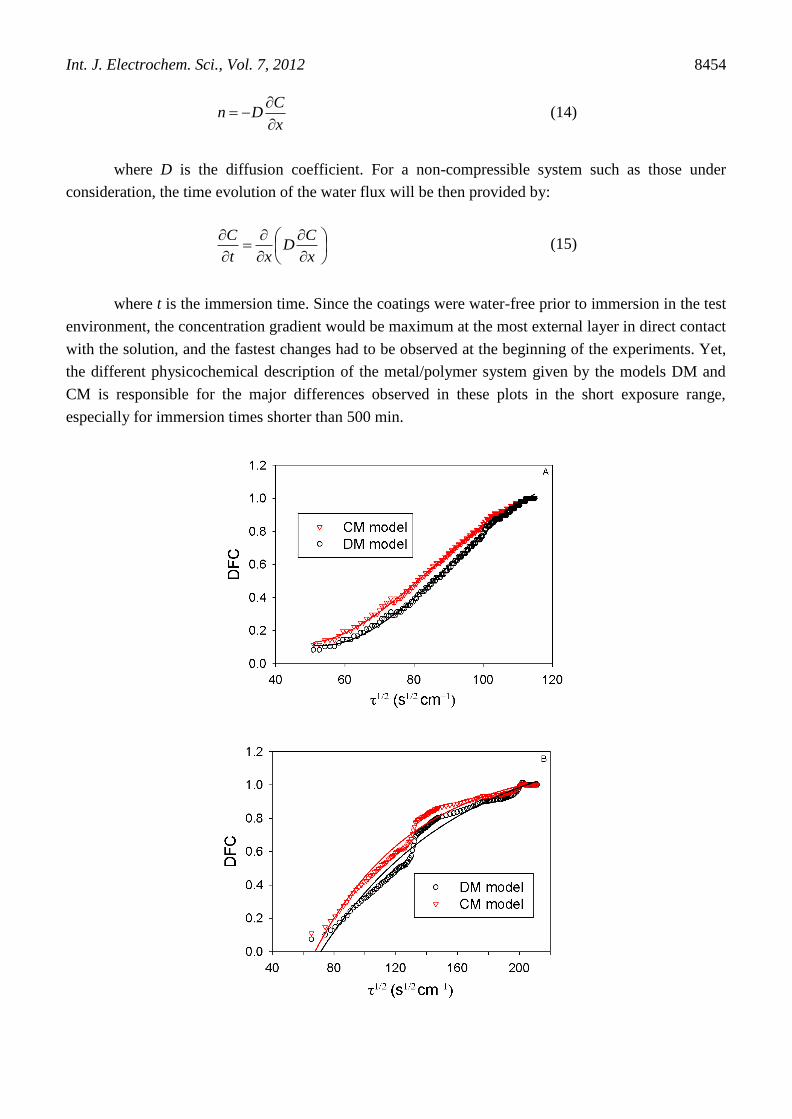
Figure 5. Time dependence of the diffusion coefficients for water estimated using the models DM and
CM. The corresponding paint systems are indicated in the graphs.
If the coating is taken as a compact layer [9], the diffusion coefficient values should grow very
quickly in a short period of time following exposure in order to account for the changes in the
dielectric properties of the films due to water absorption, and then abruptly adopt a constant value that
corresponds to the diffusion coefficient at saturation. On the contrary, the diffusion coefficient values
delivered by the DM model grow steadily over the complete time interval until the saturation stage is
reached. Though the concentration gradient is maximum at the beginning, thus leading to the highest
slopes in the diffusion coefficient versus time plots, the rate of change decreases progressively until the
saturation value is attained. Therefore, we consider the DM model to provide the best description of
the water absorption process for our systems.
Finally, the coefficient values at saturation for the three paint systems allow us to conclude that
they increase with the thickness of the coating applied on the metal (cf. Table 2). That is, the diffusion
coefficient value is highest for the paint system C, though there is smaller absorption of water in this
system compared to paint system B. Thus, the nature of the polymer film influences the total amount
of water absorbed in the system, but not as much the value of its diffusion coefficient. Indeed, the
values obtained for the diffusion coefficients in this work are in the same order of magnitude of those
reported in the literature for a wide variety of polymer resins [14,15].
4. CONCLUSIONS
Dielectric properties of a coating are affected by both the nature and the thickness of the film.
The coating capacitance increases with the elapse of time until a constant value is attained when the
coating is saturated with water. The saturation stage is attained at a shorter exposure in the case of the

Int. J. Electrochem. Sci., Vol. 7, 2012
8456
monolayer system (paint system C), whereas it took almost the same time for the two multilayer
systems. Coating capacitance values are smaller for thicker polymer films.
The time evolution of the coating resistance exhibits an exponential decay trend in all the paint
systems considered. Stationary values for the coating resistance are found when the saturation stage is
reached. Greater coating resistances are exhibited by thicker coatings.
The amount of water absorbed in the coating depends on both the nature and the thickness of
the film. Water uptake increases with the thickness of the coating, as deduced from the comparison of
paint systems A and B which have a similar composition. On the other hand, smaller water uptakes are
measured with paint system C containing a polyurethane-based topcoat, which provides an enhanced
physical barrier to water transport.
The discrete (DM) and the continuous (CM) models give different results for the uptake of
water by polymer films, and convergence of both methods is only observed at the saturation stage. For
the sake of comparison, the differences between the models are satisfactorily expressed in the form
(CMvalue-DMvalue)/DMvalue as a function of the immersion time. Linear relationships are obtained when
this function is plotted against the water uptake values determined using the Brasher-Kingsbury model.
Therefore, the differences between the relative water absorption data obtained using DM and CM
models vary with both the nature and the thickness of the coating.
The values of the diffusion coefficient for water are affected by the thickness of the polymer
film with independence of its composition. The time evolution of the diffusion coefficient can be
described using the discrete model DM.
ACKNOWLEDGMENTS
This work was supported by the Ministerio de Ciencia y Tecnología (Madrid, Spain) and the European
Regional Development Fund (Brussels, Belgium) under Project No. CTQ2009-14322. A grant
awarded to JJS by the Gobierno de Canarias (Spain) to conduct a research stay at the University of La
Laguna is gratefully acknowledged. Thanks are due to Sigma Coatings (Amsterdam, The Netherlands)
for providing the coatings.
References
1. F. Wormwell and D.M. Brasher, J. Iron Steel Inst. 164 (1950) 141.
2. D.M. Brasher and A.H. Kingsbury, J. Appl. Chem. 4 (1954) 62.
3. J.K. Gentles, J. Oil Colour Chem. Assoc. 46 (1963) 850.
4. L. Hartshorn, N.J.L. Megson and E. Rushton, J. Soc. Chem. Ind. 56 (1937) 266.
5. F.S.A. Lindqvist, Corrosion 41 (1985) 69.
6. E.P.M. van Westing, G.M. Ferrari and J.H.W. de Wit, Corros. Sci. 36 (1994) 957.
7. F. Deflorian, L. Fedrizzi and P.L. Bonora, Corros. Sci. 38 (1996) 1697.
8. F. Deflorian, L. Fedrizzi, S. Rossi and P.L. Bonora, Electrochim. Acta 44 (1999) 4243.
9. F. Bellucci and L. Nicodemo, Corrosion 49 (1993) 235.
10. M.M. Wind and H.J.W. Lenderink, Prog. Org. Coat. 28 (1996) 239.
11. C. Pérez, A. Collazo, M. Izquierdo, P. Merino and X.R. Nóvoa, Prog. Org. Coat. 36 (1999) 102.
12. G.W. Walter, Corros. Sci. 32 (1991) 1041.
13. G.W. Walter, Corros. Sci. 32 (1991) 1059.
14. V.B. Miskovic-Stankovic, D.M. Drazic and Z. Kacarevic-Popovic, Corros. Sci. 38 (1996) 1513.
Int. J. Electrochem. Sci., Vol. 7, 2012
8457
15. A.S. Castela and A.M. Simões, Corros. Sci. 45 (2003) 1631.
16. A. Catenaccio, Y. Daruich and C. Magallanes, Chem. Phys. Lett. 367 (2003) 669.
17. O.A. Stafforda, B.R. Hinderliter and S.G. Crolla, Electrochim. Acta 52 (2006) 1339.
18. L. Rodríguez-Pardo, A. Cao-Paz, J. Fariña, A. Covelo, X.R. Nóvoa and C. Pérez, Sensors and
Actuators B 144 (2010) 443.
19. A.J.J. van der Zanden and E.L.J. Goosens, Chem. Eng. Sci. 58 (2003) 1521.
20. J. Crank, The mathematics of diffusion, University Press, Oxford (1954).
21. B. Yeum, Electrochemical Impedance Spectroscopy: Data Analysis Software, Echem Software,
Ann Arbor (2001).
22. R.G. Duarte, A.S. Castela and M.G.S. Ferreira, Prog. Org. Coat. 57 (2006) 408.
© 2012 by ESG (www.electrochemsci.org)