characterization of the effects of internal pores on
TRANSCRIPT

Characterization of the Effects of Internal Pores on Tensile Propertiesof Additively Manufactured Austenitic Stainless Steel 316L
A.E. Wilson-Heid1& T.C. Novak1 & A.M. Beese1,2
Received: 14 September 2018 /Accepted: 27 November 2018# Society for Experimental Mechanics 2019
AbstractIn this study, the effects of internal pores on the tensile behavior of austenitic stainless steel 316Lmanufactured with laser powderbed fusion (L-PBF) additive manufacturing (AM) were investigated. Both fully-dense samples and samples with intentionalinternal pores of varying diameters were fabricated. For each sample with a pore, the internal pore was deliberately fabricated inthe center of the cylindrical tensile sample during AM processing. By varying the diameter of the 180 μm-tall initial penny-shaped pores, from 150 to 4800 μm within 6 mm gauge diameter cylindrical samples, the impact of lack-of-fusion, commonlypresent in AM, as well as the impact of well-defined pores in general, on tensile mechanical properties was studied. To link thepore size and morphology to the mechanical properties, the sizes of the initial pores were evaluated using non-destructiveArchimedes measurements, 2D X-ray radiography, 3D X-ray computed tomography, and destructive 2D optical microscopy.Samples with and without the single, penny-shaped pore were subjected to uniaxial tension to evaluate the defect size dependentmechanical properties. The intentional pore began to impact ultimate tensile strength when the pore diameter was 2400 μm, or16% of the cross-sectional sample area. Elongation to failure was significantly affected when the pore diameter was 1800 μm or9% of the cross-sectional sample area. This shows that 316L stainless steel manufactured by additive manufacturing is defect-tolerant under uniaxial tension loading.
Keywords Additivemanufacturing . 316L stainless steel . Porosity . X-ray computed tomography . Tensile properties . Ductility
Introduction
Additive manufacturing (AM) is a layer-by-layer manufacturingprocess used to create three-dimensional (3D) components [1].In laser powder bed fusion (L-PBF) AM, a laser power source isused to rapidly melt and fuse metal powder feedstock one layerat a time to form a 3D component. Once a layer has been com-pleted, the build plate is lowered, a new layer of powder isspread over the previous layer(s), and the lasing/powder additionprocess is repeated until the component is finished [2, 3]. InAM,internal defects and heterogeneous microstructures, caused byrapid solidification and thermal cycling, are frequently present[1]. Understanding how themicrostructure and defects affect the
mechanical behavior of components is required in order to de-sign against failure in components made by AM. This includesunderstanding which techniques are best for characterizing de-fects and determining tolerable limits of defects within AMcomponents that still result in structurally sound parts.
Components fabricated by AMmay contain internal poros-ity either from processing defects or raw material defects [4].More specifically these pores are usually caused by gas en-trapment, keyholing, or lack-of-fusion (LoF) between subse-quent laser passes or layers in the L-PBF process [2, 5–7]. Gasentrapment defects, which are commonly spherical in mor-phology and can range from 10 to 130 μm in diameter [8,9], have been proposed to persist from the pores present inthe original powder feedstock for particles that do notcompletely remelt [10], from the collapse of keyhole vaporcavities caused by excessive energy input [7], or with an anal-ogous mechanism as casting pores where there is evolution ofdissolved gases from the liquid during solidification [11]. Thepresence of small gas pores caused by excessive energy inputhave been found to not impact the strength and ductility ofmaterial when present in amounts up to 1 vol.% for Ti-6Al-4 V built via L-PBF [12].
Allison Beese is a member of the Society for Experimental Mechanics.
* A. M. [email protected]
1 Department of Materials Science and Engineering, PennsylvaniaState University, University Park, PA 16802, USA
2 Department of Mechanical Engineering, Pennsylvania StateUniversity, University Park, PA 16802, USA
Experimental Mechanicshttps://doi.org/10.1007/s11340-018-00465-0
However, LoF pores, which can range from 15 to 600 μm[9, 13, 14] and are irregular in morphology, have been shownto be detrimental to mechanical properties of materials be-cause their sharp features act as stress concentration sites[12, 14, 15]. Carlton et al. evaluated the role of LoF poreson tensile behavior of L-PBF stainless steel 316L using in situX-ray computed tomography (CT) testing and found that sam-ples with high porosity (>2.2%) displayed flaw-driven failurewhere cracks initiated at pre-existing defects [14]. Stef et al.found that the formation of these pores are closely related tothe laser scan pattern, where LoF porosity is more common inareas where the overlapping of the laser scan pattern existsbetween sequential layers [16]. Spierings et al. showed thatincreased scanning speed from 300 to 850 mm/s at a constantpower of 104 W resulted in an increase of LoF porosity for-mation and overall porosity of 0.03% to 9.02% for stainlesssteel 316L samples built with L-PBF [17], highlighting theimportance of using optimized process parameters. Althoughit is known that LoF pores negatively impact the mechanicalbehavior of AM components, quantifying the impact of inter-nal pores on tensile ductility is important for defining defecttolerances in AM.
The role of internal pores on the mechanical properties ofductile metals is of interest to not only the AM community, butto the entire fracture community. There has beenmuch classicalresearch on the role of pores in ductile plasticity [18, 19] andfracture, including theoretical work on the growth of sphericalvoids [20] and cylindrical voids [21]. In AM the layer-by-layerprocessing can be used to intentionally manufacture internalpores into samples, which is not possible with conventionalmanufacturing techniques, in order to directly assess the impactof void size on ductile fracture. Fadida et al. [22] embedded asingle spherical pore at the center of 4 mm diameter Ti-6Al-4Vdynamic tensile samples manufactured via L-PBF and foundthat samples with a 600 μm or greater diameter pore had sig-nificantly lower tensile ductility compared to dense samples.They also showed that at this critical pore diameter (withrespect to sample gauge diameter), the failure in samplesalways occurred at the pore location. Conversely, the fail-ure location did not necessarily correspond to the porelocation for pores smaller than 600 μm in diameter. Liet al. studied the effect of random porosity (i.e., not asingle well-defined pore) in tensile specimens by chang-ing the laser scanning speed and maintaining constantlaser power of 100 W in the manufacturing of 316L byL-PBF samples [5]. A scanning speed of 90 mm/s corre-lated to a density of greater than 95% and an ultimatetensile strength (UTS) of 650 MPa, while the sample witha scanning speed of 180 mm/s had a density of 65% andUTS below 50 MPa. With AM, the effect of pores can beisolated to determine their impact on mechanical proper-ties giving insight to void growth in both AM and con-ventional materials.
The presence of internal defects can be assessed and quan-tified using different methods. The classic Archimedes methodhas been used to quantify bulk porosity in AM components[23, 24]. This method is non-destructive, but the results canvary based on part surface finish and surface-breaking porosity[17]. The Archimedes method provides bulk porosity informa-tion, but does not provide information about pore size distribu-tion, pore locations, or pore morphology, all which have beenfound to be important factors when assessing mechanical prop-erties [14]. X-ray radiography (2D) and X-ray CT (3D) are alsonon-destructive methods for investigating internal porosity. In2D radiography, a shadowgraph of a stationary 3D sample isproduced by directing radiation energy through a sample andmeasuring attenuation with a detector on the opposite side. Thismethod can be used to assess variations in 2D grayscale pro-jections of the sample that can be generated quickly to providefor assessment of pore cross-sections.
In X-ray CT, the sample is rotated in angular incrementsranging from 0° to 360° and is exposed to the source generatedX-rays. The attenuated X-rays are captured by a detector and amathematical algorithm is used to convert the 2D data into a3D reconstruction of the entire sample or region of interest[25]. In X-ray CT the size of quantifiable pores in a sampleis directly related to the voxel size that is used in the analysis,where pores smaller than the voxel size cannot be measured[25], and typically, the convention is to assume that any poresthat can be reliably detected are three times the voxel size orlarger. Voxel size is dictated by the desired magnification orfield of view [26]. This is an important consideration whendetermining the desired scan resolution and a compromisemust be made between desired porosity resolution, volumeof area analyzed, time, and economics [26]. The biggest ben-efit of using X-ray CT is that it can be used to non-destructively characterize the 3D morphology of pores, thespatial distribution (and location) of pores, and the distributionof pore sizes in a metallic sample.
For destructive evaluation of pores, serial sectioning withoptical microscopy may be used. With this method only one2D cross-section of a component can be analyzed at a time,providing limited information on pore size, morphology, anddistribution. This method is prone to selection bias and theappropriate magnification must be selected to achieve consis-tent pore resolution [17].
The aim of the present study was to isolate the role ofinternal pores on the tensile properties of austenitic stainlesssteel samples made using L-PBF and provide a direct under-standing of the impact of initial void size on the tensile prop-erties of conventional materials. A secondary aim was to com-pare different methods used to quantify porosity inmanufactured components. Leveraging the unique capabilitiesof AM, samples were manufactured with a penny-shaped in-ternal pore, at the center of cylindrical tensile specimens, tomimic the presence of a LoF pore or large pores formed during
Exp Mech

void growth. Four different methods were used to measure theembedded pore size and morphology. By changing the size ofthe pores within samples, the role of defect size on tensilemechanical properties was investigated.
Experimental
Fabrication
In this study, a ProX DMP 320 laser powder bed fusion ma-chine by 3D Systems [27] was used to manufacture AISI Type316L Stainless Steel (316L) round cylindrical samples. Theprocessing parameters used to fabricate the 316L L-PBF cylin-ders are shown in Table 1. The powder was sieved using a60 μm screen. The composition of the fabricated 316L materi-al, shown in Table 2, was measured using combustion infrareddetection for carbon and sulfur content (ASTM E1019–18,[28]), inert gas fusion for nitrogen content (ASTM E1019–18, [28]), and direct current plasma emission spectroscopy forall other elements (ASTM E 1097–12, [29]). Cylindrical sam-ples with an external diameter of 10 mm were built in thevertical orientation, such that when machined to tensile speci-men geometry the loading axis was parallel to the vertical builddirection. Each cylinder, except for the fully dense samples, hada single, centrally located pore, designed to be 180 μm tall, toclosely mimic the sharp features in LoF pores. Specimens witheleven different pore diameters, whose dimensions are inTable 3, and fully dense specimens were fabricated. The cylin-ders were removed from the baseplate using wire electricaldischarge machining in the as-built condition, as stress-reliefhas been shown to have no significant effect on mechanicalproperties of L-PBF 316L [30]. Samples were then machinedto the cylindrical tensile geometry in Fig. 1 using a CNC latheto remove the effect of surface finish, which has been shown toimpact the mechanical behavior of AM components [32].
In addition to the cylindrical tensile test samples, a cylin-drical witness sample that contained all eleven penny-shapedpore geometries was fabricated as shown in Fig. 2. This sam-ple was used to characterize pore size and morphology usingX-ray CT and cross-section analysis after machining to a6 mm diameter, which is equivalent to the tensile samplegauge diameter. The characterized geometries in the witnesssamples were assumed to be representative of those in thecorresponding tensile test samples.
Archimedes Method
The Archimedes method was used to determine sample den-sity and porosity of all machined tensile samples. TheArchimedes process involved weighing the samples in thedry state to obtain their dry mass, mdry, on an analytical bal-ance (Ohaus Adventurer, Model AX324) that had a precisionof 0.1 mg. Samples were then submerged in reverse osmosis(RO) water (ρtheor assumed to be 1.0 g/cm3) and put undervacuum for 24 h, during which the air bubbles on the surfaceof the samples were removed after 12 h to allow the water tocontinue to permeate the surface. After removal from the vac-uum, samples were weighed while submerged in RO water toobtain msub, and then weighed in air after patting the samplesdry to remove water on the surface, obtaining msoak. All massmeasurements were done at room temperature, each samplewas measured five times in each state, and the scale was giventime to reset to zero between measurements. Experimentaldensity was calculated using the following equation:
ρ ¼ mdry � ρtheormsoak−msub
ð1Þ
A theoretical density for 316L of 7.99 g/cm3 was assumedfor all calculations of experimentally determined porosity[33].
2D Radiograph Method
The cylindrical witness sample (Fig. 2), which contained allpore geometries studied, was analyzed with a General Electricv|tome|x L300 nano/microCT system. Two 2D radiograph im-ages were taken for each pore in two perpendicular directionswith the parameters in Table 4. The X-ray source was adjustedto be normal to each of the eleven pores when the grayscaleimage was taken to avoid skew in the data and in the mea-surement of the pore in post-process analysis, as shown in
Table 1 Processing parameters used for L-PBF manufacturing of 316Lsamples in the present study
Laser Power(W)
Layer thickness(μm)
Hatch spacing(μm)
Scanning speed(mm/s)
300 60 100 900
Table 2 Chemical composition (wt.%) of the as-built stainless steel316L in the present study
Element
Carbon, C 0.02
Manganese, Mn 0.79
Phosphorous, P 0.008
Sulfur, S 0.006
Silicon, Si 0.60
Chromium, Cr 17.80
Nickel, Ni 12.48
Molybdenum, Mo 2.41
Nitrogen, N 0.068
Iron, Fe Bal.
Exp Mech

Fig. 3. ImageJ analysis software was used to measure thediameter and height of each pore in each 2D radiograph [34].
X-Ray CT Method
The same system and scan parameters that were used for 2Dradiographs were used for the 3D X-ray computed tomogra-phy scan. A total of 1000 images, through rotations between0o and 360o, were taken during the scan with an exposure timeof 500 ms for each image and an averaging of three images perrotation. A voxel size of 13.45 μm was used, resulting in aminimum resolvable pore size of 40.35 μm [35]. The voxelsize was calibrated prior to each scan using a calibration
specimen with a known distance between the center of tworuby spheres; a correction was applied to the system after thiscalibration. These 2D images were reconstructed into a 3Ddataset using the cone-beam algorithm developed byFeldkamp et al. [36]. The 32-bit reconstructed projectionswere imported to Avizo 9.3.0 software (Thermo FisherScientific) for 3D processing and analysis. The diameter foreach intentionally introduced pore was measured from the
Table 3 Diameters of 180 μm tallpenny-shaped pores designed intothe cylindrical tensile samples
Sample Name Pore diameter(μm)
% of cross-sectionalarea of tensile sample
Pore diameter as measuredby X-ray CT (μm)
B 150 0.06% –
C 300 0.25% 282 ± 40
D 450 0.56% 455 ± 45
E 600 1% 538 ± 41
F 1200 4% 1135 ± 54
G 1800 9% 1781 ± 48
H 2400 16% 2373 ± 54
I 3000 25% 2961 ± 53
J 3600 36% 3595 ± 52
K 4200 49% 4132 ± 76
L 4800 64% 4789 ± 52
Fig. 2 Witness sample with pores vertically positioned every 2 mm,starting with the 150 μm closest to the baseplate and the 4800 μmfarthest from the baseplate. The pore diameter/volume fractions in thewitness sample were characterized with each porosity analysistechnique. Dimensions in mm
Fig. 1 Cross-section geometry of (a) as-built cylinders and (b) uniaxialtension samples in compliance with ASTM E8 [31], where dashedhorizontal line indicates the intentionally introduced pore (here,showing a 3 mm diameter pore) at the center of the specimen.Dimensions in mm. (c) 3D CAD rendering of a tensile sample with aninternal penny-shaped pore
Exp Mech

scan. As X-ray CT provides full information on pore morphol-ogy and size, the diameter of each pore measured with thistechnique was assumed to be the pore diameter in the corre-sponding tensile specimen, for the respective pore geometry,and the other pore measurement methods were comparedagainst this measurement technique.
2D Cross-Section Method
After non-destructive evaluations of pore geometries, the wit-ness sample was sectioned in half, parallel to the vertical builddirection, to expose the pores for optical microscopy (OM)analysis. Half of the sample was mounted in epoxy, groundand polished using SiC abrasive papers, with a final polishingstep using 0.05 μm colloidal silica. Images of the pores in the
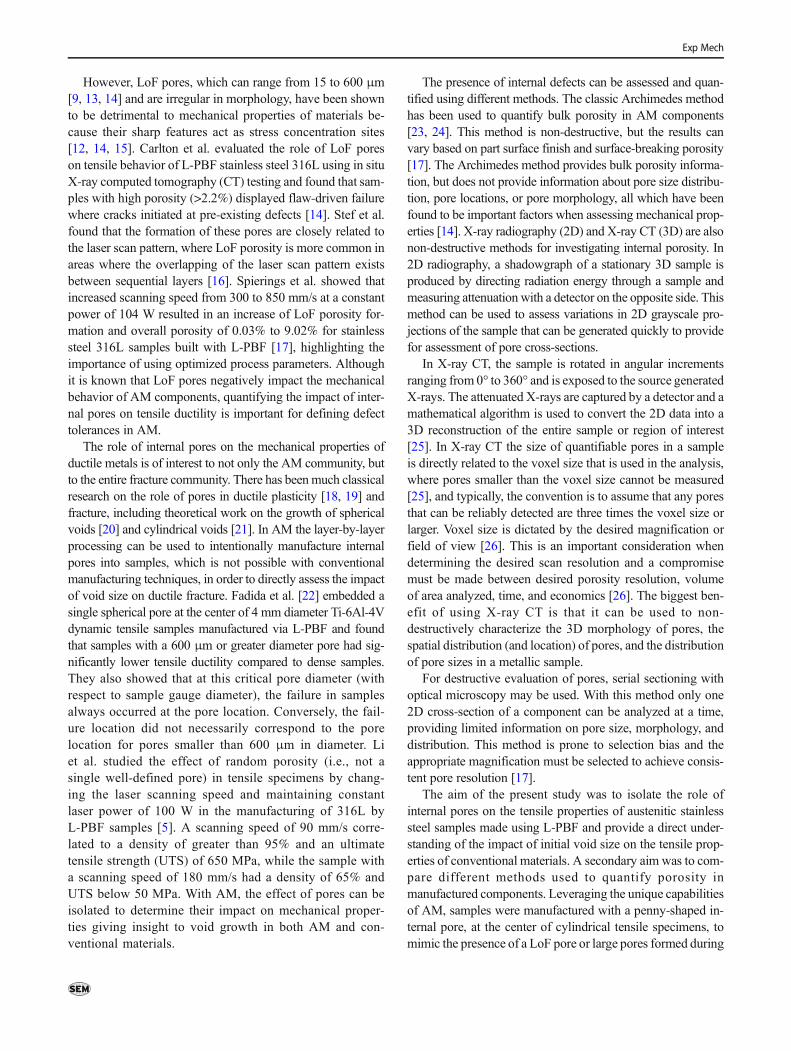
sample were taken using a digital optical microscope(Keyence VHX- 2000). ImageJ software was used to analyzethe cross-section images by first converting the images to a16-bit greyscale image, as shown in Fig. 4, and then a thresh-old value was used to distinguish between pores and solidmaterial. The pore diameter and height were then measuredusing the modified image.
Evaluation of Uncertainty
In the measurement of the internal pore diameters with thedifferent techniques, the uncertainty in the measurementswas quantified to account for the different origins of uncer-tainty in each of the techniques evaluated. For the measure-ment of the diameters of the pores using X-ray CT, the pores inthe witness sample were reconstructed with Avizo software[37]. The volumetric center of each pore was calculated andits z-slice number (height in the vertical build direction) wasdetermined. The diameter of the pore was measured with abest-fit a circle on the 2D cross-section where the volumetriccenter was calculated to be. The best-fit diameter was adjustedand measured at eight equally spaced distances around thepore using the best-fit circle. For each of the eight measure-ments an individual percent systematic error, δi,sys, was calcu-lated using:
δi;sys ¼ 3� voxel sizedmean
ð2Þ
where dmean is the mean diameter of the pore of interest asmeasured by the best-fit circle and the general rule for detect-able features in a CT scan of three times the voxel size wasused in the numerator [35]. The overall systematic error, δo,sys,for a given pore was defined as:
δo;sys ¼ dmean � ∑δi;sysn
ð3Þ
where n is the number of measurements. Random uncertainty,δran, was defined as the standard deviation of the mean, usingthe standard deviation with Bessel’s correction. Total uncer-tainty, δtot, which was used in the calculation of uncertainty inthe percent difference as described later, was defined as:
δtot ¼ffiffiffiffiffiffiffiffiffiffiffiffiffiffiffiffiffiffiffiffiffiffiffiffiffiffiffiffiffiffiffiffiffiffiδranð Þ2 þ δo;sys
� �2qð4Þ
Fig. 3 2D radiograph image centered at the 1800 μm diameter pore, asindicated by the arrow. Each pore was centered with respect to the X-raysource for dimensional analysis to eliminate skewing, as seen in the largerpores in this image
Table 4 Parameters used in X-ray 2D radiographs and 3D computed tomography scans
Voxel size (μm) Voltage (kV) Current (mA) Power (W) Cu detector filterthickness (mm)
X-ray source todetector distance(mm)
Exposuretime (ms)
Number ofprojections
13.45 150 90 13.5 0.5 500 500 1000
Exp Mech
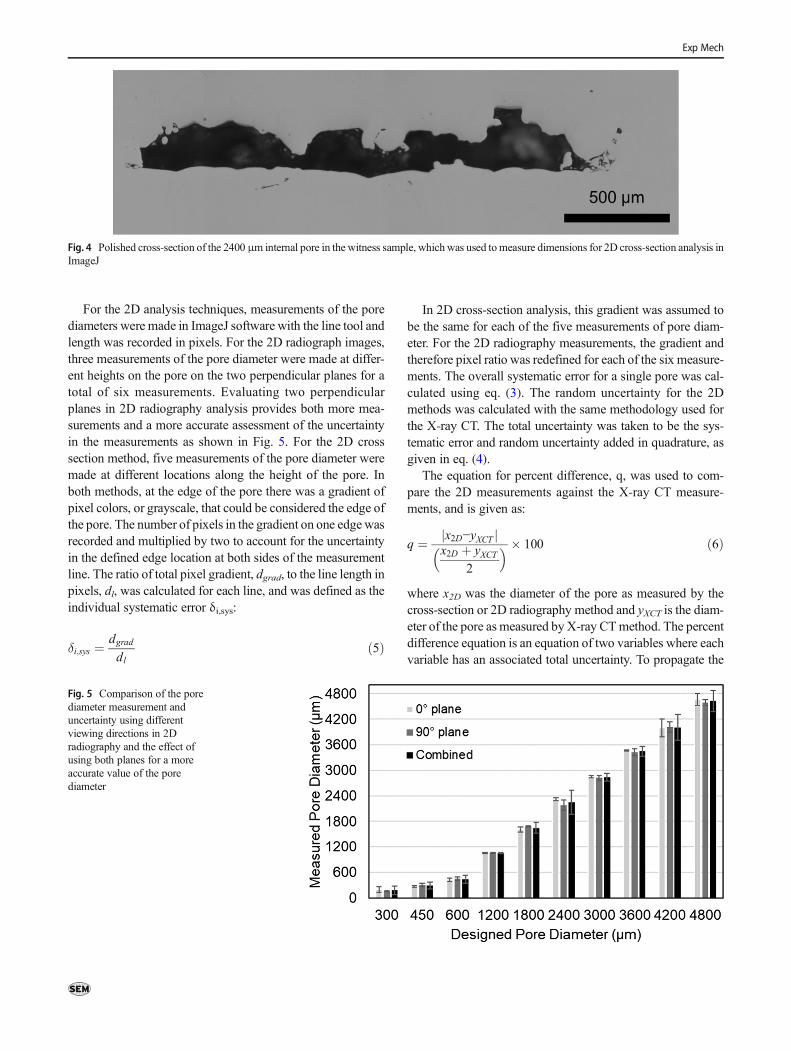
For the 2D analysis techniques, measurements of the porediameters were made in ImageJ software with the line tool andlength was recorded in pixels. For the 2D radiograph images,three measurements of the pore diameter were made at differ-ent heights on the pore on the two perpendicular planes for atotal of six measurements. Evaluating two perpendicularplanes in 2D radiography analysis provides both more mea-surements and a more accurate assessment of the uncertaintyin the measurements as shown in Fig. 5. For the 2D crosssection method, five measurements of the pore diameter weremade at different locations along the height of the pore. Inboth methods, at the edge of the pore there was a gradient ofpixel colors, or grayscale, that could be considered the edge ofthe pore. The number of pixels in the gradient on one edgewasrecorded and multiplied by two to account for the uncertaintyin the defined edge location at both sides of the measurementline. The ratio of total pixel gradient, dgrad, to the line length inpixels, dl, was calculated for each line, and was defined as theindividual systematic error δi,sys:
δi;sys ¼ dgraddl
ð5Þ
In 2D cross-section analysis, this gradient was assumed tobe the same for each of the five measurements of pore diam-eter. For the 2D radiography measurements, the gradient andtherefore pixel ratio was redefined for each of the six measure-ments. The overall systematic error for a single pore was cal-culated using eq. (3). The random uncertainty for the 2Dmethods was calculated with the same methodology used forthe X-ray CT. The total uncertainty was taken to be the sys-tematic error and random uncertainty added in quadrature, asgiven in eq. (4).
The equation for percent difference, q, was used to com-pare the 2D measurements against the X-ray CT measure-ments, and is given as:
q ¼ x2D−yXCTj jx2D þ yXCT
2
� � � 100 ð6Þ
where x2D was the diameter of the pore as measured by thecross-section or 2D radiography method and yXCT is the diam-eter of the pore as measured by X-ray CTmethod. The percentdifference equation is an equation of two variables where eachvariable has an associated total uncertainty. To propagate the
Fig. 5 Comparison of the porediameter measurement anduncertainty using differentviewing directions in 2Dradiography and the effect ofusing both planes for a moreaccurate value of the porediameter
Fig. 4 Polished cross-section of the 2400 μm internal pore in the witness sample, whichwas used tomeasure dimensions for 2D cross-section analysis inImageJ
Exp Mech

uncertainty throughout the equation and into the uncertainty inthe percent difference, δq, the general formula for error prop-agation was used:
δq ¼ffiffiffiffiffiffiffiffiffiffiffiffiffiffiffiffiffiffiffiffiffiffiffiffiffiffiffiffiffiffiffiffiffiffiffiffiffiffiffiffiffiffiffiffi∂q∂x
δx� �2
þ ∂q∂y
δy� �2
sð7Þ
Mechanical Testing
Uniaxial tension tests were performed on six to nine sampleswith each of the pore geometries and dense samples using anelectromechanical load frame (MTS Criterion Model 45) witha 150 kN load cell. Quasi-static tension tests were performedunder displacement control using an applied strain rate on theorder of 10−4 s−1. The surface deformation fields were mea-sured using 3D digital image correlation (DIC), a non-contactsurface strain measurement technique (Vic3D software,Correlated Solutions). The gauge regions of the machinedsamples were painted with flat white basecoat with a randomblack speckle on top. Images of the sample during loadingwere taken at a rate of 1 Hz using two digital cameras (PointGrey GRAS-50S5M-C) and data capture software (VicSnap,Correlated Solutions). A calibration target with a 14 × 9 dotpattern and 3 mm spacing between dots was used to calibraterelative position of the cameras with respect to each other. Asubset size of 29 pixels and a step size of 7 pixels was used forthe surface deformation analysis of the images. To computethe evolution of vertical strain in the gauge region during post-processing, a vertical virtual extensometer of length 24 mmwas used. The engineering stress was calculated as a functionof applied force and the cross-sectional area of each sampleusing the measured outer diameter of the gauge region (i.e.,not considering a reduced cross-sectional area due to the in-troduction of a pore).
Results and Discussion
Bulk Porosity Analysis
Using the Archimedes density technique, the average bulkporosity of the dense samples was found to be 0.60 ± 0.2%.The bulk measure of porosity remained relatively constant upto the maximum designed 4800 μm pore samples, which hadan average bulk porosity of 0.88 ± 0.2%. The 4200 μm poresamples had the largest measured bulk porosity of 0.95 ±0.1%. Archimedes can only provide information on bulk po-rosity and does not provide any information on the size ofpores, distribution of pores, or morphology of pores.Additionally, the Archimedes method does not account forthe true volume of the intentional internal pore space as thesepores also include trapped powder that remains after the
fabrication, which does not aid mechanical properties but addsuncertainty in this measurement technique. However, the lowbulk porosity measured in the dense samples provides confi-dence that any changes in the mechanical properties of thesamples with the intentional pores included in this study canbe attributed to the intentional pore present at the center ofeach sample (i.e., not random porosity throughout, as this wasnot found in any of the measurement methods).
Characterization of Intentional Pores
The X-ray CT measurements gave the most accurate measure-ment of the morphology of the pores when comparing the threelocal analysis techniques used because of the ability to resolve3D features, as shown in Fig. 6. The CTanalysis also allowed forthe measurement of the diameter of the pores in the XY plane,shown in Fig. 7, as opposed to the vertical build direction planesevaluated in the 2D analysis. It should be noted that in all themeasurement techniques the 150 μm designed pore was notresolvable, likely due to melt pool spreading during fabrication,closing the pore, and is excluded from the analysis. Taking theX-ray CT reconstructed data as the measurement of the actualpore diameter, and comparing this to the designed pore geometryin the CAD drawings, the average percent error of all resolvablepore diameters was −4.9%, and − 2.4% when the smallest re-solvable pore (300 μm) is excluded. This indicates that smallerpores were more challenging to make per the design than larger
Fig. 6 3D X-ray CT reconstruction of the eleven pores in the witnesssample within the 6 mm diameter cylinder
Exp Mech

pores, which is likely due to the flow of the meltpool in the buildplane and dross formation in the vertical build direction.However, these measurements indicate that in this study, poreswhose designed diameters were larger than 300 μm can be as-sumed to have been accurately fabricated within the tensile sam-ple, and any size effects on mechanical properties can beinterpreted in terms of the designed pore diameter. This is op-posed to the 2D cross-section and radiograph methods, whichgave average percent errors of −11.6% and − 13.1% compared tothe designed pore diameter, respectively, but have othermeasure-ment artifacts that could impact their results discussed below.Therefore, in all discussion and analysis below, the designedpore diameter is referred to, since X-ray CT found good agree-ment between the designed and actual pore diameters.
Taking the diameter measurements from 3D X-ray CT asthe baseline with which to compare the two 2D analysismethods, it was found that for pores designed with a diameterof 450 to 1200 μm, the OM cross-section analysis more ac-curately resolved the pore diameters than 2D radiography.However, for pores 1800 μm or larger, the 2D radiographymethod provided more accurate measurement of the porescompared to the 2D cross-section method. These trends areshown in Fig. 8, where the cross-section with OM methodtended to overestimate the pore diameter for the smaller pores,while the 2D radiography method always underestimated thepore diameter, especially the 300 and 450 μm pores. Theconsistent underestimate of diameter in the 2D radiographymethod is a result of two main factors: the difficulty in differ-entiating the un-melted trapped powder at the edges of thepores, which have the same density, and therefore grayscalevalues, as the solid material, resulting in challenges in definingthe full geometrical extents of the pore; and the fact that the
2D images are a projection of 3D samples where the pores aresurrounded by dense material resulting in gradient of gray-scale values along the 2D cross-sectional projection that canalso be difficult to threshold, as shown in Fig. 3. For poreslarger than 1800 μm, where the pore edges are close to the6 mm outer diameter of the witness sample, the radiographanalysis was very close to the X-ray CT method. Using
Fig. 7 X-ray CT images of thereconstructed pores in differentplanes for the (a) 4800 μm, (b)1800 μm, and (c) 300 μm pores
Fig. 8 Comparison of the 2D analysis techniques as related to theirsimilarity with the pore diameter measured in the 3D X-ray CT analysisusing percent difference. A positive percentage indicates the 2Dmeasurement was larger than the 3D X-ray CT measurement and anegative percentage indicates the 2D measurement was smaller than 3DX-ray CT measurement. Both methods are shown to more likelyresult in a smaller pore diameter measurement then that by 3D X-ray CT
Exp Mech

percent difference to compare measurements of the pores larg-er than 1800 μm, the 2D radiograph measured average diam-eter was only 4% smaller than the X-ray CT-measured
diameters, and the diameter measured using the OM methodwas 19% smaller than the X-ray CT diameter. Given thatsmaller pores are more prevalent in AM builds, the cross-section with the OM analysis technique provided more rele-vant information in the analysis of the intentionally embeddedpore diameters, although there is no consistent trend of over orunder estimating the pore size. However, capturing the poregeometry with OM can be a challenge and can result inskewed data for two primary reasons: first, if the pore is notsliced and viewed exactly in the center plane, this will result inan underestimate of diameter; second, if the sample is notsectioned and polished exactly parallel to the build axis, thepore will be viewed at an angle, resulting in a possible over-estimate of the pore dimensions at the location viewed.
Tensile Testing
Uniaxial tension testing of the dense samples and those withinternal pores revealed clear trends with respect to mechanicalproperties as a function of pore diameter in the 6 mm diametersample, as shown in Fig. 9. The change in mechanical behaviorwas a function of the pore size within the constant outer diam-eter of the gauge region. The increasing pore size also
Fig. 9 Representative engineering stress-strain curves for samples witheach initial pore diameter. A is representative of the dense samples, whileB-L correspond to samples with increasing pore diameters. See Table 3for nomenclature of B-L pore diameters
Fig. 10 Engineering stress-strain plots for each uniaxial tension test. Note that the x-axis scales are the same in a-g, but adjusted in h-l, while the y-axissclaes are the same in a-l
Exp Mech

corresponds to a decreasing number of grains in the remainingcross-sectional area. The average grain area in the XYplane ofthe 316L material in this study was measured to be 584 μm2 or19.3 μm in diameter. In the fully dense samples, this results inmore than 48,000 grains within the cross-sectional area of the6 mm gauge region of the tensile samples, which reduces toaround 2000 grains in samples with a 4800 μmpore, the largestintentional pore evaluated in the study. Thus, this work studiesthe impact of pore size with respect to the component size (e.g.,thick and thin components), while still evaluating a bulk num-ber of grains within a cross-section.
The presence of the pre-existing pore did not affect thematerial strength or ductility of the samples until the porewas greater than or equal to 600 μm in diameter, as shownin Fig. 10. At a pore diameter of 600 μm, corresponding to10% of the cross-sectional diameter, the inclusion of the poreresulted in significant spread in the data compared to sampleswith smaller pores or no pores. At a pore diameter of1200 μm, 20% of the cross-sectional diameter, seven of thenine samples failed at the pore. It was evident when a sampledid fail at a pore because the pore, surrounded by shear lips,was clearly visible on the fracture surfaces in these samples.Once the initial pore was 1800 μm in diameter, 30% of thecross-sectional diameter, there was a repeatable reduction in
the elongation to failure of the samples to 26.5 ± 0.5% com-pared to 64 ± 0.5% in the dense samples. Increasing pore di-ameters resulted in decreased elongation to failure for all porediameters exceeding 1800 μm, as shown in Fig. 11a. Thesamples with the largest pore, 4800 μm in diameter, had ten-sile elongations to failure of under 1.5%.
Deterioration of material strength occurred for pores great-er than or equal to 2400 μm in diameter within the 6 mmdiameter gauge region. The UTS of the material dropped from619 ± 3MPa in the dense samples to 580 ± 5MPa for sampleswith an internal pore 2400 μm in diameter. The strength of thematerial continued to decrease with increasing pore diameterabove 2400 μm all the way to a UTS of 297 ± 5 MPa in thesample with the maximum pore diameter of 4800 μm asshown in Fig. 11b.
These findings indicate that L-PBF 316L is defect insensitiveup to large pore sizes, with respect to sample dimensions.Samples with a gauge diameter of 6 mm and an internal porediameter up to 2400μmmaintain the experimentally determinedUTS of wrought 316L [38], while samples with a pore diameterof up to 3600 μmmaintain the experimentally determined UTSof as-cast 316L [39]. Additionally, the uniform elongation of the6 mm gauge diameter sample exceeds that required of wroughtmaterial even with a 1200 μm intentional pore.
Fig. 11 Box plots displaying theminimum, maximum, first andthird quartiles, exclusive median(central line), and mean (x) of (a)tensile elongation to failure and(b) ultimate tensile strength as afunction of pore diameter with thepore diameter at which each ofthese properties begins to benegatively impacted shown. Insetof (a) is given in (c)
Exp Mech
Conclusion
The current work evaluated the effect of internal pores on thetensile properties of L-PBF 316L and compared commontechniques used to evaluate internal pores in metallic compo-nents. This study, which is unique in both the material evalu-ated and the fact that pores of varying sizes were directlyfabricated inside of samples to link pore geometry to mechan-ical properties, provides the following primary conclusions:
& The tensile strength of L-PBF 316L was shown to beinsensitive of significant defects. Penny-shaped intention-ally introduced pores with a height on the order of 180 μmwithin tensile samples with a gauge diameter of 6 mmonly began to impact ultimate tensile strength when thepore diameter was 2400 μm, or 16% of the cross-sectionalsample area.
& The tensile elongation to failure was slightly more sensi-tive to the internal defects as the elongation decreasedsubstantially when the pore diameter was 1800 μm indiameter or 9% of the cross-sectional sample area.
& Samples with a pore diameter of 450 μm and smallerbehaved very similarly to dense samples, with the me-chanical properties showing very good repeatability, nodrop-off in strength, and only 9% reduction in elongationto failure. The 600 μm and 1200 μm pore diameters led tosignificant scatter in the elongation to failure behavior.
& Internal pores were most accurately characterized using the3D X-ray CT technique, which could capture pore mor-phology, pore size, pore location, and if multiple pores werepresent, the spatial distributions of pores and pore sizes;however, if this method is not an option, 2D cross-sectionanalysis with OM of pores 1200 μm and smaller providesdata that captures the geometry of the pores within 20% onaverage. For larger pores or internal features, 2D radio-graphs provide fast and accurate geometry information.
Acknowledgements The financial support provided by the NationalScience Foundation through award number CMMI-1652575 is gratefullyacknowledged. Any opinions, findings, and conclusions or recommenda-tions expressed in this material are those of the authors and do not nec-essarily reflect the views of the National Science Foundation. The sam-ples were fabricated at Penn State’s Center for Innovative MaterialsProcessing through Direct Digital Deposition (CIMP-3D). The authorsalso express their gratitude to the staff of the Center for QuantitativeImaging (CQI) at Penn State for their help with X-ray CTwork.
Publisher’s Note Springer Nature remains neutral with regard to juris-dictional claims in published maps and institutional affiliations.
References
1. DebRoy T, Wei HL, Zuback JS, Mukherjee T, Elmer JW, MilewskiJO, Beese AM, Wilson-Heid A, De A, Zhang W (2018) Additive
manufacturing of metallic components – process, structure andproperties. Prog Mater Sci 92. https://doi.org/10.1016/j.pmatsci.2017.10.001
2. Sun S, Brandt M, Easton M (2017) Powder bed fusion processes:An overview. In: Laser Additive Manufacturing. pp 55–77
3. Gu DD, Meiners W, Wissenbach K, Poprawe R (2012) Laser addi-tive manufacturing of metallic components: materials, processesand mechanisms. Int Mater Rev 57:133–164. https://doi.org/10.1179/1743280411Y.0000000014
4. Cunningham R, Nicolas A, Madsen J, Fodran E, Anagnostou E,Sangid MD, Rollett AD (2017) Analyzing the effects of powderand post-processing on porosity and properties of electron beammelted Ti-6Al-4V. Mater Res Lett 5:516–525. https://doi.org/10.1080/21663831.2017.1340911
5. Li R, Liu J, Shi Y, Du M, Xie Z (2010) 316L stainless steel withgradient porosity fabricated by selective laser melting. J Mater EngPerform 19:666–671. https://doi.org/10.1007/s11665-009-9535-2
6. Sames WJ, List FA, Pannala S, Dehoff RR, Babu SS (2016) Themetallurgy and processing science of metal additive manufacturing.Int Mater Rev 61:315–360. https://doi.org/10.1080/09506608.2015.1116649
7. King WE, Barth HD, Castillo VM, Gallegos GF, Gibbs JW, HahnDE, Kamath C, Rubenchik AM (2014) Observation of keyhole-mode laser melting in laser powder-bed fusion additive manufactur-ing. J Mater Process Technol 214:2915–2925. https://doi.org/10.1016/j.jmatprotec.2014.06.005
8. Vilaro T, Colin C, Bartout JD (2011) As-fabricated and heat-treatedmicrostructures of the Ti-6Al-4Valloy processed by selective lasermelting. Metall Mater Trans A 42:3190–3199. https://doi.org/10.1007/s11661-011-0731-y
9. Cunningham R, Narra SP, Montgomery C, Beuth J, Rollett AD(2017) Synchrotron-based X-ray microtomography characteriza-tion of the effect of processing variables on porosity formation inlaser power-bed additive manufacturing of Ti-6Al-4V. Jom 69:479–484. https://doi.org/10.1007/s11837-016-2234-1
10. Morrow BM, Lienert TJ, Knapp CM, Sutton JO, Brand MJ,Pacheco RM, Livescu V, Carpenter JS, Iii GTG (2018) Impact ofdefects in powder feedstock materials on microstructure of 304Land 316L stainless steel produced by additive manufacturing.Metall Mater Trans A. https://doi.org/10.1007/s11661-018-4661-9
11. Whittenberger EJ, Rhines FN (1952) Origin of porosity in castingsof magnesium-aluminum and other alloys. J Met 4:409–420
12. Gong H, Rafi K, Gu H, Janaki Ram GD, Starr T, Stucker B (2015)Influence of defects on mechanical properties of Ti-6Al-4V com-ponents produced by selective laser melting and electron beammelting. Mater Des 86:545–554. https://doi.org/10.1016/j.matdes.2015.07.147
13. Mertens A, Reginster S, Paydas H, Contrepois Q, Dormal T,Lemaire O, Lecomte-Beckers J (2014) Mechanical properties ofalloy Ti–6Al–4Vand of stainless steel 316L processed by selectivelaser melting: influence of out-of-equilibrium microstructures.Powder Metal l 57:184–189. ht tps: / /doi .org/10.1179/1743290114Y.0000000092
14. Carlton HD, Haboub A, Gallegos GF, Parkinson DY, MacDowellAA (2016) Damage evolution and failure mechanisms in additivelymanufactured stainless steel. Mater Sci Eng A 651:406–414.https://doi.org/10.1016/j.msea.2015.10.073
15. Edwards P, Ramulu M (2014) Fatigue performance evaluation ofselective laser melted Ti–6Al–4V. Mater Sci Eng A 598:327–337.https://doi.org/10.1016/j.msea.2014.01.041
16. Stef J, Poulon-Quintin A, Redjaimia A, Ghanbaja J, Ferry O, DeSousa M, Gouné M (2018) Mechanism of porosity formation andinfluence on mechanical properties in selective laser melting of Ti-6Al-4V parts. Mater Des doi: https://doi.org/10.1016/j.matdes.2018.06.049
Exp Mech

17. Spierings AB, Schneider M, Eggenberger R (2011) Comparison ofdensity measurement techniques for additive manufacturedmetallicparts. Rapid Prototyp J 17:380–386. https://doi.org/10.1108/13552541111156504
18. Haynes R (1971) Effect of porosity content on the tensile strengthof porous materials. Powder Metall 14:64–70. https://doi.org/10.1179/pom.1971.14.27.004
19. Haynes R (1977) A study of the effect of porosity content on theductility of sintered metals. Powder Metall 20:17–20. https://doi.org/10.1179/pom.1977.20.1.17
20. Gurson AL (1977) Continuum theory of ductile rupture by voidnucleation and growth: part I—yield criteria and flow rules forporous ductile media. J Eng Mater Technol 99:2. https://doi.org/10.1115/1.3443401
21. McClintock FA (1968) A criterion for ductile fracture by the growthof holes. J Appl Mech 35:363–371. https://doi.org/10.1115/1.3601204
22. Fadida R, Shirizly A, Rittel D (2018) Dynamic tensile response ofadditively manufactured Ti6Al4Vwith embedded spherical pores. JAppl Mech 85:1–10. https://doi.org/10.1115/1.4039048
23. Slotwinski JA, Garboczi EJ, Hebenstreit KM (2014) Porosity mea-surements and analysis for metal additive manufacturing processcontrol. J Res Natl Inst Stand Technol 119:494–528. https://doi.org/10.6028/jres.119.019
24. Yusuf S, Chen Y, Boardman R, Yang S, Gao N (2017) Investigationon porosity and microhardness of 316L stainless steel fabricated byselective laser melting. Metals (Basel) 7:64. https://doi.org/10.3390/met7020064
25. Thompson A, Maskery I, Leach RK (2016) X-ray computed to-mography for additive manufacturing: a review. Meas Sci Technol27. https://doi.org/10.1088/0957-0233/27/7/072001
26. De Chiffre L, Carmignato S, Kruth JP, Schmitt R, Weckenmann A(2014) Industrial applications of computed tomography. CIRPAnn- Manuf Technol 63:655–677. https://doi.org/10.1016/j.cirp.2014.05.011
27. 3D Systems ProX® DMP 320. https://www.3dsystems.com/3d-printers/production/prox-dmp-320. Accessed 21 Feb 2017
28. ASTM International (2018) E1019–18: Standard Test Methods forDetermination of Carbon, Sulfur, Nitrogen, and Oxygen in Steeland in Steel, Iron, Nickel, and Cobalt Alloys by VariousCombustion and Fusion Techniques
29. ASTM International (2017) E1097–12: Standard Guide forDetermination of Various Elements by Direct Current PlasmaAtomic Emission Spectrometry
30. Riemer A, Leuders S, ThöneM, Richard HA, Tröster T, Niendorf T(2014) On the fatigue crack growth behavior in 316L stainless steelmanufactured by selective laser melting. Eng Fract Mech 120:15–25. https://doi.org/10.1016/j.engfracmech.2014.03.008
31. ASTM International (2016) E8/E8M - 16a: Standard Test Methodsfor Tension Testing of Metallic Materials
32. Frazier WE (2014) Metal additive manufacturing: a review. J MaterEng Perform 23:1917–1928. https://doi.org/10.1007/s11665-014-0958-z
33. ASM International (2003) Alloy Digest34. Schneider CA, Rasband WS, Eliceiri KW (2012) NIH image to
ImageJ: 25 years of image analysis. Nat Methods 9:671–675.https://doi.org/10.1038/nmeth.2089
35. du Plessis A, Yadroitsev I, Yadroitsava I, Le Roux SG (2018) X-raymicrocomputed tomography in additive manufacturing: a review ofthe current technology and applications. 3D Print Addit Manuf 5:1–21. https://doi.org/10.1089/3dp.2018.0060
36. Feldkamp LA, Davis LC, Kress JW (1984) Practical cone-beamalgorithm. J Opt Soc Am A 1:612–619. https://doi.org/10.1364/JOSAA.1.000612
37. Thermo Fisher Scientific (2018) Avizo Software 9 User’s Guide.61–101
38. Mower TM, Long MJ (2016) Mechanical behavior of additivemanufactured, powder-bed laser-fused materials. Mater Sci Eng A651:198–213. https://doi.org/10.1016/j.msea.2015.10.068
39. Wang YM, Voisin T, McKeown JT, Ye J, Calta NP, Li Z, Zeng Z,Zhang Y, Chen W, Roehling TT, Ott RT, Santala MK, Depond PJ,Matthews MJ, Hamza AV, Zhu T (2017) Additively manufacturedhierarchical stainless steels with high strength and ductility. NatMater. https://doi.org/10.1038/nmat5021
Exp Mech