characterization of the air void system in concrete …
TRANSCRIPT
The Pennsylvania State University
The Graduate School
College of Engineering
CHARACTERIZATION OF THE AIR VOID SYSTEM
IN CONCRETE USING THERMOGRAPHY
A Thesis in
Civil Engineering
by
Chao Xiao
©2010 Chao Xiao
Submitted in Partial Fulfillment
of the Requirements
for the Degree of
Master of Science
May 2010

ii
The thesis of Chao Xiao was reviewed and approved* by the following:
Maria Lopez de Murphy
Assistant Professor of Civil Engineering
Thesis Adviser
Barry E. Scheetz
Professor of Civil Engineering
Clifford J. Lissenden
Professor of Engineering Science and Mechanics
Peggy A. Johnson
Professor of Civil and Environmental Engineering
Head of the Department of Civil and Environmental Engineering
*Signatures are on file in the Graduate School

iii
ABSTRACT
A rapid and robust testing procedure is significant for assessing the air void system in fresh concrete so
that quality control adjustments can be made to improve freeze-thaw durability of concrete before it is
hardened. In this research, a new methodology using impulse thermography was developed and
evaluated for characterizing the air void system in both fresh and hardened concrete. It was found that
the air entrainment in concrete affected its heat conductivity, leading to a change of the surface thermal
signature pattern, which can be captured by an infrared camera. In addition, a clear distinction was
observed in a derived thermography coefficient, defined as the slope of thermal gradients on the surface
of the concrete specimen, for the concrete specimens with different air void systems. Furthermore, these
thermography coefficients correlate well with the total air contents, as determined by the standard
testing methods (ASTM C 231 and 457). This new methodology allows for the determination of the air
content in concrete within the first 2 hours of placement. These results indicate that the use of
thermography could be further developed to characterize the air void system of fresh concrete in the
field.

iv
TABLE OF CONTENTS
LIST OF FIGURES .........................................................................................................................v
LIST OF TABLES ......................................................................................................................... vi
ACKNOWLEDGMENTS ............................................................................................................ vii
Chapter 1. INTRODUCTION ..........................................................................................................1
1.1 Introduction .........................................................................................................................1
1.2 Research Objectives ............................................................................................................3
Chapter 2. BACKGROUND ............................................................................................................4
2.1 Freeze-Thaw Damage..........................................................................................................4
2.2 Air Void System in Concrete ..............................................................................................5
2.3 Current technologies in development to characterize the air void system in concrete .......9
2.4 Thermography Theory .......................................................................................................13
2.5 Thermography Applications ..............................................................................................15
2.6 Significance of Research ...................................................................................................18
Chapter 3. EXPERIMENTAL PROCEDURES ............................................................................19
3.1 Specimens Tested ..............................................................................................................19
3.2 Standard Testing Methods .................................................................................................20
3.3 Thermography Testing Procedure .....................................................................................21
Chapter 4. RESULTS AND ANALYSIS ......................................................................................23
4.1 Standard Testing Results ...................................................................................................23
4.2 Thermography Testing Results .........................................................................................26
4.3 Correlation between Thermography Results and Standard Testing Results .....................32
4.4 Hydration Temperature Measurement ..............................................................................35
4.5 Supplemental Measurement ..............................................................................................36
Chapter 5. CONCLUSIONS AND RECOMMENDATIONS.......................................................37
REFERENCES ..............................................................................................................................39
Appendix A: Thermal Images ........................................................................................................43
Appendix B: Point Analysis Plots .................................................................................................45
Appendix C: Line Analysis Plots ...................................................................................................46
v
LIST OF FIGURES
Figure 1. Schematic diagram of AEA mechanism.....................................................................…..6
Figure 2. Comparison between two pastes which have the same air content and different spacing
factor ..............................................................................................................................8
Figure 3. A picture of air void analyzer .........................................................................................10
Figure 4. X-ray CT scanning images .............................................................................................11
Figure 5. Ultrasonic testing setup on a fresh concrete specimen ...................................................13
Figure 6. Electromagnetic spectrum ..............................................................................................15
Figure 7. Experimental set-up for the measurement of impulse-thermography ...........................17
Figure 8. Schematics and photograph of infrared camera setup ....................................................22
Figure 9. Schematics and photograph of halogen lamp heating ....................................................22
Figure 10. Comparison between fresh air content and hardened air content .................................24
Figure 11. Microscopical images for different specimens .............................................................25
Figure 12. Thermal images for concrete with air entrainment and concrete without air entrainment
......................................................................................................................................26
Figure 13. Slab surface cool-down at the hottest spot for fresh concrete with and without air
entrainment. .................................................................................................................27
Figure 14. Spatial thermal gradient along line 1 for fresh concrete with air entrainment and
ncrete without air entrainment .......................................................................................................28
Figure 15. Plots of thermography coefficient as a function of cool down time ..........................32
Figure 16. Correlation between air content and thermography coefficient ...................................33
Figure 17. Correlation between spacing factor and thermography coefficient ..............................34
Figure 18. Correlation between specific surface and thermography coefficient ...........................34
Figure 19. Temperature variation over hydration time for concrete with air entrainment ............35
Figure 20. Thermal images of a subsurface air void ......................................................................36

vi
LIST OF TABLES
Table 1. Mixture composition of concrete with air entrainment ...................................................20
Table 2. The air void results obtained by ASTM standard tests ....................................................24
Table 3. Second order fit coefficient for each specimen ...............................................................31
Table 4. Thermography coefficients derived from two different lines ..........................................31
vii
ACKNOWLEDGMENTS
This is a great opportunity to express my respect to my supervisor, Dr. Maria Lopez, whose
encouragement, guidance and support from the initial to the final level enabled me to finish my thesis. I
would like to thank Dr. Cliff Lissenden and Dr. Barry Scheetz for serving on my committee and for their
valuable suggestions on my thesis.
I am pleased to thank the Pennsylvania Department of Transportation, who financially supported this
project. And special thanks must go to Dan Fura and Zi Sang for helping me with laboratory work.
Lastly, I offer my regards and blessings to all of my family and friends, on whose constant
encouragement and love I relied during my time at Penn State. I would not have made it without you.

1
Chapter 1. INTRODUCTION
1.1 Introduction
In northern climates, freeze-thaw cycles can severely influence the durability of concrete pavement by
causing cracks, scaling and spalling, thus diminishing its service life. The detailed mechanisms of the
resulting damage are not completely understood to date, but it is known that the expansion of freezing
water does contribute to this damage (Pigeon and Pleau, 1995). Air entrainment has been proven to
effectively protect concrete from the damage caused by freeze-thaw cycles (Du et al., 2005). Chemical
air entraining admixtures are usually used in the concrete mixtures to establish an air void system where
many small air voids are well dispersed (the desirable air voids are typically less than 200 microns
diameter, with a total air content in the range of 6% and spacing factor less than 300 microns). On the
other hand, excessive and large size air voids can lead to the decrease in compressive strength of the
concrete (Pigeon and Pleau, 1995). Thus, an appropriate air void system in concrete has been proven to
increase concrete’s resistance to the freeze-thaw damage.
The total air content of the fresh concrete mixture is typically measured before the placement using
ASTM standard methods (ASTM C 138, 173, 231). However, air content can be changed due to the
construction operations such as placement, compaction and finishing (Rupnow et al., 2008). Available
standard methods for fresh concrete characterizing cannot provide information about the distribution and
sizes of the air voids, which are also important for freeze-thaw durability of concrete. Air Void Analyzer
(AVA) has recently emerged to be a device measuring the distribution and size of the air voids in fresh
concrete. However, its high sensitivity to environmental effects makes this technology not appropriate
for the field implementation (Desai et al., 2007). The Portland Cement Association uses the following
2
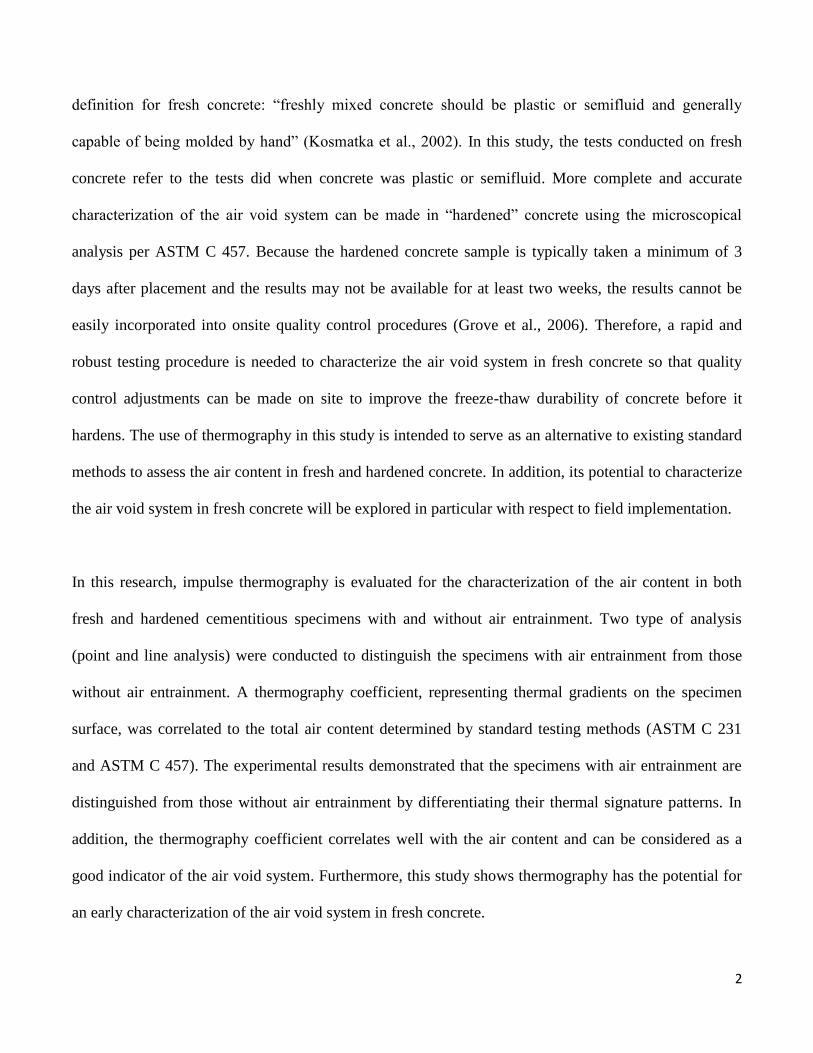
definition for fresh concrete: “freshly mixed concrete should be plastic or semifluid and generally
capable of being molded by hand” (Kosmatka et al., 2002). In this study, the tests conducted on fresh
concrete refer to the tests did when concrete was plastic or semifluid. More complete and accurate
characterization of the air void system can be made in “hardened” concrete using the microscopical
analysis per ASTM C 457. Because the hardened concrete sample is typically taken a minimum of 3
days after placement and the results may not be available for at least two weeks, the results cannot be
easily incorporated into onsite quality control procedures (Grove et al., 2006). Therefore, a rapid and
robust testing procedure is needed to characterize the air void system in fresh concrete so that quality
control adjustments can be made on site to improve the freeze-thaw durability of concrete before it
hardens. The use of thermography in this study is intended to serve as an alternative to existing standard
methods to assess the air content in fresh and hardened concrete. In addition, its potential to characterize
the air void system in fresh concrete will be explored in particular with respect to field implementation.
In this research, impulse thermography is evaluated for the characterization of the air content in both
fresh and hardened cementitious specimens with and without air entrainment. Two type of analysis
(point and line analysis) were conducted to distinguish the specimens with air entrainment from those
without air entrainment. A thermography coefficient, representing thermal gradients on the specimen
surface, was correlated to the total air content determined by standard testing methods (ASTM C 231
and ASTM C 457). The experimental results demonstrated that the specimens with air entrainment are
distinguished from those without air entrainment by differentiating their thermal signature patterns. In
addition, the thermography coefficient correlates well with the air content and can be considered as a
good indicator of the air void system. Furthermore, this study shows thermography has the potential for
an early characterization of the air void system in fresh concrete.

3
1.2 Research Objectives
1. To develop a new methodology and setup based on the thermography technology suited for the
determination of the air content in fresh and hardened concrete.
2. To distinguish concrete with air entrainment from concrete without air entrainment using the
developed thermography testing procedure.
3. To establish correlations between thermography results and air void parameters (air content,
spacing factor and specific surface) measured by standard testing methods.
4. To incorporate the thermography testing result to the onsite quality control procedure.
5. To evaluate the potential of this new methodology to fully characterize the air void system in
fresh and hardened concrete.
4
Chapter 2. BACKGROUND
2.1 Freeze-Thaw Damage
When concrete without a satisfying air void system is exposed to alternative cycles of freezing and
thawing, internal cracks usually occur in the paste. Many theories have been put forward in the last 50
years to explain the action of freeze-thaw damage on concrete. There are three theories which are widely
accepted to explain the mechanism, including hydraulic pressure, osmotic pressure theory and Litvan
theory.
Powers (1945) first stated that excessive hydraulic pressures resulting from the expansion of ice are the
reason for freeze-thaw damage. When ice gradually forms at different locations in saturated capillary
pores, the volume will expand 9 percent, resulting in the surrounding unfrozen water to be expelled
away from the freezing sites. In order to resist this flow, excessive internal stresses in the pore system
will be generated due to the hydraulic pressure. If there are air voids around the freezing site which can
release this pressure, it will freeze without causing damage.
However, the hydraulic pressure theory does not to take into account the fact that water in the pores of
cement paste is nor pure. The water contains dissolved chemicals (mainly the Na2O and K2O). Therefore,
the hydraulic pressure theory was modified to develop the osmotic pressure theory by Powers and
Helmuth (1953). This theory is based on the fact that the ice forming in concrete pores is made of pure
water, ejecting out solute ions which were originally in the solution. So solute ions will concentrate in
the remaining pore fluid. Thus, the unfrozen pore fluid at the freezing sites becomes ion concentrated

5
solution. Then, the solution with less concentrated ion will drain toward the freezing sites to balance
thermodynamic equilibrium. The driving force here is different with chemical potential. This theory can
explain that undercooled water in small pores will tend to drain towards the sites of freezing in large
pores to release latent heat of fusion and reduce the energy. Therefore, the water will move from smaller
pores to larger air voids, eliminating the internal stresses resulting from the driving force.
The more recent theory was produced by Litvan (1978) who conducted a large number of studies to
explain the freeze-thaw action. Litvan attributes the damage of concrete to the following mechanisms:
“If a flaw in the solid is surrounded by sound concrete, any water from the undamaged portion will
migrate on cooling to the crack, filling it completely; on solidifying it causes the fissure to propagate.
On the following cooling portion of the freeze-thaw cycle the crack draws more water and freezing
results in further damage. Damage also occurs when the required rate of water expulsion, usually
necessitated by rapid cooling, is so high that it cannot be realized in the paste. In such cases, some of the
passageways presumably become blocked by ice and internal pressure is generated” (Litvan, 1978;
Sutter, 2007). This theory explains clearly the fundamental phenomenon which forms the basis of
freeze-thaw action, such as the forced movement of water caused by the vapor pressure difference.
2.2 Air Void System in Concrete
One of the greatest advances in concrete technology was the development of air-entrained concrete in
the mid-1930s (Kosmatka et al., 2002). Nowadays, air entrainment is recommended for nearly all
concretes, primarily to improve freeze-thaw resistance of concrete that is exposed to water and deicing
chemicals.

6
Air is entrained in fresh concrete by the mixing process (Kosmatka et al., 2002). The addition of air
entraining admixture to concrete helps to facilitate this process and to stabilize the air bubbles in the mix
by reducing surface energy of water. Most air entraining admixtures are surface-active agents which are
composed of long organic molecules with a hydrophilic end (negatively charged) and a hydrophobic end.
These molecules concentrate at the interface between paste and air bubbles, forming an elastic film
around the air bubbles (schematically shown in Figure 1). The natural tendency of air bubbles in
concrete is to coalesce to form larger air bubbles because of the decrease of surface energy. This film
reduces the risk of air void coalescence when collisions occur during mixing process and anchors the air
bubbles to the paste, thus effectively stabilizing the air bubbles (Pigeon and Pleau, 2005).
Figure 1. Schematic diagram of AEA mechanism (Ansari et al., 2002)
According to ASTM C 457, the concrete air void system is characterized by three parameters: air void
content, specific surface and spacing factor. Generally concrete with good freeze-thaw resistance has a
moderately high air content, a low enough spacing factor and relatively high specific surface (ASTM C
457).

7
Air void content is the total volume fraction of air voids in concrete. In the technical literature, the air
void content is sometimes defined in reference to the cement paste instead of the total air void content
because the air void system only occurs in cement paste. Specific surface is defined as the surface area
of air voids divided by the volume of air voids. It indicates the void frequency and the mean size of the
voids. Smaller bubbles have a higher specific surface. Spacing factor is defined as “the average distance
from any point in the paste to the edge of the nearest void” (Mindess et al., 2003). The spacing factor is
considered the most important factor with regard to freeze-thaw resistance since it is “the spacing of the
air voids which determines the maximum distance that freezable water must travel through the cement
paste to reach an escape boundary where ice crystals can grow freely without generating disruptive
pressures” (Pigeon and Pleau, 1995). Figure 2 shows the representation of two cement paste samples
with the same air content of 13%. Assuming that the thickness of "shells" of protected paste by air voids
is 0.254 mm (0.01 inch) (Hover, 2002), the protected area covered by "shells" in the paste to the right is
much larger than that in the paste to the left. The paste to the right has a lower spacing factor than the
left one even though they have the same air content.

8
Figure 2. Comparison between two pastes which have the same air content and different spacing factor
(Hover, 2002)
Entrained air does not only provide concrete with freeze-thaw durability and also improves concrete
workability because the air voids act like fine aggregates in the cement paste, thus reducing the friction
between solid aggregates. Entrained air also reduces the chances of bleeding and segregation during
handling and transportation of concrete mixes. However, too much entrained air in concrete could lower
the strength of the concrete as the mixture loses its integrity in the presence of air voids (Sutter, 2007). A
good “rule of thumb” is that each 1% of entrained air will lower strength by 5% (Mindess et al., 2003).
9
2.3 Current technologies in development to characterize the air void system in concrete
2.3.1 Air void analyzer
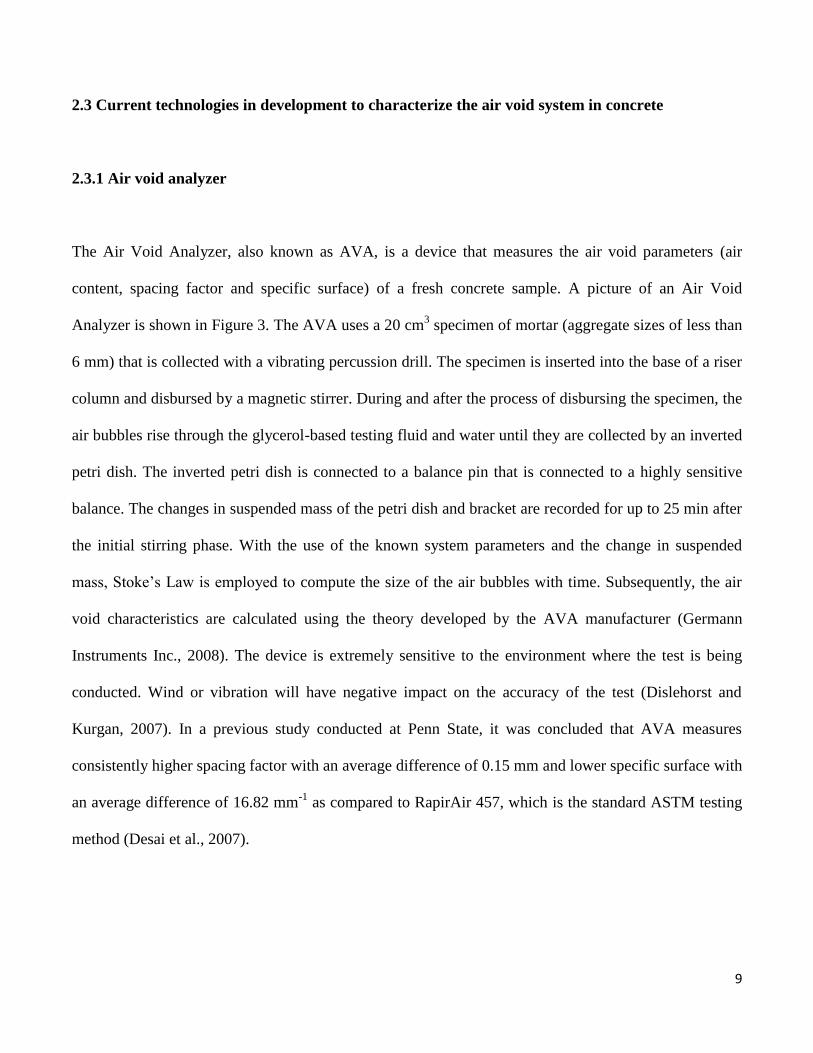
The Air Void Analyzer, also known as AVA, is a device that measures the air void parameters (air
content, spacing factor and specific surface) of a fresh concrete sample. A picture of an Air Void
Analyzer is shown in Figure 3. The AVA uses a 20 cm3 specimen of mortar (aggregate sizes of less than
6 mm) that is collected with a vibrating percussion drill. The specimen is inserted into the base of a riser
column and disbursed by a magnetic stirrer. During and after the process of disbursing the specimen, the
air bubbles rise through the glycerol-based testing fluid and water until they are collected by an inverted
petri dish. The inverted petri dish is connected to a balance pin that is connected to a highly sensitive
balance. The changes in suspended mass of the petri dish and bracket are recorded for up to 25 min after
the initial stirring phase. With the use of the known system parameters and the change in suspended
mass, Stoke’s Law is employed to compute the size of the air bubbles with time. Subsequently, the air
void characteristics are calculated using the theory developed by the AVA manufacturer (Germann
Instruments Inc., 2008). The device is extremely sensitive to the environment where the test is being
conducted. Wind or vibration will have negative impact on the accuracy of the test (Dislehorst and
Kurgan, 2007). In a previous study conducted at Penn State, it was concluded that AVA measures
consistently higher spacing factor with an average difference of 0.15 mm and lower specific surface with
an average difference of 16.82 mm-1
as compared to RapirAir 457, which is the standard ASTM testing
method (Desai et al., 2007).

10
Figure 3. A picture of air void analyzer (Germann Instruments Inc., 2008)
2.3.2 X-ray CT scanning
The use of X-ray CT scanning to characterize air voids in hardened concrete is still being researched and
developed. X-ray CT scanning is based on the concept of X-ray attenuation. X-ray attenuation in
materials is due to two phenomena. One is called Compton scattering, which depends mainly on the bulk
density of the material. The other is mass attenuation, which depends on the atomic number of the
material. The X-ray CT scanning can generate a three-dimensional map of density with respect to
location inside the sample. Voids are identified as close-to-zero density (Wiese et al., 2000). The
Wisconsin Department of Transportation sponsored a research project to assess the feasibility of
different technologies that could be potentially used for characterizing air void parameters in concrete
(Sutter, 2007). This research report concluded that X-ray CT scanning has the potential to accurately
characterize the air void system in fresh and hardened concrete. One advantage of this technology was
its nondestructive nature, suggesting that it is feasible for the field implementation. Another advantage is

11
that the three-dimensional image of the air void structure in concrete can be obtained using X-ray CT
scanning (Sutter, 2007). However, a method of processing the image data needs to be developed to
compute the air content, spacing factor, and specific surfaces. Researchers at the University of Maine
(Landis and Corr, 2008) have proposed an image analysis methodology by which three dimensional data
can be used to calculate the air void parameter. Figure 4a shows a top view of a three-dimensional image
of a hardened concrete sample from an X-ray CT scanner. Aggregate, cement and air voids are all
visible. Since the only interesting part of this image is the air void structure, the data is transformed into
an array of binary points. The image using the binary matrix is displayed in Figure 4b. Cement paste and
aggregate are both displayed as white; air voids are black in the image. The matrix is transformed further
so that each pixel is a number that corresponds to the distance from the closest air void. Figure 4c is the
visualization of the transformed data. With this matrix of distances from air voids, the “true” average
spacing factor and spacing factor distribution can be determined. Other air void parameters such as air
content and specific surface can be obtained similarly. The limitation of this technology is closely
related to the resolution of the scanner used to obtain the raw image. For example, if there is need to
evaluate air voids with a diameter of less than 300 microns, a scanner with resolution in the scale of 10-
100 microns should be considered. For this range, only industrial scanners could be used. If a medical
scanner were to be used, only air void diameters larger than 250 microns would be detected.
Figure 4. (a) Raw Image (b) Binary Image (c) Transformed Image (Landis and Corr, 2008)
(The scale bar is not provided in the original paper)

12
2.3.3 Ultrasonic technique
The application of ultrasonic technique to characterize the air void system in concrete was evaluated in a
recent PennDOT project (Lopez et al., 2009). The essence of ultrasonic nondestructive testing is that a
pressure wave having a frequency in the ultrasonic domain is emitted into the subject material at one
point and, after propagating through the material, is received at another point or back at the point of
origin. The ultrasonic testing setup in the project is shown in Figure 5. The setup consists of an
ultrasonic transmitter, a receiver and a computer system which collects and processes the ultrasonic data.
Two broadbanded 1-inch, 500-kHz center-frequency transducers were used as transmitter and receiver
in through-transmission mode. The transducers enabled a broad bandwidth of frequencies (100-700 kHz)
to be employed. The transducers were mounted on Plexiglas wedges bonded to steel mediators. The
angle of the wedge is selected to be the third critical angle to ensure a dominant surface wave is
generated in the mediator. The angle is calculated using Snell’s law to be 23 degrees from the normal
surface for Plexiglas and steel. Ultrasound Testing Results show that ultrasound is able to penetrate fresh
concrete as early as 4 hr after placement and that the Rayleigh wave speed is significantly influenced by
the air void system. Rayleigh wave is a type of surface acoustic wave that travels on solids (Rose, 1999).
The key result is that the Rayleigh wave speeds in normal concrete mix with air entrainment and in
normal concrete mix without air entrainment are 1017 and 1213 m/s, respectively, 5 hours after
placement. The difference of 16 percent indicates that Rayleigh waves have potential to be used to
characterize the air void system in addition to quantifying the air content.

13
Figure 5. Ultrasonic testing setup on a fresh concrete specimen
2.4 Thermography Theory
Thermography is a commonly used non-destructive testing technique in mechanical engineering. This
technique is based on heat transfer and infrared imaging science. The key component of the technology
is an infrared camera that captures the infrared radiation in the range of 0.9~14 microns. According to
the Black Body Radiation Law, the amount of radiation from an object is a function of the surface
temperature and emissivity of the object. The temperature variation within the object can be observed by
the camera. The advancement of the infrared camera technology made it possible to detect temperature
change to 0.08 degree Celsius (Clark et al., 2003).
According to the Second Law of Thermodynamics, when a temperature difference exists between two
objects or two areas within the same object heat energy is transferred from the hotter area to the cooler

14
area until the thermal equilibrium is reached. There are three mechanisms for heat transfer: conduction,
convection and radiation. Conduction refers to the transfer of heat by direct contact of adjacent particles
within the object. Conduction occurs to a greater degree in solids than in liquids and gases where the
molecules are further apart. The rate of heat transfer due to conduction can be determined by Fourier’s
Law of Conduction expressed as Equation 1:
𝑄 = −𝑘𝐴𝑑𝑇
𝑑𝑥 Equation 1
Where 𝑄 is the rate of heat transfer, k is the thermal conductivity of the material, A is the surface area
perpendicular to direction of heat transfer, 𝑑𝑇
𝑑𝑥 is the thermal gradient. Convection refers to the transfer of
heat in gases and liquids or between a solid surface and the nearby gas or liquids, involving the mass
movement of molecules (Moran and Shapiro, 2007).
The third mechanism for heat transfer is through electromagnetic radiation emitted by an object. Unlike
the other two mechanisms, radiation does not need a medium to transfer heat. Electromagnetic radiation
is produced by an object when electrons of matter fall from a higher energy state to a lower energy state.
Both the wavelength and intensity of the radiation emitted by an object are directly related to the
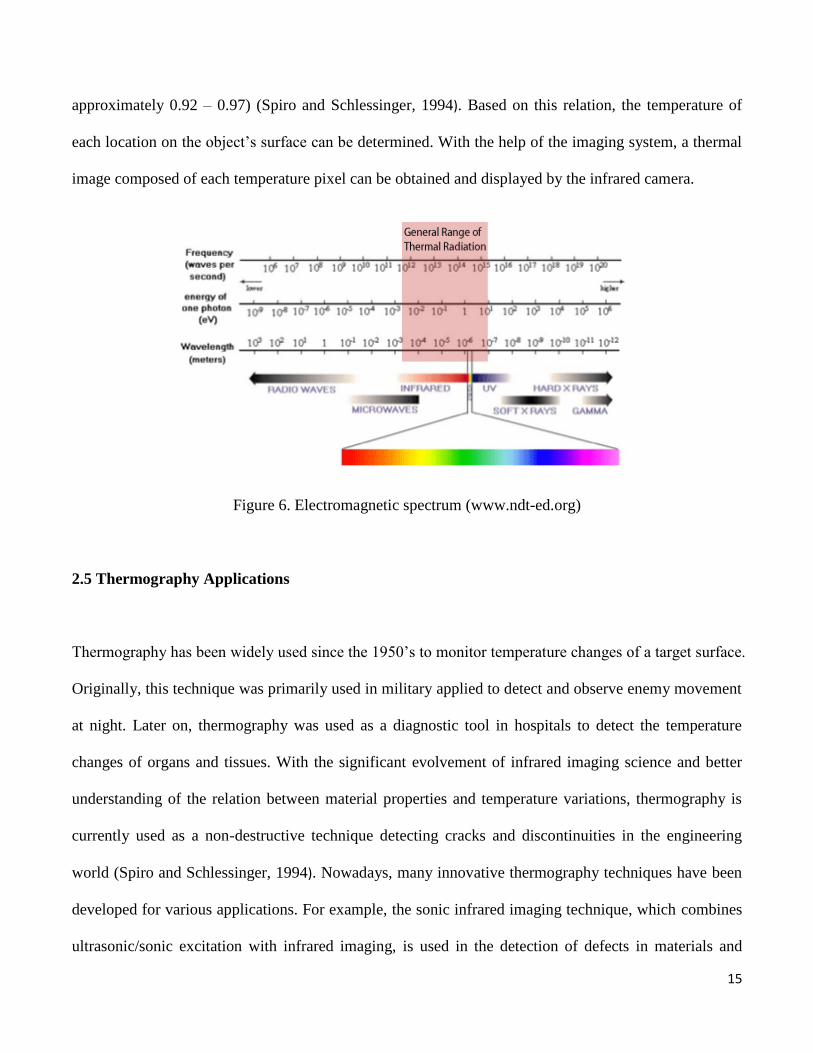
temperature of molecules or atoms on the object’s surface (Moran and Shapiro, 2007). The wavelength
of thermal radiation is generally in the range from 0.1 microns to several hundred microns as highlighted
in Figure 6. It should be noted that the most of thermal radiation fall in the infrared range while only a
very small portion of thermal radiation is in the range of visible light. This means the most of the
thermal radiation cannot be observed by human eyes. Therefore, the infrared camera is used to detect
and display the thermal radiation due to its capability to image infrared energy. The amount of thermal
radiation energy is a function of the object’s temperature and emissivity which is a measure of a
surface's efficiency in transferring infrared energy (at typical temperature, concrete’s emissivity is
15
approximately 0.92 – 0.97) (Spiro and Schlessinger, 1994). Based on this relation, the temperature of
each location on the object’s surface can be determined. With the help of the imaging system, a thermal
image composed of each temperature pixel can be obtained and displayed by the infrared camera.
Figure 6. Electromagnetic spectrum (www.ndt-ed.org)
2.5 Thermography Applications
Thermography has been widely used since the 1950’s to monitor temperature changes of a target surface.
Originally, this technique was primarily used in military applied to detect and observe enemy movement
at night. Later on, thermography was used as a diagnostic tool in hospitals to detect the temperature
changes of organs and tissues. With the significant evolvement of infrared imaging science and better
understanding of the relation between material properties and temperature variations, thermography is
currently used as a non-destructive technique detecting cracks and discontinuities in the engineering
world (Spiro and Schlessinger, 1994). Nowadays, many innovative thermography techniques have been
developed for various applications. For example, the sonic infrared imaging technique, which combines
ultrasonic/sonic excitation with infrared imaging, is used in the detection of defects in materials and
16
structures (Han et al., 2005). Lock-in thermography which measures near-tip singular temperature field
is used to identify fatigue cracks (Sakagami et al., 2000). Thermography has been also successfully
applied to cement-based materials. Some agencies use infrared imaging thermography to inspect the
integrities of concrete buildings and bridges on a regular basis. To monitor the health of structural
repairs, thermography is currently used to detect the delamination of FRP reinforcement on concrete
bridges and buildings (Brown and Hamilton, 2004). Researchers at the City University of Hong Kong
applied flash thermography to detect cracks on concrete surface and found surface cracks could be
significantly distinguished in the infrared image (Sham et al., 2008).
In the field of concrete characterization, Maihofer et al. (2003) at the Federal Institute for Materials
Research and Testing Center in Germany applied impulse thermography to detect shallow voids in
concrete structures. Figure 7 shows the experimental set-up of the impulse thermography. It consists of a
heating device, an infrared camera and a computer system which collects and processes the experimental
data. After heating the sample with the heating device for a period of time, the heat variation of the
sample surface is observed by the infrared camera as it cools down. Due to the fact that the rate of
cooling within the voids is slower than the rate elsewhere, the voids can be mapped according to
temperature variation. In addition, the maximum temperature difference and the time of its occurrence
are a function of the void size and its depth below the surface. Thus, the distribution of air voids can be
characterized using this technique.

17
Figure 7. Experimental set-up for the measurement of impulse-thermography
(Maierhofer et al., 2003)
The testing result showed this technique is very feasible for the detection of shallow voids in concrete
structures. However, it can only detect voids that can be defined as defects. The voids with a size of
more than 10 cm and a depth of less than 10 cm from the surface can be detected by using impulse-
thermography. For our purpose of characterizing air void system in hardened concrete, large depth of
concrete can still be examined by cutting the sample into small pieces. However, the sizes of air voids in
concrete are much smaller than 10cm which is the maximum resolution the technique can achieve. Thus,
we decided to study on the effect of air entrainment on the surface thermal patterns of concrete instead
of observing individual air voids.

18
2.6 Significance of Research
Freeze-thaw damage has been found as one of the common sources of deterioration in concrete
pavements. Research studies have identified that an appropriate air void system is needed to provide
concrete with the necessary protection. The development of a rapid and robust test procedure for
characterizing the air void system in fresh concrete can effectively contribute to improve quality control
at early stages. The proposed thermography methodology can distinguish concrete with air entrainment
from concrete without it in both fresh and hardened state. In addition, this methodology can be used to
determine the fresh and hardened air content of concrete by measuring the corresponding derived
thermography coefficients. Although more data would be needed to help to find correlations between the
derived thermography coefficients and other air void parameters (spacing factor and specific surface), it
is believed that this methodology has the strong potential to characterize the air void system in fresh
concrete in the field.

19
Chapter 3. EXPERIMENTAL PROCEDURES
3.1 Specimens Tested
In this evaluation of the use of impulse thermography, six different concrete specimens were
characterized using this technique and also using standard test methods for measuring the air void
parameters in fresh and hardened state (ASTM C 231 and ASTM C 457). Three different types of
cementitious mixtures were investigated: normal concrete, mortar (without coarse aggregate) and sieved
concrete (coarse aggregate of a diameter larger than 0.75 inches were removed). For each type of
specimen, one mixture with air entrainment and another without air entrainment were made for
comparison. Shorthand notations composed of two letters were used to identify the six different
mixtures. The first letter refers to the type of the mixture (C - normal concrete, S - sieved concrete, M -
mortar) and the second letter indicates the presence of entrained air in the mixture (A – air entrained, N
– not air entrained). For example, normal concrete with air entrainment is abbreviated by CA.
For each mixture, two sets of specimens were cast. One was used for thermography testing and another
was used for the standard testing method (ASTM C 457). All the cementitious mixtures were designed
with a water-cement ratio of 0.4 and coarse and fine aggregates content and gradation specified by the
Pennsylvania Department of Transportation (PennDOT). Water reducer was added in each mixture to
improve its workability. The specimens with air entrainment were produced by adding synthetic air
entraining admixture during mixing. Trial mixtures were conducted to determine the appropriate
quantities of water reducing and air-entraining admixtures (The dosages of chemical admixtures are
shown in Table 1). Target values of 4 ± 1 inches of slump and an average 6 ± 1.5 % air content for
normal concrete with air entrainment were used. Table 1 shows the final mixture composition of the
20
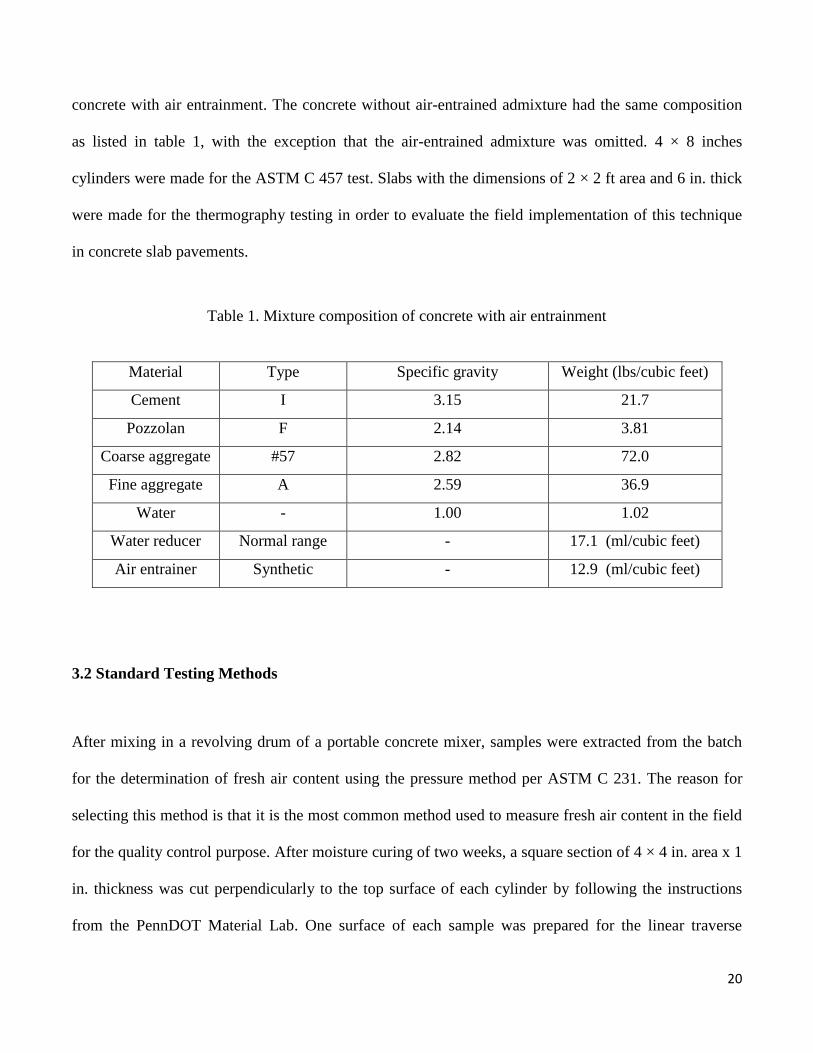
concrete with air entrainment. The concrete without air-entrained admixture had the same composition
as listed in table 1, with the exception that the air-entrained admixture was omitted. 4 × 8 inches
cylinders were made for the ASTM C 457 test. Slabs with the dimensions of 2 × 2 ft area and 6 in. thick
were made for the thermography testing in order to evaluate the field implementation of this technique
in concrete slab pavements.
Table 1. Mixture composition of concrete with air entrainment
Material Type Specific gravity Weight (lbs/cubic feet)
Cement I 3.15 21.7
Pozzolan F 2.14 3.81
Coarse aggregate #57 2.82 72.0
Fine aggregate A 2.59 36.9
Water - 1.00 1.02
Water reducer Normal range - 17.1 (ml/cubic feet)
Air entrainer Synthetic - 12.9 (ml/cubic feet)
3.2 Standard Testing Methods
After mixing in a revolving drum of a portable concrete mixer, samples were extracted from the batch
for the determination of fresh air content using the pressure method per ASTM C 231. The reason for
selecting this method is that it is the most common method used to measure fresh air content in the field
for the quality control purpose. After moisture curing of two weeks, a square section of 4 × 4 in. area x 1
in. thickness was cut perpendicularly to the top surface of each cylinder by following the instructions
from the PennDOT Material Lab. One surface of each sample was prepared for the linear traverse
21
method as described in ASTM C 457. Microscopical scanning was conducted on the prepared surface of
the sample to characterize the air void system using the automatic system “RapidAir 457”. For each
mixture, two samples were analyzed and the results of these two samples were then averaged.
3.3 Thermography Testing Procedure
Thermography tests were conducted on normal concrete specimens in both fresh and hardened states.
Sieved concrete and mortar were only assessed using thermography in the hardened state since the focus
of this research project was on normal concrete. Infrared camera and halogen lamps were used for the
thermography tests. The infrared camera used for this research is model P660 equipped with 45 degree
wide angle lens manufactured by FLIR systems Inc. The thermal sensitivity of this infrared camera is
less than 0.045 °C (0.081 °F) and its minimum focus distance is 0.3 m. The resolution of the thermal
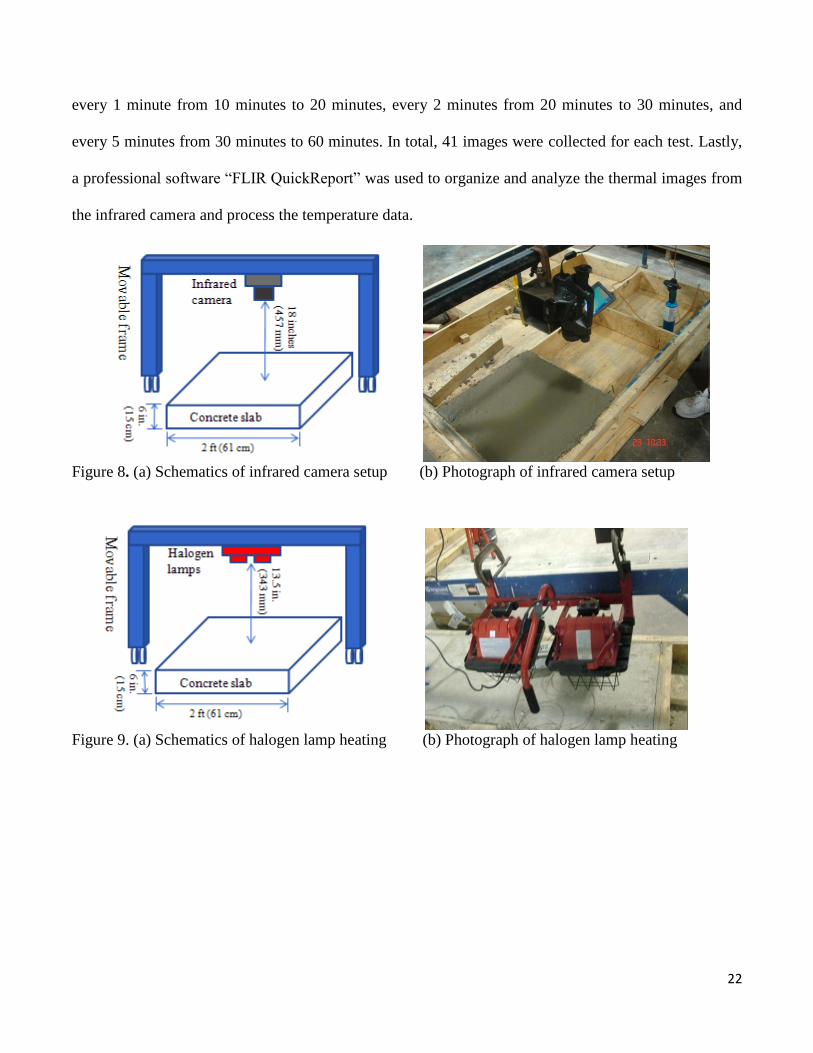
image obtained by this camera is 480 × 640. The infrared camera was mounted to a movable steel frame
as shown in Figure 8. The infrared camera was placed perpendicular to the concrete slab 18 inches from
the slab surface. Figure 9 shows a schematic and photograph of the setup for the 800 W halogen lamps
which were also mounted to the same steel frame used for thermal camera. The light radiated from the
halogen lamps was perpendicular to the concrete slab. The distance between the halogen lamps and
concrete slab surface was approximately 13.5 inches. After the halogen lamps and infrared camera were
positioned, the halogen lamps were placed above the center of the slab and turned on. The slab was then
heated for 40 minutes. Based on trial tests conducted previously, it was found that 40 minutes is the
minimum period of time to obtain sufficient thermal loading (∆T = 20 ºF). After the heating stage, the
infrared camera was quickly moved to the place where the halogen lamps were. Then, the cooling-down
process of the slab surface was observed and recorded using the infrared camera. Thermal images were
taken every 30 seconds until 10 minutes after the heat source was removed, then images were recorded
22
every 1 minute from 10 minutes to 20 minutes, every 2 minutes from 20 minutes to 30 minutes, and
every 5 minutes from 30 minutes to 60 minutes. In total, 41 images were collected for each test. Lastly,
a professional software “FLIR QuickReport” was used to organize and analyze the thermal images from
the infrared camera and process the temperature data.
Figure 8. (a) Schematics of infrared camera setup (b) Photograph of infrared camera setup
Figure 9. (a) Schematics of halogen lamp heating (b) Photograph of halogen lamp heating
23
Chapter 4. RESULTS AND ANALYSIS
4.1 Standard Testing Results
The air void parameters (fresh air content, hardened air content, specific surface and spacing factor) of
each specimen type obtained by ASTM standard tests (C231 and C457) are shown in Table 2. For each
concrete mixture, two samples were prepared for the determination of hardened air void parameters
(ASTM C 457). Averaged values are listed in Table 2. The difference between two specimens was
significantly small (less than 10 %). Sieved concrete with air entrainment (SA) has the highest fresh and
hardened air content and the lowest spacing factor. These results show that the spacing factor is
inversely proportional to the air content while the specific surface is proportional to the air content. The
fresh air content of the normal concrete with air entrainment was found to be 5.3 % which is in the target
range (6 + 1.5 %) specified by PennDOT. The air contents of all the mixtures were found to be different
with each other so that the correlations between the air content and thermography coefficient could be
made. The comparison between fresh and hardened air content of each mixture is shown in Figure 10. It
can be observed that for the most of mixtures, the air void contents measured in fresh and hardened state
are very consistent. Only in the case of mortar specimens, relatively larger differences (30 %) were
found.

24
Table 2. The air void results obtained by ASTM standard tests
Specimen
Type
Fresh air
content (%)
per ASTM C
231
Hardened specimens properties per ASTM C 457
Hardened Air
content (%)
Specific surface
(mm2/mm
3)
Spacing factor
(mm)
CA 5.3 5.15 67.21 0.079
SA 9.5 9.39 73.35 0.055
MA 6.2 8.16 75.39 0.071
CN 1.1 1.28 56.11 0.192
SN 1.0 1.49 50.39 0.237
MN 0.8 1.31 51.82 0.237
Figure 10. Comparison between fresh air content and hardened air content
Examples of microscopical images for different types of concrete mixtures are shown in Figure 11. They
were taken using the RapidAir 457 software which allows for automatic linear traverse method per
ASTM C 457. In these images, the black areas indicate aggregates and cement paste while the white
0
1
2
3
4
5
6
7
8
9
10
0 1 2 3 4 5 6 7 8 9 10
Ha
rden
ed a
ir c
on
ten
t (%
)
Fresh air content (%)
Non-Air entrained
Air entrained

25
areas identify air voids. It should be noted that the air entrained specimens have many small air voids
with the sizes on the order of 0.1 mm. In contrast, the specimens without air entrainment (eg. MN) have
only a few voids entrapped into the specimen during the mixing. Their sizes were found to be more than
1 mm. 0.3 mm is usually considered to be the threshold size to differentiate entrained air from entrapped
air (Pigeon and Pleau, 1995). As shown in Figure 11b, a section of a large aggregate with a diameter of
more than 10 mm can be clearly observed in the normal concrete. There are only small aggregates with
the sizes of approximately 2 mm found in the mortar specimens. These microscopical images help to
identify the different characteristics of air voids and aggregates in each mixture.
Figure 11. Microscopical images for different specimens (using RapidAir 457)
26
4.2 Thermography Testing Results
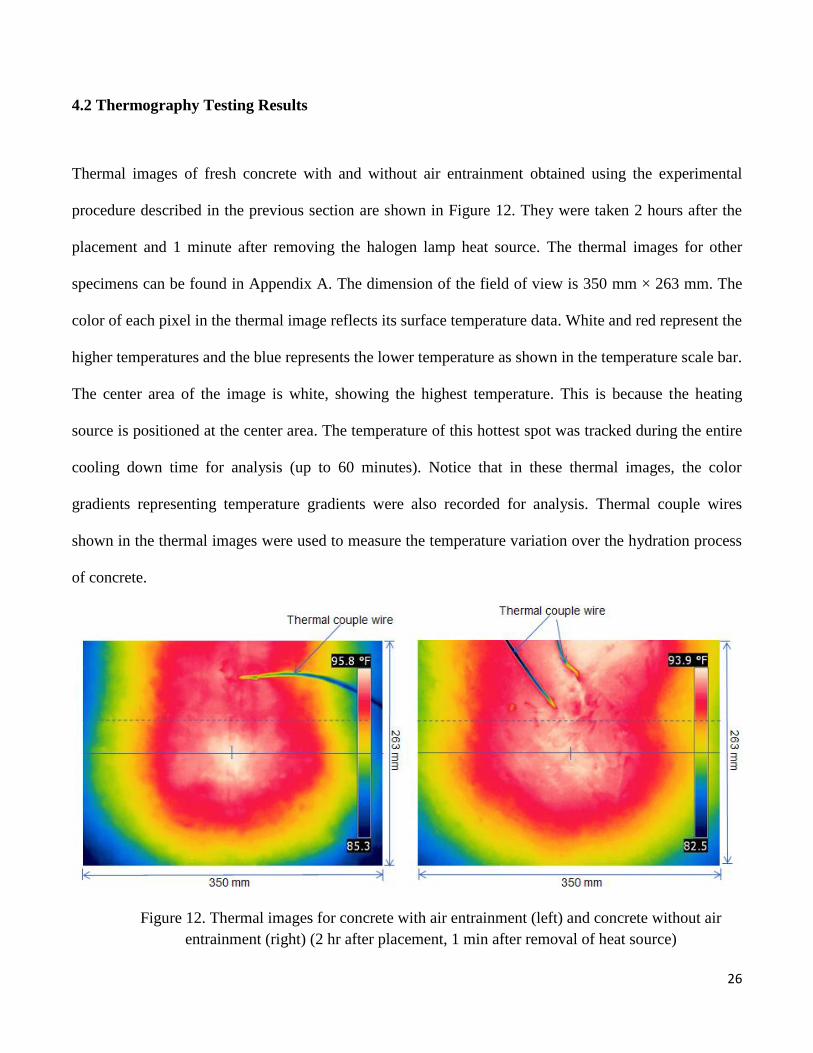
Thermal images of fresh concrete with and without air entrainment obtained using the experimental
procedure described in the previous section are shown in Figure 12. They were taken 2 hours after the
placement and 1 minute after removing the halogen lamp heat source. The thermal images for other
specimens can be found in Appendix A. The dimension of the field of view is 350 mm × 263 mm. The
color of each pixel in the thermal image reflects its surface temperature data. White and red represent the
higher temperatures and the blue represents the lower temperature as shown in the temperature scale bar.
The center area of the image is white, showing the highest temperature. This is because the heating
source is positioned at the center area. The temperature of this hottest spot was tracked during the entire
cooling down time for analysis (up to 60 minutes). Notice that in these thermal images, the color
gradients representing temperature gradients were also recorded for analysis. Thermal couple wires
shown in the thermal images were used to measure the temperature variation over the hydration process
of concrete.
Figure 12. Thermal images for concrete with air entrainment (left) and concrete without air
entrainment (right) (2 hr after placement, 1 min after removal of heat source)

27
Two types of analysis on these thermal images were carried out. First, the thermal images were analyzed
by tracking temperature as a function of the cool-down time at the spots marked by the cross-hairs.
Figure 13 shows a comparison of the surface cool-down process for fresh concrete with and without air
entrainment. It can be observed that the concrete with air entrainment (CA) consistently reached a higher
temperature than the concrete without air entrainment (CN) after the same period of heating time. It is
assumed that this phenomenon is related to the fact that the heat capacity of air is much higher than the
other solid materials, such as aggregates and cement paste. Thus, the air voids in concrete act as heat
accumulators keeping more heat in reserve. However, the overall cool-down trends were found to be
very similar. The similarities are also observed in all the plots for the other specimens (shown in
Appendix B). Therefore, tracking the temperature of a single point over the cool-down time may not be
sufficient for identifying significant changes in the air void system.
Figure 13. Slab surface cool-down at the hottest spot for fresh concrete with and without air entrainment
A second type of thermal analysis was carried out taking advantage of the infrared camera’s capabilities
of providing the temperature field over a surface area. A comparison of the spatial thermal gradients
75
80
85
90
95
100
0 10 20 30 40 50 60
Tem
pe
ratu
re (°F
)
Cooling down time (min)
Fresh concrete with air entrainment (CA)
Fresh concrete without air entrainment (CN)

28
along a line crossing the hottest spot of thermal images for fresh normal concrete with air entrainment
(CA) and fresh normal concrete without air entrainment (CN) is shown in Figure 14. Results for the
cool-down process at 1, 5, 10 and 60 minutes are presented. Each data point represents one pixel from
the line marked in the thermal images. As can be observed, there is a significant difference in the
thermal gradients of the concrete with air entrainment (CA) and the concrete without air entrainment
(CN) at any cool-down time. This visible difference was observed not only for the fresh concrete
specimens, but also for hardened concrete, sieved concrete and mortar (The results are shown in
Appendix C).
Figure 14. Spatial thermal gradient along the center line for fresh concrete with air entrainment and
concrete without air entrainment after heat source was removed for 1 min, 5 min, 10 min, 60 min
These differences could be attributable to the different thermal conductivities of the concrete with and
without air entrainment. It is hypothesized that after the heating source was removed, the heat absorbed

29
by the slab surface started to be dissipated by both heat conduction over the surface and convection with
the air. The heat convection depends on the convection heat transfer coefficient of the air and the
temperature difference between the concrete slab surface and the air. Thus, when the specimens are all
tested in the same environment, the temperature differences are very similar, the effect of heat
convection is not very significant. Therefore, heat conduction over the slab surface dominates the heat
dissipation process. As was discussed previously, the concrete slabs with and without air entrainment
showed a similar temperature change over time (Figure 13), thus their rates of heat transfer are similar.
Based on Fourier’s Law (Equation 1), for a given rate of heat transfer and a given surface area
perpendicular to the direction of heat transfer, the thermal gradient is inversely proportional to the heat
conductivity of the material. Because the heat conductivity in air voids is lower than in a solid material,
the heat conductivity of the concrete slab with air entrainment is also expected to be lower than that of
the concrete slab without air entrainment. Therefore, the thermal gradient of the concrete slab with air
entrainment should be larger than that of the concrete slab without air entrainment, as was captured by
the thermal analysis conducted (Figure 14).
The thermal spatial gradients shown in Figure 14 for fresh concrete with and without air entrainment
appear skewed, thus an effort was made to quantify their differences. Since that the thermal gradient
curves look like parabolas, quadratic polynomials were curve-fitted to the thermal gradients. They
correlated well to the data because their R square values are close to 1. Then, the fit equations for the
temperature gradients were derived. In the case of fresh concrete with air entrainment at 5 minute cool-
down time, the fit equation is expressed as follows:
T (x) = – 0.000180 x2 + 0.0633 x + 84.46
Where T (x) is temperature and x is position along the line.

30
And in the case of fresh concrete without air entrainment at 5 minute cool-down time, the fit equation
was expressed as follows:
T (x) = – 0.000147 x2 + 0.0532 x + 83.27
where T (x) is temperature and x is position along the line.
From these two equations, it should be noted that the fit coefficients for first and second order terms of
the quadratic polynomial for fresh concrete with air entrainment are larger than those for fresh concrete
without air entrainment. This difference could also be found for other mixture types and at other cool-
down times. Fit coefficient for second order terms of the quadratic polynomial can represent the slope of
the fit curve, which shows the spatial thermal gradients. Therefore, a second-order fit coefficient was
defined as a thermography coefficient to be further investigated. Table 3 presents thermography
coefficients for each specimen evaluated at different cool-down times. To investigate the sensitivity of
the thermography coefficients to the line position, another line in the thermal images for fresh concrete
with and without air entrainment (marked by a dashed line in Figure 12) was selected to derive
thermography coefficients. The second line is located 35.6 mm (13.5% of the total length of the image)
above the first line. A comparison of thermography coefficients derived from the two lines is shown in
Table 4. It can be observed that the variation of the thermography coefficients between two different
lines is within 10%, which is very small. Thus, the thermography coefficient can still be accurately
determined even if human error occurs when selecting the line crossing the hottest spot.
31
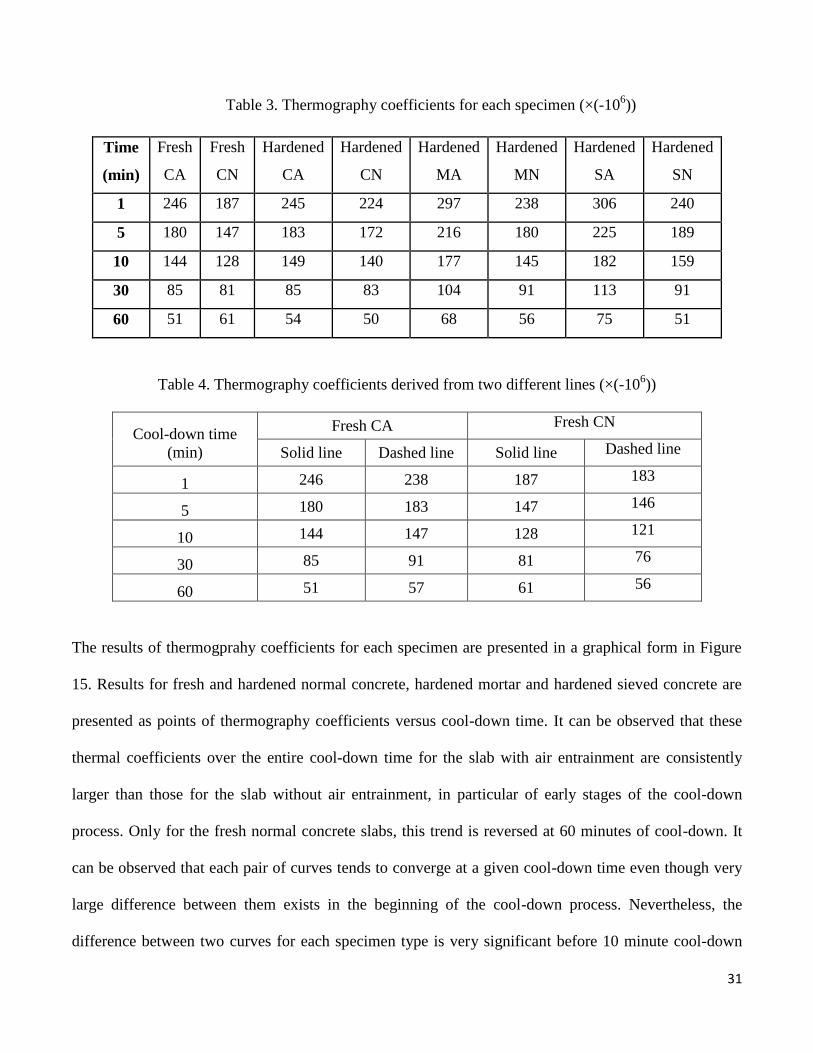
Table 3. Thermography coefficients for each specimen (×(-106))
Time
(min)
Fresh
CA
Fresh
CN
Hardened
CA
Hardened
CN
Hardened
MA
Hardened
MN
Hardened
SA
Hardened
SN
1 246 187 245 224 297 238 306 240
5 180 147 183 172 216 180 225 189
10 144 128 149 140 177 145 182 159
30 85 81 85 83 104 91 113 91
60 51 61 54 50 68 56 75 51
Table 4. Thermography coefficients derived from two different lines (×(-106))
Cool-down time
(min)
Fresh CA Fresh CN
Solid line Dashed line Solid line Dashed line
1 246 238 187 183
5 180 183 147 146
10 144 147 128 121
30 85 91 81 76
60 51 57 61 56
The results of thermogprahy coefficients for each specimen are presented in a graphical form in Figure
15. Results for fresh and hardened normal concrete, hardened mortar and hardened sieved concrete are
presented as points of thermography coefficients versus cool-down time. It can be observed that these
thermal coefficients over the entire cool-down time for the slab with air entrainment are consistently
larger than those for the slab without air entrainment, in particular of early stages of the cool-down
process. Only for the fresh normal concrete slabs, this trend is reversed at 60 minutes of cool-down. It
can be observed that each pair of curves tends to converge at a given cool-down time even though very
large difference between them exists in the beginning of the cool-down process. Nevertheless, the
difference between two curves for each specimen type is very significant before 10 minute cool-down

32
time. Therefore, 10 minutes cool-down time could be set as a time limit for this thermography method to
characterize the concrete air void system in fresh and hardened state, in particular the presence of air
entrainment can be determined.
Figure 15. Plots of thermography coefficient as a function of cool down time for fresh normal concrete
(left top), hardened normal concrete(right top), hardened mortar (left bottom) and hardened sieved
concrete (right bottom)
4.3 Correlations between Thermography Results and Standard Testing Results
The air void parameters for each mixture were determined in fresh state and hardened state by standard
testing methods. Thermography tests were conducted on normal concrete, mortar and sieved concrete
which have different air void parameters. Thus, thermography coefficients at 1 minute and 10 minutes of
cool-down time were plotted as a function of air content in Figure 16. It can be observed in both 1

33
minute and 10 minutes curves that increasing air content leads to an increase of the thermography
coefficient. Good correlations were found for those specimens with air contents larger than 5%. For the
normal air entrained concrete, the two data points at 1 min and 10 min of cool-down time in fresh and
hardened state are very close. It was found that for an air content in the range of 6 ± 1.5% as per
PennDOT specifications, the corresponding range of the thermography coefficient at 1 minute of cool-
down, is between 240 and 280 × (-106). Therefore, the air content of concrete can be indirectly
determined by evaluating its thermography coefficient at a certain cool-down time using this
thermography test procedure.
Figure 16. Correlation between air content and thermography coefficient
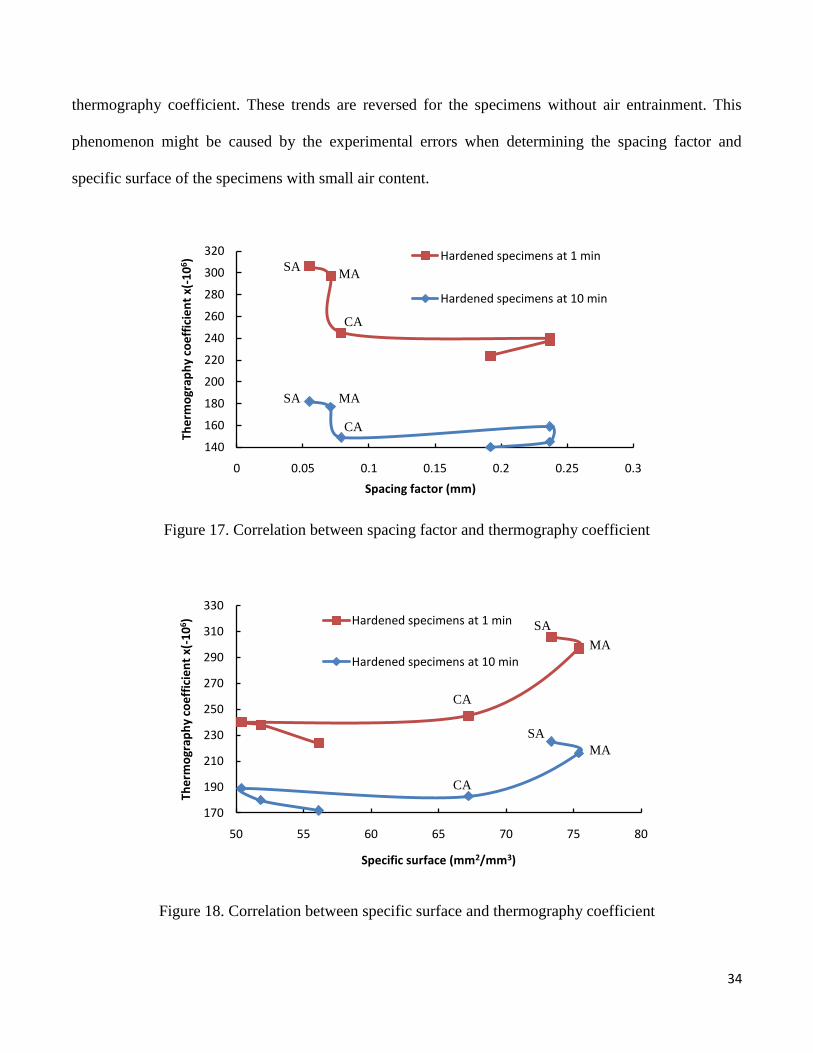
Figure 17 presents the correlation between spacing factor and thermography coefficient, and Figure 18
shows the correlation between specific surface and thermography coefficient. These two correlations are
not strong as the total air content. For the specimens with air entrainment, the spacing factor increases
with the decrease of the thermography coefficient while the specific surface increases with the
120
150
180
210
240
270
300
330
0 1 2 3 4 5 6 7 8 9 10
The
rmo
grap
hy
coe
ffic
ien
t x(
-10
6)
Air content (%)
Hardened specimens at 1min
Fresh specimens at 1min
Hardened specimens at 10 min
Fresh specimens at 10 min
Acceptable air content
range (PennDOT)
CA
MA SA
CA MA SA
34
thermography coefficient. These trends are reversed for the specimens without air entrainment. This
phenomenon might be caused by the experimental errors when determining the spacing factor and
specific surface of the specimens with small air content.
Figure 17. Correlation between spacing factor and thermography coefficient
Figure 18. Correlation between specific surface and thermography coefficient
140
160
180
200
220
240
260
280
300
320
0 0.05 0.1 0.15 0.2 0.25 0.3
The
rmo
grap
hy
coe
ffic
ien
t x(
-10
6 )
Spacing factor (mm)
Hardened specimens at 1 min
Hardened specimens at 10 min
170
190
210
230
250
270
290
310
330
50 55 60 65 70 75 80
The
rmo
grap
hy
coe
ffic
ien
t x(
-10
6 )
Specific surface (mm2/mm3)
Hardened specimens at 1 min
Hardened specimens at 10 min
CA
MA SA
CA
MA SA
CA
MA
SA
CA
SA
MA

35
4.4 Hydration Temperature Measurement
To investigate the effect of the heating on concrete’s hydration, temperature variation of fresh concrete
with air entrainment over hydration time was monitored by inserting thermocouples into the concrete
slabs. Temperatures at four different locations of a slab (center inside, center surface, corner inside,
corner surface) were measured. The results are shown in Figure 19. It can be observed that the
temperature inside the concrete slab is higher than on the surface. The temperature at the center is higher
than at the corner. There is a peak between 2 and 3 hours, which is caused by the heating process during
the thermography testing. The temperature curve of corner inside is the least affected by the heating
process because its location is the furthest from the heating source. Comparing the curve of center
surface with the curve of corner inside, the trends of these two curves are very similar when connecting
the two dots at the beginning and end of the peak. In other words, the trend of the hydration curve does
not change after the peak, indicating that the heating process during the thermography test does not
significantly affect the concrete’s hydration.
Figure 19. Temperature variation over hydration time for concrete with air entrainment
70
80
90
100
110
0 2 4 6 8 10
Tem
pe
ratu
re (°F
)
Hydration time (h)
Center inside
Center surface
Corner inside
Corner surface

36
4.5 Supplemental Measurement
It was earlier stated that thermography is an excellent method for detecting defects. This is demonstrated
in Figure 20, which shows thermal images of a concrete slab. Within this slab a spherical air void, which
is a 1 in. diameter ping pong ball, was located 0.5 in. below the top surface. The left image in Figure 20
was taken during the fresh state without an external heat source. The right image in Figure 20 was taken
during the cooling down process after heating the surface for 30 minutes with a halogen lamp. In both
images, the air void is clearly visible, suggesting that thermography could be used to identify entrapped
air voids near the surface of a freshly placed slab.
Figure 20. Thermal images of a subsurface air void under ambient conditions and no external heat
source (left) 1 min after removal of external heat source (right)
1 in. circle 1 in. circle

37
Chapter 5. CONCLUSIONS AND RECOMMENDATIONS
The initial steps in the development of a new methodology using impulse thermography were achieved
to measure the air content in fresh and hardened concrete. The development of this new methodology
relies on the fact that the air entrainment affects concrete heat conductivity. It was found that concrete
slabs with and without air entrainment have different surface signature thermal patterns which were
captured by an infrared camera. Tracking the temperature of a single point over the cool-down time was
not sufficient for identifying significant changes in the air void system. However, the analysis of the
temperature field over a surface area was able to distinguish concrete with air entrainment from concrete
without it. Thermography coefficient, defined as the slope of thermal gradients on the surface of
concrete specimen, was found to be proportional to the total air content. In particular, this correlation
between thermography coefficients and total air contents was good for the air entrained concrete
specimens. Thus, this thermography methodology can be used to determine the total air content of
concrete by measuring the thermography coefficient. If the required air content range is known, the
corresponding thermography coefficient range could be established for the onsite quality control
procedure. It was also found that to effectively measure thermography coefficients, data needs to be
collected within 10 minutes of the cooling down process. However, the correlations between
thermography coefficients and other air void parameters (spacing factor and specific surface) were not
conclusive. It is still believed that this new thermography methodology has the potential for the
characterization of the air void system in fresh concrete in the field.
To further validate the findings from this study, more experimental data would help to assess the
repeatability and reliability of this new methodology. To find the correlations between the derived
thermography coefficients and other air void parameters (spacing factor and specific surface), finite

38
element simulation of heat conduction in concrete with different air void parameters needs to be
conducted to investigate how the distribution and size of the air voids in concrete affect the surface
thermal patterns that can be imaged by this thermography methodology. Then, experimental testing
would also be needed to verify the modeling results. To evaluate the field implementation of this
methodology, some environmental effects (such as wind, high or low environmental temperature) should
be studied by conducting tests under different environments. In addition, the initial and final setting time
of fresh concrete tested using this methodology needs to be measured to further investigate the effect of
the heating on its hydration process.

39
REFERENCES
ASTM C 138 (2008). “Standard Test Method for Unit Weight, Yield, and Air Content (Gravimetric) of
Concrete.” American Society for Testing and Materials, West Conshohocken, Pennsylvania.
ASTM C 173 (2008). “Standard Test Method for Air Content of Freshly Mixed Concrete by the
Volumetric Method.” American Society for Testing and Materials, West Conshohocken, Pennsylvania.
ASTM C 231 (2008). “Standard Test Method for Air Content of Freshly Mixed Concrete by the
Pressure Method.” American Society for Testing and Materials, West Conshohocken, Pennsylvania.
ASTM C 457 (2008). “Standard Test Method for Microscopical Determination of Parameters of the Air
void System in Hardened Concrete.” American Society for Testing and Materials, West Conshohocken,
Pennsylvania.
Ansari, Farhad, Zhijun Zhang, Patrick Szary and Ali Maher (2002). “Effects of Synthetic Air Entraining
Agents on Compressive Strength of Portland Cement Concrete-Mechanism of Interaction and
Remediation Strategy.” FHWA-NJ-2002-025, Federal Highway Administration.
Brown, J.R., H.R. Hamilton (2004). “NDE of fiber-reinforced polymer composites bonded to concrete
using IR thermography.” Proceedings of the SPIE, 5405(1), 414-24.
Clark, M.R, D.M. McCann, M.C. Forde (2003). “Application of infrared thermography to the non-
destructive testing of concrete and masonry bridges.” NDT&E International, 36(4), 265–275.
Desai, D. H., Tikalsky, P. J., and Scheetz, B. E. (2007). “Hardened Air in Concrete Roadway Pavements
and Structures.” Report No. FHWA-PA-2007-002-510401-06, Pennsylvania Transportation Institute,
University Park, PA.

40
Distlehorst, J. A., and G. J. Kurgan (2007). “Development of Precision Statement for Determining Air
Void Characteristics of Fresh Concrete with Use of Air Void Analyzer.” Transportation Research
Record, 2020, 45-49.
Germann Instruments, Inc. (2008). “ http://www.germann.org.” accessed in October, 2008.
Grove, Jim, Bob Steffes, Mark A. Wilk (2006). “Using the Air Void Analyzer for Real-Time Quality
Control Adjustment in the field.” CP Tech Center, Iowa State University, Ames, IA.
Han, Xiaoyan, Jianping Lub, Md. Sarwar Islama, Wei Lia, Zhi Zenga (2005). “Sonic infrared imaging
NDE.” Proceedings of the SPIE, Bellingham, WA, Vol. 5765.
Hover, Ken. (2002). “Air in Concrete: How Come and How Much?” Concrete Construction-World of
Concrete, 47(12), 57-61.
http://www.ndt-ed.org. accessed in December, 2009.
Kosmatka, Steven H., Beatrix Kerkhoff, William C. Panarese (2002). “Design and Control of Concrete
Mixtures.” 14th edition, Portland Cement Association, Skokie, Illinois, USA.
Landis, E. N., and D. J. Corr (2008). “Three Dimentional Analysis of Air Void Systems in Concrete.”
Proceedings of Measuring, Monitoring and Modeling Concrete Properties, Part 6, 517–524.
Litvan, G.G (1978). “Freeze-Thaw Durability of Porous Materials.” Durability of Building Materials
and Components: Proceedings of the First International Conference, ASTM STP 691, 455-463.
Lopez, Maria de Murphy, Cliff Lissenden, Chao Xiao, Sheng Li (2009). “Technology Evaluation on
Characterization of the Air Void System in concrete.” PSU-WO-20: Final report to PennDOT.

41
Maierhofer, Ch., A. Brink, M. Rolling, H. Wiggenhauser (2003). “Detection of shallow voids in
concrete structures with impulse thermography and radar.” NDT&E International, 36, 257–263.
Maierhofer, Ch., R. Arndt, M. Rollig (2007). “Influence of concrete properties on the detection of voids
with impulse-thermography.” Infrared Physics & Technology, 49, 213–217.
Mindess, S., Young J.F., Darwin D. (2003). “Concrete.” 2nd
edition, Upper Saddle River, NJ: Prentice
Hall.
Moran, Micheal J. and Howard N. Shapiro (2007). “Fundamentals of engineering thermodynamics.” 6th
edition, Wiley Press.
PennDOT Publication 408/PennDOT Specifications, Commonwealth of Pennsylvania Department of
Transportation, Harrisburg, Pennsylvania, USA, 2007.
Pigeon M., and Pleau R. (1995). “Durability of Concrete in Cold Climates.” London: E & FN Spon.
Powers, T.C. (1945). “A Working Hypothesis for Further Studies of Frost resistance of Concrete.” ACI
Journal, Proceedings, vol. 41, no. 4, pp. 245–272.
Powers, T.C. and R.A. Helmuth (1953). “Theory of Volume Changes in Hardened Portland Cement
Paste During Freezing.” Research and Developments Laboratories of the Portland Cement Association,
Research Department Bulletin 46, Proceedings of the Highway Research Board, vol. 32, pp. 285–297,
RX 046.
Rose, J. L. (1999). “Ultrasonic Waves in Solid Media.” 2nd
edition, Cambridge Press.
Rupnow, Tyson D., Kejin Wang, and Vernon R. Schaefer (2008). “Effect of Sampling Location on the
Air Void Analyzer Test Results on Concrete Pavements.” Journal of Testing and Evaluation, Vol. 36,
No. 4.

42
Sakagami, T., S. Kubo , Y. Teshima (2000). “Fatigue crack identification using near-tip singular
temperature field measured by lock-in thermography.” Proceedings of the SPIE, 4020, 174-81.
Sham, F.C, Nelson Chen, Liu Long (2008). “Surface crack detection by flash thermography on concrete
surface.” Insight: Non-Destructive Testing and Condition Monitoring, 50(5), 240-243.
Spiro, Irving J. and Monroe Schlessinger (1994). “Infrared technology fundamentals.” CRC Press.
Sutter, L. L. (2007). “Evaluation of Methods for Characterizing Air Void Systems in Wisconsin Paving
Concrete.” WisDOT SPR# 0092-03-16, WHRP 07-05, Michigan Technological University, Wisconsin
Department of Transportation, Federal Highway Administration.
Tikalsky, Paul J. (2007). “Hardened Air in Concrete Roadway and Structures.” DTRS99-G-003,
Pennsylvania Department of Transportation.
Wiese, D., M.D. Thomas, M. Thornton and D. Peng (2000). “A new method of air void analysis for
structural concrete.” Proceedings of the 22nd International Conference on Cement Microscopy,
International Cement Microscopy Association, Metropolis, IL, pp. 389-398.
Yang, B.b, P.K Liaw, H. Wang, J.Y Huang, R.C Kuo, J.G Huang (2003). “Thermography: A New
Nondestructive Evaluation Method in Fatigue Damage.” JOM, 55(1).

43
Appendix A: Thermal Images
*These were taken at 1 minute after the removal of heat source.
Thermal images for hardened CA (left) and CN (right)
Thermal images for hardened SA (left) and SN (right)

44
Thermal images for hardened MA (left) and MN (right)
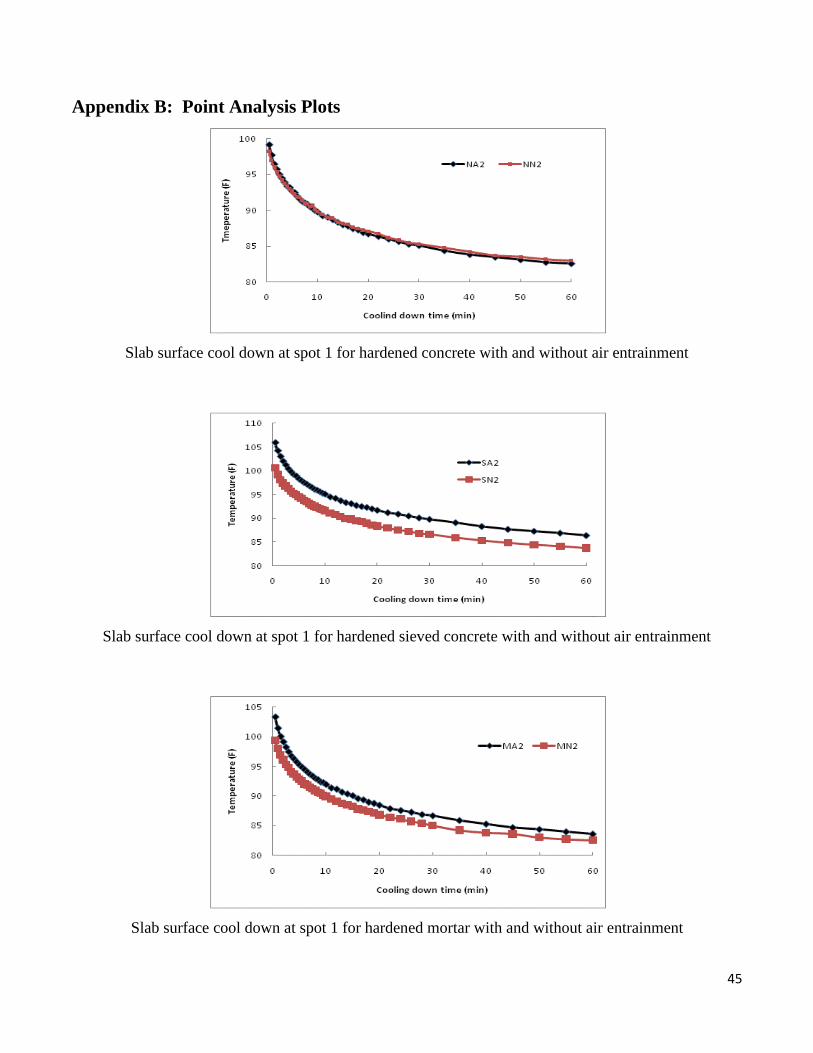
45
Appendix B: Point Analysis Plots
Slab surface cool down at spot 1 for hardened concrete with and without air entrainment
Slab surface cool down at spot 1 for hardened sieved concrete with and without air entrainment
Slab surface cool down at spot 1 for hardened mortar with and without air entrainment

46
Appendix C: Line Analysis Plots
Spatial thermal gradient along line 1 for hardened concrete with air entrainment and concrete without air
entrainment after heat source was removed for 1 min, 5 min, 10 min, 60 min

47
Spatial thermal gradient along line 1 for hardened sieved concrete with air entrainment and concrete
without air entrainment after heat source was removed for 1 min, 5 min, 10 min, 60 min
Spatial thermal gradient along line 1 for hardened mortar with air entrainment and concrete without air
entrainment after heat source was removed for 1 min, 5 min, 10 min, 60 min