characterization of planets: atmospheres (transits … of planets: atmospheres (transits results...
TRANSCRIPT

Characterization of Planets: Atmospheres(Transits Results Continued)
• Reflected Light: Albedo Measurements
• Radiated Light: Temperature
• In-transit and secondary eclipse spectroscopy: AtmosphericFeatures
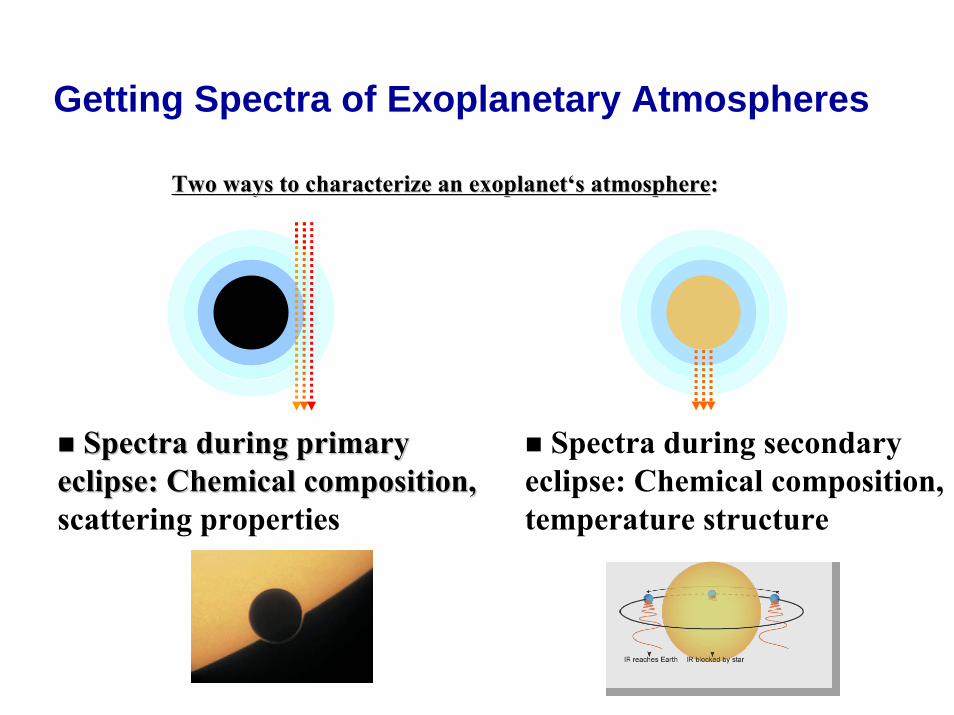
SpectraSpectra duringduring primaryprimaryeclipseeclipse: : ChemicalChemical compositioncomposition, , scattering properties
Spectra during secondaryeclipse: Chemical composition, temperature structure
Getting Spectra of Exoplanetary Atmospheres
TwoTwo waysways to to characterizecharacterize an an exoplanetexoplanet‘‘ss atmosphereatmosphere::
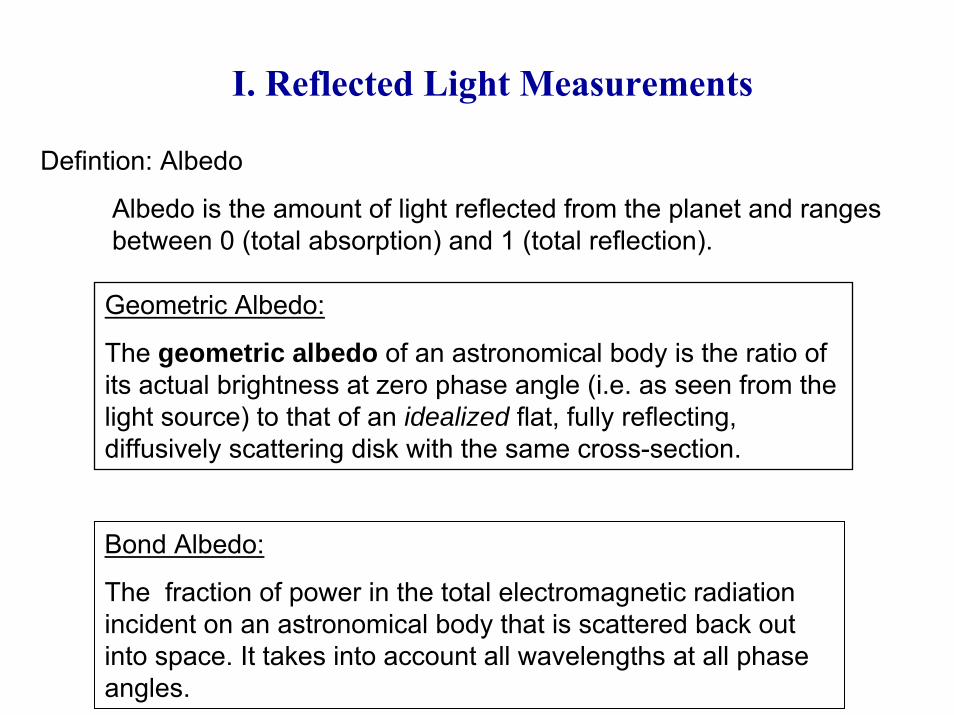
I. Reflected Light Measurements
Defintion: Albedo
Albedo is the amount of light reflected from the planet and rangesbetween 0 (total absorption) and 1 (total reflection).
Geometric Albedo:
The geometric albedo of an astronomical body is the ratio of its actual brightness at zero phase angle (i.e. as seen from thelight source) to that of an idealized flat, fully reflecting, diffusively scattering disk with the same cross-section.
Bond Albedo:
The fraction of power in the total electromagnetic radiationincident on an astronomical body that is scattered back out into space. It takes into account all wavelengths at all phaseangles.
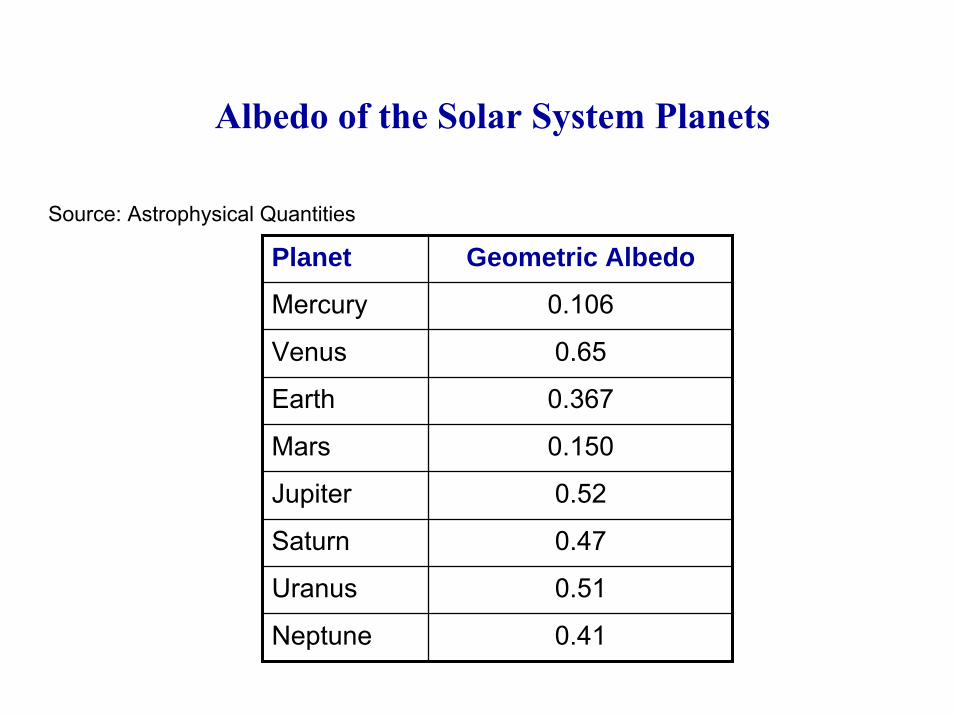
Albedo of the Solar System Planets
Source: Astrophysical Quantities
Planet Geometric Albedo
Mercury 0.106
Venus 0.65
Earth 0.367
Mars 0.150
Jupiter 0.52
Saturn 0.47
Uranus 0.51
Neptune 0.41

I. Reflected Light Measurements
4πd2Lstar = F = Flux from star
planet intercepts F × πR2 and reflects A × F x πR2
Where R is the planet radius
We do not measure the absolute light from the star, but reference thatthe brightness of the central star:
d
Reflected light = Lstar4πd2=
AR2
4d2AπR2Lstar 1
A = geometric albedo, R = planet radius, d = distance from star
For A = 0.1, d=0.05 AU, R = 1 RJup
Reflected light ≈ 10–5

I. Reflected Light Measurements
Star + planetStar
The planet reflects light, so one should see a modulation in the light curve, plus an eclipse of the planet

I. Reflected Light Measurements
Reflected light should be multiplied by a phase function, f(α), that dependson the orbital inclination
Variable: between 0 and maximum value
Constant: always ½ maximum possiblevalue
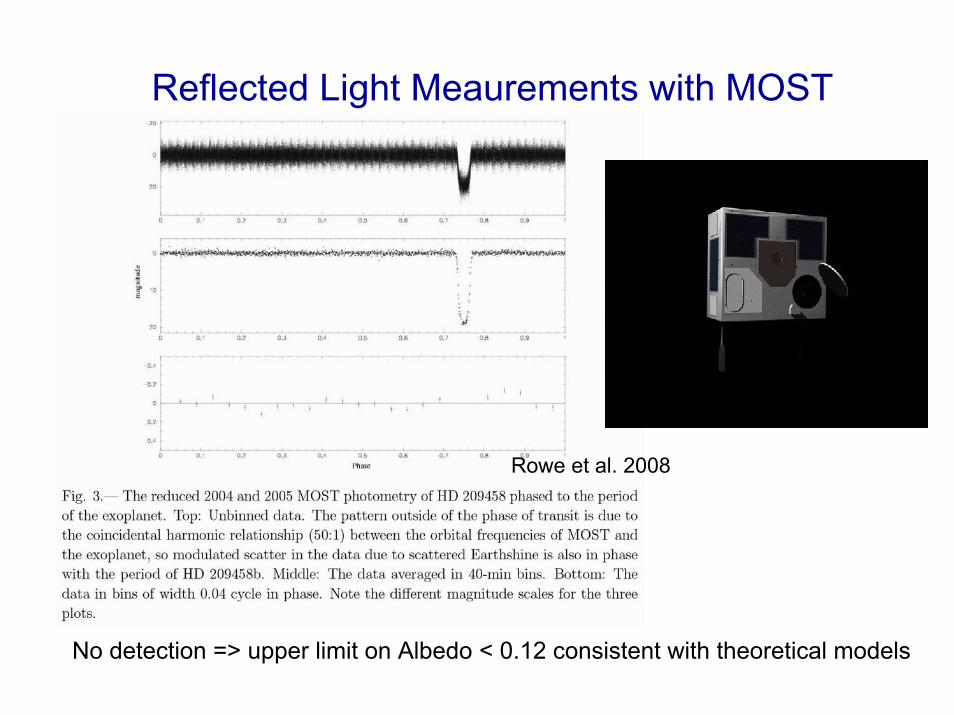
Rowe et al. 2008
Reflected Light Meaurements with MOST
No detection => upper limit on Albedo < 0.12 consistent with theoretical models

Normal Phase Variations of the planet
The planet is only 4 stellar radii from the star. Its gravitydistorts the star making itellipsoidal in shape. Thiscauses the so-calledellipsoidal variations
et al.
Ellipticity effect
An extreme case of an elliptical star
Kepler will do this for many planets!

At high temperatures, the detected light is a contribution of thereflected light and thermal emission:
Frefl + Ftherm + F0R = F0 is flux from starF0
R is the ratio of observed flux before the secondary transit and during the transit.
It is difficult to disentangle the effects of Albedo and thermal emission without color information
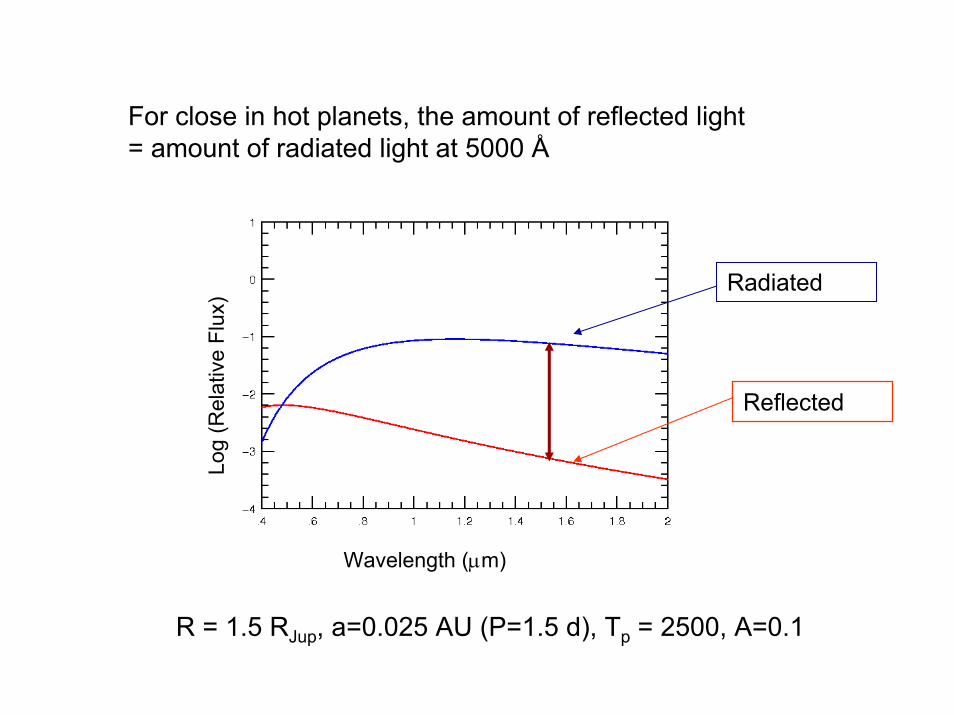
For close in hot planets, the amount of reflected light = amount of radiated light at 5000 Å
Wavelength (µm)
Log
(Rel
ativ
e Fl
ux)
Reflected
Radiated
R = 1.5 RJup, a=0.025 AU (P=1.5 d), Tp = 2500, A=0.1
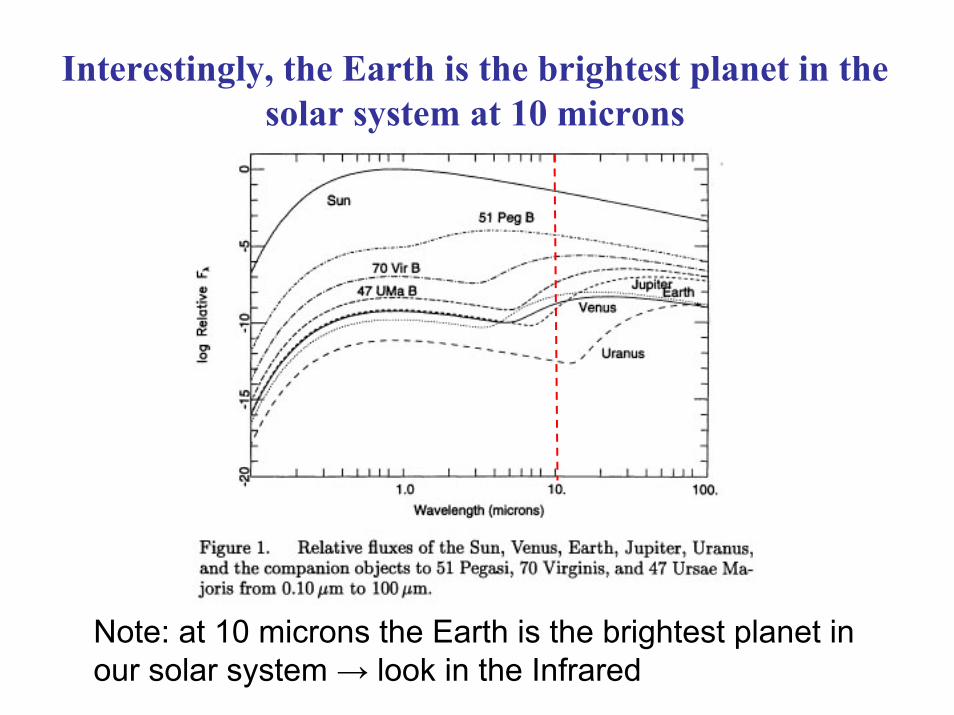
Interestingly, the Earth is the brightest planet in thesolar system at 10 microns
Note: at 10 microns the Earth is the brightest planet in our solar system → look in the Infrared
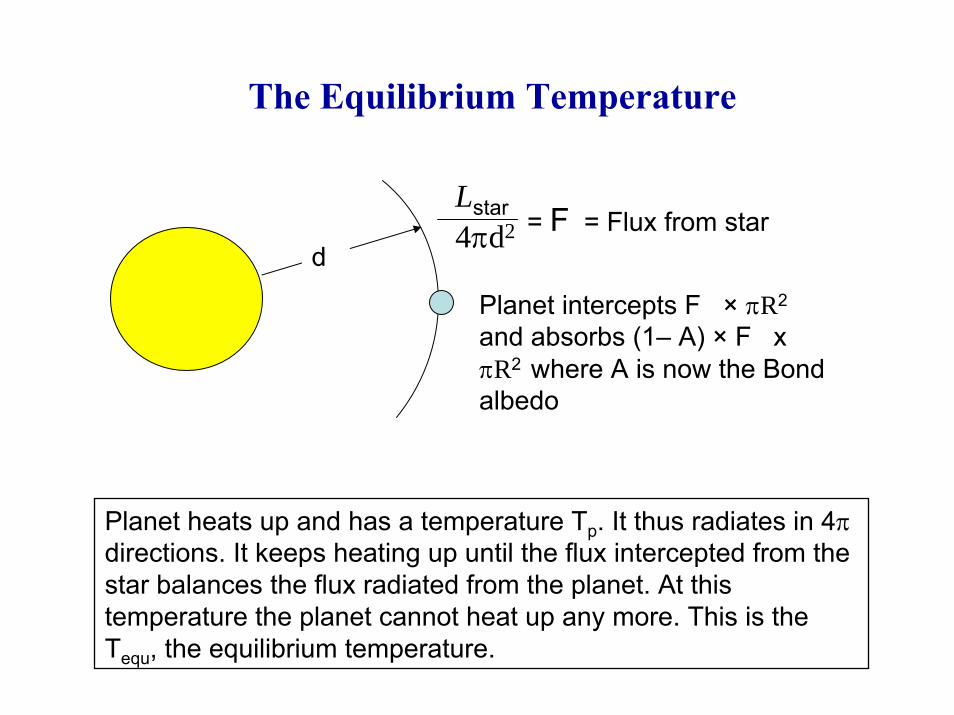
The Equilibrium Temperature
4πd2Lstar = F = Flux from star
Planet intercepts F × πR2
and absorbs (1– A) × F x πR2 where A is now the Bond albedo
d
Planet heats up and has a temperature Tp. It thus radiates in 4πdirections. It keeps heating up until the flux intercepted from thestar balances the flux radiated from the planet. At thistemperature the planet cannot heat up any more. This is theTequ, the equilibrium temperature.
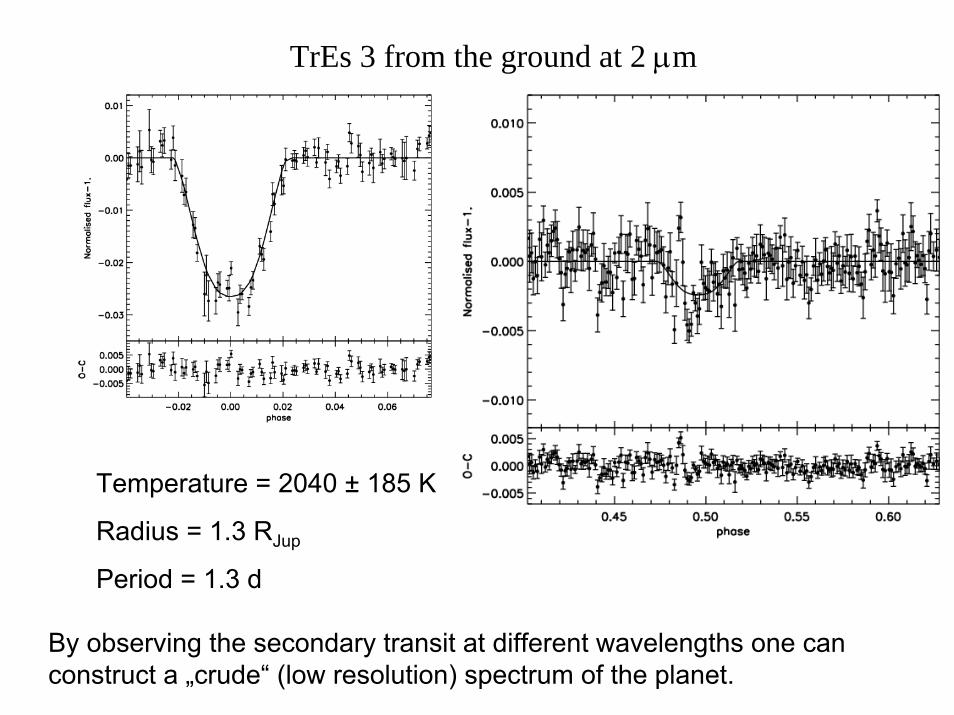
TrEs 3 from the ground at 2 µm
Temperature = 2040 ± 185 K
Radius = 1.3 RJup
Period = 1.3 d
By observing the secondary transit at different wavelengths one canconstruct a „crude“ (low resolution) spectrum of the planet.

Spitzer Measurements of Exoplanets
Spitzer is a 0.85m telescope thatcan measure infrared radiationbetween 3 and 180 µm


From The Astrophysical Journal 626(1):523–529.© 2005 by The American Astronomical Society.For permission to reuse, contact [email protected].
Crude (low-res) “spectroscopy”:
Fig. 3.— Solid black line shows the Sudarsky et al. (2003) model hot Jupiter spectrum divided by the stellar model spectrum (see text for details). The open diamonds show the predicted flux ratios for this model integrated over the four IRAC bandpasses (which are shown in gray and renormalized for clarity). The observed eclipse depths at 4.5 and 8.0 µm are overplotted as black diamonds. No parameters have been adjusted to the model to improve the fit. The dotted line shows the best-fit blackbody spectrum (corresponding to a temperature of 1060 K), divided by the model stellar spectrum. Although the Sudarsky et al. (2003) model prediction is roughly consistent with the observations at 8.0 µm, the model overpredicts the planetary flux at 4.5 µm. The prediction of a relatively large flux ratio at 3.6 µm should be readily testable with additional IRAC observations.
Predictedflux in bandpass(opentriangles)
Observedflux in bandpass(solid triangles)

Spitzer Measurements of Radiated Light at 8 µm of HD 189733
Knutson et al. 2007
Tmax = 1211 K
Tmin = 973 K
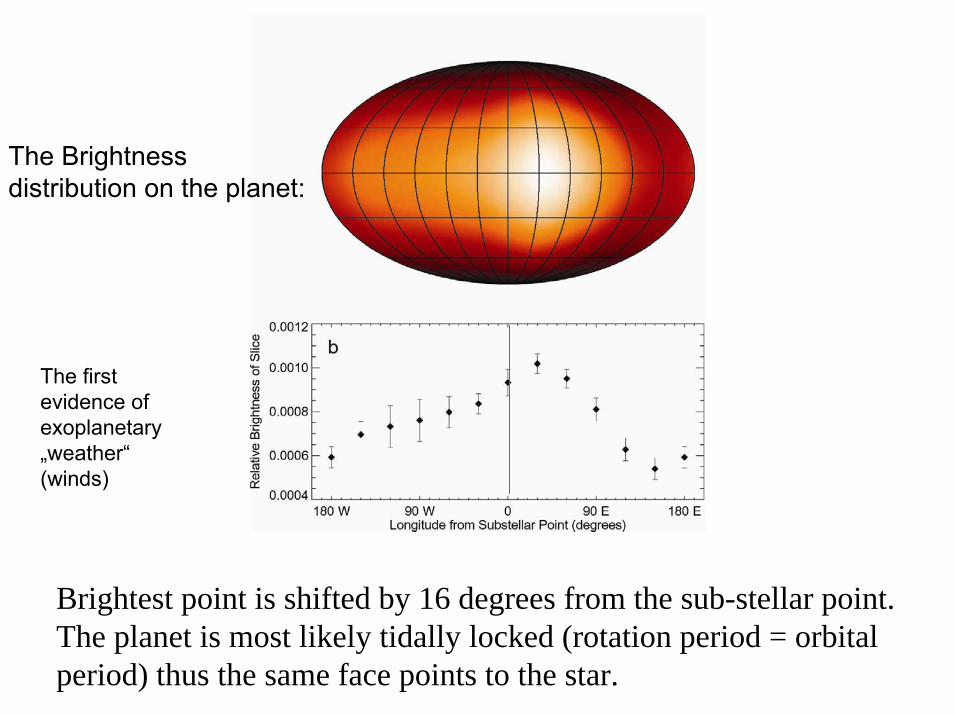
The Brightnessdistribution on the planet:
The firstevidence of exoplanetary„weather“ (winds)
Brightest point is shifted by 16 degrees from the sub-stellar point. The planet is most likely tidally locked (rotation period = orbital period) thus the same face points to the star.

GJ 436 (Hot Neptune) Spitzer measurements
Primary
Secondary
Radius = 4.33 ± 0.18 RE
Tp = 712 KEccentricity = 0.15
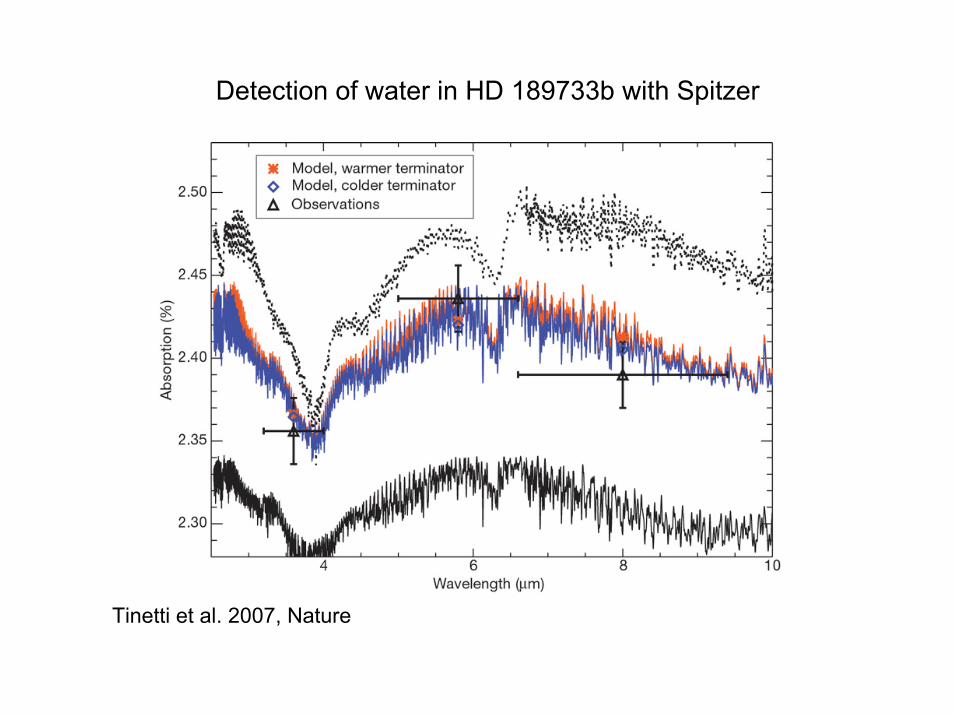
Detection of water in HD 189733b with Spitzer
Tinetti et al. 2007, Nature

Detection of water and Methane in HD 189733b with HST
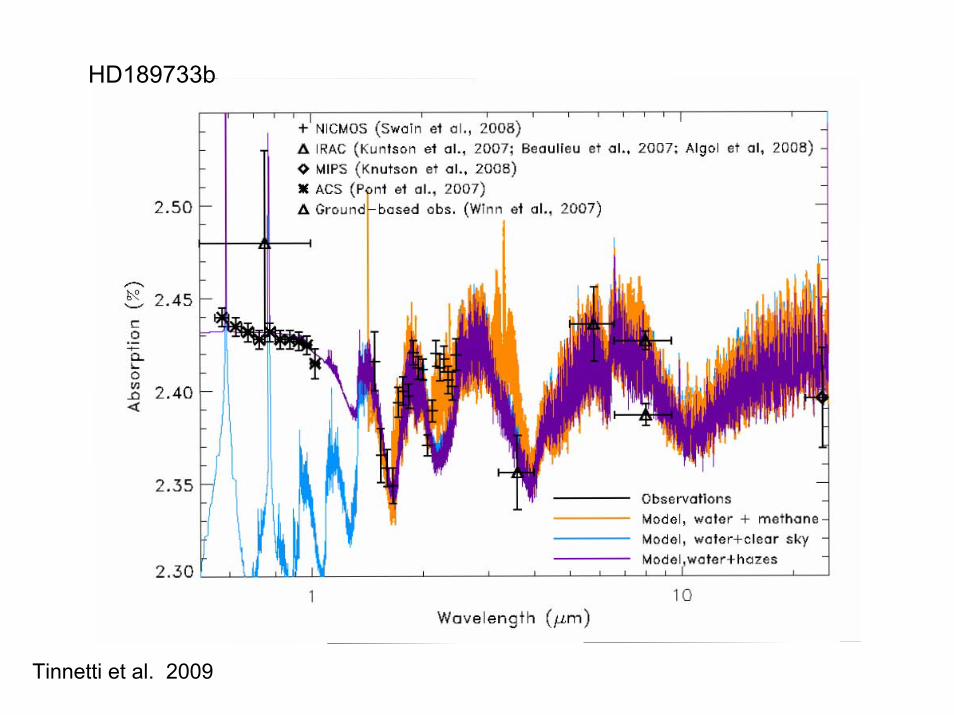
HD189733b
Tinnetti et al. 2009
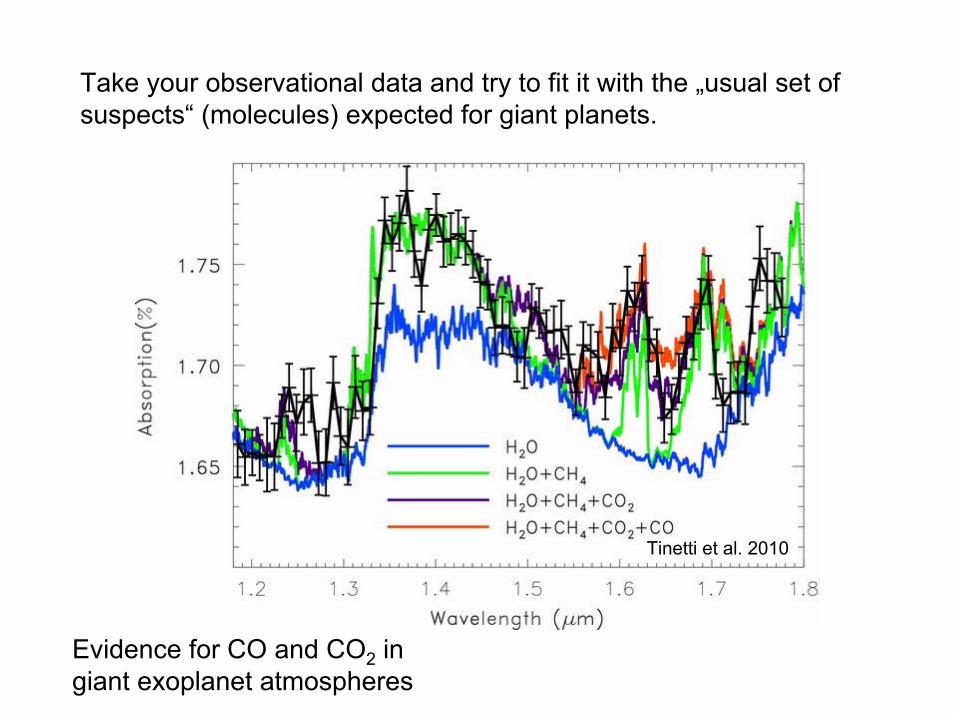
Take your observational data and try to fit it with the „usual set of suspects“ (molecules) expected for giant planets.
Tinetti et al. 2010
Evidence for CO and CO2 in giant exoplanet atmospheres

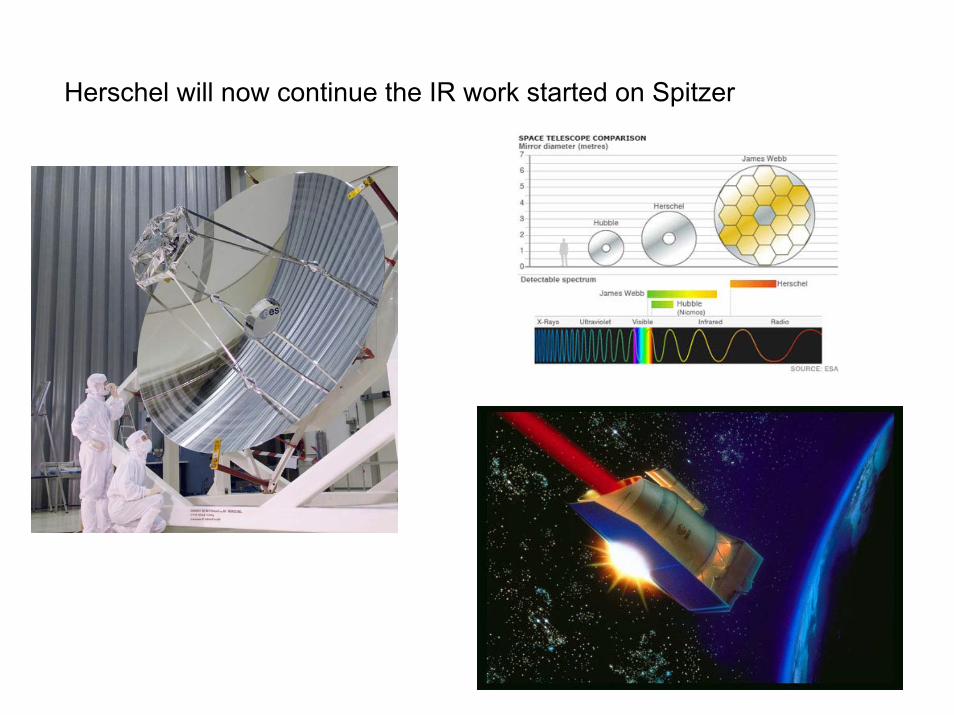
Herschel will now continue the IR work started on Spitzer
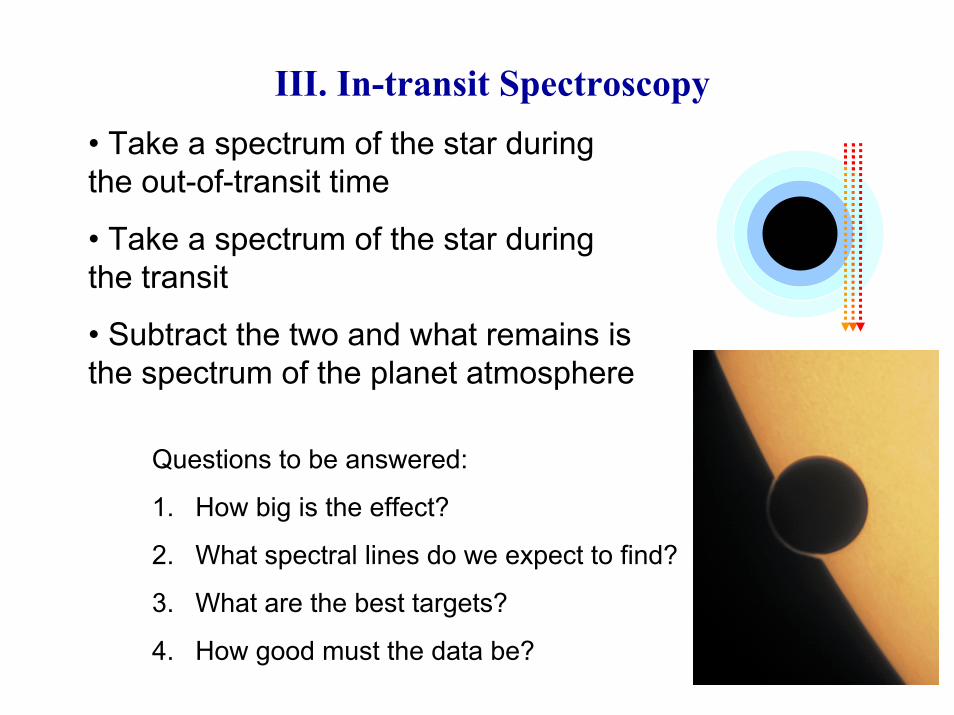
III. In-transit Spectroscopy• Take a spectrum of the star duringthe out-of-transit time
• Take a spectrum of the star duringthe transit
• Subtract the two and what remains isthe spectrum of the planet atmosphere
Questions to be answered:
1. How big is the effect?
2. What spectral lines do we expect to find?
3. What are the best targets?
4. How good must the data be?

δz Opacity of theupper ray goingthrough theplanetaryatmosphere isreduced by e–δz
Take the scaleheight, H, as thetypical size of theplanet atmoshere
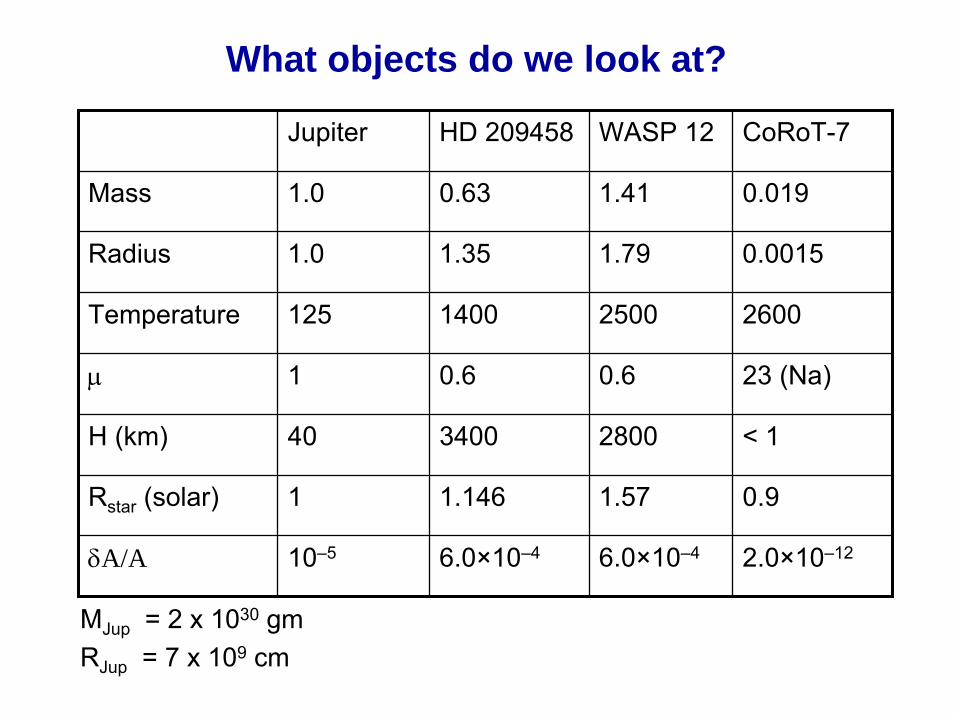
What objects do we look at?
Jupiter HD 209458 WASP 12 CoRoT-7
Mass 1.0 0.63 1.41
1.79
2500
0.6
H (km) 40 3400 2800 < 1
1.57
6.0×10⁻⁴
0.019
Radius 1.0 1.35 0.0015
Temperature 125 1400 2600
µ 1 0.6 23 (Na)
Rstar (solar) 1 1.146 0.9
δA/A 10–5 6.0×10⁻⁴ 2.0×10⁻¹²
MJup = 2 x 1030 gmRJup = 7 x 109 cm
How good does your data have to be?
We want to detect a signal of ≈ 10–3 that of the star. Supposeyou want detect 1000 photons from the planet (signal to noiseratio of 33). This means you need to detect 106 photons fromthe star (+ planet)
For a star of magnitude HD 209458 (V = 7.65) you can get90000 photons in about 3 minutes (including overhead) on the8m VLT.
Number of observations = 106/90000 = 11 observations ≈0.5 hour.
You have to take this many observations, but both in and out of transit
E.g. take V=12, A detection will require ≈ 30 hours
From The Astrophysical Journal 537(2):916–921.© 2000 by The American Astronomical Society.For permission to reuse, contact [email protected].
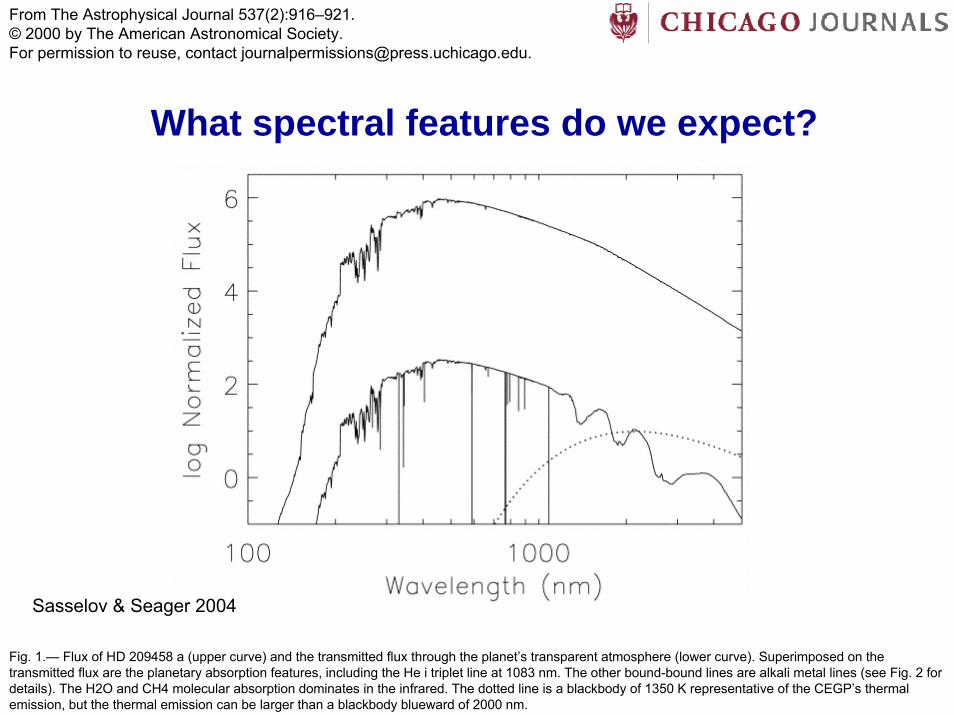
What spectral features do we expect?
Sasselov & Seager 2004
Fig. 1.— Flux of HD 209458 a (upper curve) and the transmitted flux through the planet’s transparent atmosphere (lower curve). Superimposed on the transmitted flux are the planetary absorption features, including the He i triplet line at 1083 nm. The other bound-bound lines are alkali metal lines (see Fig. 2 for details). The H2O and CH4 molecular absorption dominates in the infrared. The dotted line is a blackbody of 1350 K representative of the CEGP’s thermal emission, but the thermal emission can be larger than a blackbody blueward of 2000 nm.

From The Astrophysical Journal 537(2):916–921.© 2000 by The American Astronomical Society.For permission to reuse, contact [email protected].
Fig. 2.—Upper plot: The normalized in-transit minus out-of-transit spectra, i.e., percent occulted area of the star. In this model the cloud base is at bar. Rayleigh scattering is important in the UV. Lower plot: A model with cloud base at 0.2 bar. The stellar flux passes through higher pressures, densities, and temperatures of the planet atmosphere compared to the model in the upper plot. In addition, a larger transparent atmosphere makes the line depth larger. Observations will constrain the cloud depth. See text for discussion.
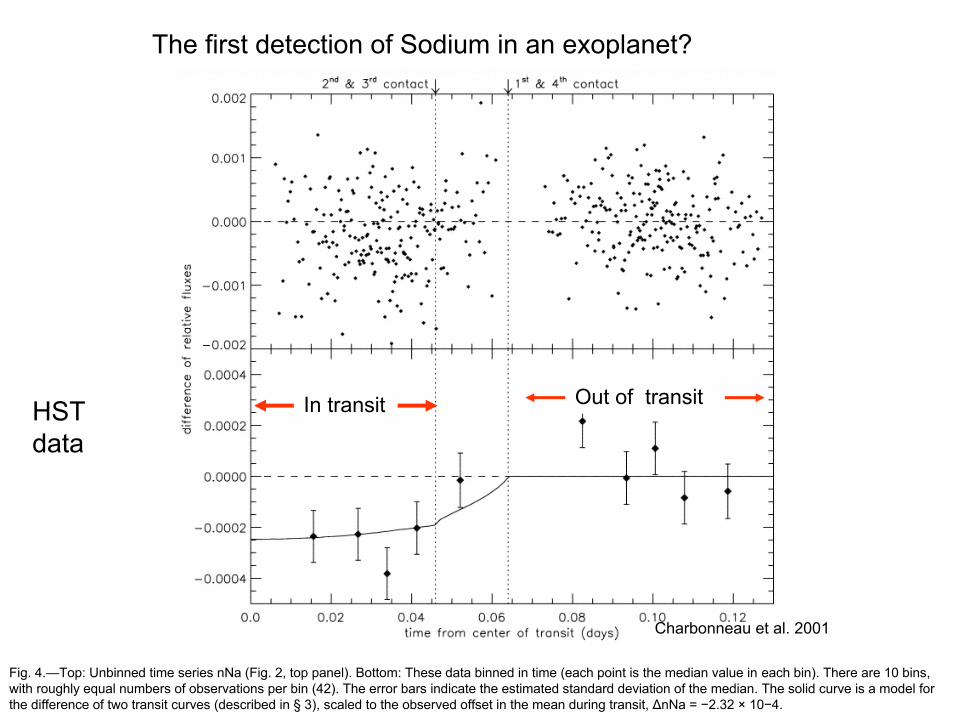
The first detection of Sodium in an exoplanet?
In transit Out of transitHST data
Charbonneau et al. 2001
Fig. 4.—Top: Unbinned time series nNa (Fig. 2, top panel). Bottom: These data binned in time (each point is the median value in each bin). There are 10 bins, with roughly equal numbers of observations per bin (42). The error bars indicate the estimated standard deviation of the median. The solid curve is a model for the difference of two transit curves (described in § 3), scaled to the observed offset in the mean during transit, ∆nNa = −2.32 × 10⁻⁴.
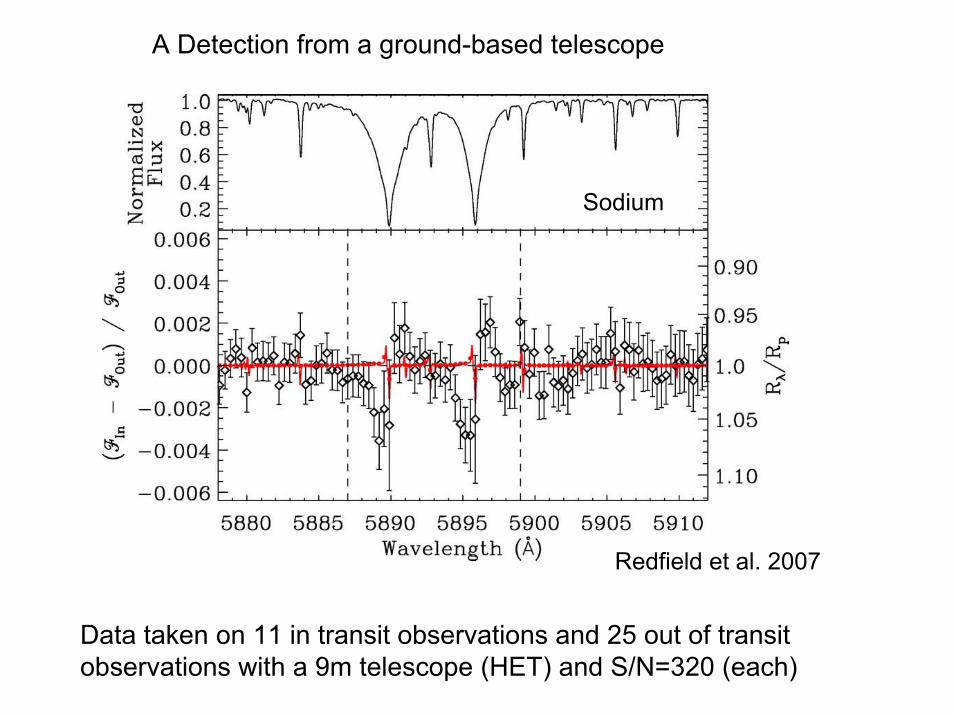
A Detection from a ground-based telescope
Redfield et al. 2007
Sodium
Data taken on 11 in transit observations and 25 out of transitobservations with a 9m telescope (HET) and S/N=320 (each)

Calcium
An element not expected to show excess absorption shows none
We have just completed a survey of 6 hot Jupiters and 1 hot Neptune
with the HET: stay tuned....

What about the atmosphere of terrestrial planets?

Beamcombiner
Data storage and transfer station
Darwin / TPF-I

Simulation of spectrum acquired in 40 dayswith the proposed (and not accepted) Spacemission Darwin

The Red Edge
Plants have Chlorophyll which absorbsin green wavelengths. Planets are thusmore reflective in the infrared.

Earthshine Spectra
Summary
• Temperatures have been measured for a numberof planets.
• Upper limits to Albedo that are consistent withtheoretical predictions.
• Evidence for circulation currents in atmosphere(weather!)
• Chemical species detected in transiting planets: Na, H, CO, CO2, CH4, and H20