characterization of nylon-12 in a novel additive
TRANSCRIPT

University of South FloridaScholar Commons
Graduate Theses and Dissertations Graduate School
April 2018
Characterization of Nylon-12 in a Novel AdditiveManufacturing Technology, and the Rheologicaland Spectroscopic Analysis of PEG-Starch MatrixInteractionsGarrett Michael CraftUniversity of South Florida, [email protected]
Follow this and additional works at: http://scholarcommons.usf.edu/etd
Part of the Polymer Chemistry Commons
This Dissertation is brought to you for free and open access by the Graduate School at Scholar Commons. It has been accepted for inclusion inGraduate Theses and Dissertations by an authorized administrator of Scholar Commons. For more information, please [email protected].
Scholar Commons CitationCraft, Garrett Michael, "Characterization of Nylon-12 in a Novel Additive Manufacturing Technology, and the Rheological andSpectroscopic Analysis of PEG-Starch Matrix Interactions" (2018). Graduate Theses and Dissertations.http://scholarcommons.usf.edu/etd/7137

Characterization of Nylon-12 in a Novel Additive Manufacturing Technology, and the
Rheological and Spectroscopic Analysis of PEG-Starch Matrix Interactions
by
Garrett Michael Craft
A dissertation submitted in partial fulfillment
of the requirements for the degree of
Doctor of Philosophy
Department of Chemistry
College of Arts and Sciences
University of South Florida
Major Professor: Julie P. Harmon, Ph.D.
Jianfeng Cai, Ph.D.
Nathan Crane, Ph.D.
Shengqian Ma, Ph.D.
Date of Approval
April 4, 2018
Keywords: Dynamic Mechanical Analysis, Rheology, Spectroscopy, Three-Dimensional
Printing, Differential Scanning Calorimetry
© Copyright 2018 Garrett Michael Craft

Dedication
I’d like to dedicate this work to my family. Although that opening sentence may sound
cliché, families are the bedrock any individual is built upon from the moment they enter the
world. It is through their guidance, nurturing, and traversing both good times and bad which
develops character. My family, in general, and my brother (who is quite older than me) in
particular, fostered my love for science and ingrained into me from a very young age the
importance of a questioning outlook and inquisitive mind. Although my brother now lives many
thousands of miles away in another country, his guidance from many years ago still influences
my day to day approach to science.
There isn’t much achievable without sacrifice. And certainly support is needed to make it
through the hard times. My friends and family have stood behind me every step of the way,
supporting my decision to pursue grad school and all of the trials and tribulations which come
with it. Additionally, my wonderfully understanding girlfriend, Chelsey, and her family, have not
only tolerated me, but supported me along this path and stuck with me through the hard times.
Without everyone’s support this work may not have been possible, and so at the very least they
deserve this wholly insufficient dedication and surely no amount of thanks could repay the debt.

Acknowledgments
I’d like to acknowledge Dr. Julie P. Harmon first and foremost, for her tireless guidance
and allowing me the chance to work in her lab to advance science. I’d further like to
acknowledge my committee: Drs. Jianfeng Cai, Nathan Crane, and Shengqian Ma for their
support along the way. In particular, I’d like to additionally thank Dr. Nathan Crane and Justin
Nussbaum for the collaborative work with an exciting development of additive manufacturing. I
also want to thank Butch Knudsen and Ken Kull for their help, and my colleagues Alejandro
Rivera Nicholls, Tamalia Julien and Imalka Marasinghe for their help and making the lab a fun
and inviting place.
I also want to thank Alina Ilkevitch, Jenik Nicoghosian and Inna Sheyner. The starch-
PEG matrix interactions work was made possible by the careful attention to detail exhibited by
the clinicians at the James A. Haley Hospital in Tampa, FL who first noted the dangerous
phenomenon, and its pharmacy for providing much of the materials.

i
Table of Contents
List of Tables ................................................................................................................................. iv
List of Figures ..................................................................................................................................v
List of Equations ..............................................................................................................................x
Abstract..........................................................................................................................................xii
Chapter 1 Introduction
1.1 Polymer Chemistry .......................................................................................................1
1.2 Polymer Characterization ............................................................................................. 4
1.2.1 Differential Scanning Calorimetry ................................................................ 5
1.2.2 Gel Permeation Chromatography ...................................................................8
1.2.3 Dynamic Mechanical Analysis .....................................................................12
Chapter 2: Impact of Extended Sintering Times on Mechanical Properties in PA-12 Parts
Produced by Powderbed Fusion Processes
2.1 Introduction .................................................................................................................19
2.2 Experimental Methods ............................................................................................... 26
2.2.1 Sample Preparation ..................................................................................... 25
2.2.2 Rheology .......................................................................................................27
2.2.3 Differential Scanning Calorimetry (DSC) ...................................................28
2.2.4 Polarized Light Microscopy ..........................................................................28
2.2.5 Tensile Testing .............................................................................................28
2.2.6 Density ..........................................................................................................29
2.3 Results and Discussion
2.3.1 Rheology .......................................................................................................29

ii
2.3.2 Differential Scanning Calorimetry (DSC) ....................................................31
2.3.3 Polarized Light Microscopy ..........................................................................35
2.3.4 Tensile Testing ..............................................................................................37
2.4 Conclusions ..................................................................................................................42
Chapter 3: Analyzing Polyethylene Glycol/Polysaccharide Interactions of Clinical Significance
3.1 Introduction……......…………………………………………………………………44
3.2 Starch and Xanthan Gum Structure .............................................................................47
3.3 Materials ......................................................................................................................52
Chapter 4: Dynamic Rheology of Starch and Xanthan Gum Solutions as functions of PEG MW
4.1 Introduction……......…………………………………………………………………53
4.2 Methods........................................................................................................................54
4.3 Dynamic rheology ........................................................................................................56
4.3.1 Phase Angle vs. Oscillation Stress ................................................................57
4.3.2 Modulus Crossover vs. Stress .......................................................................61
Chapter 5: Steady Shear Rheology of Starch and Xanthan Gum Solutions as functions of PEG
MW.
5.1 Introduction……......…………………………………………………………………66
5.2 Methods........................................................................................................................66
5.3 Steady shear rheology ..................................................................................................67
5.3.1 Viscosity vs. shear rate .................................................................................67
Chapter 6: FT-IR Spectroscopy of Aqueous Starch/PEG solutions
6.1 Methods........................................................................................................................74
6.2 FT-IR Results ..............................................................................................................75
Citations .........................................................................................................................................79

iii
Appendix
A Dynamic Mechanical Analysis of Nylon-12 AM Parts (Future Work) ....................................86
A.1 Methods .......................................................................................................................86
A.2 Dynamic Mechanical Analysis ...................................................................................86
B. Standard Dev. of Starch and XG viscosity vs. Shear Rates ....................................................95

iv
List of Tables
Table 1. DSC data for PA12 powders and printed parts ............................................................32
Table 2. Tensile data of PA12 printed parts...............................................................................39
Table 3. Rheology data for 1 and 24 hours after mixing of starch/PEG solutions ....................72
Table 4. Rheology data for 1 and 24 hours after mixing of xanthan gum/PEG solutions .........73
Table 5. Tabulated DMA data comparing LAPS to ProtoLabs LS and MJF-printed parts .......91

v
List of Figures
Figure 1: Chain Polymerization...............................................................................................2
Figure 2: Condensation Polymerization ..................................................................................3
Figure 3: Molecular weight as a function of monomer conversion .........................................4
Figure 4: Differential Scanning Calorimetry example thermogram ........................................6
Figure 5: Differential Scanning Calorimetry percent crystallinity ..........................................7
Figure 6: Gel Permeation Chromatography ............................................................................9
Figure 7: Gel Permeation Chromatography calibration curve ..............................................10
Figure 8: Molecular weight distribution ................................................................................12
Figure 9: Hookean versus viscous responses in DMA ..........................................................13
Figure 10: Dynamic Mechanical Analysis example data ........................................................15
Figure 11 Linear Viscoelastic Region ....................................................................................16
Figure 12: DSC PA12 powder processing window .................................................................22
Figure 13: LAPS schematic ....................................................................................................25

vi
Figure 14: Zero shear plateau of PA2202 powder...................................................................30
Figure 15: Viscosity of PA2202 as a function of time at three isothermal temperatures ........31
Figure 16: DSC thermograms of PA12 powder and printed parts .........................................33
Figure 17: Polarized light micrographs parts sectioned via microtome ..................................35
Figure 18: Tensile data of PA12 parts ....................................................................................38
Figure 19: PEG/sorbitol/lactulose structure .............................................................................45
Figure 20: Polysaccharide components of starch ....................................................................48
Figure 21: Syneresis of starch/PEG solutions as a function of PEG MW ...............................50
Figure 22: Structure of Xanthan Gum ....................................................................................52
Figure 23: TA Instruments AR2000 rheometer .......................................................................55
Figure 24: Phase angle of starch solutions after 1 hour of mixing ..........................................57
Figure 25: Phase angle of XG solutions after 1 hour of mixing ..............................................58
Figure 26: Phase angle of starch solutions after 24 hours of mixing ......................................59
Figure 27: Phase angle of XG solutions after 24 hours of mixing ..........................................60
Figure 28: Modulus crossovers of starch solutions after 1 hour of mixing .............................62

vii
Figure 29: Modulus crossovers of XG solutions after 1 hour of mixing.................................63
Figure 30: Modulus crossovers of starch solutions after 24 hours of mixing .........................64
Figure 31: Modulus crossovers of XG solutions after 24 hours of mixing .............................65
Figure 32: Viscosity of starch solutions after 1 hour of mixing ..............................................68
Figure 33: Viscosity of XG solutions after 1 hour of mixing..................................................68
Figure 34: Viscosity of starch solutions after 24 hours of mixing ..........................................69
Figure 35: Viscosity of XG solutions after 24 hours of mixing ..............................................69
Figure 36: Carreau-Yasuda Model ..........................................................................................71
Figure 37: PerkinElmer UATR Two™ FT-IR spectrometer...................................................74
Figure 38: FT-IR Spectra of Starch as Function of PEG MW ................................................76
Figure 39: Crystallinity vs. Amorphous Character of Starch/PEG Solutions ........................76
Figure 40: DMA of PA12 Parts at 1Hz ...................................................................................88
Figure 41: Frequency Dependence of LAPS Part ...................................................................89
Figure 42: Stacked Storage Moduli of PA12 Parts .................................................................90
Figure 43: Stacked Tan δ of PA12 Parts .................................................................................91

viii
Figure 44: DMA LVR or MJR and ProtoLabs Parts Showing Effects of Porosity .................93
Figure 45: Viscosity SD of starch after 1 hour of mixing .......................................................95
Figure 46: Viscosity SD of starch/PEG 300 after 1 hour of mixing .......................................96
Figure 47: Viscosity SD of starch/PEG 1000 after 1 hour of mixing .....................................96
Figure 48: Viscosity SD of starch/PEG 3350 1 hour of mixing ..............................................97
Figure 49: Viscosity SD of neat Xanthan Gum after 1 hour of mixing ..................................98
Figure 50: Viscosity SD of neat Xanthan Gum/PEG 300 after1 hour of mixing ....................98
Figure 51: Viscosity SD of neat Xanthan Gum/PEG 1000 after1 hour of mixing ..................99
Figure 52: Viscosity SD of neat Xanthan Gum/PEG 3350 after1 hour of mixing ..................99
Figure 53: Viscosity SD of neat starch after 24 hours of mixing ..........................................100
Figure 54: Viscosity SD of starch/PEG 300 after 24 hours of mixing ..................................100
Figure 55: Viscosity SD of starch/PEG 1000 after 24 hours of mixing ................................101
Figure 56: Viscosity SD of starch/PEG 3350 after 24 hours of mixing ................................101
Figure 57: Viscosity SD of neat Xanthan Gum after 24 hours of mixing .............................102
Figure 58: Viscosity SD of Xanthan Gum/PEG 300 after 24 hours of mixing .....................102

ix
Figure 59: Viscosity SD of Xanthan Gum/PEG 1000 after 24 hours of mixing ...................103
Figure 60: Viscosity SD of Xanthan Gum/PEG 3350 after 24 hours of mixing ...................103
x
List of Equations
Equation 1: Differential Scanning Calorimetry heat capacity .....................................................5
Equation 2: Differential Scanning Calorimetry heat capacity .....................................................5
Equation 3: Differential Scanning Calorimetry heat capacity .....................................................5
Equation 4: Differential Scanning Calorimetry percent crystallinity calculation .......................7
Equation 5: Number-averaged molecular weight ......................................................................12
Equation 6: Weight-averaged molecular weight .......................................................................12
Equation 7: Polydispersity index ...............................................................................................12
Equation 8: Dynamic Mechanical Analysis stress ....................................................................14
Equation 9: Dynamic Mechanical Analysis strain ....................................................................14
Equation 10: Complex modulus ..................................................................................................14
Equation 11: Storage modulus.....................................................................................................14
Equation 12: Loss modulus .........................................................................................................14
Equation 13: Damping (loss) factor ............................................................................................14

xi
Equation 14 Complex Viscosity .................................................................................................17
Equation 15: Carreau-Yasuda Model ..........................................................................................70
Equation 16 Length of Rubbery Plateau Relationship to Entanglement MW ...........................87

xii
Abstract
In this work differential scanning calorimetry, dynamic mechanical analysis, Fourier-
Transformed Infrared Spectroscopy [FT-IR] and polarized light microscopy will be employed to
characterize polymeric systems. The first chapter broadly covers polymer synthesis and
important characterization methods.
In the second chapter, a polyamide (PA12) will be sintered via a novel additive
manufacturing (AM) technology developed here at USF termed LAPS (Large Area Projection
Sintering). LAPS uses extended sintering timespans to ensure complete melting and densification
of the polymer powder over the entire two-dimensional area of the part’s footprint. Further, it
allows for the printed layer to crystallize and shrink in its entirety as the temperature falls below
the crystallization temperature prior to the next layer being added. The printed parts (termed
coupons) will be assayed by DSC and polarized light microscopy to determine sintering efficacy.
Additionally, the parts will be compared to coupons printed with conventional methods to show
that the USF AM technology shows superior elongation at break (EaB), with comparable
ultimate tensile strength (UTS) and Young’s Modulus to laser sintered coupons. This is notable
as conventional AM methods produce parts which usually compromise between EaB and
modulus. The EaB of LAPS-printed parts is comparable to injection molding (IM) grade PA12,
which is remarkable as IM grade PA12 powder normally has higher molecular weight and
limited crystallinity. The reduced crystallinity of IM grade PA12 parts is thought to be due to the
high shear rates during injection and fast cooling rates post-fabrication. Further, the USF LAPS

xiii
parts show minimal or no detectable porosity. Porosity is an artifact of the sintering process
which conventional techniques like laser sintering (LS) have little ability to mitigate, as higher
energy wattages simply burn and degrade the polymer surface with insufficient time available for
heat transfer and bulk melt flow. Porosity is documented as one of the leading causes of part
failure and decreased mechanical properties in the literature, and as such the USF AM
technology is in the process of being patented as of March, 2018.
Chapters three through six will explore a phenomenon first noticed by clinicians at the
James A. Haley Veterans Hospital. They observed that starch-thickened drinks for patients
suffering from dysphagia became dangerously thinned down upon addition of the osmotic drug
polyethylene glycol (PEG) 3350, marketed as Miralax®. Starch-based hydrocolloids are
common thickeners used for patients with dysphagia, and so any incompatibility with such a
ubiquitous drug as PEG 3350 poses an immediate danger. Patients with the disorder can suffer
increased rates of aspiration-related pneumonia, incurring up to nearly a 60% fatality rate within
a year. Chances for aspiration greatly increase for food items which are too inviscid to safely
swallow. Rheology and FT-IR spectroscopy will be used to show that the breakdown of the
starch network in aqueous solution is dependent upon the molecular weight of PEG. As the
molecular weight of PEG is reduced to that of a small molecule (~300MW) from its large drug
form (3350MW), the structure stabilizes and can resist shearing forces in a steady shear
rheological experiment. Spectroscopy will show that PEG molecular weight also influences
syneresis and the crystallinity of the starch hydrocolloid solutions.
It is postulated that the molecular weight of PEG influences its miscibility in starch
solutions, and its ability to interrupt the hydrogen bonding and entanglements which maintain the
elastic framework which allow starch thickeners to impart viscosity and resist shearing forces.

xiv
When this framework collapses, absorbed water is expelled as evidenced as a biphasic separation
where water collects on top of the starch suspension. This was the phenomenon observed by the
clinicians at the Veterans’ Hospital.

1
Chapter 1 Introduction
1.1 Polymer Chemistry
Polymers are macromolecules composed of a large number of repeating units. These
units, termed monomers, are usually small molecules with reactive moieties lending themselves
to reacting in high yield to form polymers of many hundreds, if not thousands, of repeat units.
The reactions can be largely grouped into two classifications as a function of mechanism and
kinetics: chain and step-growth polymerization [2]. Chain polymerizations utilize monomers
which react to propagate the growing chain from a single end, and do not evolve small molecule
side products in the process. These reactions generate high molecular weight very quickly after
initiation, and then very slowly afterward increase the molecular weight as the reaction
proceeds[2]. Such polymerizations usually entail unsaturations or organic heterocycles which
react after being attacked by an initiator (a radical, anion or cation) to generate a reactive site [2].
These reactive sites can then attack neighboring monomers and propagate the reactive end as
molecular weight builds and more and more monomers are appended to the growing chain.
Chain polymerizations generally occur in three steps. The first is the generation of an
initiator species. This initiator, often abbreviated as I*, then reacts with a monomer and begins
the second step, the propagation step , with the formation of new reactive sites as new monomers
react and add to the growing chain end. The final step, the termination step, can occur via a
number of various pathways, but all entail the reactions of the chain ends to destroy the reactive
sites. Figure 1 exemplifies a chain polymerization of a simple olefin. The propagation step here

2
is accomplished by the homolytic cleavage of an organic peroxide to generate the initiator
species. This initiator subsequently reacts with unsaturated monomers during the propagation
steps to move the reactive site continuously along the chain end until a termination step occurs.
In this example, two reactive chain ends react to form a new sigma bond, quenching the radical
and terminating the reaction by adjoining two polymer chains.
Step-growth polymerization, on the other hand, utilizes monomers which have two or
more reactive moieties. These polymerizations initially generate small oligomeric material which
eventually builds into high molecular weight polymer as oligomers react among one another
during the progression of the reaction [2]. A subclass of step-growth polymerization involves
reactions which generate small molecule side products such as alcohols or water[2]. These
reactions are termed condensation polymerizations, and are characterized by reversible equilibria
Figure 1
Chain polymerization example utilizing a radical mechanism.

3
which can be influenced by Le Chatelier’s principles to drive them to completion and maximize
molecular weight.
In Figure 2 a transesterification of a dicarboxylic acid and diol exemplifies a common
condensation polymerization with the formation of a polyester. In this example the dicarboxylic
acid, terephthalic acid, reacts under acid catalyzed conditions with the diol (ethylene glycol) to
form a polyester. One equivalent of water is evolved as each new ester linkage forms. This water
can be driven off with water scavengers such as molecular sieves, or distilled off to drive the
reaction towards completion by exploiting Le Chatelier’s Principle.
Molecular weight in these reactions builds up slowly and by irregular amounts. During
step-growth, oligomers of disparate molecular weights react with multiple reactive chain ends.
As Figure 3 illustrates, molecular weight for chain polymerizations in contrast increases rapidly
Figure 2
A condensation polymerization utilizing a dicarboxylic acid and diol.

4
and increases continuously until termination. In this example, a slower chain growth mechanism
is shown, a mechanism known as living chain growth. Typical chain growth rates are even faster
and reach maximum weight within seconds. However, for step-growth polymerizations the
molecular weight remains low for much of the progression of the reaction until the latter stages
where larger weight oligomers react[2].
1.2 Polymer Characterization
There are three powerful techniques commonly used for polymer characterization in
academia and industry: differential scanning calorimetry, gel permeation chromatography, and
dynamic mechanical analysis. This section will quickly explore these techniques and their utility
in polymer characterization. However, other methods such as thermogravimetric analysis (TGA),
Figure 3
Molecular weight as a function of monomer percent conversion for
living chain and step-growth polymerization. Copyright: Wikipedia.

5
infrared spectroscopy (IR) and nuclear magnetic resonance (NMR) are commonly used by both
small molecule and polymer chemists.
1.2.1 Differential Scanning Calorimetry (DSC)
Differential Scanning Calorimetry (DSC) is a thermoanalytical technique which analyzes
heat capacity changes as functions of temperature and can be used to study 1st and 2nd order
transitions. This is done by heating (or cooling) a sample of known mass at a known heating (or
cooling rate), and measuring changes in heat flow (Watts, Joules/second) relative to heating rate
and temperature. Changes in heat flow are related to transitions occurring in the sample versus a
reference sample (usually an empty pan)[3-5]. This relationship is illustrated in equations 1-3.
The resulting data is known as a thermogram (Figure 4) and displays heat flow as a function of
temperature. Such data, when plotted, must have the heat flow orientation defined. This is
usually done by specifying whether exothermic events will point up or down relative to the
constant pressure heat capacity.
Equation 1
𝑄 (𝐽)
𝑡 (s)𝛥𝑇 (𝐾)
𝑡 (𝑠)
=𝑄 (𝐽)
𝑡 (𝑠)·
𝑡 (𝑠)
𝛥𝑇 (°𝐶)
Equation 2 𝑄 (𝐽)
𝑡 (𝑠) ·
𝑡 (𝑠)
𝛥𝑇 (𝐾)=
𝑄 (𝐽)
𝛥𝑇 (𝐾)
Equation 3 𝑄 (𝐽)
𝛥𝑇 (𝐾)= 𝐶𝑝 (
𝐽
𝐾)

6
DSC lends itself to myriad uses ranging from polymer characterization to pharmaceutical
applications due to its speed and ease of use. Material aspects such as the glass transition (Tg),
melt (Tm), crystallization (Tc) temperatures, cure and oxidation enthalpies can be measured and
quantified under various atmospheres and heating conditions. An important metric which can be
quantified using DSC, and is of particular relevance in additive manufacturing, is a
semicrystalline polymer’s percent crystallinity. A polymer’s crystallinity (Figure 5) can be
quantified if the theoretical enthalpy of crystallization for a 100% crystalline sample of the same
material is known. Equation 4 can then be used to determine how much of a semicrystalline
polymer is actually crystallized, as no polymer can reach 100% crystallinity.
Figure 4
Differential scanning calorimeter (DSC) thermogram showing thermal
events. Exothermic events in this example point upwards from the heat
capacity baseline. Courtesy of TA Instruments.

7
Equation 4 % 𝑐𝑟𝑦𝑠𝑡𝑎𝑙𝑙𝑖𝑛𝑖𝑡𝑦 = 𝛥𝐻𝐶
𝛥𝐻𝐶,𝑘𝑛𝑜𝑤𝑛 𝑥 100%
One must also be able to account for the thermal history of a polymer in calorimetric
experiments. Synthesis, post-synthetic drying, molding and other processes can affect a
polymer’s structure. This thermal history can be erased by thermally cycling the sample in the
DSC before analyzing the data, as heating during the temperature ramp will give the polymer
chains enough energy to achieve their lowest energy conformations[6]. Thus, DSC data must
also be reported as being from either the first or second heating cycle so that comparisons can be
consistently be made between samples without the influence of processing history variability
complicating analysis.
Figure 5
Differential scanning calorimeter (DSC) thermogram of the polyamide-12
(PA12) PA 2200 powder from EOS GmbH. PA12 polymers are reported to
have a crystallization enthalpy of 209.3 J/g for a theoretical 100%
crystalline sample.

8
1.2.2 Gel permeation chromatography (GPC)
Another important analytical technique is known as gel permeation chromatography
(GPC) when the mobile phase is an organic solvent, or size exclusion chromatography (SEC)
when the mobile phase is aqueous. Although not a true chromatographic technique since it does
not rely upon differential interactions between mobile and stationary phases to fractionate an
analyte, it nevertheless separates polymers by size (or, more accurately, volume). It achieves this
fractionation after a dilute solution of a polymer is injected into a column composed of porous
beads (Figure 6). The pores and channels within these beads cause the smallest polymers, those
occupying the smallest three-dimensional volume, to be encumbered the most by entering the
majority of the pores and tunnels of the beads. These polymers will then slowly travel through
the pore network propelled along by the flow of the mobile phase as they percolate through the
tunnels of the stationary phase. However, the largest polymers do not interact with all of the
tunnels and pores as much due to size restrictions and travel, instead, largely through the
interstitial space between the beads. Thus, polymers of intermediate size will take an
intermediate time to elute from the column between the largest and smallest molecular weight
polymers, achieving a fractionation of the polymer sample[2, 7, 8]. Polymers too large to fit
within the pores are excluded from the matrices and this molecular weight range defines the
upper, exclusion limit, for the particular column. Likewise, polymers too small to avoid any
pores define the lower, diffusion, limit of the column. Polymers above and below these limits
cannot be fractionated by the column because there is no sifting of polymer size by the porosity
of the stationary phase. Columns have their own unique molecular weight ranges, with some
being of “mixed bed” construction. Older columns often need to be daisy-chained together,
linking columns of differing exclusion and diffusion limits together to achieve separation.

9
Because polymers are fractionated by coiled volume and not molecular weight,
calibration is needed to relate molecular volume to retention time. Ideally, calibrants of identical
composition to the analyte, with molecular weights established by absolute techniques are
chosen. Calibrants should also be of the highest purity and with minimal polydispersity-- a
measure of molecular weight breadth. Polymers of the same composition as the analyte are often
not available, so calibrants differing from the unknown sample are employed to establish a
relative measurement[4, 7]. Nevertheless, a series of calibrants with a range of molecular weights
of interest are dissolved in the same solvent and ideally to the same concentration as the
unknown. This is injected onto the column under the same conditions (flow rate, temperature,
ionic strength, etc.) that will be used for the unknown.
Figure 6
A schematic representation of a GPC/SEC column achieving separation by
fractioning polymers by molecular weight (volume). Interactions with the
porous stationary phase cause different elution times for polymers of
different sizes. Image courtesy of Agilent Technologies.

10
In this way a calibration curve (Figure 7) can be established relating molecular weight
(volume) with retention time for the given column and conditions. For example, results for a
poly (methyl methacrylate) analyte would be reported as molecular weight relative to
polystyrene, if polystyrene calibrants were utilized to form the calibration curve. Changes in
temperature, solvent, ionic strength and any other parameter which can alter how a polymer coils
in solution will alter the observed retention time as the three dimensional volume occupied by
the polymer chain will change. This will result in an erroneous data if these changes occur
between calibration and the analyte injection, or between trials of the analyte.
Manmade polymers usually exist not as discrete molecular weights unique to their
identity as seen in small molecules, but as a polydisperse distributions of molecular weights
which can be visualized as a Gaussian distribution in a graph. Figure 8 plots weight fractions
Figure 7
A calibration curve for GPC/SEC relating molecular weight to retention
time. Each dot represents a monodisperse calibrant of a particular
molecular weight. Image courtesy of Agilent Technologies.

11
versus molecular weight to visualize the distribution of chains of a particular size. Different
statistical methods of computing molecular weights for a polymer are possible (Equations 5
through 7) with the number-averaged (𝑀𝑛 ) and weight-averaged (𝑀𝑤
) being the most
prominent[4, 9]. In these equations Mi is the molecular weight of a chain, and Ni is the number of
chains of that molecular weight. The number-averaged molecular weight is the statistical average
of the contribution of all molecular chains to the molecular weight (MW) of a polymer sample. A
measure of the breadth of a polymer’s molecular weight distribution can be quantified by the
polydispersity index (PDI)[9]. A monodisperse system is one where all chains are of the same
molecular weight (PD=1). Most polymers however, are polydisperse and composed of a range of
chains with various molecular weights. GPC/SEC allows for these molecular weight profiles to
be quickly profiled when equipped with the proper concentration-sensitive detectors such as
differential refractive index (RI) [4, 7].

12
Equation 5 𝑀𝑛 =
∑ 𝑁𝑖𝑀𝑖
∑ 𝑁𝑖
Equation 6 𝑀𝑤 =
∑ 𝑁𝑖𝑀𝑖2
∑ 𝑁𝑖𝑀𝑖
Equation 7 𝑃𝐷𝐼 =𝑀𝑤
𝑀𝑛
1.2.3 Dynamic Mechanical Analysis (DMA)
Dynamic mechanical analysis applies a sinusoidal stress or strain (Equations 8 and 9) to
a sample with a known instrument geometry. For the case of a controlled stress experiment, a
sinusoidally applied force (stress, Pa) will produce a measured deformation (strain) of an amount
Figure 8
Mass distribution from GPC/SEC relating the distribution of chains of
various sizes. Image courtesy of Agilent Technologies.

13
relating to the viscoelastic properties of the material [6, 10]. The viscous and elastic responses of
a material are limiting situations where after either a stress or strain is removed the sample
recovers elastically (Hookean limit), or it does not recover and instead flows (viscous limit). For
materials which are entirely elastic, there is no phase lag between sinusoidal stress application
and strain measurement (δ=0°). Conversely, materials which are entirely viscous display a phase
lag of 90° (δ=90°)[6, 10]. Thus, when an oscillating stress is applied to a viscoelastic system, a
system composed of both viscous and elastic responses, an intermediate phase lag results due to
a phase lag from the viscous component represented by δ in the below equations.
Dividing the oscillating force by the resulting strain results in a modulus (Equations 11
and 12).The elastic (Hookean) and inelastic (viscous) components of a material’s overall
response to the dynamic nature of the sinusoidal force can be represented as the vector sum
known as the complex modulus (E*, or G* for shear experiments), Equation 10. This equation
Figure 9
Hookean (1b) and viscous (1c) time lag responses versus a viscoelastic
material (1d). In a viscoelastic material, 0°<δ<90°. Courtesy of Perkin
Elmer.

14
represents the vector components of storage modulus (E’, or G’) and loss modulus (E’’ or G’’),
Figures 11 and 12. The storage modulus is related to the stiffness of a material, and represents
energy which can be elastically stored during deformation and recovered when stress is removed.
Likewise, a material’s inelastic (loss) modulus is a response to a sinusoidal stress representing
the viscous response of the material. The energy of an applied force used to deform a material
undergoing a viscous deformation is irrecoverable, as it is instead converted to heat during flow.
The ratio of loss to storage moduli represents the material’s ability to dissipate energy, and is
known as the Tan δ, the damping or loss factor, Equation 13. A sketch of a generalized DMA
plot is shown in Figure 10, showing moduli as a function of increasing temperature with a
constant frequency of oscillation.
Equation 8 𝜎 = 𝜎0 sin(𝜔𝑡 + 𝛿)
Equation 9 휀 = 휀0 sin(𝜔𝑡)
Equation 10 𝐸∗ = 𝐸′ + 𝑖𝐸′′
Equation 11 𝐸′ =(𝑆𝑡𝑟𝑒𝑠𝑠,𝑃𝑎)
(𝑠𝑡𝑟𝑎𝑖𝑛)𝑐𝑜𝑠𝛿
Equation 12 𝐸′′ =(𝑠𝑡𝑟𝑒𝑠𝑠,𝑃𝑎)
(𝑠𝑡𝑟𝑎𝑖𝑛)𝑠𝑖𝑛𝛿
Equation 13 tan 𝛿 = 𝐸′′
𝐸′

15
As can be seen in the above figure, at lower temperatures the material is in its glassy state
(T<Tg) with a quick drop in storage modulus as the glass temperature is exceeded. A rubbery
plateau is achieved in this example where, again, the storage modulus dominates as it did below
the glass transition, albeit it now at a far lower modulus. It is in this region where soft, rubber-
like materials find their applications. Further heating resulting in a viscoelastic liquid where the
loss modulus dominates (G’’> G’) and the material mainly exhibits viscous behavior. Similarly,
a semicrystalline material will exhibit a melt after this region where crystalline lamellae
dissociate and generate a much larger decrease in measured viscosity than that seen in
amorphous materials.
Figure 10
Typical DMA modulus data as a function of temperature for a fully
amorphous material. Courtesy of TA Instruments.

16
Of particular importance in characterizing samples with DMA is to know the limits of the
linear viscoelastic region (LVR). This region if often defined with strain sweep tests, where
frequency is kept constant but the strain amplituted is continuously ramped[11]. Experiments
within this region yield results which are independent of strain (deformation)[11, 12]. More
importantly, this region represents the amount of deformation a sample can be tested under
before microstructure breakdown and cracks form[11]. Visualization of this region from strain
sweep data is exhibited in Figure 11. The LVR is represented by the a flat, horizontal region of
the storage, complex modulus or complex viscosity as a function of strain. Deviation from the
horizontal plateau is indicative of a non-linear relationship developing between stress and strain,
or a sample which is being deformed too far and its structure is being irreversibly broken down.
In the above example, it can be seen that the modulus (more easily visualized by the loss factor
Overlay
Figure 11
Strain sweep at three temperatures (°C) to determine the linear
viscoelastic region (LVR) for DMA analysis.

17
tan δ) begins to deviate from horizontal around a strain of ca. 0.7% for the three temperatures
assayed. Also of note is the increasing storage modulus (G`) magnitude at lower temperatures as
the material becomes more stiff. This is of importance for tests spanning large temperature
ranges, as the LVR can not only change depending on temperature, but the amount of force
needed to deform a sample by an amount within the LVR deformation can increase with
decreasing temperature and may exceed the limits of the instrument. At the lowest temperature
studied in Figure 11 the storage modulus is 7.45 x 10⁸ Pa (-50°C), with that value dropping to
2.51 x 10⁸ Pa for the highest temperature, 50°C.
Equation 14 𝜂∗ =𝐺∗
𝑖𝜔
Dynamic mechanical analysis can also be used to study the dynamic viscosity of a
material, with the application of a sinusoidal force measured in frequency (Hz). This contrasts
with a steady shear (rotational) experiment common to viscometers with shear rates measured as
�� (1
𝑠). If the complex modulus (G*) is divided by oscillation frequency (ω), the complex viscosity
(Equation 14) results with units of Pa·S. Oscillatory experiments allow for higher shear rates
than achievable by steady shear experiments. One can interconvert between steady and
oscillatory shear experiments using the empiracle Cox-Merz rule[13]. This rule is applicable to a
wide range of linear polymer solutions and melts, but does have limitations. When viscosity is
graphed as a function of shear rate, the plot can exhibit one of three morphologies. For
Newtonian fluids, the viscosity is constant and horizontal as a function of shear rate. For shear
thinning (pseudoplastic) fluids the visosity decreases with increaing shear rate, as structure is

18
broken down by the shearing forces. Far less common are shear thickening (dialatent) fluids
which increase in viscosity as a function of shear rate.

19
Chapter 2
Impact of Extended Sintering Times on Mechanical Properties in PA-12 Parts Produced by
Powderbed Fusion Processes (In Review)
Abstract
Additive Manufacturing provides many advantages in reduced lead times and increased
geometric freedom compared to traditional manufacturing methods, but material properties are
often reduced. This paper considers powder bed fusion of polyamide 12 (PA12, Nylon 12)
produced by three different processes: laser sintering (LS), multijet fusion (MJF)/high speed
sintering (HSS), and large area projection sintering (LAPS). While all utilize similar PA12
materials, they are found to differ significantly in mechanical properties especially in elongation
to break. The slower heating methods (MJF/HSS and LAPS) produce large elongation at break
with the LAPS process showing 10x elongation and MJF/HSS exhibiting 2.5x the elongation
when compared to commercial LS samples. While there are small differences in crystallinity
between these samples, the difference may be attributed to changes in the heating and cooling
rates of the LAPS samples.
Authors:
Garrett Craft1, Justin Nussbaum1, Nathan Crane1*, J. P. Harmon1
1University of South Florida, Tampa, FL 33620

20
Keywords:
Polyamide 12 (PA 12), Nylon 12, 3D Printing, Additive Manufacturing, Large Area Projection
Sintering, Laser Sintering, Semicrystalline, Amorphous
2.1 Introduction
Additive Manufacturing (AM) refers to processes whereby parts can be formed in three
dimensions from CAD files by selectively adding or binding materials without the limitations of
tooling or molds necessitated by conventional manufacturing techniques like injection molding
(IM) [14-17]. AM parts are formed in three dimensions from the sequential layering (Z-axis) of
material in two dimensions (XY plane) within the part bed. Laser sintering (LS) is a common
AM technology that uses a laser to sinter polymer particles in a powder bed. This laser is
scanned at high rates over the powder bed, fusing the material in a point-wise fashion. LS
generally provides good accuracy, rapid design to build times, and relatively good mechanical
properties[18, 19]. However, AM in general provides economic incentive versus traditional
manufacturing methods only for small to medium batches [20]. Typically, AM parts also exhibit
reduced strength when compared to traditional manufacturing such as injection molding
(IM)[18].
LS polymers are not selected based solely upon their end performance, but also on compatibility
with AM process constraints. One criterion is the presence of a supercooling processing window
in which there is a large gap between the crystallization temperature (Tc) and melting

21
temperature (Tm)[15, 21]. The semicrystalline polymer Nylon-12 (Polyamide 12, or PA12) is one
of the dominant materials used because it offers a large processing window (Figure 12) which
facilitates printing and because of this, PA12 represents approximately 95% of LS material[18,
22]. Polymeric part beds are usually maintained slightly below the Tm, minimizing the heat input
needed to reach the Tm and densify the polymer powder. Additionally, by maintaining a
temperature above the Tc, the sintered structure remains in an amorphous phase to retard
crystallization [15]. Uneven crystallization can cause part warpage and delamination of layers.
To remedy this, part beds are maintained within the processing window during the build process
and slowly cooled to room temperature when the build is complete.
Laser sintering uses a high power CO2 laser to heat polymeric powders. In order to
maximize build rate with a point source, the tightly-focused laser is scanned rapidly (~10 m/s)
exposing powder particles for ~0.1 milliseconds to heat each location of the part bed. However,
because heat travels relatively slowly in PA12 due to poor thermal conductivity of nylon and
even lower thermal conductivity in the powdered form, there is limited heat transfer to adjacent
particles. Under typical LS conditions, the spherulites of semicrystalline PA12 powder typically
do not completely melt [22-24]. LS part anisotropy is often related to the build orientation and
the effects of poor densification inherent with this point-wise construction. Short densification
time scales are used in industrial processes to optimize for speed and accuracy versus end part
properties [19, 20, 25, 26].

22
One useful process metric is “Degree of Particle Melt” (DPM). DPM relates the amount
of melted and re-crystallized material formed during a sintering process to the amount of original
un-molten material which did not sinter[23]. The presence of two endothermic melt peaks in a
DSC measurement implies incomplete sintering (low DPM), with the higher-temperature
endotherm corresponding to the unsintered core crystalline structure, and the lower-temperature
endotherm corresponding to the melted and recrystallized crystals formed during sintering [23,
27]. The PA12 PA 2200 (EOS GmbH) is reported to be solution-precipitated at high
temperatures with ethanol [22]. This processing method is intended to produce highly uniform
Figure 12
Stacked DSC thermograms of two PA12 powders (PA 650 and PA2202, sold by EOS GmbH) illustrating
the relative positions of Tc (144 and 148°C) and Tm (187 and 188°C) corresponding with the
processing windows of the powders. Heating rate of 20°C/min under nitrogen purge. PA 2202 is
similar to PA 650 but also contains a black pigment and displays an earlier Tc.

23
and highly spherical powder particles needed for optimal high resolution sintering, and is noted
for achieving high crystallinity (44% for EOS PA 2200, Dadbakhsh et al[22]).
Prior studies indicate that LS-produced parts characteristically display good strength, but
reduced ductility compared to injection molded (IM) parts. This is reportedly due to the rapid
cooling inherent to IM manufacturing resulting in lowered crystallinity, and the alignment of
polymer chains occurring from shearing forces during the injection process[19]. Injection
molded (IM) PA12 is reported to have an elongation at break (EaB) of ca. 200-300%, an ultimate
tensile strength (UTS) of ca. 66MPa and a Young’s Modulus of ca. 1500MPa[19, 28]. Whereas
LS PA12 shows comparable Modulus with a decreased UTS of ca. 45-50 MPa[1] and far lower
EaB of ca. 20%.
Another explanation for the dramatic reduction in ductility could be the presence of
porosity in the LS parts. Literature reports show that porosity often ranges from 3-6% for LS
material with myriad pore morphologies and dimensions possible [18]. Rouholamin et al
reported average pore dimensions of 20-25μm with laser wattages ranging from 12.5 to
25W[18]. The pore size remains rather constant regardless of laser power, with higher laser
wattages appearing to damage surface layers[18]. Reduced DPM and, in particular, the presence
of particle cores is cited as prominent mechanisms responsible for part failure[19]. Pores and
cores often reside between layers and manifest anisotropic properties due to the stratified nature
of their distributions relating to build depth and Z-axis layering of parts [19]. Hofland et al.
hypothesized that weak interlayer bonding is the cause of this variation [20]. Prior LS studies

24
have shown that increased DPM increases the tensile strength, Young’s Modulus and elongation
at break (EAB) [15, 17, 20, 23].
This study addresses the role of densification time and DPM in mechanical properties of
sintered PA12 parts. The mechanical properties of PA12 parts sintered at different timescales
using three different processes are compared. For controlled sintering at long timescales (1-5 s),
Large Area Projection Sintering (LAPS), a novel form of AM developed at the University of
South Florida is utilized. LAPS uses a visible light projector to heat the entire desired shape in
the XY-plane simultaneously (Figure 13). By allowing even melting through moderate heating
and extended timespans, LAPS provides additional sintering time for the powder to melt and
densify into the desired cross section. This increased time reduces thermal gradients both across
and within the part bed. Increasing the timescales for the heating process allows for greater
transfer of heat from the surface layers to those below, allowing for greater fusion between
layers[19]. By processing an entire 2D area rather than a point, effective build rates can be
maintained despite the longer heating time.

25
We seek here to characterize the mechanical properties of parts built by LAPS and compare
them to parts produced by commercial polymer powder bed fusion processes via LS and Multi Jet
Fusion (MJF) technology using similar materials. MJF technology is a newly introduced
technology developed by HP Inc. and is similar to the high speed sintering (HSS) process [29].
MJF and HSS both use inkjet printing technology to print a black dye into the powder bed to create
the desired cross section. A linear heat lamp is then scanned over the powder bed. The radiated
heat is readily absorbed by the areas with black ink, sintering those particles together while
unprinted powder reflects away most of the light energy and does not melt. Longer exposure times
are utilized in MJF/HSS (~1s). which may contribute to the increased elongation at break (EaB)
[30].This work seeks to compare these powder bed fusion processes of varying exposure times (<1
ms to 5 s) and their effect on mechanical properties. LAPS, MJF and HSS exhibit superior
mechanical properties
Figure 13
Large Area Projection Sintering (LAPS) schematic. The heated metal plate maintains part
bed temperature (measured via FLIR infrared camera).

26
in the form of EaB, and LAPS components exhibit higher ultimate tensile strength (UTS)
compared to commercially produced MJF and LS components.
2.2 Experimental Methods
2.2.1 Sample Preparation
The University of South Florida’s has developed a new AM technology called Large
Area Projection Sintering (LAPS). LAPS is a novel AM technology that provides area-wise
sintering method capable of controlled exposure times, light intensities and part bed
temperatures. New layers of powder are spread with a counter-rotating roller with a spread
density (0.51 g/cm3) near to that of the tapped density (0.54 g/cm3). Power of the projected light
was 5.5 W over a 2.1 by 1.6 cm area, providing an average light intensity of 1.64 W/cm2 for five
seconds. This provides effective area-based heating capable of extending exposure times without
sacrificing overall build speeds. LAPS parts were produced from PA2202, a carbon black doped
PA12 (EOS GmbH), which is a powder manufactured for the laser sintering industry. The
powder was exposed to an open atmosphere but preheated by a heated bottom plate maintained
at 170 °C. The top surface was monitored by an SC4000 FLIR medium wave infrared camera.
An infrared heat lamp was used to heat the top surface to 170 °C prior to each sintering
exposure. Because the build chamber is not completely enclosed, parts may cool below the
recrystallization temperature while spreading the next layer. To see the impact of cooling rates,
quenched LAPS PA 2202 samples were produced by heating LAPS components in a furnace at
190 °C for 10 minutes then rapidly placed into room temperature water. Slow cooled LAPS PA

27
2202 samples were produced by reheating to 190 °C for 10 minutes followed by furnace cooling
at 1°C/min.
LS parts were produced by two different sources. One batch of LS samples was
fabricated by ProtoLabs on a 3D Systems sPro 60 using PA 650 which is a PA12 powder similar
to PA2202 but without the carbon black doping. A second subset of LS tensile parts were
produced by the University of Sheffield on their industrial EOS Formiga P100 laser sintering
system. Their typical processing conditions [31] were selected which used 50% virgin and 50%
recycled PA2000 powder. PA2000 powder is also a white PA 12 powder and similar to the PA
650 and PA2202, all of which are produced by EOS. Lastly, Multi Jet Fusion (MJF) components
were produced by Engineering Manufacturing Services (EMS) on an HP Jet Fusion 3D 3200.
The material used in the MJF components is also a PA 12 powder which the data sheet refers to
as as high reusability powder optimized for AM [32]. Parts for all systems were produced in the
same orientation, where the thickness of the part is aligned with the Z axis of the machine.
2.2.3 Rheology
A TA Instruments AR 2000 rheometer was used in steady shear mode to characterize
EOS GmbH PA2202 powder. Powder stored at ambient conditions were compression molded
into cylindrical disks of 25mm diameter at ca. 180°C and 6 metric tons force. These storage
conditions best represent the powder used in the LAPS printing process. A shear ramp from
0.001s-1 to 125s-1 at a constant gap of 500µm was used to determine the zero shear plateau region
of the compressed powder cylinders at 200°C. A shear rate from well within the zero shear

28
region was chosen of 0.1s-1 for isothermal 190°C, 230°C and 260°C peak hold experiments at
constant gaps of 1000µm to determine the viscosity as a function of time.
2.2.3 Differential Scanning Calorimetry
A TA Instruments Q20 was used for differential scanning calorimetry (DSC)
measurements. Samples of powder and parts were placed in hermetically-sealed DSC pans with
masses of 10.0mg ± 0.5mg. Temperature ramps were conducted under nitrogen purge of
50mL/min from 25°C to 250°C at 20°C/min. A theoretical heat of fusion for LS PA-12 of 209.3
J/g for a 100% crystalline sample is used for DSC calculations [14]. The first heat cycle was
utilized for all calculations. Exterior unsintered material was lightly ground off with a rotary tool,
and clippers were used to remove small pieces at orthogonal orientations to layering for best
thermal contact with the bottom of the hermetically sealed DSC pan.
2.2.4 Polarized Light Microscopy
Printed parts of various geometries were cut to reveal the interior structure which was
then sectioned via microtome to approximately 5 microns thick and mounted to glass slides. A
Leica DMRX light microscope was used for characterization.
2.2.5 Tensile Testing
A MTS® 858 Table Top servohydraulic tensiometer controlled via a MTS® FlexTest SE
controller was used to measure tensile properties. Three samples weretested for each additive
technology. The MJF and the LS samples provided by Protolabs meet ASTM standard 638-10
type IV specimens while the LS samples provided by the University of Sheffield used type I
specimens. The LAPS components were scaled down to the maximum size capable in the

29
prototype LAPS system; providing a gauge length of 4 mm and an extended gauge width
(~4.5mm) to provide a larger measurable force. All of the test samples including the LAPS
samples were approximately 1 mm thick. Crosshead speed was 1mm/min. All tests were
conducted at room temperature.
2.2.6 Density Measurments
To calculate the density of the parts, ~1 cm3 cubes were created. Archimedes’ principal
was used to determine the density, where the difference in weight of an object in air compared to
an object submersed in a liquid of a known density allows the density of the solid to be
identified. For these experiments anhydrous 2-propanol was used because of its large difference
in density from PA12 parts.
2.3 Results and Discussion
2.3.1 Rheology
PA12 polymers for laser sintering often contain reactive chain ends unless the polymer is
modified to enhance recyclability. These end groups can react at elevated temperatures,
particularly above the Tm, to increase molecular weight which has a large effect on viscosity for
a linear polymer. The effects of molecular weight increases on viscosity for PA12 powders have
been confirmed by gel permeation chromatography studies, showing an increase in molecular
weight for aged powders which have undergone postcondensation [22]. Postcondensation
phenomena have been noted by a number of authors for EOS GmbH PA2200 [21, 22, 33, 34].
EOS GmbH PA2202 powder exhibited an initial viscosity of 660 Pa·S and within 10 minutes the
viscosity increased to 800 Pa·S at 190°C. The powder reached a viscosity of approximately 1300

30
Pa·S after 30 minutes. Similarly, the viscosity increased to 1900 Pa·S at 230°C, and 2760 Pa·S at
260°C after approximately 30 minutes (Figures 14 & 15). These data confirm that PA2202
powder is not modified to reduce postcondensation reactivity and remains reactive at elevated
temperature.
Figure 14
Rheological data for PA 2202 PA12 powder. Shear ramp to determine zero shear
plateau.

31
2.3.2 Differential Scanning Calorimetry
Unsintered virgin PA12 powder for both PA 650 and PA 2202 show a single, high
temperature, melt endotherm with a percent crystallinity of 42.7% and 47.6%, respectively (Table
1).These relatively large percent crystallinities for a semicrystalline polymer are reported to be the
result of the thermal history obtained from the PA12’s fabrication process[22]. The crystals of
PA12 can exist in two forms, alpha and gamma. Virgin PA12 powder exists in the alpha (α)
monoclinic form. Upon melting, these regions form a gamma (γ) (pseudo)hexagonal form due to
faster cooling rates [19, 22, 35]. These two crystal forms can interconvert above the glass transition
temperature or
Figure 15
Rheological data for PA 2202 PA12 powder. Zero shear viscosity as a function of
time at 190°C, 230°C and 260°C for 30 minutes.

32
during tensile straining[14]. The virgin PA12 powders tested here exhibit an onset melting point
of ca. 180°C with a peak at ca. 190°C, falling within the range reported by Dadbakhsh for PA
2200[22]. A number of authors have reported that there is often incomplete melting of the powder
resulting in two visible endotherms in DSC after sintering [14, 19, 22, 23, 27].
Name Onset Tm (°C) Peak Tm(°C) %C
PA 2202 Virgin Powder 181.4 190.5 47.6
PA 650 Virgin Powder 182.6 190.0 42.7
EMS MJF (PA 12) 174.1 185.7 32.6
Protolabs LS (PA 650) 180.3 192.5 36.8
Sheffield LS (PA 2200) 173.3 186.3 30.1
USF LAPS (PA 2202) 168.9 186.0 31.8
USF LAPS Slow Cooled (PA 2202) 169.7 185.7 26.1
USF LAPS Quenched (PA 2202) 170.9 182.7 23.1
This two-endotherm pattern is seen in the Protolabs LS parts with the lower temperature
endotherm reduced to a small shoulder of the higher temperature endotherm (Figure 16). This
pattern suggests incomplete sintering of the PA12 polymer as evidenced by significant residual
core material remaining in the finished part in Figure 17. The higher temperature endotherm is
elevated by a few degrees above that of the viriginpowder. This may be evidence of molecular
weight increase or light chemical crosslinking due to time spent at elevated temperatures typically
seen with laser sintering, and reported in the literature[19, 22, 33]. Sheffield’s LS parts exhibited
Table 1
DSC tabulated data comparing virgin powder to MJF, SLS and LAPS build processes. A
theoretical heat of fusion of 209.3 J/g for a 100% crystalline LS PA12 sample is used.

33
a broad and lower temperature peak Tm (186.3°C) compared to ProtoLab’s LS parts (192.5°C).
There is no evidence of a lower melting endotherm in the Sheffield sample, and it displays a
morphology similar to those yielded by LAPS and MJF parts with few or no unmelted cores
visible.
Parts produced with lower heating rates (LAPS and MJF) yield thermograms with a single,
broad, endotherm centered about 185°C with onset points ranging from 171 to 174°C (Figure 16).
This suggests that the particles completely melted during sintering accounting for the absence of
the higher temperature endotherm seen in the Protolabs LS samples and virgin PA12 powder.
Figure 16
DSC thermograms of LAPS (PA 2202), quenched LAPS (PA 2202), slow cooled LAPS (PA 2202), EMS MJF
(PA12), Protolabs LS (PA 650), Sheffield LS (PA 2200), and virgin PA 2202.

34
All parts show significantly reduced crystallinity relative to the virgin powder, with the
Protolabs LS part showing the highest (36.8 %) of the technologies evaluated here, despite starting
with the lowest initial crystallinity. This is likely due to the unmelted cores. The other samples
(Sheffield LS, MJF, LAPS) have crystallinity between 30-33%. The LAPS-produced quenched
PA2202 part displayed the lowest percent crystallinity of all (23.1%) owing to the extremely rapid
cooling rate post-build. The LAPS-produced slow cooled part displayed a crystallinity of 26.1%
which is intermediate between the crystallinities of typical and quenched LAPS samples. This
interesting behavior may be due to carbon black pigment particles playing a role in the spherulite
nucleation and growth, and will be an interesting area of future research. Alternatively, the
increased time spent above the Tm in both reheated samples may have increased the molecular
weight with postcondensation of reactive chain moities as suggested by the viscosity data in
Figure 15. An increase in the molecular weight of a semicrystalline polymer can cause a delay in
crystallinization. While it is difficult to quantify a DPM due to the small size of the lower
temperature endotherm of the ProtoLab parts, the predominate endotherm indicates a low DPM.
A significant fraction of the spherulites present in the Protolabs parts were not melted during
sintering.
2.3.3 Polarized Light Microscopy
As the micrographs depict (Figure 17), the Protolabs LS (Figure 17A) parts show
incomplete melting evidenced by the presence of residual core material and significant number of
large pores consistent with the DSC thermograms as discussed above. This observed correlations
of low DPM and high porosity is reflected in the literature on LS[23]. The cores appear to be

35
stratified and repeat at ca. 200µm intervals through the sample. It is likely that these cores are
stratified along the Z-axis of the build part with highest core density occurring farthest from the
laser beam due to low heat flow and resultant lower temperature of the polymer powder at that
distance. The Sheffield LS parts (Figure 17B) show little in the way of residual cores which is
corroborated by DSC data with a broad, low melting endotherm, corresponding to high DPM.
Further, it is evident from the micrographs that pores are present which fully transcend the
roughly 5µm section thickness in both the Protolabs LS (10-100µm pore diameter) and Sheffield
LS (50-130µm pore diameter) parts. The pores may result of vapor (oligomeric polyamide or,
residual solvent), large defects in the spread powder bed, or insufficient sintering time/temperature
to achieve sufficient melt flow[25]. Vasquez et al reported that LS temperatures can reach >320°C
Figure 17
Approximately 5μm thickness microtome micrographs from cross-polarized light at 100x
magnification. Images A through E are shown with the Z-axis vertical. A) Protolabs LS PA 650. B)
Sheffield LS PA 2200. C) EMS MJF. D) Fully sintered LAPS PA2202. E) Undersintered LAPS PA2202.

36
where mass loss is detectable by TGA[15]. Pores decrease strength and modulus but have a
particularly deleterious effect on ductility.
The micrograph of the multi-jet fusion (MFJ) part (Figure 17C) reveals more or less
complete sintering with little in the way of detectable cores as expected from the DSC
thermograms with only a single, broad, melt endotherm centered at a lower temperature. The wavy
dark regions likely originate from the dye used in the MJF process, perhaps moving at the interface
as the molten powder flows during sintering. Very few pores were detectable by microscopy, and
they appear to be far smaller (ca. 50µm pore diameter) and more circular in cross section than
those found in the LS parts.
The fully formed LAPS parts show neither residual core material nor pores within the
interior of the sample (Figure 17D). The lack of detectable cores is reflected by similar
thermogram patterns of the MJF sample. However, at the edges of the part (XY-plane) some core
material is present in the form of loosely attached powder from the powder bed (which can be
visualized in the micrograph). For comparison, a purposefully undersintered (three second
exposure) LAPS part (Figure 17E) shows the presence of some cores and pores which transcend
the entire thickness of the cross-section. These micrograph observations were confirmed by the
density measurements. The density of ProtoLabs parts was 0.98 g/cc (4% lower than LS datasheet
value for PA 650 LS material of 1.02g/cm3 [36]) while the LAPS parts and MJF parts had a density
of 1.03 g/cm3. If 1.03 g/cm3 is full density, this would equate to 5% porosity in the LS parts
comparable to literature reports [18]. The Sheffield laser sintered parts had a density of 0.99 g/cm3
which is as expected, showing a lower porosity than the ProtoLabs LS samples but still below the
37
density of the MJF and LAPS parts. The density of injection molded PA12 is reported as ranging
from 0.97g/cc to 1.03g/cc for comparison[18].
2.3.4 Tensile Testing
Tensile testing (Figure 18) revealed that even though each process utilizes very similar
materials, the mechanical properties are highly dependent on the processing conditions. The
coupons created by LS (ProtoLabs and the University of Sheffield) exhibited the lowest
elongation at break (EaB) of 11 and 16% respectively, but had a similar ultimate tensile strength
(UTS) (34.5MPa and 38.7MPa) as the coupons created by MJF (35.3MPa). The coupons created
by LAPS process showed a significantly improved UTS (46.3 MPa) and EaB (110%) by
comparison. The LAPS UTS values are comparable to LS PA 2202 material data sheet values
and show significantly increased EaB approaching that seen for IM nylon (24% PA 2202
datasheet, 110% LAPS PA 2202, 200-300% for IM)[1]. During testing the LAPS tensile coupons
exhibited ductile failures in which the samples slowly tore apart. Despite large variation in EaB
(probably due to the largely manual manipulation of the print process in the prototype
implementation), the LAPS samples were clearly superior in EaB to datasheets values of the
same material processed by LS.

38
Figure 18
Tensile testing stress-strain curves in triplicate for the LS, MJF, and LAPS components. Note the
higher strength and vastly improved strain to failure which typically occurred in a slow tearing action
for the LAPS parts.

39
Sample
Young's
Modulus
(MPa)
Ultimate Tensile
Strength (MPa)
Elongation at
Break (%)
LS (data sheet) PA 2202 1850 49 ± 1 24
LAPS PA 2202 1069 ± 248 46.3 ± 2.6 110 ± 27
Slow Cooled LAPS PA 2202 1498 ± 220 42.2 ± 2.0 52 ± 2
Quenched LAPS PA 2202 580 ± 150 36.5 ± 8.5 273 ± 6
IM-Grade PA126, 14 1500 66 200-300
EMS MJF PA12 1080 ± 80 35.3 ± 0.9 27 ± 3
LS (data sheet) PA 650 1700 48 24
Protolabs LS PA 650 1270 ± 10 34.5 ± 0.1 11 ± 1
Sheffield LS PA 2200 1350 ± 190 38.7 ± 0.5 16 ± 2
Since the LAPS parts produced modulus and UTS values comparable to datasheet values,
it is likely that the other processes may yield similar UTS if sufficiently optimized. However,
neither the datasheets, the LS (ProtoLabs and Sheffield) nor MJF parts exhibited EaBs
comparable to LAPS. This suggests a fundamental difference in the mechanical properties due to
the different processing conditions. Further study is needed to determine what the key processing
differences may be, and if they can be replicated in LS and MJF/HSS technologies.
Interestingly, the LAPS modulus remained comparable to the LS parts showing that stiffness was
not sacrificed for toughness.
Table 2
Mechanical data of the PA 12 powders and printed parts. PA 22002 is cited as behaving comparably
to PA 2200 according to EOS GmbH[1].

40
The quenched and slow-cooled samples provide some indication of the impact of cooling
on the part properties. EaB of the standard LAPS samples is intermediate between the slow
cooled and quenched samples, but all are above the LS and MJF materials. DSC data shows
(Table 1), the quenched samples display a percent crystallinity of only 23% compared to the
range displayed for the remainder of the parts of ca. 30 to 37%. Crystalline domains normally
serve as physical crosslinks, tying together adjacent polymer chains and reducing their freedom
of movement during imposed strain. Strength of the quenched samples was reduced to that of
the LS components while elastic modulus was reduced by half. The slow cool sample showed
lower crystallinity than the original LAPS samples, but increased modulus of elasticity and
comparable strength. This may be explained by an increase in MW during the hold at 190 C and
slow cool increasing strength while limiting crystallinity. There may also be affects of the
carbon black in the black PA12 on the nucleation and growth of spherulites.
The reduced EaB of LS PA12 compared to IM is thought to be the result of increased
crystallinity and reduced chain entanglement in LS parts[19]. Residual porosity likely plays a role
as well. Pores degrade UTS, Young’s Modulus, and elongation at break[18]. Both LS printing
processes displayed porosity in optical images. High scan rates are used in LS to reduce build time
at the expense of complete melting which reduces tensile properties in some LS conditions[37].
Prior efforts were unable to eliminate porosity by adjusting standard LS processing
conditions[18]. Conversely, the MJF parts exhibited complete sintering albeit with a few, relatively
small, pores and the LAPS parts showed neither detectable cores nor porosity. Both MJF and LAPS
use substantially longer sintering times. This suggests that LS may be limited in producing parts
of the highest mechanical performance due to the process’s timescales. It is notable that the LS
processes typically utilize a mix of virgin and aged PA12 powder for peak properties and improved

41
utilization rates while the LAPS parts were made with virgin powder. Further work is needed to
assess the importance of the thermal history of the powder on LAPS parts.
The increased timespans (seconds) at elevated temperature may be critical to allow for
complete melting and greater viscous flow without the localized excessive heating required in laser
scanning. The high peak temperatures inherent to LS could induce significant degradation or cross
linking. It is believed that the reduced particle boundaries due to complete core melting and
entanglement of neighboring amorphous regions during the extended molten build times of LAPS
printing allows the powder to generate the improved mechancal properties of parts. Amorphous
regions of the semicrystalline polymer are responsible for the observed ductility of the parts, and
crystalline domains lock the chains together at larger scales to maintain modulus and UTS. Bourell
et al. posit that boundaries between spherulites exert the largest influence over part ductility [19].
Further, it is postulated that the rather quick cooling incurred by LAPS-printed coupons between
layers and post-build limits spherulite size, producing small and numerous spherulites and
increasing ductility versus the LS coupons which are slowly cooled to prevent warpage.
Dadbakhsh et al. propose that the mobility of the amorphous regions which link crystalline
domains influences ductility, with the size and number of spherulites serving to “lock” these
amorphous regions together[22]. This is supported by the tensile data for the LAPS quenched parts
with reduced crystallinity demonstrating high EaB but low Modulus. To further explore the effects
of entanglement and spherulite size would require a modified LAPS system which is capable of
precise controlled cooling post-build. These results show that cooling rates may have a strong
impact on mechanical properties. With improved understanding of these relationships, future

42
systems might be able to tune the stiffness and toughness of parts or even regions of a part for
specific application requirements.
2.4. Conclusion
Different methods for powder bed fusion of PA12 powders have been compared. The
results show that the processes typically produce similar levels of crystallinity, but that
mechanical properties differ significantly between methods—especially in the elongation at
break. LAPS samples also demonstrate greater mechanical strength than the other processes. The
samples shown do differ in their levels of porosity with the lower porosity samples having higher
elongation. Additionally, cooling rate appears to play a significant role. The LS and MJF/HSS
processes maintain a high temperature bed to avoid recrystallization during sintering and cool
slowly after process completion. Both processes also show reduced porosity and increased
elongation at break. However, the LAPS process as currently implemented may not maintain the
temperature above recrystallization during processing and cools more quickly at the end of
fabrication. This may contribute to microstructure differences that increase elongation at break.
Further work is needed to study more closely the impact of cooling rates on the mechanical
properties of PA 12 parts produced by powder bed fusion.

43
Acknowledgements
Support for this work was provided by the National Science Foundation through award
CMMI-1563037. We’d like to thank Dr. Laura Blair of the USF Health Byrd Institute for her
generously allowing us to use her cross sectioning and microscopy equipment. We’d also like to
extend our gratitude to the University of Sheffield, Dr. Neil Hopkinson for fabrication of the LS
parts on the EOS Formiga P100 laser sintering system.
44
Chapter 3: Analyzing Polyethylene Glycol/ Polysaccharide Interactions of Clinical
Significance
3.1 Introduction
Clinicians at the James A. Haley Veterans Hospital noticed a polyethylene glycol (PEG)
incapability of starch-thickened drinks. These thickened items became dangerously inviscid for
patients suffering from dysphagia when mixed with PEG 3350 [38]. PEG 3350 is often
prescribed as a laxative in skilled nursing facilities due to a high prevalence of constipation (ca.
70%)[38]. Pure PEG 3350 (3350MW) trademarked as MiraLAX® and is among the most
common of laxatives used. PEG 3350 is a safe and efficacious osmotic laxative with little in the
way of side effects, and differs from other laxatives such as lactulose and sorbitol due to its
larger molecular weight and polyethylene oxide ether backbone (Figure 19).

45
Dysphagia is of near universal concern in skilled nursing facilities (SNFs) with nearly
60% of residents affected by the condition [38-40]. Geriatric patients, those suffering from
certain injuries, Parkinson’s disease, or patients suffering from stroke or head and neck cancers
are prone to developing the condition [38, 39, 41]. For patients exhibiting dysphagia, muscular
control is affected leading to the possibility of food aspiration and pneumonia when the
swallowing process is improperly coordinated. Normally, musculature times the passage of a
food bolus from the mouth and tongue, then to the pharynx, then the larynx, and finally into the
esophagus during the swallowing process [38, 39]. Unfortunately, aspiration-related pneumonia
incurs up to 59% mortality rates within a year time span [38]. Additionally, long-term
Figure 19
Structural comparison of PEG, sorbitol and lactulose

46
complications of dysphagia including malnutrition and dehydration [38, 39, 41] are often
experienced by patients with the disorder.
To combat dysphagia, drinks are often mixed with hydrocolloids to thicken them to a
viscosity which slows the speed of the food bolus as it passes into the alimentary canal, allowing
the patient more time to gain control during swallowing [39]. Common food thickeners are
polysaccharides such as starches and xanthan gums (XG). These hydrocolloids thicken liquids
via two methods, namely swelling into dispersions for starches, and crosslinked gelation for
gums [41, 42]. Regardless of mechanism, these thickeners ultimately form structured
frameworks which resist shearing in the thickened food and thus slow the food bolus’ passage to
a rate that a dysphagia patient can safely handle during swallowing.
Most literature either focuses on analyzing viscosity profiles of various thickeners on their
own, such as seen in the works of Moret-Tatay et al[41], O’Leary et al[39], and Dewar et al[40],
or characterizing interactions of plasticizers with starch thermoplastics such as that by Van Soest
et al (1994, 1995)[43, 44], Smits et al (1994, 2001, 2003)[45-47], Perry at al[48], Kruiskamp et
al[49] and Kim et al[50]. Our previous work [38], while merely a note quickly communicating the
dangerous interaction of PEG 3350 and starch-based thickeners to clinicians, inspired a deeper
understanding of the PEG-starch interaction and motivates our work here. It was also shown that
PEG 3350 did not compromise the viscosity of xanthan gums, another very popular food thickener
[38].

47
Thus, in the following chapters starch and XG solutions with various molecular weight
PEGs will be analyzed in an effort to understand the mechanism behind the observed biphasic
syneresis first observed by clinicians, with rheological analysis of starch thickeners as a function
of various PEG molecular weights, and to observe the response of XG under the same
conditions. Various PEG molecular weights (300, 1000 and 3350MW) will be assayed to
determine if the observed starch syneresis is a function of size and the -OH end group: ethylene
oxide ratios. Thick & Easy® (nectar consistency, Hormel™) starch-based thickeners will be
used as the starch source. Hormel™ incorporates maltodextrin in their thickener formulation.
Maltodextrin is partially hydrolyzed starch which serves to give better palatability by simulating
fatty substances [39, 51]. Simply Thick® (nectar consistency) will be utilized as the XG source.
Steady shear and oscillatory rheology will be performed on these systems as functions of PEG
molecular weight measured in triplicate, with two groupings: the first set of data will result from
these starch and XG systems after five minutes of mixing until consistent data is obtained within
the first hour of mixing. The second set of data will consist of analyzing these systems after 24
hours of sitting undisturbed at room temperature. ATR-equipped Fourier-transformed infrared
spectroscopy will be used to characterize shifts in crystalline and amorphous domains in aqueous
solutions upon addition of various molecular weight PEGs.
3.2 Starch and Xanthan Gum Structure
Starch-based thickeners (usually granulized maize starches) are very commonly used, and
are members of the hydrocolloid family (hydrophilic colloids) [52]. These thickeners are often
pre-gelatinized to form thickening dispersions upon addition to water in order to thicken liquids.

48
These dispersions differ from true gels as there are no chemical crosslinks or junction zones
between chains, and are otherwise maintained by disordered chain entanglement and hydrogen-
bonding[52]. Starch itself is composed of two polysaccharides, amylose and amylopectin
(Figure 20). These are both polysaccharides of the α-1,4- D-glucose monomer. Amylopectin is a
highly branched structure with α-1,6 branches every 15-30 units[51], whereas amylose is largely
linear. Starches come from a variety of sources, all with varying crystal polymorphs, and
amylose: amylopectin ratios [44, 45, 53, 54]. Native starch granules are largely insoluble in
water[51], and consist of concentric layers of varying semicrystalline and amorphous
character[48, 55, 56].
Fig 20
The polysaccharide components of starch, amylose and
amylopectin.

49
Unheated starch granules are highly complex structures: the amorphous core is comprised
of disordered amylose and amylopectin polymers, with the size of the core proportional to the
amylose content of that particular starch source[56]. These cores vary from ca. 1 µm to 100µm,
and are surrounded by alternating rings of amorphous and semicrystalline domains of
amylopectin[56, 57]. Because amylopectin is branched it forms regions of differing properties.
The branching regions of amylopectin, or B-type amylopectin, form the amorphous regions of
the growth rings, while unbranched regions, or A-type amylopectin, form the crystalline regions
as they associate into clumps of helices [57]. Amylose is thought to reside within the amorphous
domains of amylopectin or perhaps even co-crystallize within the crystalline lamellae[57].
Upon heating starch granules undergo water imbibition whereby they swell, with water
molecules forming new hydrogen-bonds and ultimately dissociating the amylopectin chain-chain
hydrogen bonding, starting from the amorphous regions and ending with the higher-density
crystalline regions[51]. If heating is continued, the formally reversible swelling process
transforms into an irreversible gelatinization of the material with collapse of much of the long-
range order of the native granule resulting in the characteristic loss of its birefringence[51, 56].
This process sees leaching of amylose chains and smaller amounts of amylopectin into solution
from their parent granules. Upon cooling, the system undergoes retrogradation to form ordered
structures which differ from the native granules via the formation of new interchain hydrogen
bonds[51, 56]. The resulting material forms a dispersion in aqueous solution, with helical
amylose chains forming a three-dimensional elastic system with interspersed swollen
amylopectin chains[51]. This resulting starch network is ultimately maintained by hydrogen-
bonding amongst amylose helices in addition to chain entanglement, and thus any interruption of

50
the hydrogen-bonding can destroy or otherwise damage the framework, causing expulsion of the
solvent (water) via syneresis. Starches which have higher amylopectin contents exhibit higher
viscosity, whereas those with higher amylose contents exhibit networks with higher strength
[51]. As can be seen from Figure 21, as the molecular weight of PEG increases, syneresis
becomes more advanced with larger amounts of water expelled during framework collapse.
Figure 21
20mL scintillation vials showing degrees of syneresis with differing starch and
various PEG molecular weights after 24 hours.

51
Xanthan gum (XG) is a bacterial heteropolysaccharide (Figure 22) produced
commercially via fermentation of Xanthomonas campestris bacteria [58]. XG can exist in one of
two conformations, a double stranded helix displaying rigidity, and a flexible random coil, as a
function of both temperature and ionic strength [58, 59]. XG’s backbone is analogous to
cellulose as it is composed of β-D-glucose monomer repeat units. Every two repeat units the
backbone is appended with a charged trisaccharide consisting of one D-glucuronic acid and two
D-mannoses [58, 59]. The D-mannose saccharides are additionally either acetylated or
substituted with the sodium or calcium salts of a pyruvate units depending on location [58]. XG’s
helical to coiled transition is not entirely thermally reversible [59], with many commercial gums
being heat treated previously and do not re-nature upon cooling. This conformational transition
appears to be strongly influenced by temperature and ionic strength of the solution, with lower
temperatures favoring the helical structure and higher temperatures favoring the coiled
conformation [59]. Importantly, XG solutions are gel-like at lower temperatures [59].

52
3.3 Materials
PEG 300 and PEG 1000 were obtained from Fluka. PEG 3350 was obtained in the form
of MiraLAX® (Bayer™). Polyethylene glycols were dried for 24hours at 60°C in a vacuum oven
before use to ensure dryness.Thickeners Thick & Easy® nectar consistency (Hormel™) and
Simply Thick® nectar consistency were both used as received.
Fig 22
Structure of Xanthan gum

53
Chapter 4: Dynamic Rheology of Starch and Xanthan Gum Solutions as functions of PEG-
MW
4.1 Introduction
Dynamic (oscillatory) rheology is an ideal technique for the careful probing of
architecture in polymeric systems as it is gentle, with the capability of applying thousandths of a
pascal of force with precise control of shearing rates, and can thus measure responses without
irreversibly destroying delicate polymer frameworks. While starch and XG aqueous dispersions
are delicate, they do exhibit zero-shear plateaus (η0) which are Newtonian in behavior since the
frameworks can reform at rates matching or exceeding low shearing forces[52]. Once these
shearing forces reach a critical rate, a power law region of shear thinning behavior occurs where
the framework is destroyed faster than the entanglements can form[52]. It is in this region where
shear rates typical of swallowing occur, with �� 50s-1 cited by the National Dysphagia Diet Task
Force as being most representative of the average swallowing process [38]. Under higher shear
rates chain entanglements cannot form fast enough to maintain an elastic framework and the
entire system thins-down to its minimal viscosity, termed the infinite shear viscosity (η∞)[52] in
the form of another Newtonian plateau.
The nature of these rheological profiles can provide insight into what is happening to the
starch framework under various conditions. For example, where the G` (elastic energy recovery)
and G`` (viscous energy loss) crossover occurs is the point where liquid-like behavior (flow)

54
dominates the system and elastic recovery becomes less prominent implying a breakdown of
structure. Systems with G`` domination cannot elastically store all of the applied energy from the
shearing force, as most of the shearing force generates viscous flow resulting in energy lost as
heat. Likewise, the inflection point of the phase angle increase during a stress sweep experiment
and is reflective of the region where the elastic structure of the thickener breaks-down. Thus, it
can be thought of as being related to the amount of force (stress) needed to destroy the
framework and obtain viscous flow behavior domination.
4.2 Methods
Rheological samples were prepared by making 0.007M solutions of the various
starch/XG PEG solutions so as to increase the viscosity to levels the rheometer and its geometry
can consistently measure. A TA Instruments AR 2000 Rheometer (Figure 23) equipped with
ETC (Environmental Testing Chamber) was used under constant gap conditions of 500µm and
liquid nitrogen used to achieve isothermal conditions of 25.0°C. Oscillatory stress sweeps
probing the range from 0.05 to 250.0 Pa at 1Hz frequency were employed. Rheological data were
collected continuously within the first three hours of mixing to allow for structural equilibration,
with the last three data points which showed consistent data being chosen for averaging.

55
Fig 23
TA Instruments AR 2000 rheometer equipped with 25mm parallel
plate geometry and an Environmental Testing Chamber (ETC)

56
4.3 Dynamic Rheology
The phase angle represents the lag between the measurements of complex stress or
complex strain as applied in sinusoidal patterns of constant amplitude. For the limiting case of a
Hookean elastic solid, the phase angle is 0° as there’s no lag between the application of a stress
and the measurment of a strain, or vice versa. As a material becomes increasingly more liquid-
like and experiences viscous flow, the phase angle increases as energy which enters the system is
lost as heat and results in a time-depedent delay in signal measurment during viscous flow.
Unstructured liquids show phase angles greater than 90°, with visoelastic materials falling in
between these two extremes.
It can be seen through rheological analysis that the molecular weight of PEG affects the
structure of the starch dispersions in solution. As the PEG molecular weight increases, the
elasticity of the thickened solution decreases. In phase angle measurments as functions of
oscillation stress, the phase angle increases as elasticity decreases. As Figure 24 shows, the
beginning phase angle for each starch-thickened sample remains relatively constant at the lowest
oscillation stresses of 0.1 to 0.05Pa. This range represents the elasticity of the starch framework
with minimal external force applied for measurment, and minimal disturbance to its structure. As
the oscillation stress is ramped the phase angles rapidly increase after an onset point, which
represents the amount of force needed to begin break down the polymer architecture.
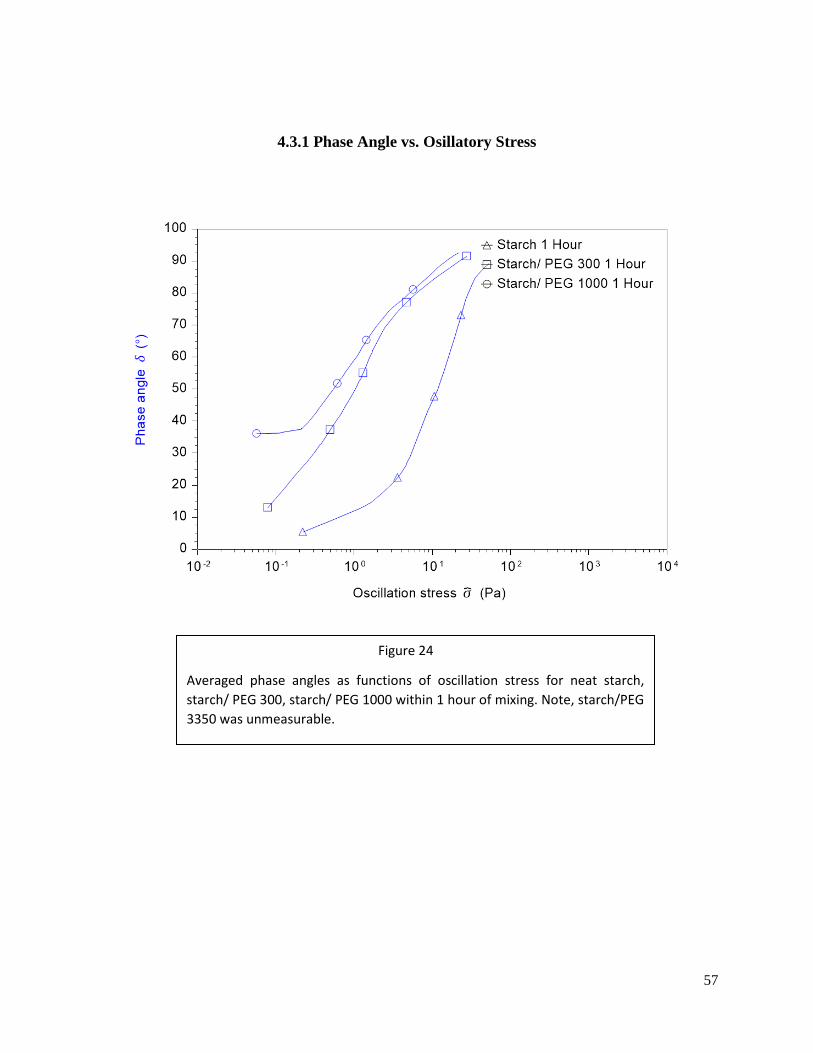
57
4.3.1 Phase Angle vs. Osillatory Stress
Figure 24
Averaged phase angles as functions of oscillation stress for neat starch,
starch/ PEG 300, starch/ PEG 1000 within 1 hour of mixing. Note, starch/PEG
3350 was unmeasurable.

58
Neat starch showed a phase angle onset of ca. 6.87Pa from a beginning phase angle of ca.
9.2°, whereas starch with 0.007M PEG 300 had an onset of only 0.28Pa from ca. 15.9°. Starch
with 0.007M PEG 1000 had an offset of 0.21Pa from ca. 37.6°. These data imply that it takes
less shearing force to disrupt the framework as PEG moleclar weight increases. Weakened
frameworks are less able to resist shearing forces or strains before flowing, as the elasticity
Figure 25
Averaged phase angles as functions of oscillation stress for neat XG, XG/ PEG
300, XG/ PEG 1000 and XG PEG 3350 within 1 hour of mixing.

59
usually provided by entanglements and hydrogen-bonding are more easily destroyed. However,
the XG networks appear relatively uninfluenced by PEG molecular weights and show nearly
identical inflection points as functions of osciallation shear for all samples (Figure 25).
Starch and XG-thickened systems were then left for 24 hours at room temperature
without mixing to allow time for the complex frameworks to form. It can be noted from Figures
26 and 27 that these systems started with lower phase angles implying more elasticity, and more
completely formed frameworks than in those which were tested within 1 hour of mixing. These
samples likewise mirrored the trends exhibted by the previous group, summarized in Tables 3
Figure 26
Averaged phase angles as functions of oscillation stress for neat starch,
starch/ PEG 300, starch/ PEG 1000 after 24 hours of mixing. Note, starch/PEG
3350 was unmeasurable.

60
and 4. It can be noted that the starch-thickened PEG solutions showed a particularly large
decrease in beginning phase angle after 24 hours versus those assayed after 1 hour, implying that
the starch frameworks take longer to form in solution than those of XG which remained
relatively unchanged (Figure 26 vs. Figure 27).
Figure 27
Averaged phase angles as functions of oscillation stress for neat XG, XG/PEG
300, XG/PEG 1000 and XG PEG 3350 after 24 hours of mixing

61
4.3.2 Modulus Crossover vs Oscillatory Stress
Similar to phase angle inflection points, the storage (G`) and loss (G``) moduli crossover
can be thought of as representing the point where the system begins to exhibit viscous flow.
Once the loss modulus dominates the storage modulus (G`` > G`) the system is undergoing
viscious deformation or flow and is no longer behaving as a gel. Further, the magnitude of the
storage modulus before the crossover point can be thought of as representing the strength of the
elastic network and provides a rather quantitative comparison between different systems.
Figures 28-31 show the cross over regions and the storage modulus magnitudes for the
thickened systems.
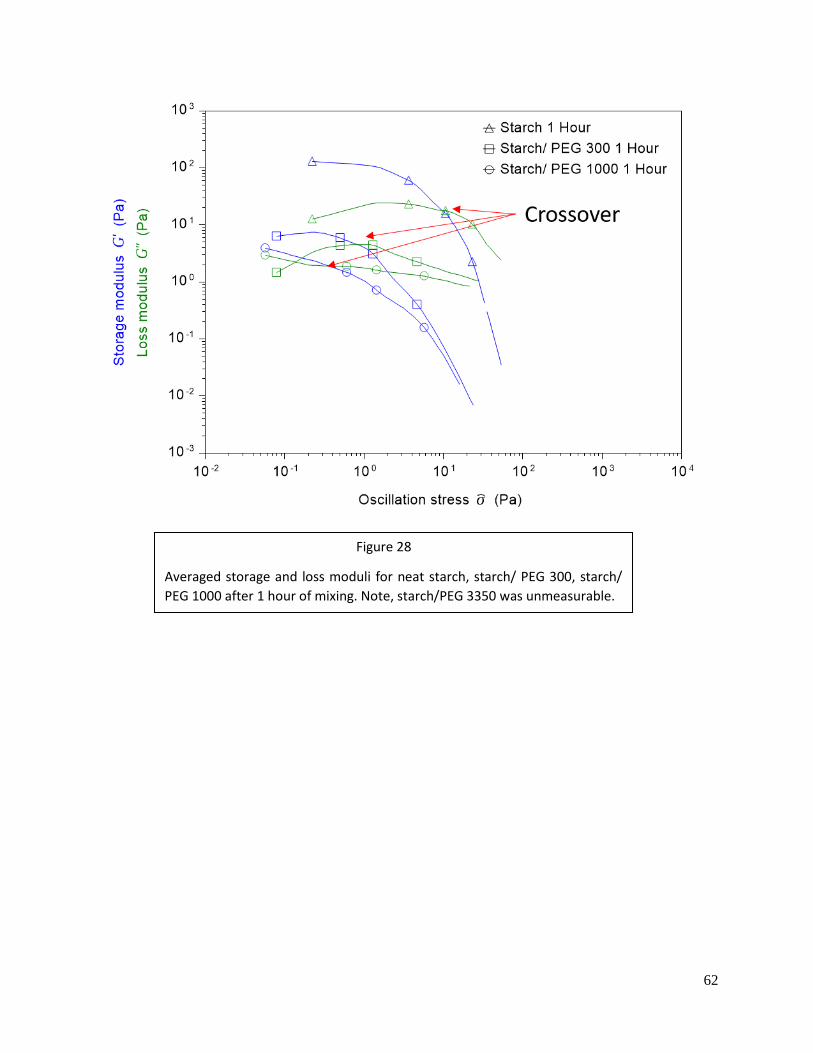
62
Figure 28
Averaged storage and loss moduli for neat starch, starch/ PEG 300, starch/
PEG 1000 after 1 hour of mixing. Note, starch/PEG 3350 was unmeasurable.

63
As Figures 28 and 29 illustrate, neat starch exhibits a higher storage modulus than the
XG formulations under ramped oscillation stress condititions after 1 hour of mixing. This implies
that the starch framework is stronger without PEG, and grows progressively weaker with
increasing PEG molecular weight. Further, the G`/G`` crossover points shift to lower stresses as
the PEG molecular weights of the systems increase from a value of 13.42Pa for neat starch, to
0.82Pa for Starch/PEG 300 and finally 0.43Pa for starch/PEG 1000. These formulations were
also left undistubed for 24hours at room temperature and re-tested (Figures 30 & 31). The
systems also showed time-dependence with PEG solutions exhibiting increased crossover moduli
values after first mixing, but still falling below the neat systems. These increases in crossover
Figure 29
Averaged storage and loss moduli for neat XG, XG/ PEG 300, XG/ PEG 1000
and XG/PEG3350 after 1 hour or mixing.

64
values with time suggests that the presence of PEG severly depresses the rate at which
entanglements and interchain hydrogen-bonding form, with values of the starch/PEG 300 system
shifting from 0.82Pa to 5.22Pa, and the starch/PEG 1000 system shifting from 0.43Pa to 0.52Pa.
Interestingly, the crossover value for neat starch decreased with time, from 13.42Pa to 6.14Pa,
suggesting, perhaps, a time-dependent crystallization and reduction of amorphous regions
available for thickening. The XG systems again appear to be little influenced by either PEG
molecular weight or time after initial mixing. (Figure 31)
Figure 30
Averaged storage and loss moduli for neat starch starch/ PEG 300, starch/ PEG
1000 after 24 hours of mixing. Note, starch/PEG 3350 was unmeasurable.

65
Figure 31
Averaged storage and loss moduli for neat XG, XG/ PEG 300, XG/ PEG 1000,
XG/ PEG 3350 after 24 hours of mixing.
66
Chapter 5: Steady Shear Rheology of Starch and Xanthan Gum Solutions as functions of
PEG MW.
5.1 Introduction
In addition to studying framework stability and strength via oscillation stress ramps,
rotational flow experiments ramping shear rates provide insight into viscosity (η) as functions of
both shear rate and PEG molecular weight. In general, both starch and XG-thickened systems
display a region of Newtonian behavior at low shear, termed the zero-shear plateau, where the
framework elasticity resists imparted stress or strain. This plateau is immediately followed by a
shear-thinning power law region where the framework breaks down at higher shear rates, and is
termed the power-law region after the general forms of the equations modeling it. At the highest
shear rates, another Newtonian plateau becomes evident and is termed the infinite shear plateau,
the lowest viscosity the sample will exhibit as no framework is present to counter shearing
forces. The infinite shear plateau is not always attainable with some geometries and steady shear
experiments due to the high shear rates needed. Viscosity models can then be fit to this data to
quantify these aspects.
5.2 Methods
Rheological samples were prepared by making 0.007M solutions of the various
starch/XG PEG solutions so as to increase the viscosity to levels the rheometer and its geometry
can consistently measure. A TA Instruments AR 2000 Rheometer (Figure 23) equipped with

67
ETC (Environmental Testing Chamber) was used under constant gap conditions of 500µm and
liquid nitrogen used to achieve isothermal conditions of 25.0°C. Rotational stepped flow mode
was used, probing shear rate ranges from 0.01 s-1 to 100 s-1. This mode waits for viscosity
equilibration before logarithmically ramping the shear stress[60] which is important for delicate
colloidal dispersions. Rheological data were collected continuously within the first three hours
of mixing to allow for structural equilibration, with the last three data points which showed
consistent data being chosen for averaging.
5.3 Steady Shear Rheology
5.3.1 Viscosity vs. Shear Rate
As seen in Figures 32 & 33, the zero shear plateau is present in XG solutions but largely
absent in the starch solutions after initial mixing. However after 24 hours (Figures 34 & 35), all
four starch systems show clear zero shear Newtonian plateaus with their viscosities decreasing
upon addition of larger PEG molecular weights. Because starch systems assayed after 1 hour of
mixing showed no dinfinitive zero shear plateaus, it is possible that the frameworks were
incompletely formed by that time, and at all shear rates the material fell within the shear thinning
region. The starch systems after 1 hour of mixing showed an averaged 𝜂0 of 1.08 Pa ·S for neat
starch, 0.82 Pa ·S for starch/PEG 300, 1.98 Pa ·S for starch/PEG 1000 and unmeaserable for
starch/PEG 3350. These values show no apparent trend, due perhaps to the lack of a clear zero
shear plateau and should be considered highly unreliable. The XG systems after 1 hour of mixing
showed an averaged 𝜂0 of 0.14 Pa ·S for neat XG, 0.13 Pa ·S for XG/PEG 300, 0.14 Pa ·S for
XG/PEG 1000 and 0.13 Pa ·S for XG/PEG 3350.

68
Overlay
Overlay 2
Figure 32
Averaged viscosity data for starch/PEG solutions after 1 hour of mixing.
Figure 33
Averaged viscosity data for XG/PEG solutions after 1 hour of mixing.

69
Overlay
Overlay
Figure 34
Averaged viscosity data for starch/PEG solutions after 24 hours.
Figure 35
Averaged viscosity data for XG/PEG solutions after 24 hours.

70
Likewise, these values show no apparent trend, again due perhaps to the lack of a clear
zero shear plateau. The starch systems after 24 hours of mixing showed an averaged 𝜂0 of 164.9
Pa ·S for neat starch, 88.7 Pa ·S for starch/PEG 300, 56.5 Pa ·S for starch/PEG 1000 and 17.8 Pa
·S for starch/PEG 3350. XG systems after 24 hours of mixing showed an averaged 𝜂0 of 2.32 Pa
·S for neat XG, 4.06 Pa ·S for XG/PEG 300, 9.32 Pa ·S for XG/PEG 1000 and 2.05 Pa ·S for
XG/PEG 3350. Of note are Figures 45-60 which depict the standard deviation of triplicate
steady shear viscosity experiments. As Figures 45-48 illustrate, the starch-based solutions
exhibited rather large stardard deviations for each viscosity data point as a function of shear rate,
at lower shear rates during the first hour of mixing. Interestingly, after 24 hours of mixing
(Figures 53-56) these solutions begin to show more pronounced zero shear plateaus and reduced
deviation upon addition of PEG. On the other hand, XG solutions showed little deviation within
the first hour of mixing (Figures 49-52) and virtually none after 24 hours (Figures 57-60).
Xanthan gum systems curiously appear to show a viscosity increase upon PEG addition
up to a certain molecular weight. Zero shear values for all systems were calculated via data
fitting to the Carreau-Yasuda model (Equation 15) which exhibited the best fit to the empirical
data.
This equation models a pseudoplastic flow (shear thinning) behavior with minimal or zero yield
stress. The parameters λ and a represent the beginning and width of the transition zone from
Equation 15 η=𝜂∞+(𝜂0 − 𝜂∞)[1 + (𝛾𝜆)𝑎]𝑛−1
𝑎

71
Newtonian plateau to a shear-thinning power law region, whose slope is modeled by n. Viscosity
is represented by η and shear rate by γ (Figure 36). Further, as can be seen from Figures 32 &
34, the width of the zero shear starch plateaus appear to be affected by PEG molecular weight; as
the molecuar weight of PEG increases, the length of the plateau decreases, suggesting an elastic
framework which is decreasingly able to resist shear rate before beginning to breakup and
descend into the shear-thinning power law region. Additionally, shear rates at 50 s-1 within the
power law represent shear rates the National Dysphagia Diet Task Force recognize as best
averaging those experienced by a food bolus in a human mouth and are quantified[38]. Again,
the viscosities at these shear rates, 𝜂50−1𝑠, show a trend of continually decreasing
for starch-thickened samples with increasing PEG molecular weight for the samples left for 24
hours. Rheological data for these systems are tabulated in Tables 3 and 4.
Figure 36
Carreau-Yasuda model depiction, where λ represents the beginning of the shear-
thinning region, a represents the transition region between Newtonian and power
law, and n is the slope of the power law region.

72
1 Hour
Sample Onset Stress
(Pa) δ°
G'/G''
C.O. (Pa)
Visc Onset
(Pa S) Beginning δ° 𝜼𝟎visc. (Pa S)
Visc. at 50s-1
(Pa S) R
2
Neat Starch 6.87± 3.04 13.42±6.67 8.86±5.14 9.24±3.62 559.03±594.39 1.08±0.87 0.9994
Starch/PEG 300 0.28± 0.15 0.82±0.34 0.68±0.22 15.88±4.05 777.95±1200.61 0.82±0.24 0.9988
Starch/PEG 1000 0.23± 0.12 0.43±0.16 0.48±0.46 37.56±1.52 1818.79±69175.85 1.98±0.37 0.9998
Starch/PEG 3350 / / / / / / /
24 Hours
Sample Onset Stress
(Pa) δ°
G'/G''
C.O. (Pa)
Visc Onset
(Pa S) Beginning δ° 𝜼𝟎visc. (Pa S)
Visc. at 50s-1
(Pa S) R
2
Neat Starch 1.50± 0.27 6.14±1.98 2.52±0.77 27.01±4.16 164.90±157.36 0.99±0.14 0.9999
Starch/PEG 300 1.39±0.81 5.22±2.43 1.53±0.41 30.07±4.48 88.68±24.51 0.97±0.14 0.9998
Starch/PEG 1000 0.28±0.29 0.52±0.54 0.11±0.03 37.55±1.50 56.53±12.47 0.80±0.05 0.9998
Starch/PEG 3350 / / / / 17.81±5.99 0.12±0.04 0.9925
Table 3
Summarized averaged data for 1 hour and 24 hour data sets. Tabulated data consists of
onset stress (Pa) of phase angle increase, G`/G`` crossover (C.O.) (Pa), complex viscosity
onset drop-off (Pa), beginning phase angle (degrees), complex zero-shear viscosity (Pa ·S),
viscosity at 50-1, viscosity model, and model fit (R2).

73
1 Hour
Sample Onset Stress
(Pa) δ°
G'/G''
C.O (Pa)
Visc Onset
(Pa S) Beginning δ° 𝜼𝟎visc. (Pa S)
Visc. at 50s-1
(Pa S) R
2
XG 2.84±0.27 1.61±0.20 2.12±0.20 45.56±5.35 8.47±1.98 0.14±0.01 0.9984
XG/PEG 300 2.83±0.18 1.08±0.08 2.01±0.15 46.84±4.34 3.39±1.33 0.13±0.01 0.9987
XG/PEG 1000 2.28 ± 0.21 2.27 ± 0.53 1.78 ± 0.26 35.91 ± 7.50 10.62± 2.04 0.14± 0.01 0.9986
XG/PEG 3350 3.10±0.30 1.01±0.55 2.06±0.26 48.72±5.37 2.59±0.77 0.13±0.01 0.9993
24 Hours
Sample Onset Stress
(Pa) δ°
G'/G''
C.O. (Pa)
Visc Onset
(Pa S) Beginning δ° 𝜼𝟎visc. (Pa S)
Visc. at 50s-1
(Pa S) R
2
XG 2.76±0.35 2.062±1.00 2.20±0.30 40.28±8.70 2.32±0.06 0.13±0.02 0.9986
XG/PEG 300 3.31±0.49 0.94±0.40 2.44±0.07 41.46±0.59 4.06±1.50 0.13±0.01 0.9989
XG/PEG 1000 3.37 ± 0.75 3.63 ± 1.11 3.81 ± 0.98 39.58 ± 2.03 9.32 ± 0.98 0.14 ± 0.03 0.9989
XG/PEG 3350 2.89±0.30 1.05±0.62 2.11±0.42 45.32±2.00 2.05±0.05 0.13±0.13 0.9989
Table 4
Summarized averaged data for 1 hour and 24 hour data sets. Tabulated data consists of
onset stress (Pa) of phase angle increase, G`/G`` crossover (C.O.) (Pa), complex viscosity
onset drop-off (Pa), beginning phase angle (degrees), complex zero-shear viscosity (Pa
·S), viscosity at 50-1, viscosity model, and model fit (R2).

74
Chapter 6: FT-IR Spectroscopy of Aqueous Starch/PEG solutions
6.1 Methods
Samples for FT-IR analysis were prepared by making 0.04M solutions (manufacuter’s
directions for clinical use) and thoroughly mixing with DI water. These samples were left at
room temperature and without agitation for 24 hours to allow time for dispersion networks to
form. A PerkinElmer UATR Two™ FT-IR spectrometer (Figure 37) fitted with a single
reflection ATR diamond was used to obtain data from aqueous aliquots of solutions. Water
spectra were subtracted as baselines, and resulting data was further baseline corrected and
deconvoluted. Data was collected over a range from 400 to 4000cm-1 at 4cm-1 resolution and 16
scans.
Fig 37
PerkinElmer UATR Two™ FT-IR spectrometer showing single
reflection ATR (attenuated total reflection) sampler.

75
Starch samples for FT-IR spectroscopy were prepared by making 0.04M solutions in
20mL scintillation vials with DI water, and mixing until no visibly undisolved PEG was left.
These vials were then left undistubed for 24 hours before being analyzed with an UATR-
equipped spectrometer so that starch had time to form its framework.
6.2 FT-IR Spectra
As can be seen from Figure 38, the spectra are quite complex with many overlapping
peaks. The spectrum of starch is replete with multiple stretching and vibrational modes with the
most important of them being the C-OH and -CH2- modes ca. 1041cm-1 and 1021cm-1 [44]. These
absorptions are related to the crystalline and amorphous regions of starch, respectively[43, 44].
Another absorption at ca. 1000cm-1 is of interest as it is related to the extent of syneresis, or the
expulsion of water[43]. As the molecular weight of PEG increases, the crystallinity of the starch
system increases as depicted in Figure 39. Further, the relative size of the shoulder region ca.
1000cm-1 appears to increase as PEG molecular increase, although quantification of this is
difficult in aqueous solution due to overlapping signals and limited resolution. However, the
peak region centered at ca. 1021cm-1 becomes more sharp and prominent as the PEG molecular
weight increases, reflecting chain conformational changes.

76
1.02
1.04
1.06
1.08
1.1
1.12
1.14
1.16
1.18
0 500 1000 1500 2000 2500 3000 3500 4000
Figure 38 FT-IR Spectroscopy
Deconvoluted and baseline-corrected spectra showing shifts in intensity of crystalline
and amorphous regions of starch upon different molecular weights of PEG.
PEG molecular weight
Cry
stal
line:
Am
orp
ho
us
rati
o
Figure 39 Crystalline: Amorphous structure
The ratio of crystalline: amorphous signal intensities signifies the loss of amorphous
structure as the molecular weight of PEG increases.

77
From these data, it’s apparent that PEG is affecting the crystallinity of starch in solution
and causing chain conformational changes. It is hypothesized that these changes reduce the
ability of the amorphous regions to hydrogen-bond and link together to form elastic frameworks,
causing syneresis and expulsion of water as the starch dispersion shrinks and falls out of
solution.
Starch-based thickeners rely upon swollen dispersions to impart viscosity to a fluid
system. These dispersions are composed of elastic networks of amylose and amlyopectin which
resist shearing forces by hydrogen-bonding and chain entanglement. From this study it appears
that the molecular weight of PEG affects the stability of these frameworks by interfering with
interchain hydrogen bonding within the starch dispersion and results in its collapse via syneresis,
as was first noted by clinicians at molecular weights ca. 3000MW.
Further, the miscibility of PEG in starch is a function of its molecular weight as Kim et
al[50] showed in their study with careful FT-IR analysis of absortions in the region of 3700 to
3000cm-1 representing interactions of starch hydroxyl groups. They found that the peak
absorptions of starch shift to lower wavenumbers with ever increasing PEG molecular weight
and then limit to a constant value at ca. 8000MW[50]. Miscibility entails the physical mixing of
PEG and starch, and the resulting re-structuring of inter and intramolecular interactions to lower
free energy of the system by forming new bond and chain conformations. The hydrophilicity of
PEG changes with molecular weight due to shift in the ratio of –OH end groups to interior
ethylene oxide moieties, altering how it can mix with starch solutions.

78
The miscibility of certain molecular weight PEGs with aqueous solutions of starch may
allow the molecule to migrate within the crucial hydrogen-bonding regions of the pyranose
alcohols of amylose and interupt these framework-forming associations. When these frameworks
collapse they lose their ability to resist shearing forces while also releasing much of their
previously absorbed water resulting in the observed syneresis phenomenon. This interaction was
not noted for XG-based thickeners in our previous work[38], and was likewise shown to be
independent of PEG molecular weight here. It also appears from this study that XG-based
thickeners can actually increase in viscosity as PEG size increases within molecular weight range
assayed here, perhaps due to a framework formed by helical coils supported by large amounts of
entanglements of the pendant triose groups. Further, ionic interactions of the charged pyruvate
moities not seen in amylose or amylopectin my play a role. These interactions appear to be either
strong enough to resist H-bonding disruption or are otherwhise not as susceptible to the presence
of polyethylene glycols, with PEG serving to further entangle XG’s chains up to about 3350MW.

79
Citations
1. GmbH, E. EOS Plastic Materials for Additive Manufacturing. Available from:
https://www.eos.info/material-p.
2. Odian, G., Principles of Polymerization. 4th ed. 2004, Hoboken, New Jersey: John Wiley
& Sons.
3. Differential Scanning Calorimetry (DSC), P. Elmer, Editor. 2013-2014.
4. Gedde, U.W., Polymer Physics. 1 ed. 1995, London, UK: Chapman & Hall.
5. Wunderlich, B., Thermal Analysis of Polymeric Materials. 2005, Netherlands: Springer.
6. Thermal Analysis of Polymers Selected Applications, M. Toledo, Editor. 2013.
7. An Introductionto Gel Permeation Chromatography and Size Exclusion Chromatography,
A. Technologies, Editor. 2015.
8. Elias, H.-G., An Introduction to Polymer Science. 1 ed. 1997, New York, New York:
Published Jointly by VCH Verlagsgesellschaft mbH and VCH Publishers, Inc. .
9. Polymer Molecular Weight Distribution and Definitions of MW Averages, A.
Technologies, Editor. 2015.
10. Dynamic Mechanical Analysis. Perkin Elmer 2008.
11. Thermal Solutions: Determination of the Linear Viscoelastic Region of a Polymer using a
Strain Sweep on the DMA 2980, T. Instruments, Editor.

80
12. Rheology Solutions: Determining the Linear Viscoelastic Region in Polymers, T.
Instruments, Editor.
13. Rheological Applications Note: the Principles and Applications of the Cox-Merz Rule, T.
Instruments, Editor.
14. Van Hooreweder, B., et al., On the difference in material structure and fatigue properties
of nylon specimens produced by injection molding and selective laser sintering. Polymer
Testing, 2013. 32(5): p. 972-981.
15. Vasquez, M., B. Haworth, and N. Hopkinson, Optimum sintering region for laser sintered
nylon-12. Proceedings of the Institution of Mechanical Engineers, Part B: Journal of
Engineering Manufacture, 2011. 225(12): p. 2240-2248.
16. Goodridge, R.D., et al., Processing of a Polyamide-12/carbon nanofibre composite by
laser sintering. Polymer Testing, 2011. 30(1): p. 94-100.
17. Yan, C., Y. Shi, and L. Hao, Investigation into the Differences in the Selective Laser
Sintering between Amorphous and Semi-crystalline Polymers. International Polymer
Processing, 2011. 26(4): p. 416-423.
18. Rouholamin, D. and N. Hopkinson, An investigation on the suitability of micro-computed
tomography as a non-destructive technique to assess the morphology of laser sintered
nylon 12 parts. Proceedings of the Institution of Mechanical Engineers, Part B: Journal of
Engineering Manufacture, 2014. 228(12): p. 1529-1542.
19. Bourell, D.L., et al., Performance Limitations in Polymer Laser Sintering. Physics Procedia,
2014. 56: p. 147-156.
81
20. Hofland, E.C., I. Baran, and D.A. Wismeijer, Correlation of Process Parameters with
Mechanical Properties of Laser Sintered PA12 Parts. Advances in Materials Science and
Engineering, 2017. 2017: p. 1-11.
21. Verbelen, L., et al., Characterization of polyamide powders for determination of laser
sintering processability. European Polymer Journal, 2016. 75: p. 163-174.
22. Dadbakhsh, S., et al., Effect of PA12 powder reuse on coalescence behaviour and
microstructure of SLS parts. European Polymer Journal, 2017. 92: p. 250-262.
23. Majewski, C., H. Zarringhalam, and N. Hopkinson, Effect of the degree of particle melt on
mechanical properties in selective laser-sintered Nylon-12 parts. Proceedings of the
Institution of Mechanical Engineers, Part B: Journal of Engineering Manufacture, 2008.
222(9): p. 1055-1064.
24. Bai, J., et al., Influence of carbon nanotubes on the rheology and dynamic mechanical
properties of polyamide-12 for laser sintering. Polymer Testing, 2014. 36: p. 95-100.
25. Caulfield, B., P.E. McHugh, and S. Lohfeld, Dependence of mechanical properties of
polyamide components on build parameters in the SLS process. Journal of Materials
Processing Technology, 2007. 182(1-3): p. 477-488.
26. Griessbach, S., R. Lach, and W. Grellmann, Structure–property correlations of laser
sintered nylon 12 for dynamic dye testing of plastic parts. Polymer Testing, 2010. 29(8):
p. 1026-1030.
27. Zarringhalam, H., C. Majewski, and N. Hopkinson, Degree of particle melt in Nylon‐12
selective laser‐sintered parts. Rapid Prototyping Journal, 2009. 15(2): p. 126-132.

82
28. Hopkinson, N., C.E. Majewski, and H. Zarringhalam, Quantifying the degree of particle
melt in Selective Laser Sintering ®. CIRP Annals, 2009. 58(1): p. 197-200.
29. Ellis, A., et al., Materials for high speed sintering. Journal of Materials Research, 2014.
29(17): p. 2080-2085.
30. Ellis, A., C.J. Noble, and N. Hopkinson, High Speed Sintering: Assessing the influence of
print density on microstructure and mechanical properties of nylon parts. Additive
Manufacturing, 2014. 1-4: p. 48-51.
31. Crane, N.B., et al., Impact of chemical finishing on laser-sintered nylon 12 materials.
Additive Manufacturing, 2017. 13: p. 149-155.
32. HP 3D High Reusability PA 12 Datasheet.
33. Drummer, D., K. Wudy, and M. Drexler. Modelling of the aging behavior of polyamide 12
powder during laser melting process. in Proceedings of PPS-30. 2015. Cleveland, Ohio.
34. Haworth, B., et al., Shear viscosity measurements on Polyamide‐12 polymers for laser
sintering. Rapid Prototyping Journal, 2013. 19(1): p. 28-36.
35. Liangbin Li, M.H.J.K., Wim H. de Jeu, Crystalline Structure and Morphology in Nylon-12: A
Small-and Wide-Angle X-ray Scattering Study Macromolecules 2003. 36: p. 1626-1632.
36. PA 650 Technical Data Sheet. Available from: http://www.alm-llc.com/.
37. de Oliveira Setti, G., et al., Correlation between mechanical and surface properties of SLS
parts. Rapid Prototyping Journal, 2014. 20(4): p. 285-290.
38. Carlisle, B.J., et al., PEG and Thickeners: A Critical Interaction Between Polyethylene
Glycol Laxative and Starch-Based Thickeners. J Am Med Dir Assoc, 2016. 17(9): p. 860-1.

83
39. O'Leary, M., B. Hanson, and C. Smith, Viscosity and non-Newtonian features of thickened
fluids used for dysphagia therapy. J Food Sci, 2010. 75(6): p. E330-8.
40. Dewar, R.J. and M.J. Joyce, Time-dependent rheology of starch thickeners and the clinical
implications for dysphagia therapy. Dysphagia, 2006. 21(4): p. 264-9.
41. Moret-Tatay, A., et al., Commercial thickeners used by patients with dysphagia:
Rheological and structural behaviour in different food matrices. Food Hydrocolloids,
2015. 51: p. 318-326.
42. Garcia, J.M., et al., Viscosity measurements of nectar- and honey-thick liquids: product,
liquid, and time comparisons. Dysphagia, 2005. 20(4): p. 325-35.
43. J. J. G. van Soest, D.d.W., H. Tournois, J. F. G. Vliegenthart, The influence of glycerol on
structural changes in waxy maize starch as studied by Fourier transform infra-red
spectroscopy. Polymer, 1994. 35(22): p. 4722-4727.
44. J. J. G. van Soest, H.T., D. de Wit, J. F. G. Vliegenthart, Short-range structure in (partially)
crystalline potato starch determined with attenuated total reflectance Fourier-transform
IR spectroscopy Carbohydrate Research, 1995. 279: p. 201-214.
45. A. L. Smits, S.H.D.H., J. J. G. Van Soest, H. Feil, J. F. G. Vliegenthart, The Influence of
Polyols on the Molecular Organization in Starch-based Plastics. Polymers for Advanced
Technologies 1994. 10: p. 570-573.
46. A. L. M. Smits, M.W., P. H. Kruiskamp, J. J. G. van Soest, and a.J.v.T. J. F. G. Vliegenthart,
Structure Evolution in Amylopectin/Ethylene Glycol Mixtures by H-bond Formation and
Phase Separation Studied with Dielectric Relaxation Spectroscopy. J. Phys. Chem. B,
2001. 105: p. 5630-5636.

84
47. Smits, A.L.M., et al., Interaction between dry starch and plasticisers glycerol or ethylene
glycol, measured by differential scanning calorimetry and solid state NMR spectroscopy.
Carbohydrate Polymers, 2003. 53(4): p. 409-416.
48. P. A. Perry, A.M.D., The Role of Plasticization in Starch Granule Assembly.
Biomacromolecules, 2000. 1: p. 424-432.
49. PH Kruiskamp, A.S., JJG van Soest, JFG Vliegenthart, The influnce of plasticiser on
molecular organisation in dry amylopectin measured by differential scanning calorimetry
and solid state nuclear magnetic resonance spectroscopy Journal of Industrial
Microbiology & Biotechnology 2001. 26: p. 90-93.
50. Kim, C.-H., D.-W. Kim, and K.Y. Cho, The influence of PEG molecular weight on the
structural changes of corn starch in a starch/PEG blend. Polymer Bulletin, 2009. 63(1): p.
91-99.
51. Vaclavik, V.A. and E.W. Christian, Starches in Foods, in Essentials of Food Science. 2014,
Springer. p. 39-52.
52. Saha, D. and S. Bhattacharya, Hydrocolloids as thickening and gelling agents in food: a
critical review. J Food Sci Technol, 2010. 47(6): p. 587-97.
53. C. Perera, R.H., Influence of hydroxypropylation on retrogradation properties of native,
defatted and heat-moisture treated potato starches. Food Chemistry, 1999. 64: p. 361-
375.
54. Singh, N., et al., Morphological, thermal and rheological properties of starches from
different botanical sources. Food Chemistry, 2003. 81(2): p. 219-231.

85
55. O. Sevenou, S.E.H., I. A. Farhart, J. R. Mitchell, Organisation of the external region of the
starch granule as determined by infrared spectroscopy. International Journal of
Biological Macromolecules 2002. 31: p. 79-85.
56. Wang, S., et al., Starch Retrogradation: A Comprehensive Review. Comprehensive
Reviews in Food Science and Food Safety, 2015. 14(5): p. 568-585.
57. P. J. Jenkins, A.M.D., The influence of amylose on starch granule structure. International
Journal of Biological Macromolecules, 1995. 17(6): p. 315-321.
58. Fantou, C., et al., Chemical modification of xanthan in the ordered and disordered states:
An open route for tuning the physico-chemical properties. Carbohydr Polym, 2017. 178:
p. 115-122.
59. Choppe, E., et al., Rheology of xanthan solutions as a function of temperature,
concentration and ionic strength. Carbohydrate Polymers, 2010. 82(4): p. 1228-1235.
60. Rheology Theory and Applications, T. Instruments, Editor.
61. Khanna, Y.P., Overview of Transition Phenomenon in Nylon 6. Macromolecules, 1992. 25:
p. 3298-3300.
62. Aklonis, J.J., Mechanical Properties of Polymers. Journal of Chemical Education, 1981.
58(11): p. 892-897.
63. Salmoria, G.V., et al., Selective laser sintering of PA12/HDPE blends: Effect of
components on elastic/plastic behavior. Polymer Testing, 2008. 27(6): p. 654-659.
64. Lawrence E. Nielsen, R.F.L., Mechanical Properties of Polymers and Composites, ed. L.L.
Faulkner. 1994: Marcel Dekker, Inc. 557.

86
Appendix
A Dynamic Mechanical Analysis of Nylon-12 AM Parts (Future Work)
A.1 Methods
LAPS, EMS MJF and ProtoLabs LS printed parts (approximately 30-50mm x 3-5mm x
10mm) were dried overnight in vacuo between 50°C and 60°C. A TA Instruments AR 2000
rheometer with rectangular solid geometry in oscillation mode was used. Temperature sweeps
from -120°C to 200°C via liquid nitrogen active cooling and ten frequencies from 1 to 20Hz and
a ramp of 5°C/min, 0.5% strain were used to characterize samples under constant tension of 2.0
Newtons of normal force with 0.1N tolerance.
A.2 Dynamic Mechanical Analysis
The dynamic mechanical data for the nylons reveal two sub-glass secondary relaxations, a
glass transition, a rubbery plateau, and, finally, a melt transition (Figure 40). The two sub-glass
relaxations, from lower temperature to higher, are the gamma (Tγ) and beta (Tβ) relaxations. The
origins for these relaxations are of sub-monomeric level –CH2- motions outside crystalline
domains for the gamma relaxation, and motion of amide links for the beta relaxation [24, 61]. The
size of the beta relaxation is also dependent upon solvent, particularly water [61]. The next
transition after the beta is the alpha transition, or glass transition, Tg, where polymer chains gain
enough thermal energy to overcome the secondary interactions of intermolecular bonds of adjacent
chains and slip past one another via large scale segmental slippage. After the glass transition

87
temperature, a rubbery plateau exists which is seen as a leveling-off in the moduli after a
precipitous drop during the glass transition. This plateau exists in polymers of sufficient molecular
weight (above the critical entanglement weight) whereby the long polymer chains are entangled
and unable to exhibit translational degrees of freedom [62]. A small transition is sometimes
apparent in nylons after the rubbery plateau and before the Tm in the form of a crystalline slip
denoted as 𝛼𝐶′ but is not visible here[61, 63]. The length of the rubbery plateau is generalized in
the following equation where M is approximately the Mw and Me is the molecular weight between
entanglements[64]:
Equation 16 𝐿𝑒𝑛𝑔𝑡ℎ 𝛼 𝑀
𝑀𝑒

88
Figure 40
Stacked DMA traces at 1HZ showing storage, loss and dampening
moduli for Area Cured, MJF and ProtoLabs LS parts

89
As Figure 40 depicts, the storage modulus (elastic modulus, or G’) are similar between all
three of the printing technologies; however, the LAPS part showed G’ domination over the other
two AM methods through the glass transition, and exhibited the second highest modulus in the
sub-Tg region (MJF showing the highest modulus) (Table 5). These results can be perhaps
rationalized as the manifestation of a higher degree of particle melt and better coalescence during
sintering by extended sintering times available to LAPS and MJF, resulting in a more elastic part
better able to store energy without losing it to viscous damping from chain motion or from local
stress build up due to residual cores and pores. Typically, modulus and damping through this
region are independent of molecular weight[64]. Because the elastic modulus is proportional to
20171010 PA2202 5s Exp 20s Fade-0024o
Figure 41
The frequency dependence of moduli of a LAPS-printed part in a
temperature sweep.

90
tensile properties, in the temperature range from ca. 0°C to the Tg, the LAPS and MJF parts were
stiffer and more elastic than the ProtoLabs LS-printed part in a large region of the most commonly
used temperature range imaginable for PA12 printed parts. However, this order is counter to that
obtained by tensile methods in Chapter 2 (Figure 18, Table 2). As was also seen in Chapter 2, the
ProtoLabs part exhibited high levels of porosity which is known to affect ductility and manifest
anisotropic mechanical effects. It is possible that DMA is more sensitive these anisotropic defects,
particularly porosity. Further, the width of the damping (Tan δ) peak in the alpha region suggests
a higher molecular weight distribution (MWD) for the MJF and ProtoLabs-printed parts than seen
with LAPS parts. As it is known that molecular weight of PA12 increases with both time and
temperature, (Figure 15) [21, 33], it is possible that EMS and ProtoLabs utilize powder was left
at elevated temperature, resulting in postcondensation molecular weight buildup whereas the
LAPS parts are always built from fresh powder.
Overlay
Figure 42
Stacked storage moduli for Area Cured, MJF and SLS parts

91
α-relaxation
G' (0°C), MPa G'' (0°C), MPa Tan δ (peak
height) Tan δ (°C) Tan δ (area) Tg (°C, G'')
LAPS 705.3 8.3 0.101 45.1 4.423 40.0
ProtoLabs LS 635.0 7.7 0.08 48.6 5.267 38.7
EMS MJF 688.00 15.5 0.071 43.7 5.991 28.5
Overlay
Table 5
Tabulated DMA data comparing AC to LS and MJF-printed parts
Figure 43
Unlogged storage moduli for Area Cured, MJF and SLS parts

92
The damping process (tan δ) of the three build processes (Figure 43) is related to the
materials’ ability to dissipate stress in the form of heat. Low to moderately semicrystalline
polymers such as PA12 exhibit damping behavior due to the amorphous regions[64]. It is possible
that the size of the spherulites due to cooling rates may influence both damping and melting of the
material via associations between the amorphous and crystalline domains of the polymer[64].
Faster cooling results in smaller, yet more numerous, spherulites whilst the reverse is true for
slower cooling[19]. The projection sintered parts (LAPS and MJF), in the current arrangement are
cooled from the molten state in a matter of seconds, whereas most industrial LS printers take hours.
After the alpha region, the rubbery plateau is smallest for the LAPS-printed part, perhaps
relating to a lower molecular weight buildup from limited postcondensation reactions. However,
since postcondensation molecular weight build up is possible at nearly all temperatures, and this
phenomenon increases greatly at elevated temps, without knowing the thermal history of the
industrially-produced parts it would be difficult to draw conclusions about the nature of this region.
It can be speculated that due to the broadness of the damping peak in the alpha region that the
molecular weight distribution is higher for ProtoLabs and MJF parts (MJF exhibits the most
broadened damping peak). This implies significant postcondensation molecular weight buildup,
which isn’t surprising as industry protocol typically dictate a mixture of fresh and recycled (aged)
powder to optimize elongation at break while maintaining modulus.
Future tests of printed parts with known molecular weight are needed. The molecular
weight and polydispersity of the powders utilized by EMS and ProtoLabs should be characterized

93
by GPC. Further, LAPS printed parts of varying cooling times between layering should be assayed
with DMA to determine the effects of crystallinity and chain entanglement via modulus and the
rubbery plateau length and slope. It is hypothesized that increased entanglement of the amorphous
regions between spherulites should lengthen the plateau with all other variables constant. Because
porosity cannot be fully eliminated in LS processes it may be possible that DMA-based analyses
of such parts may be flawed due to internal porous architecture. It is perhaps possible to develop
a relatively coarse method for assaying porosity with DMA with the use of strain sweeps to find
the linear viscoelastic regions (LVR). The LVR should be sensitive to defects and result in
deviations from linearity between modulus and strain ramp as seen in Figure 44.
Figure 44
Strain sweeps of ProtoLabs LS and EMS MJF DMA bars at 0°C
showing non-linear behavior for the porous ProtoLabs LS bar

94
A more thorough comparison of the LAPS and MJF/HSS processes would be warranted as
they show limited porosity and high degrees of particle melt. It is currently unknown how
MJF/HSS processes cool their parts as it is a trade secret at this time. Chain entanglement and
layer-to-layer cohesion may be assayable with DMA via frequency and temperature sweeps if
porosity defects of the printed parts are minimized.

95
B Standard Deviation of Steady Shear Viscosity vs Shear Rate Trials
0.01
0.1
1
10
100
1000
0.01 0.10 1.00 10.00 100.00
Vis
cosi
ty (
Pa·
S)
Shear Rate (1/s)
Starch 1 Hour
Figure 45
Viscosity standard deviation of neat starch after 1 hour of mixing.

96
0.1
1
10
100
1000
0.01 0.10 1.00 10.00 100.00
Vis
cosi
ty (
Pa·
S)
Shear Rate (1/S)
Starch/PEG 300 1 Hour
1
10
100
1000
10000
0.01 0.10 1.00 10.00 100.00
Vis
cosi
ty (
Pa·
S)
Shear Rate (1/S)
Starch PEG 1000 1 Hour
Figure 46
Viscosity standard deviation of starch/PEG 300 after 1 hour of mixing.
Figure 47
Viscosity standard deviation of starch/PEG 1000 after 1 hour of mixing

97
0.01
0.1
1
10
100
1000
0.01 0.10 1.00 10.00 100.00
Vis
cosi
ty (
Pa·
S)
Shear Rate (1/S)
Starch PEG 3350 1 Hour
Figure 48
Viscosity standard deviation of starch/PEG 3350 after 1 hour of mixing

98
0.01
0.1
1
10
100
0.01 0.10 1.00 10.00 100.00
Vis
cosi
ty (
Pa·
S)
Shear Rate (1/s)
Neat Xathan 1 Hour
0.01
0.1
1
10
0.01 0.10 1.00 10.00 100.00
Vis
cosi
ty (
Pa·
S)
Shear Rate (1/s)
Xanthan/PEG 300 1 Hour
Figure 49
Viscosity standard deviation of neat XG after 1 hour of mixing
Figure 50
Viscosity standard deviation of XG/PEG 300 after 1 hour of mixing
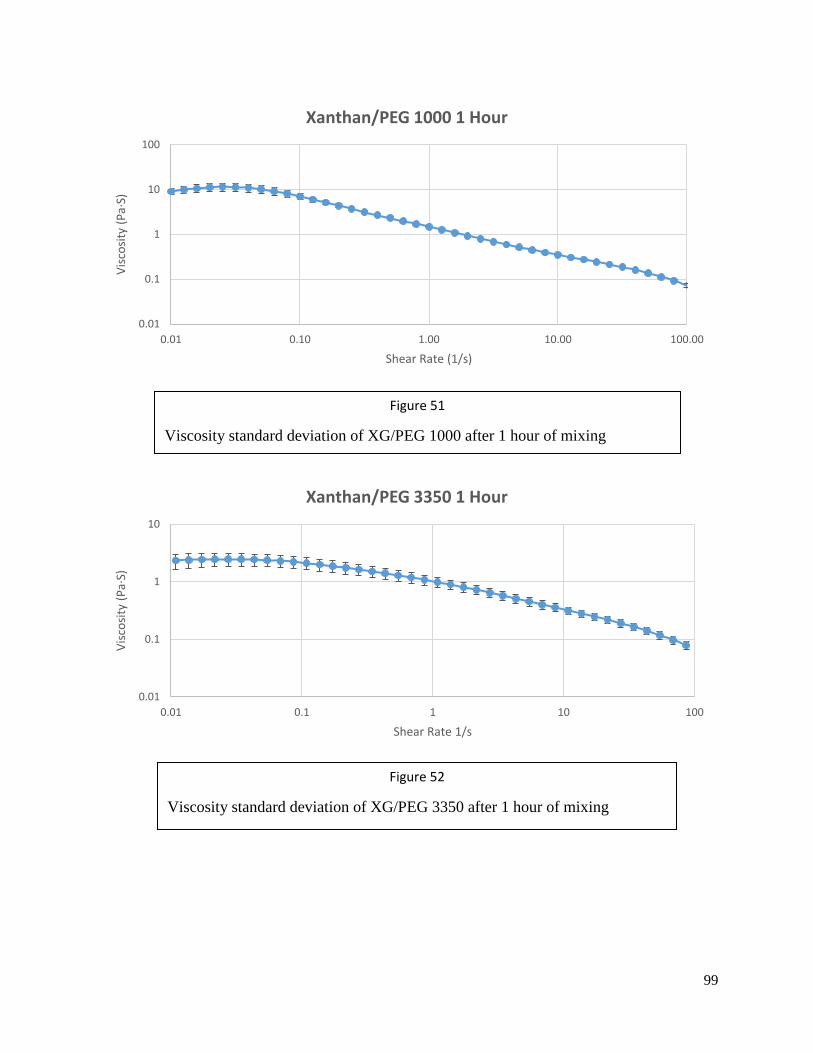
99
0.01
0.1
1
10
100
0.01 0.10 1.00 10.00 100.00
Vis
cosi
ty (
Pa·
S)
Shear Rate (1/s)
Xanthan/PEG 1000 1 Hour
0.01
0.1
1
10
0.01 0.1 1 10 100
Vis
cosi
ty (
Pa·
S)
Shear Rate 1/s
Xanthan/PEG 3350 1 Hour
Figure 51
Viscosity standard deviation of XG/PEG 1000 after 1 hour of mixing
Figure 52
Viscosity standard deviation of XG/PEG 3350 after 1 hour of mixing

100
0.1
1
10
100
1000
0 . 0 1 0 . 1 1 1 0 1 0 0
VIS
CO
SITY
(P
A·S
)
SHEAR RATE 1/S
STARCH 24 HOURS
0.1
1
10
100
0.01 0.1 1 10 100
Vis
cosi
ty (
Pa·
S)
Shear Rate 1/S
Starch/PEG 300 24 Hours
Figure 53
Viscosity standard deviation of starch after 24 hours of mixing
Figure 54
Viscosity standard deviation of starch/PEG 300 after 24 hours of mixing

101
0.1
1
10
100
0.01 0.10 1.00 10.00 100.00
Vis
cosi
ty (
Pa·
S)
Shear Rate 1/S
Starch PEG 1000 24 Hours
0.01
0.1
1
10
100
0.001 0.01 0.1 1 10 100
Vis
cosi
ty (
Pa·
S)
Shear Rate (1/S)
Starch PEG 3350 24 Hours
Figure 55
Viscosity standard deviation of starch/PEG 1000 after 24 hours of mixing
Figure 56
Viscosity standard deviation of starch/PEG 3350 after 24 hours of mixing

102
0.01
0.1
1
10
0.01 0.10 1.00 10.00 100.00
Vis
cosi
ty (
Pa·
S)
Shear Rate (1/s)
Neat Xanthan 24 Hours
0.01
0.1
1
10
0.01 0.10 1.00 10.00 100.00
Vis
cosi
ty (
Pa·
S)
Shear Rate (1/s)
Xanthan/PEG 300 24 Hours
Figure 57
Viscosity standard deviation of XG after 24 hours of mixing
Figure 58
Viscosity standard deviation of XG/PEG 300 after 24 hours of
mixing

103
0.01
0.1
1
10
100
0.01 0.10 1.00 10.00 100.00
Vis
cosi
ty (
Pa·
S)
Shear Rate (1/s)
Xanthan/PEG 1000 24 Hours
0.01
0.1
1
10
0.01 0.10 1.00 10.00 100.00
Vis
cosi
ty (
Pa·
S)
Shear Rate (1/s)
Xanthan/PEG 3350 24 Hours
Figure 59
Viscosity standard deviation of XG/PEG 1000 after 24 hours of
mixing
Figure 60
Viscosity standard deviation of XG/PEG 3350 after 24 hours of
mixing