characterization of monoclonal antibodies using capillary ... · antibodies using capillary...
TRANSCRIPT
Characterization of Monoclonal Antibodies Using Capillary Electrophoresis-Electrospray Ionization-Mass Spectrometry (CE-ESI-MS)
Application Note
AuthorsSuresh Babu CV and Ravindra GudihalAgilent Technologies Pvt Ltd Bangalore, India
AbstractThis Application Note demonstrates the utility of capillary electrophoresis/mass spectrometry (CE/MS) for the analysis of intact monoclonal antibodies (mAbs). The Agilent 7100 CE System coupled to an Agilent 6530 Q-TOF LC/MS was used to study the intact and reduced forms of mAbs. The combination of mass measurements obtained by CE/MS and the data processing capabilities of Agilent MassHunter and BioConfi rm Software enables the identifi cation of heterogeneity in an intact mAb and its fragments. The result demonstrates the utility of CE/MS as a complementary technique to liquid chromatography/mass spectrometry (LC/MS) for the analysis of mAbs.
CE/MS Intact-mAb
LC
HC
2
SoftwareMassHunter Acquisition Software (B.06) for data acquisition and BioConfi rm software for data analysis. The raw MS spectra were subjected to pMod algorithms to generate the zero charge state spectra.
The CE/MS analysis was performed using the 7100 CE System with a CE/MS capillary cassette (G1603A) coupled to the 6530 Accurate-Mass Q-TOF equipped with electrospray source and orthogonal coaxial sheath liquid interface (G1607B). The sheath liquid was delivered by an Agilent 1200 series isocratic pump equipped with a 1:100 fl ow splitter. Table 1 shows the CE/MS parameters.
ExperimentalSamplesMonoclonal antibodies (IgG1 and IgG2) were proprietary therapeutic molecules.
InstrumentationCEAgilent 7100 CE System
MSAgilent 6530 (option 200) Accurate-Mass Quadrupole Time-of-Flight (Q-TOF)
InterfaceOrthogonal triple tube sheath liquid interface (G1607B)
IntroductionTherapeutic proteins such as monoclonal antibody (mAb) are gaining much attention in the biopharmaceutical industry. mAbs are susceptible to chemical modifi cation and degradation during production, formulation, and storage. Hence, it is important to monitor the manufacturing consistency, purity, and molecular weight. Capillary electrophoresis-sodium dodecyl sulfate (CE-SDS) with UV and fl uorescence detection is a technique routinely used for quality control testing of mAbs1. However, there is growing interest in exploring CE coupled to mass spectrometry (MS) for higher sensitivity and better compound identifi cation with accurate mass measurements.
The reagents and sample preparation procedures used for CE-SDS separation are not compatible with MS (mainly due to ion suppression issues). In addition, the assignment of peaks corresponding to post-translational modifi cation is challenging in SDS-protein capillary electrophoresis. Although liquid chromatography/mass spectrometry (LC/MS) can be regarded as the gold standard for recombinant protein characterization, CE/MS is an emerging technology in this fi eld2. For the analysis of peptides, CE/MS is an attractive complementary method to LC/MS, due to the effi cient analysis of hydrophilic low molecular weight peptides3,4. Further, CE/MS has the additional advantage of having low sample volume requirements (1–20 nL) compared to LC/MS. In this context, this Application Note demonstrates a CE/MS method for the primary characterization of mAbs. Intact, heavy, and light chain fragments of mAbs were analyzed with the Agilent CE/MS solution for two of the mAb samples. The results of this work are contrasted to a recent publication that shows the analysis of the same samples by LC/MS5.
Capillary electrophoresis (CE)CE Agilent 7100 CESample mAbs (3 μg/μL)Injection 10 seconds and 20 seconds at 50 mbar Capillary PVA, total length 70 cm, 50 μm idBuffer 50 mM acetic acidVoltage 30 kVInternal pressure 20 mbarTemperature 20 °CMass spectrometry (MS)MS Agilent 6530 Accurate-Mass Q-TOF LC/MSIonization mode ESIAcquisition mode MS (mass range 1,000–6,000 m/z)Sheath liquid 0.5 % acetic acid in 50 % methanol, 5 μL/minDrying gas fl ow 5 L/minNebulizer 10 psiDrying gas temperature 250 °CFragmentor 350 VVcap 3,500 V
Table 1. Instrumental conditions.

3
Software, and the deconvoluted spectra are shown in Figures 1E and 1F. The deconvoluted spectra for both mAbs showed four major mass peaks corresponding to different glycoform species, which is in good agreement with LC/MS measurements5.
mAbs are shown in Figures 1C and 1D. The charge state envelope spread between 2,400 m/z–5,100 m/z, higher in m/z than a typical LC/MS analysis using 0.1 % formic acid5. The mass spectrum was deconvoluted using the peak modeling (pMod) deconvolution algorithm in Agilent MassHunter BioConfi rm
Results and DiscussionIntact mAb analysisFigure 1 shows the CE/MS trace for the mAbs at intact levels. The mAbs were detected between 12 and 18 minutes as a broad peak (Figure 1A and 1B). The average mass spectrum of both intact
Figure 1. CE/MS of intact mAbs. A and B) total ion electropherograms of IgG1 and IgG2, C and D) charge envelope of IgG1 and IgG2, E and F) deconvoluted masses of IgG1 and IgG2.
00.20.40.60.81.01.21.41.61.82.02.2 144,497.26
144,658.10
144,337.43
144,819.33
144,100 144,300 144,500 144,700 144,900
00.20.40.60.81.01.21.41.61.82.02.22.42.62.83.03.23.43.63.8
3,526.75003,615.01473,442.7399
3,707.9254
3,805.71623,362.6279
3,286.3232 3,908.93063,213.10053,143.2420
3,076.3605 4,017.81892,950.7210
2,891.6495
2,400 2,600 2,800 3,000 3,200 3,400 3,600 3,800 4,000 4,200 4,4000
0.40.81.21.62.02.42.83.23.64.04.44.85.25.66.06.46.87.2
3,817.92863,719.7124
3,626.32753,921.3945
3,538.16703,453.6553
4,030.41533,371.7815
4,145.4089
3,297.69054,267.4752
3,223.4085 4,398.8402
Mass-to-charge (m/z)
Coun
tsCo
unts
2,900 3,100 3,300 3,500 3,700 3,900 4,100 4,300 4,500 4,700 4,900 5,100
00.10.20.30.40.50.60.70.80.91.01.11.21.31.41.51.61.7
145,106.07144,942.70
145,267.89144,781.84
Deconvoluted mass (amu)144,550 144,750 144,950 145,150 145,350 145,550
G2F/G1F
G1F/G1F
G0F/G1F
G0F/G0F
G0F/G1F
G2F/G1F
G1F/G1F
G0F/G0F
IgG2IgG1
00.10.20.30.40.50.60.70.80.91.01.11.21.31.41.51.6
2 4 6 8 10 12 14 16 18 20 22 24 26 28 30 32 34 36 38 40 42 44 46 48
×105 ×106
×101
×104
×102
×105
00.20.40.60.81.01.21.41.61.8
22.2
Acquisition time (min)
Mass-to-charge (m/z)
Deconvoluted mass (amu)
Acquisition time (min)
Resp
onse
Coun
tsCo
unts
Resp
onse
2 4 6 8 10 12 14 16 18 20 22 24 26 28 30 32 34 36 38 40 42 44 46 48
A B
C
D
E F
4
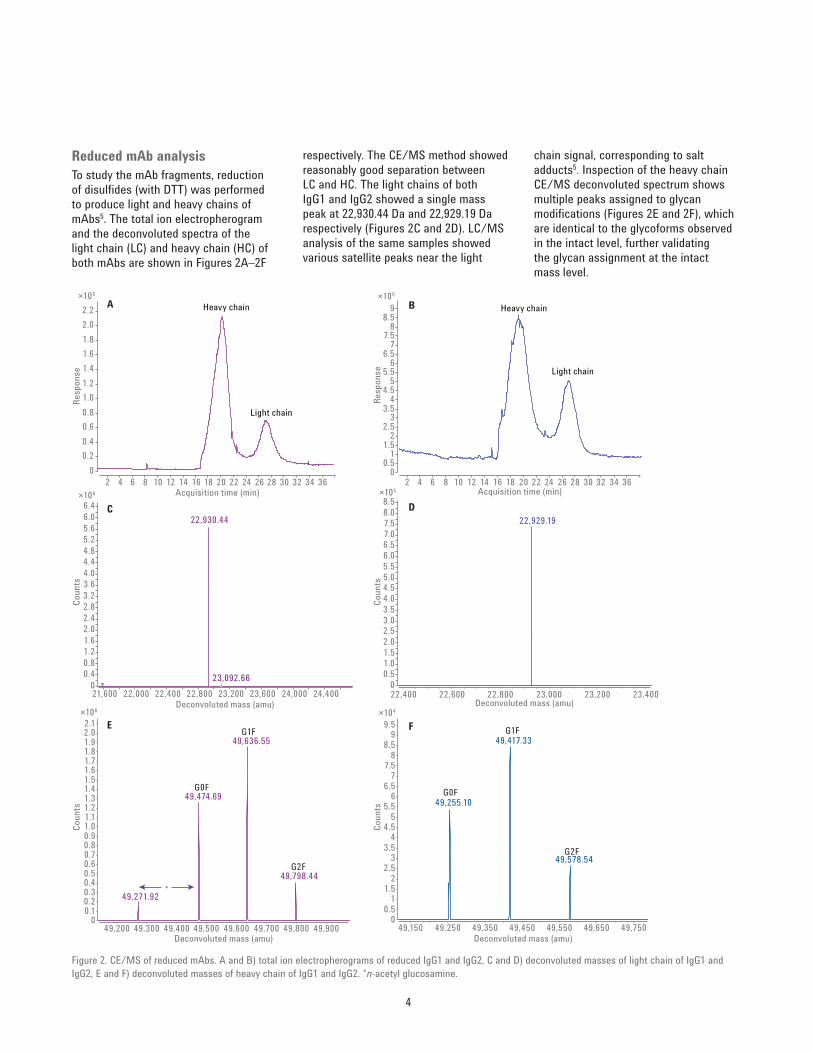
chain signal, corresponding to salt adducts5. Inspection of the heavy chain CE/MS deconvoluted spectrum shows multiple peaks assigned to glycan modifi cations (Figures 2E and 2F), which are identical to the glycoforms observed in the intact level, further validating the glycan assignment at the intact mass level.
respectively. The CE/MS method showed reasonably good separation between LC and HC. The light chains of both IgG1 and IgG2 showed a single mass peak at 22,930.44 Da and 22,929.19 Da respectively (Figures 2C and 2D). LC/MS analysis of the same samples showed various satellite peaks near the light
Reduced mAb analysisTo study the mAb fragments, reduction of disulfi des (with DTT) was performed to produce light and heavy chains of mAbs5. The total ion electropherogram and the deconvoluted spectra of the light chain (LC) and h eavy chain (HC) of both mAbs are shown in Figures 2A–2F
00.5
11.5
22.5
33.5
44.5
55.5
66.5
77.5
88.5
99.5
49,417.33
49,255.10
49,578.54
49,150 49,250 49,350 49,450 49,550 49,650 49,7500
0.10.20.30.40.50.60.70.80.91.01.11.21.31.41.51.61.71.81.92.02.1
49,636.55
49,474.69
49,798.44
49,271.92
49,200 49,300 49,400 49,500 49,600 49,700 49,800 49,900
00.51.01.52.02.53.03.54.04.55.05.56.06.57.07.58.08.5
22,929.19
22,400 22,600 22,800 23,000 23,200 23,400
G0F
G1F
G2F
00.40.81.21.62.02.42.83.23.64.04.44.85.25.66.06.4
22,930.44
23,092.6621,600 22,000 22,400 22,800 23,200 23,600 24,000 24,400
G0F
G1F
G2F
00.5
11.5
22.5
33.5
44.5
55.5
66.5
77.5
88.5
9
2 4 6 8 10 12 14 16 18 20 22 24 26 28 30 32 34 360
0.20.40.60.81.01.21.41.61.82.02.2
2 4 6 8 10 12 14 16 18 20 22 24 26 28 30 32 34 36
Heavy chain Heavy chain
Light chain
Light chain
×106
×106
×106
×105
×105
×104
A B
C D
E F
Acquisition time (min)
Coun
tsCo
unts
Resp
onse
Coun
tsCo
unts
Resp
onse
Deconvoluted mass (amu)
Deconvoluted mass (amu)
Acquisition time (min)
Deconvoluted mass (amu)
Deconvoluted mass (amu)
Figure 2. CE/MS of reduced mAbs. A and B) total ion electropherograms of reduced IgG1 and IgG2, C and D) deconvoluted masses of light chain of IgG1 and IgG2, E and F) deconvoluted masses of heavy chain of IgG1 and IgG2. *n-acetyl glucosamine.
5
The CE/MS deconvoluted spectra of IgG1 heavy chain showed a peak with a mass difference of 203 Da, corresponding to n-acetyl glucosamine modifi cation (*), which was absent in the LC/MS run. The results obtained are in good agreement with LC/MS measurements5.
ConclusionThe characterization of mAbs using an Agilent 7100 CE System coupled to an Agilent 6530 Accurate-Mass Q-TOF has been showcased. The usefulness of CE/MS for the analysis of intact antibodies and its fragments was demonstrated by using two mAbs in the present study. This CE/MS method can be used as a complement to LC/MS for the routine analysis of mAbs.

www.agilent.com/chem
This information is subject to change without notice.
© Agilent Technologies, Inc., 2014Published in the USA, October 1, 20145991-5212EN
References1. Optimization and validation of a
quantitative capillary electrophoresis sodium dodecyl sulfate method for quality control and stability monitoring of monoclonal antibodies. Anal. Chem. 2006, 78 (18), pp 6583-6594.
2. Characterization of Therapeutic Antibodies and Related Products. Anal. Chem. 2012, 85 (2), pp 715-736.
3. Applications of capillary electrophoresis in characterizing recombinant protein therapeutics. Electrophoresis 2014, 35 (1), pp 96-108.
4. CE/MS and LC/MS Synergy, Complementary Solutions for Peptide Mapping, Agilent Technologies, publication number 5991-2583EN.
5. Analysis of Monoclonal Antibody (mAb) Using Agilent 1290 Infi nity LC System Coupled to Agilent 6530 Accurate-Mass Quadrupole Time-of-Flight (Q-TOF), Agilent Technologies, publication number 5991-4266EN.
6. Primary Characterization of a Monoclonal Antibody Using Agilent HPLC-Chip Accurate-Mass LC/MS Technology, Agilent Technologies, publication number 5990-3445EN.