characterization of marcellus and barnett shale · pdf fileevolving methods for improved shale...
TRANSCRIPT

1
Characterization of Marcellus and Barnett Shale Flowback
Waters and Technology Development for Water Reuse
Tom Hayes, GTI
Hydraulic Fracturing Technical Workshop #4
USEPA Meeting Facilities
Arlington, VA
March 30, 2011

Major R&D Efforts on Produced Water Management
Industry Water Conservation Consortia
Barnett Shale (BSWCMC)
Appalachian Shale (ASWCMC)
Marcellus Shale Coalition
Individual Developer Company Testing of Available Know-How
RPSEA Program
NETL-DOE Program
NYSERDA Project on Shale Gas Issues
4
Components in Flowback Water
Constituents of Produced Water
+
Frac Job Additives

Natural Gas Industry Water Use in the Appalachian and Barnett Shale
Frac Jobs Drilling Other
5%
94%
(2010 Estimate)
<1%

Chemistry and Composition of Flowback Water


Components in Flowback Water
Constituents of Produced Water
+
Frac Job Additives

Sampling and Analysis of Flowback Water

Data on Sampling and Analysis of Flowback Water Marcellus Shale Water Characterization
Funded by MSC and ASWCMC Consortia
Sampling from 19 locations
Includes general chemistry and detailed analysis of constituents of interest
Lists of Constituents of Interest provided by the WV-DEP and PA-DEP
Over 250 determinations performed on samples
Barnett Shale Water Characterization
Sampling from 5 locations
Same sampling and analysis approach as Marcellus
Funded by RPSEA-DOE / Coord w/ BSWCMC

Marcellus Shale Approach
Samples taken at 0, 1, 5, 14, and 90 days following the frac job at each location
Sampling at Day 0:
Raw Water without additives
Raw Water with chemical additives before sand addn.
Uniformity of sampling and analysis
Standardized Plans (FSAP, QAPP)
Sampling performed by URS
Analyses performed by one lab (Test America)
Two lists of constituents for analysis
Extensive List applied to one sample/location
Less extensive list applied to other samples

General Chemistry of Influent and 5-Day Flowback (FB) Water Samples
Influent 5-Day Flowback Parameter Range Median Range Median Units
pH 6.7 – 7.4 7.2 5.8 – 7.2 6.6 -
Alkalinity * 6.2 – 88.8 52.5 48.8 - 327 138 mg/l
TDS ** 35 – 5,510 334 38,500- 67,300 mg/l
238,000
Tot Susp Solids ** <2‡ – 24 9.6 10.8 – 99 mg/l
3,220
Tot Org Carbon ** 1.8 – 202 3.8 3.7 - 388 62.8 mg/l
Biochemical <2.0‡ - 110 149 794 2.8 mg/l
Oxygen Demand ¥
Oil & Grease ** 19 31 NA < 5 mg/l
¥ mg/l as O* mg/l as CaCO3 2
‡ ND = Nondetect
Comparison of 14-Day FB Water with Conventional Produced Water
14-Day Flowback Conv. PW
Parameter Range Median Ranges₣
pH 4.9-6.8 6.2 5 – 8
Alkalinity * 26.1-121 85.2 NA
TDS ** 3,010 – 120,000 3,000 -
261,000 350,000
Tot Susp Solids ** 17 - 1,150 209 0-250
Tot Org Carbon ** 1.2 – 509 38.7 NA
Biochemical Oxygen 2.8 – 2,070 2.8 NADemand ¥
Oil & Grease ** < 0.5 - 103 7.4 mg/l 3 – 100¥ mg/l as O* mg/l as CaCO3 2 NA = Not Available‡ ND = Nondetect** mg/l ₣ IPEC, 2004; GRI, ‘94

Cations and Anions in Influent and FB Water Samples from Two Locations
Influent Blend 5-Day Flowback
Parameter ** Range Median Range Median
Sodium (Na+) 25.7 - 67.8 10,700 – 18,000
6,190 65,100
Calcium (Ca2+) 6.7 – 2,990 32.9 1,440 – 4,950
23,500
Magnesium (Mg2+) 1.2 - 235 6.7 135 – 1,550 559
Iron (Fe2+) ND – 14.3 1.2 10.8 – 180 39
Barium (Ba2+) 0.06 – 87.1 0.4 21.4 – 686
13,900
Chloride (Cl-) 4.1 – 3,000 42.3 26,400 – 41,850
148,000
Bicarbonate (HCO -3 ) < 1 – 188 49.9 29.8 - 162 74.4
Ammonia (NH +4 ) 0.58 - 441 5.9 15 - 242 82.4
** mg/l

Concentration of TDS in Flowback Water with
Time During Well Completion: Location A

Concentration of TDS in Flowback Water with
Time During Well Completion: Location B

Typical Profile of Flowback Water Flow and
Dissolved Solids Versus Time
Days from Hydraulic Fracture Event
Flowback Water Total Dissolved Solids, mg/l
1000
0
3000
Ave F
low
* in th
e In
terv
al, B
bl/d
200014 - 90 Day
Interval
•Average Daily Flow of the Flowback Water Output within Each Interval

Categories of Chemicals of Concern
Volatile Organics
Semivolatile Organics
Pesticides
Organophosphorus Pesticides
PCBs
Metals
Radiological Determinations

Volatile Organics

Volatile Organics
71 Species
A few sought after constituents are often found in conventional produced waters: benzene, toluene, xylenes, ethylbenzene
Most of the volatiles on the list were man made chemicals not found in conventional produced waters

Examples
Chlorinated benzenes
Chlorinated alkanes
Chlorinated alkenes
Ketones
MTBE
Brominated benzenes
Acrolein
Chloroform
Methylene chloride
Styrenes
Vinyl acetate
Vinyl chloride
Ethylbenzene
Trichloroethylene
Chloromethane
Acrylonitrile
Carbon Disulfide
Carbon Tetrachloride

Locations
Summary of Results of Volatiles
Measurements in 14-Day Samples
BTEX, Acetone
1, 2, 4 – Trimethylbenzene
1, 3, 5 - Trimethylbenzene Zero
Constituents
Number of Volatile Constituents

Semivolatile Organics

Semivolatile Compounds
113 Species
A few sought after constituents are occasionally found in conventional produced waters: naphthalene, 2-methyl naphthalene, phenanthrene, phenol
Many of the semivolatiles on the list were man made chemicals not found in conventional produced waters
Many of the semivolatiles are derived from or constituents of coal or coal tar

Examples
Benzo (a) pyrene
Chlorinated phenols
Chrysene
Chlorinated Benzenes
Nitrophenols
Fluorene
Methylphenols
Naphthalene
1,4 - Naphthoquinone
Phenol
Pyrene
Phthalates
Fluoranthene
Diphenylamine
Acenaphthylene
Bis (2-Chloroethyl)
ether
Dibenzofuran

Locations
Summary of Results of Semivolatile
Measurements in 14-Day Samples
Naphthalene
2-Methylnaphthalene
Phenanthrene
Pyridine
(* < 0.5 µg/l for Most Constituents)
*
Zero
Constituents
Number of Semivolatile Constituents

Pesticides

Examples
Chlordane
Alpha-BHC
Beta-BHC
Delta-BHC
Gamma-BHC
Heptachlor
Aldrin
Heptachlor epoxide
Endosulfan I
Dieldrin
4, 4’ - DDE
Endrin
Endrin ketone
Endrin aldehyde
Endosulfan II
4, 4 - DDT
Endosulfan sulfate
Toxaphene

Number of Chlorinated Pesticide Constituents
Locations

Organophosphorus Pesticides
& PCB’s
All Non-Detect

Metals

Examples
Mercury
Arsenic
Boron
Trivalent Chromium
Hexavalent Chromium
Copper
Nickel
Zinc
Lead
Selenium
Cobalt
Iron
Manganese
Lithium
Tin

Selected Metals in 5-Day Flowback Water Compared to Muni Sludges
5 – Day Flowback Muni Sludges**
Metals * Range Median Median 95th %ile
Chromium ND – 0.15 0.015 35 314(Cr3+)
Copper ND – 4.15 ND 511 1,382
Nickel ND – 0.187 ND 22.6 84.5
Zinc 0.068 – 2.93 0.16 705 1,985
Lead ND – 0.606 ND 65 202
Cadmium ND – 0.009 ND 2.3 7.4
Mercury ND - 0.00024 ND 1.5 6.0
Arsenic ND – 0.124 0.029 3.6 18.7
* mg/l
ND = Non Detect ** Penn State, 2000 (Survey of POTW’s)

Barnett Flowback Water
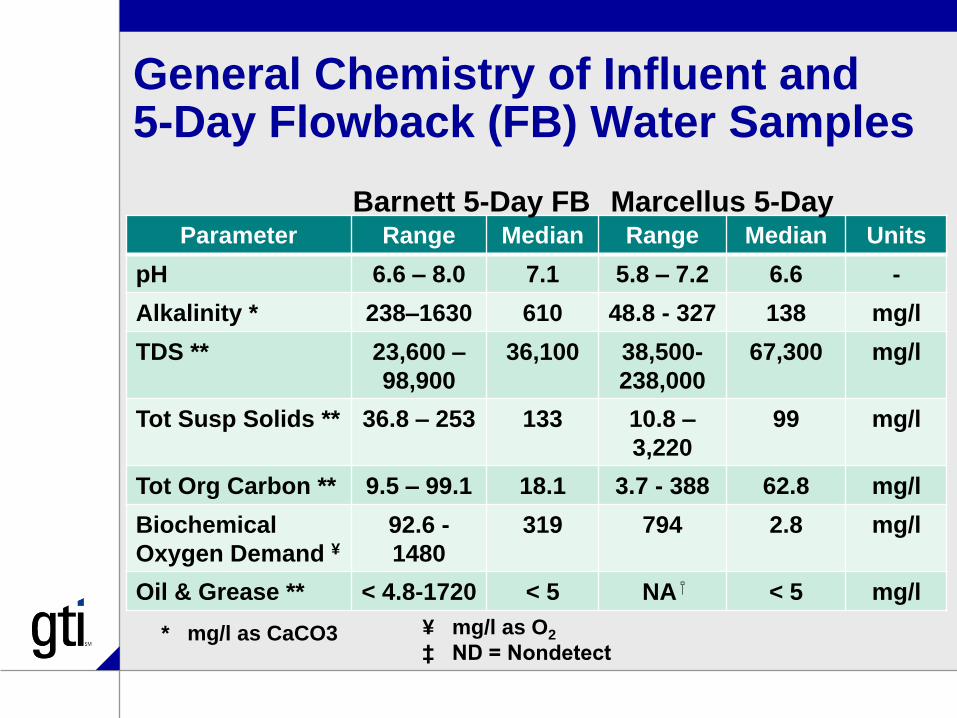
General Chemistry of Influent and 5-Day Flowback (FB) Water Samples
Barnett 5-Day FB Marcellus 5-DayParameter Range Median Range Median Units
pH 6.6 – 8.0 7.1 5.8 – 7.2 6.6 -
Alkalinity * 238–1630 610 48.8 - 327 138 mg/l
TDS ** 23,600 – 36,100 38,500- 67,300 mg/l
98,900 238,000
Tot Susp Solids ** 36.8 – 253 133 10.8 – 99 mg/l
3,220
Tot Org Carbon ** 9.5 – 99.1 18.1 3.7 - 388 62.8 mg/l
Biochemical 92.6 - 319 794 2.8 mg/l
Oxygen Demand ¥ 1480
Oil & Grease ** < 4.8-1720 < 5 NA < 5 mg/l
¥ mg/l as O* mg/l as CaCO3 2
‡ ND = Nondetect

Summary of Results
Flowback water characteristics are consistent with ranges observed with conventional produced water
Low suspended solids and TOC
Man-made chemicals of concern are at non-detect levels.
BTEX and PAHs are at trace levels.
Oils and greases are at non-problem levels, but some control may be needed
Soluble organics are highly biodegradable
Heavy metals are lower than in Mun Sludge

Possible Treatment Needs
Brine Volume Reduction with Water Recovery (for reuse in future frac jobs)
Removal of Polymers (Friction Reducer Compounds)
Scale Control (Including NORM Scale)
Oil and Grease Control
Soluble Organics: Decrease Total Organic Carbon
Control of suspended solids
Microbial Control

Water Reuse
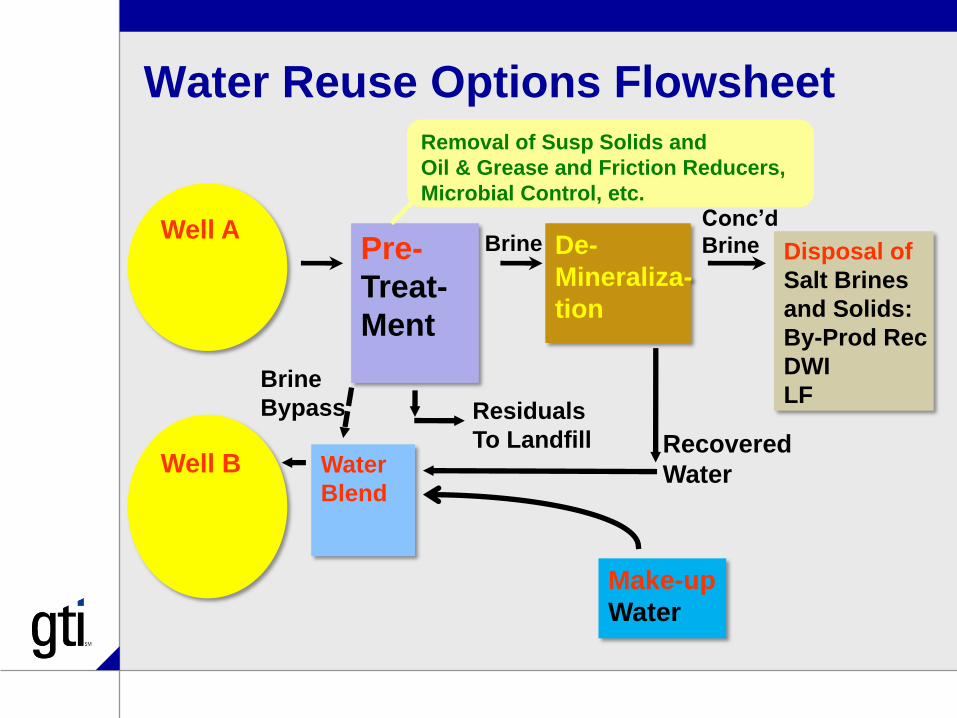
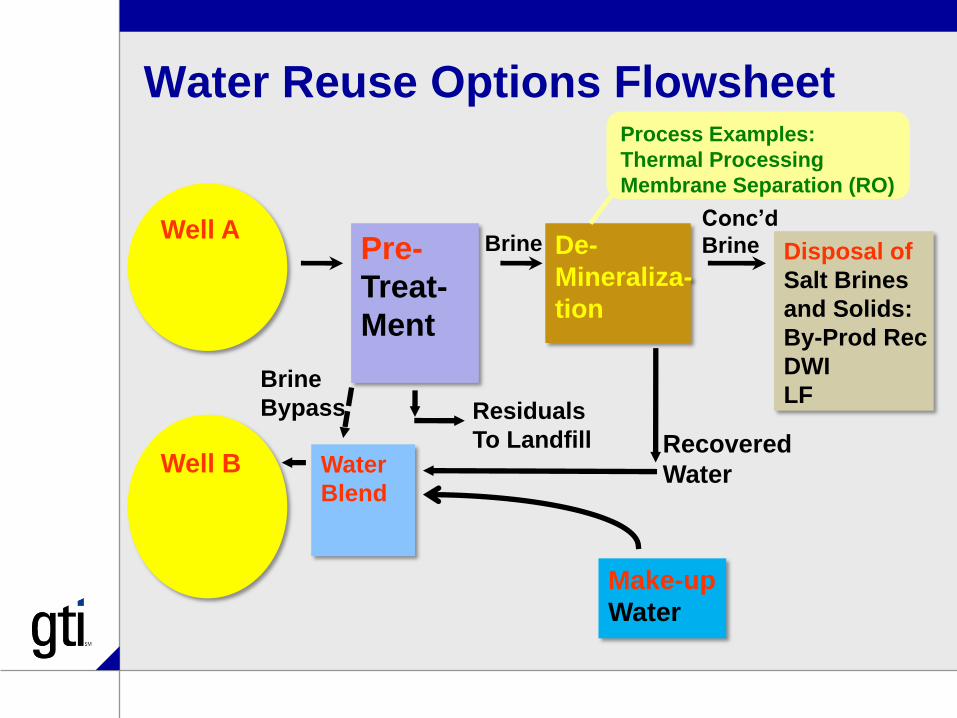
Two Schools of Thought
1. Condition brines to control SS, O&G, scale-forming potential, microbes, etc. --- without demineralization --- and blend for reuse
2. Employ Demineralization to generate a low TDS water that can be recovered for reuse
Demineralization can be achieved with thermal systems or with membranes.
Pretreatment is used to protect the demineralization processing stage.
Prevention of fouling of heat exchangers and membranes is important.
Each of the above options has advantages and disadvantages

Water Reuse Options Flowsheet
Pre-
Treat-
Ment
De-
Mineraliza-
tion
Disposal of
Salt Brines
and Solids:
By-Prod Rec
DWI
LF
Make-up
Water
Well A
Well B
Conc’d
Brine
Residuals
To Landfill Recovered
Water
Brine
Water
Blend
Brine
Bypass
Water Reuse Options Flowsheet
Pre-
Treat-
Ment
De-
Mineraliza-
tion
Disposal of
Salt Brines
and Solids:
By-Prod Rec
DWI
LF
Make-up
Water
Well A
Well B
Conc’d
Brine
Residuals
To Landfill Recovered
Water
Brine
Water
Blend
Removal of Susp Solids and
Oil & Grease and Friction Reducers,
Microbial Control, etc.
Brine
Bypass
Water Reuse Options Flowsheet
Pre-
Treat-
Ment
De-
Mineraliza-
tion
Disposal of
Salt Brines
and Solids:
By-Prod Rec
DWI
LF
Make-up
Water
Well A
Well B
Conc’d
Brine
Brine
Bypass Residuals
To Landfill Recovered
Water
Brine
Water
Blend
Process Examples:
Thermal Processing
Membrane Separation (RO)

Fountain Quail Mechanical Vapor
Recompression Unit for Flowback
Water Treatment and Reuse
43
• At Devon Sites
• > 6,000 bbls/d/site
• AquaPure Mfgr
• Operated by
Fountain Quail
• Obtaining field
Performance
Information
• Over 70% Water
Recovery
• Handles wide
feed variations

Reverse Osmosis Trials in the Barnett

Examples of Currently Available Innovative
Brine Management Technology Options
Fountain Quail (Thermal Processing for Water Recovery)
212 Resources (Thermal Processing for Water Recovery)
GE Thermal Processing (Thermal Processing for Water Recovery)
Intevras (Heat Recovery from Compressor Engines for Brine Evap)
GeoPure (UF / Reverse Osmosis)
Ecosphere Technologies (Ozonation and Reverse Osmosis)

Rapidly Moving Shale Gas Industry Solutions Evolving Methods for Improved Shale Gas
Completions and Operations Impact Water Demands and Treatment Needs
Improved Understanding of the Water Life Cycle of Development Areas is Important
No Single Silver Bullet
Field Experience and Relevance is Critical
Solution Providers / Service Companies
Developers
Technologists
Need to Avoid Prescriptive Remedies
46


48

67
Characterization of Marcellus Shale and Barnett Shale Flowback Waters and Technology Development for Water Reuse
Tom Hayes Gas Technology Institute
The statements made during the workshop do not represent the views or opinions of EPA. The
claims made by participants have not been verified or endorsed by EPA.
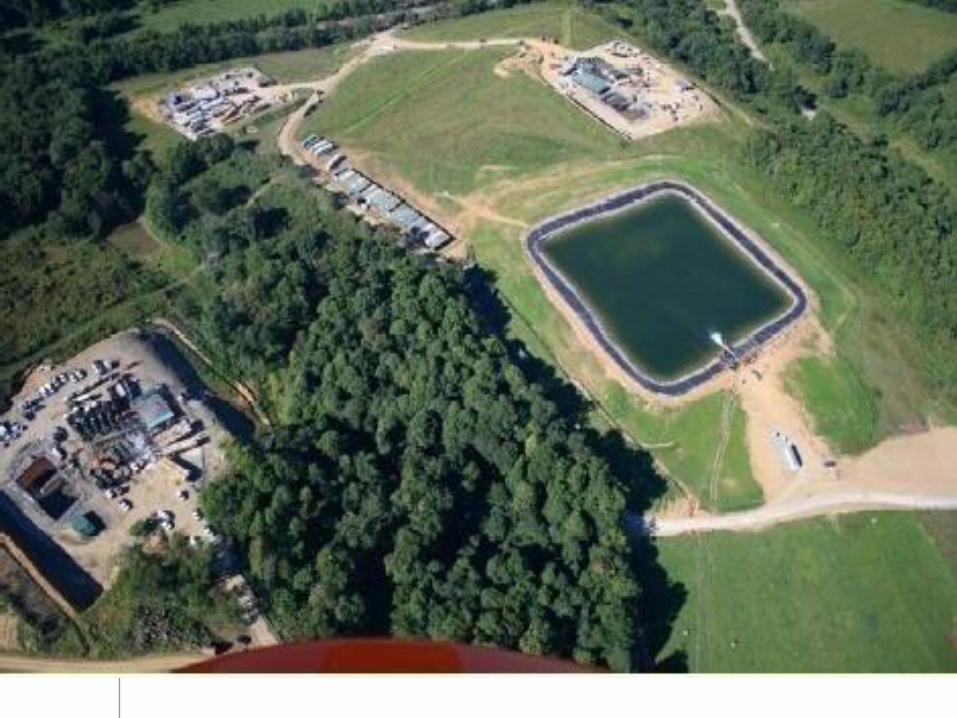
The Barnett and Appalachian Shales are among the largest and most active natural gas plays in the U.S. that geographically covers all or part of 20 counties in North Texas and large areas of Pennsylvania and West Virginia. The Barnett area is proven to have approximately 2.5 trillion cubic feet (59 km3) of natural gas reserves and is widely estimated to contain up to 27 trillion cubic feet (700 km3) of technically recoverable natural gas (USGS, 2004; Clouser, 2006). The Marcellus Play of the Appalachian Shale Region is considered to be larger in size and capacity in comparison to the Barnett. Both shale plays are considered to be unconventional gas formations; each of these plays depend upon the economical utilization and environmentally-responsible management of large volumes of water for continued sustainable development. Hydraulic fracturing (fracing) is a necessary step for initiating economical well performance, requiring between 1 and 4 million gallons of water for successful well completion. Vertical wells require approximately 1 million gallons and horizontal wells require 3-4 million gallons according to Barnett Shale Producers. These per-well levels of water production also apply to the wells installed and completed in the Marcellus Shale. In both plays, horizontal wells comprise more than 90% of the total wells that are constructed. Of the total water used by the industry, completions using hydraulic fracturing represent more than 94% and drilling represents 5% as see in Slide 6 (Galusky, 2007). During years when more than 2,000 wells are constructed in a shale gas play, approximately 2 billion gallons will be used for new completions. This level of water demand poses a number of challenges for industry in the course of developing the Barnett and Appalachian Shales for natural gas production. In recognition of this need, the natural gas industry has supported efforts to characterize flowback water and evaluate water reuse approaches that significantly reduce freshwater demand while providing environmentally acceptable options for flowback water management.
Flowback Water Characteristics
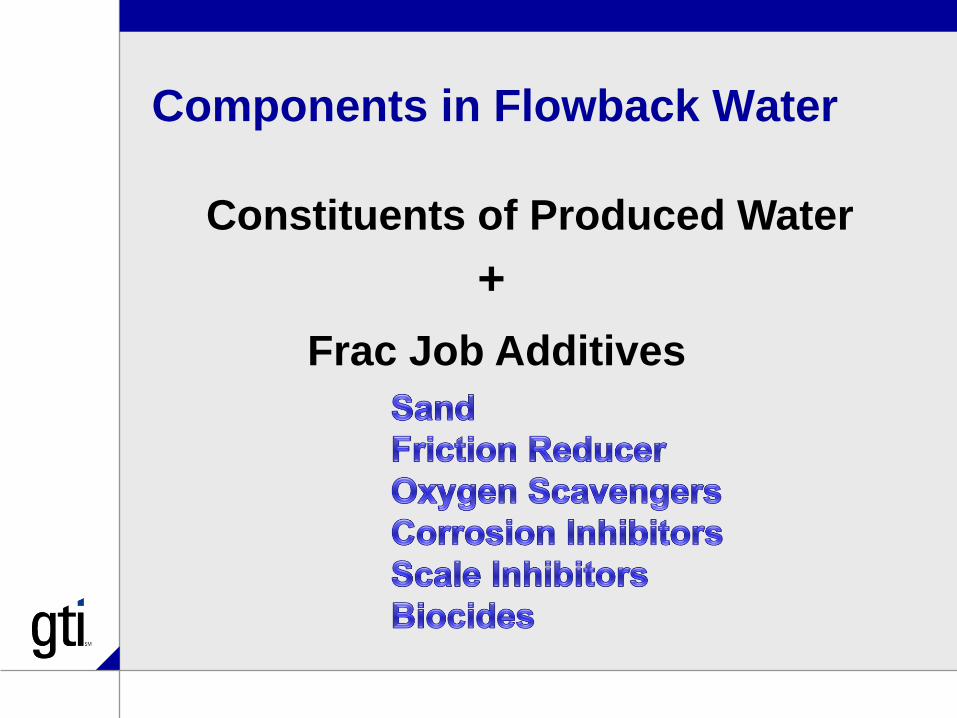
Effective management of flowback water requires some level of knowledge of the characteristics of the water; a breakdown of categories of constituents found in many flowback and produced waters is depicted in Slide 8. Flowback water contains salts, metals and organic compounds from the formation as well as many of the compounds that were introduced as additives to the influent stream. Discussions between the industry and regulatory agencies of Pennsylvania and West Virginia have pointed to the need for an information base on the composition and properties of flowback water and on the influent water streams that are used

68
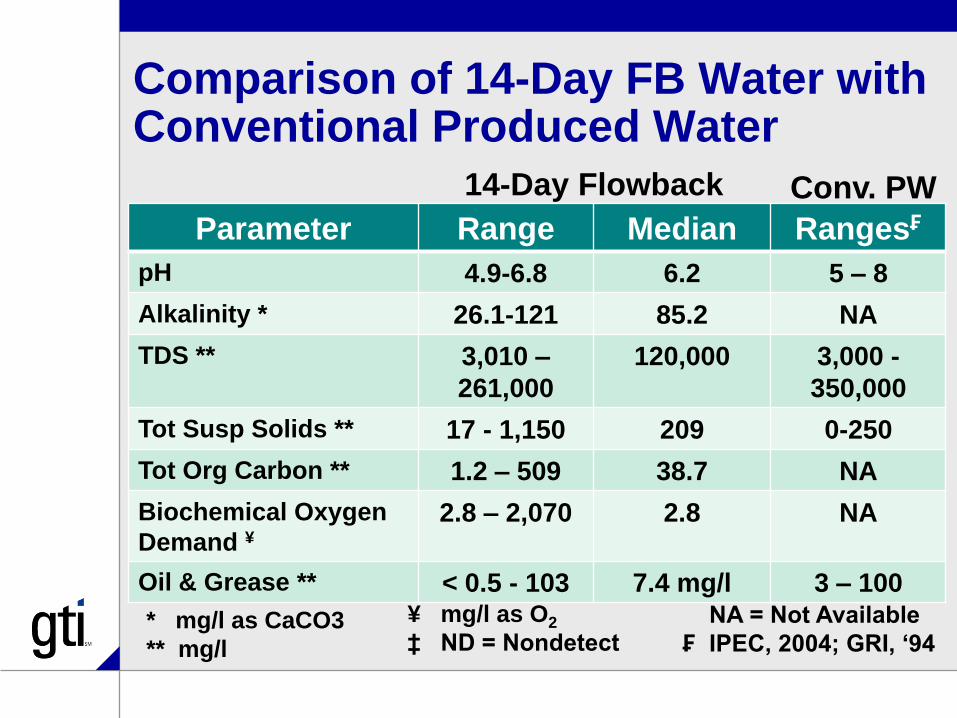
to perform frac jobs. The objective of this effort was to conduct the initial sampling and analysis of water streams associated with shale gas development in the Marcellus Shale. In recognition of the importance of this effort, 17 member companies of the Marcellus Shale Coalition (MSC) volunteered 19 locations where shale gas wells were scheduled to be hydraulically fractured. The Field Sampling and Analysis Plan and the Quality Assurance Project Plan were developed, reviewed, and finalized for the effort by the companies of the Appalachian Shale Water Conservation and Management Committee (ASWCMC), PA-DEP and WV-DEP. At each of the host sites, samples of influent water streams at Day 0 and the flowback water streams at 1, 5, 14, and 90 days following the frac job event were collected by a single engineering subcontractor, URS. All samples were sent to Test America (a PA-DEP certified environmental testing laboratory) for analysis. The list of constituents recommended for the characterization study was developed from comments received from the PADEP, the WVDEP and members of the Appalachian Shale Water Conservation and Management Committee (ASWCMC). Categories of determinations that were conducted included: 1) General Chemistry, 2) Organic Compounds, and, 3) Metals. Once reviewed and qualified, data from these analyses were organized and tabulated in a source blind manner into an Excel spreadsheet that currently represents the information base. Results from this effort indicate that values for pH, alkalinity, total dissolved solids, total organic carbon, oils and greases and other parameters from general water characterization are within the normal ranges reported for conventional produced waters by the USGS. General characteristics of Marcellus Shale waters (influent and 5-day flowback) are shown in Slide 13. Comparisons of characteristics of 14-day flowback waters with conventional produced waters are shown in Slide 14. Flowback water concentrations of total dissolved solids ranged from 3,000 to 260,000 mg/l; typical profiles show an increase in total dissolved solids in flowback water with time following a frac job event (as shown in Slides 16-18). Anions and cations of influent and 5-day flowback water are shown in Slide 15; as with conventional produced water, shale gas flowback water cations are dominated by sodium and calcium; the main anion is chloride. Metals normally seen in conventional produced waters, such as iron, calcium, magnesium, and boron, are at levels in flowback waters that are well within known ranges for normal produced waters. Heavy metals that are of concern in urban industrial wastewaters and POTW sludges --- such as chromium, copper, nickel, zinc, cadmium, lead, arsenic and mercury --- are at very low levels in flowback and produced waters (as shown in Slide 34). Among volatile organic constituents, more than 93% of all constituent determinations were at non-detectable levels and less than 1% of the determinations (mainly volatile constituents that are a natural part of formation waters) were above 1 ppm (as shown in Slide 23). Virtually all man-made halogenated solvents were at non-detect levels; volatile constituents that are measureable, are those that are normally found in conventional produced waters. Regarding semivolatile organic constituents, more than 96% of all determinations were at nondetectable levels and less than 0.1% of all constituents were above 1 ppm; the remainder of
69
constituents were at low trace levels – usually below 10 ppb (as seen in Slide 27). All chlorinated pesticides, organophosphorus pesticides and polychlorinated biphenyls in all samples were determined to be at non-detect levels. The results of this shale gas water characterization effort indicate that all pesticides, PCBs, and a large fraction of the volatile and semivolatile constituents should be considered to be unnecessary for the sampling and analysis of flowback waters in the future. Recently, characterization of shale gas waters has been completed for five locations in the Barnett using the same procedures employed in the Marcellus Shale Project; general characteristics of the 5-day flowback waters are compared between the two plays. For the limited number of sites sampled, the Barnett Shale waters appear to be significantly lower in total dissolved solids -- about half of the TDS levels of the Marcellus Shale waters that range from 38,000 to 238,000 mg/l TDS. Alkalinities of the Barnett waters at 238 to 1630 mg/l (as CaCO3) are relatively higher than the Marcellus waters -- perhaps four times higher -- due to the greater presence of bicarbonate concentrations in the Barnett waters. Marcellus shale water, however, showed significantly higher levels of TOC than Barnett waters though most samples from both plays had TOC levels below 70 mg/l (modest TOC levels).
Water Reuse Technology Evaluations and Development
Information on water flows in the shale gas industry indicate that although each well completion represents a potential significant flowback water output equivalent to 5-35% of the influent water, it is also true that future hydraulic fractures represent substantial opportunities for the reuse of these waters, especially during the growth phase of each shale gas development area. The median flowback water volume collected from 19 locations in the Marcellus Shale was approximately 24 percent of the influent water volumes used for each completion operation. Predominantly, the industry prefers to dispose of flowback and produced waters using Class II deep well injection if such disposal capacity is locally available and economically accessible. In areas of the U.S. where Class II wells are sparse (the Marcellus Shale has only 7 Class II wells which represents a very low capacity to accept produced waters and flowback), water reuse has been a logical alternative to pursue as is done in the Pennsylvania portion of the Marcellus Shale. In areas of the U.S. where severe limitations of water availability can arise from frequent occurrences of drought, shale gas developers have considered water reuse as a means of significantly reducing demands on sources of fresh water that compete with community water supplies. Where flowback and produced water reuse are being pursued aggressively, there are mainly two schools of thought that exist in the shale gas industry. Approach A is comprised of conditioning the brines for the removal of suspended solids, oils and greases, bacteria, and scale forming ions (i.e. constituents that potentially interfere with equipment and infrastructure maintenance) with no demineralization (desalination) prior to reuse. Currently, this approach is being used within the Marcellus Shale as the predominant shale gas water management practice. A more rigorous treatment (“Approach B”) is comprised of treating shale gas water all

70
the way to the recovery of distilled or demineralized water with the concomitant generation of a small volume of concentrated brine; this rigorous treatment approach is usually capable of recovering demineralized water equivalent to 70-80% of the original flowback/produced water stream. A general flowsheet that encompasses water reuse options available to the industry are shown in Slides 40-42. Since 2005, the shale gas developers have evaluated a number of processes capable of demineralization and brine volume reductions. The most capable demineralization approach that has been demonstrated in the treatment of shale gas waters -- in terms of reliability and performance -- is the mechanical vapor recompression thermal distillation (MVR) process. This process is capable of handling a very wide range of brines (from less than 10,000 mg/l to more than 120,000 mg/l TDS) while achieving over 70 percent efficiencies in water recovery. This process is commercially applied to shale gas water stream management in the Barnett and in some shale gas fields of the Western U.S. Another demineralization process that has been tested on shale gas waters in the field is reverse osmosis (RO), though to a much lesser extent than the MVR process. Tests with RO on shale gas waters have verified the ability of the process to recover about 60% of highly demineralized water as long as the influent water did not exceed 40,000 mg/l of TDS. Photos of MVR and RO field demonstration units (located in the Barnett Shale) are shown in Slides 43 and 44. Demineralization with either process comes with a significant cost that must be evaluated and understood to achieve effective deployment. In the shale gas industry, demonstrations involving both processes are continuing.