characterization of aquifer heterogeneity using
TRANSCRIPT
U.S. Department of the InteriorU.S. Geological Survey
Water-Resources Investigations Report 03-4208
Characterization of Aquifer Heterogeneity Using Cyclostratigraphy and Geophysical Methods in the Upper Part of the Karstic Biscayne Aquifer, Southeastern Florida
Prepared in cooperation with the
South Florida Water Management District
Characterization of Aquifer Heterogeneity Using Cyclostratigraphy and Geophysical Methods in the Upper Part of the Karstic Biscayne Aquifer, Southeastern Florida
By Kevin J. Cunningham, Janine L. Carlson, G. Lynn Wingard, Edward Robinson, and Michael A. Wacker
U.S. Geological Survey
Water-Resources Investigations Report 03-4208
Prepared in cooperation with the SOUTH FLORIDA WATER MANAGEMENT DISTRICT
Tallahassee, Florida2004
U.S. DEPARTMENT OF THE INTERIOR GALE A. NORTON, Secretary
U.S. GEOLOGICAL SURVEYCharles G. Groat, Director
Use of trade, product, or firm names in this publication is for descriptive purposes only and does not imply endorsement by the U.S. Geological Survey.
For additional information write to:
U.S. Geological Survey2010 Levy AvenueTallahassee, FL 32310
Copies of this report can be purchased from:
U.S. Geological SurveyBranch of Information ServicesBox 25286Denver, CO 80225-0286888-ASK-USGS
Additional information about water resources in Florida is available on the internet at http://fl.water.usgs.gov
Contents III
CONTENTS
Abstract ...................................................................................................................................................................................... 1Introduction................................................................................................................................................................................ 2
Purpose and Scope ........................................................................................................................................................... 4Previous Studies ............................................................................................................................................................... 4Acknowledgments............................................................................................................................................................ 6
Methods of Investigation............................................................................................................................................................ 7Ground-Penetrating Radar Surveys.................................................................................................................................. 7Drilling, Well Completion, Core Analysis, and Geophysical Logging............................................................................ 7Quantification of Vuggy Porosity from Borehole Images ............................................................................................... 9Molluscan and Benthic Foraminiferal Paleontology........................................................................................................ 9
Geologic Framework................................................................................................................................................................ 10Lithostratigraphy............................................................................................................................................................ 10Molluscan Paleontology................................................................................................................................................. 11
Paleoenvironments ............................................................................................................................................... 11Shallow Shelf to Outer Estuarine ............................................................................................................... 11Inner Estuarine ........................................................................................................................................... 11Freshwater .................................................................................................................................................. 13
Stratigraphic Age ................................................................................................................................................. 13Foraminiferal Paleontology............................................................................................................................................ 13Cyclostratigraphy ........................................................................................................................................................... 20Rock-Fabric and Depositional Facies ............................................................................................................................ 22
Shallow-Shelf Depositional Facies ...................................................................................................................... 22Brackish Depositional Facies ............................................................................................................................... 26Freshwater Depositional Facies ........................................................................................................................... 26
High-Frequency Cycles.................................................................................................................................................. 31Upward-Shallowing Brackish- or Freshwater-Capped Cycles ............................................................................ 31Subtidal Cycles..................................................................................................................................................... 32
Characterization of Cyclostratigraphy, Porosity, and Permeability Using Ground-Penetrating Radar ................................... 32Upper Surface of HFC4 ................................................................................................................................................. 36Krome Avenue Site ........................................................................................................................................................ 36
Hydrogeologic Framework ...................................................................................................................................................... 39Previous Interpretations ................................................................................................................................................. 41High-Resolution Hydrogeologic Framework................................................................................................................. 42
Low-Permeability Peat, Muck, and Marl Ground-Water Flow Class (GWFC1) ................................................ 42Horizontal Conduit Ground-Water Flow Class (GWFC2) .................................................................................. 42Leaky, Low-Permeability Ground-Water Flow Class (GWFC3) ........................................................................ 46Diffuse-Carbonate Ground-Water Flow Class (GWFC4).................................................................................... 49
High-Resolution Hydrogeologic Framework Along Selected Canals ........................................................................... 57Biscayne Aquifer Pore System and Evolution ............................................................................................................... 57
Summary and Conclusions ...................................................................................................................................................... 61Selected References ................................................................................................................................................................. 62Appendix I: Geophysical Log Descriptions.......................................................................................................................on CDAppendix II: Porosity and Permeability from Core Samples ............................................................................................on CDAppendix III: Occurrence of Molluscan Taxa Identified in Selected Whole-Core Samples.............................................on CDAppendix IV: Digital Borehole Images, Slabbed Core Photographs, Thin-Section Photomicrographs, and
Whole-Core Porosity and Permeability Data ................................................................................................................on CDAppendix V: Peat and Marl Push-Core Sample Descriptions ...........................................................................................on CD
PLATES
[Plates are in pocket]
1. Hydrogeologic section A-A′ showing cycle stratigraphy, rock-fabric facies, and ground-water flow classes for the upper part of the Biscayne aquifer in the Lake Belt area
2. Hydrogeologic section B-B′ showing cycle stratigraphy, rock-fabric facies, and ground-water flow classes for the upper part of the Biscayne aquifer in the Lake Belt area
3. Hydrogeologic sections C-C′ and D-D′ showing cycle stratigraphy, rock-fabric facies, and ground-water flow classes for the upper part of the Biscayne aquifer in the Lake Belt area
4. Hydrogeologic sections E-E′ and F-F′ showing cycle stratigraphy, rock-fabric facies, and ground-water flow classes for the upper part of the Biscayne aquifer in the Lake Belt area
5. Hydrogeologic sections G-G′, H-H′, and I-I′ showing cycle stratigraphy, rock-fabric facies, and ground-water flow classes for the upper part of the Biscayne aquifer in the Lake Belt area
FIGURES
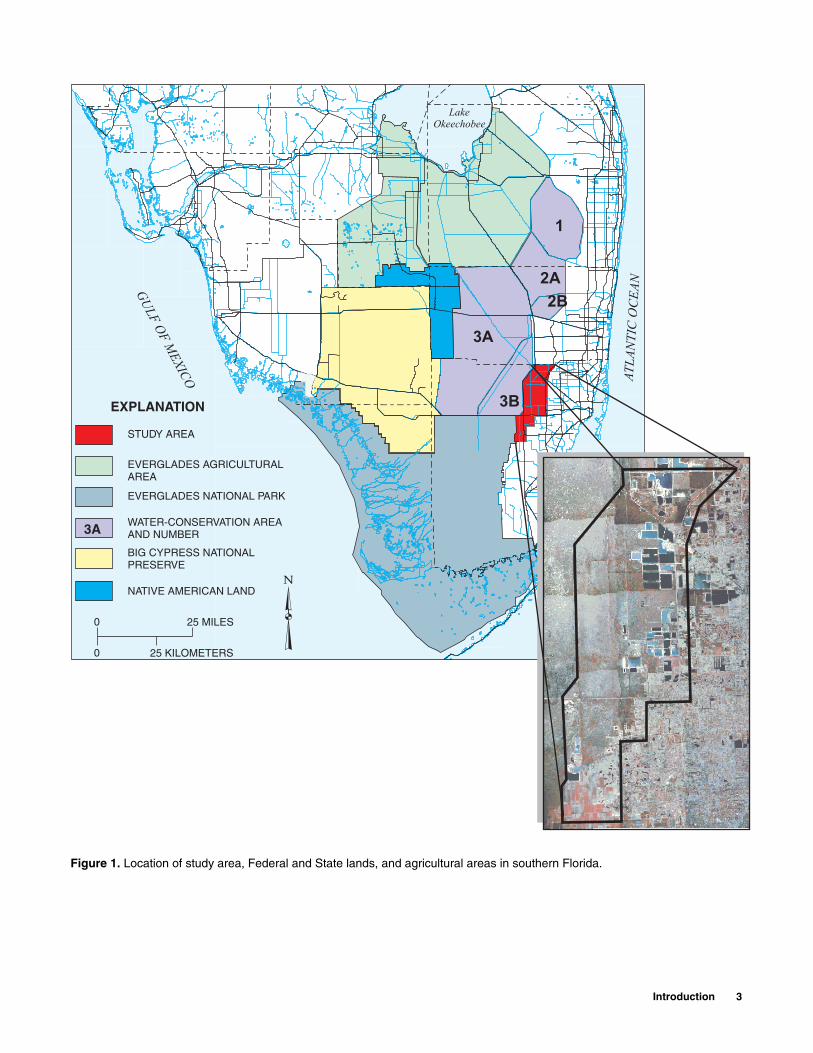
1-4. Maps showing location of: 1. Study area, Federal and State lands, and agricultural areas in southern Florida ......................................................3 2. Study area, canals, levees, and Old South Dade Landfill in Miami-Dade County, tracks of ground-penetrating
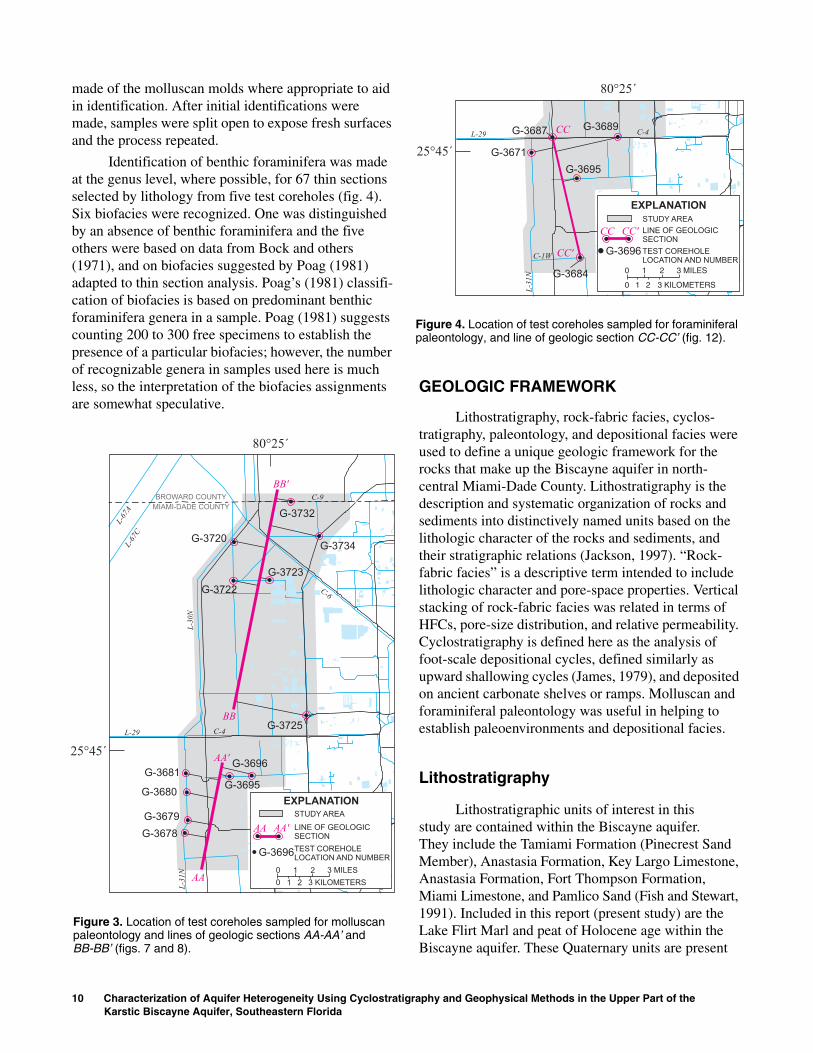
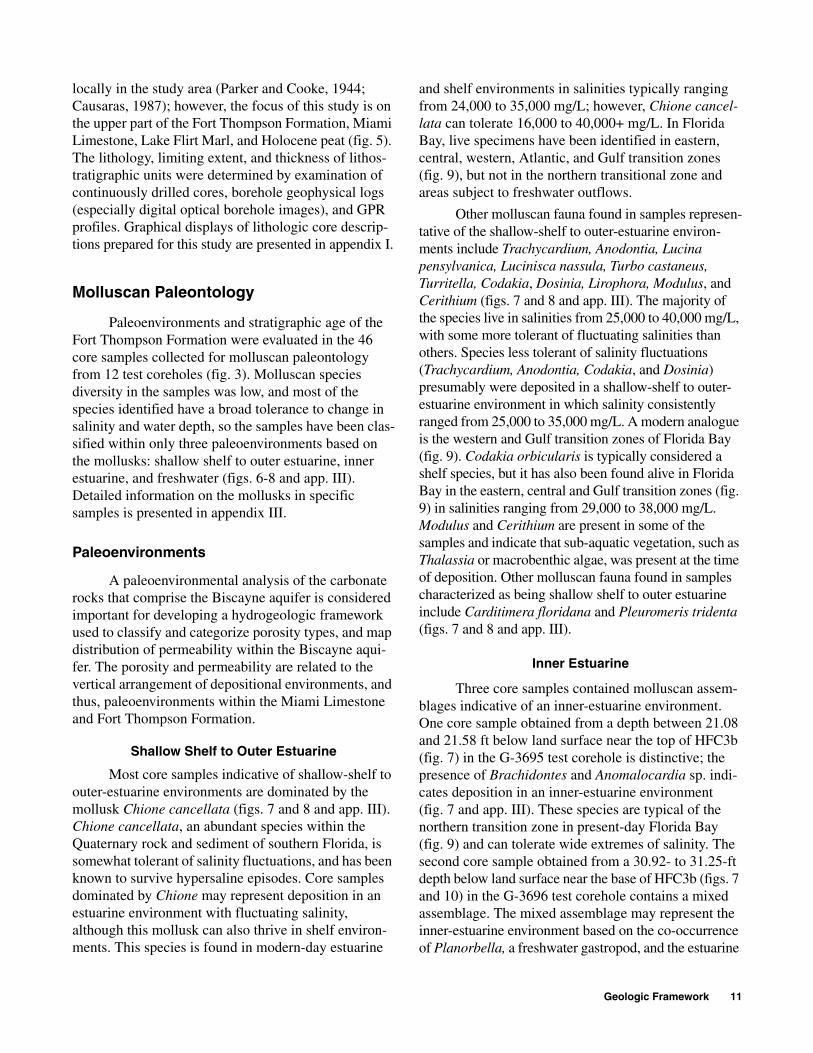
radar, and test coreholes drilled for this study ..........................................................................................................5 3. Test coreholes sampled for molluscan paleontology and lines of geologic sections AA-AA′ and BB-BB′ .............10 4. Test coreholes sampled for foraminiferal paleontology, and line of geologic section CC-CC′..............................10
5. Hydrogeologic section showing relation of geologic and hydrogeologic units of the surficial aquifer system across central Miami-Dade County...............................................................................................................................12
6. Explanation of symbols in figures 7, 8, and 12.............................................................................................................13 7. Geologic section AA-AA′ showing molluscan taxonomy identified in test coreholes included in the study area ........14 8. Geologic section BB-BB′ showing molluscan taxonomy identified in test coreholes included in the study area ........15 9. Map of present-day Florida Bay showing zonation based on differences in circulation and its connections,
which play a role in salinity and habitat structure.........................................................................................................1610. Chart showing shallow time-stratigraphic units, hydrogeology, lithostratigraphy, “Q units,” and high-frequency
cycles used in this report for southeastern Florida........................................................................................................1611. Photomicrographs of foraminifera that are characteristic of foraminiferal biofacies 2, 3, 4, and 5 .............................2012. Geologic section CC-CC′ showing foraminiferal taxonomy identified in test coreholes included in the study area...2113. Diagram showing idealized subtidal high-frequency cycles of the Miami Limestone .................................................2314. Diagram showing idealized supward-shallowing brackish- or freshwater-capped high-frequency cycle of the
Fort Thompson Formation ............................................................................................................................................2415-17. Maps showing:
15. One-way travel time to top of HFC4 ......................................................................................................................3316. Electromagnetic-wave velocity between land surface and top of HFC4 ................................................................3417. Altitude of the top of HFC4....................................................................................................................................35
18. Graphs showing ground-penetrating radar line 242 at the Krome Avenue site ............................................................3619. Geologic section showing correlation of four digital optical image logs from test coreholes G-3710, G-3711,
G-3712, and G-3713 used to verify ground-penetrating radar at the Krome Avenue site ............................................3720. Graph showing changes in ground-penetrating radar (GPR) reflection amplitudes along GPR survey line 242,
and corresponding box-whisker plots showing reflection amplitude sample populations for GPR reflection events at the bases and tops of high-frequency cycles .............................................................................................................38
21. Box-whisker plots of laboratory-measured porosity of whole-core samples................................................................3922. Box-whisker plots of air permeabilities of most of the same whole-core samples displayed in figure 21...................4023. Plot showing formation conductivity measured by an induction-resistivity borehole geophysical tool for the
G-3713 test corehole shown in figure 18 ......................................................................................................................4124. Chart showing idealized foraminiferal biofacies, depositional environments, ground-water flow classes,
rock-fabric facies, cyclostratigraphy, and stratigraphic units of Pleistocene to Holocene age in north-central Miami-Dade County......................................................................................................................................................43
25. Map showing composite thickness of Holocene peat, muck, and marl ........................................................................4426. Map showing composite thickness of Holocene marl...................................................................................................45
IV Contents

27. Geophysical logs showing heat-pulse flowmeter measurement of relative borehole transmissivity, indicating that limestone of the upper part of the Biscayne aquifer can be subdivided into several flow and diffuse zones and a semiconfining unit..................................................................................................................................... 47
28. Porosity log showing example of vuggy porosity distribution in the upward-shallowing brackish- or freshwater-capped cycle HFC3a of the Fort Thompson Formation ............................................................................. 48
29. Porosity log showing example of vuggy porosity distribution in an upward-shallowing brackish- or freshwater-capped cycle of HFC2 of the Fort Thompson Formation........................................................................... 49
30. Map showing altitude of the top of the vuggy porosity near the base of HFC3a of the Fort Thompson Formation...................................................................................................................................................................... 50
31. Map showing thickness of the vuggy porosity near the base of HFC3a of the Fort Thompson Formation ................. 5132. Diagram showing comparison of quarry sample, digital optical image, and resistivity log of the low-permeability
limestone or semiconfining unit that spans the base of the Miami Limestone and top of the Fort Thompson Formation...................................................................................................................................................................... 52
33. Diagram showing correlation between rock-fabric facies that span the base of the Miami Limestone and top of the Fort Thompson Formation.................................................................................................................................. 53
34-36. Maps showing:34. Altitude of the top of the semiconfining unit that spans the base of the Miami Limestone and the top of the
Fort Thompson Formation within the upper part of the Biscayne aquifer ............................................................. 5435. Altitude of the base of the semiconfining unit that spans the base of the Miami Limestone and the top of the
Fort Thompson Formation within the upper part of the Biscayne aquifer ............................................................. 5536. Thickness of the semiconfining unit that spans the base of the Miami Limestone and the top of the Fort
Thompson Formation within the upper part of the Biscayne aquifer..................................................................... 5637. Cross sections of the hydrogeology of selected canal walls (L-31N, Snake Creek Canal, Miami Canal, Bird Road
Canal, L-29, and Snapper Creek Extension) ................................................................................................................ 5838. Cross sections of the hydrogeology of selected canal walls (L-30N, Miami-Dade-Broward/Pennsuco Canal,
C-4, and C-1W) ............................................................................................................................................................ 5939. Three-dimensional hydrogeologic model of the upper part of the Biscayne aquifer for the study area in
north-central Miami-Dade County ............................................................................................................................... 60
List of Appendix IV Figures (on CD)
A1-A16. Digital borehole images, slabbed core photographs, thin-section photomicrographs, and whole-core porosity and permeability data for the: A1. Peloid grainstone and packstone rock-fabric facies of HFC5 for the G-3712 test corehole. A2. Coral framestone rock-fabric facies of HFC4 for the G-3692 test corehole. A3. Peloid wackestone and packstone rock-fabric facies of HFC4 for the G-3725 test corehole. A4. Gastropod floatstone and rudstone rock-fabric facies of HFC2 for the G-3710 test corehole.
A5. Conglomerate rock-fabric facies of HFC4 for the G-3696 test corehole. A6. Pedogenic limestone (massive calcrete) rock-fabric facies of HFC3b for the G-3690 test corehole. A7. Pedogenic limestone (root-mold limestone) rock-fabric facies of HFC3b for the G-3679 test corehole. A8. Mudstone and wackestone rock-fabric facies of HFC3b for the G-3688 test corehole. A9. Skeletal grainstone and packstone rock-fabric facies of HFC2 for the G-3679 test corehole.A10. Sandy skeletal grainstone and packstone rock-fabric facies of HFC2 for the G-3732 test corehole.
A11. Laminated peloid grainstone and packstone rock-fabric facies of HFC3a for the G-3672 test corehole.A12. Pelecypod floatstone and rudstone rock-fabric facies of HFC3a for the G-3714 test corehole.A13. Sandy pelecypod floatstone and rudstone rock-fabric facies of HFC1? for the G-3732 test corehole.A14. Touching-vug pelecypod floatstone and rudstone rock-fabric facies of HFC3a for the G-3710 test corehole.A15. Vuggy wackestone and packstone rock-fabric facies of HFC3a for the G-3717 test corehole.
A16. Skeletal sandstone rock-fabric facies of HFC3a for the G-3732 test corehole.
Contents V

TABLES
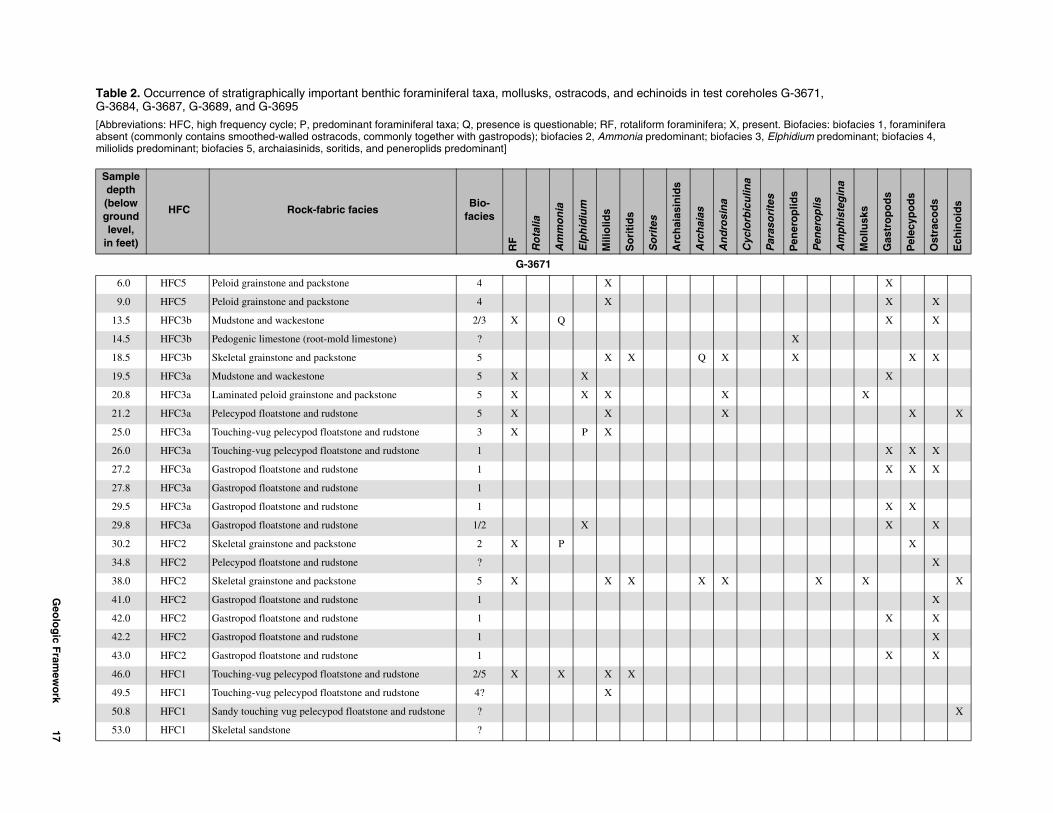
1. List of all test coreholes drilled during this study ..................................................................................................................82. Occurrence of stratigraphically important benthic foraminiferal taxa, mollusks, ostracods, and echinoids in test
coreholes G-3671, G-3684, G-3687, G-3689, and G-3695 .................................................................................................173. Foraminiferal biofacies and associated interpretive paleoenvironments ..............................................................................224. Tops of geologic units in test coreholes drilled for this study..............................................................................................255. Summary of rock-fabric facies of the Miami Limestone and Fort Thompson Formation in north-central
Miami-Dade County ............................................................................................................................................................27
Conversion Factors, Acronyms, Abbreviated Units, and Datums
Vertical coordinate information is referenced to the National Geodetic Vertical Datum of 1929 (NGVD 1929); horizontal coordinate information is referenced to the North American Datum of 1927 (NAD 1927), unless otherwise noted.
Multiply By To obtain
inch (in.) 2.54 centimeter
foot (ft) 0.3048 meter
foot per day (ft/d) 0.3048 meter per day
foot per nanosecond (ft/ns) 0.3048 meter per nanosecond
mile (mi) 1.609 kilometer
mile per hour (mi/hr) 1.609 kilometer per hour
Acronyms
BIPS Borehole image processing system
CMP Common mid-point
DS Depositional sequence
ENP Everglades National Park
GWFC Ground-water flow class
GPR Ground-penetrating radar
HFC High-frequency cycle
NWIS National Water Information System
PVC Polyvinyl chlorinated
RADAN Radar data analyzer
SFWMD South Florida Water Management District
SIR Subsurface interface radar
USGS U.S. Geological Survey
WCA Water Conservation Area
Other Abbreviated Units
dB decibel
mg/L milligram per liter
MHz megahertz
ns nanosecond
VI Contents
Characterization of Aquifer Heterogeneity Using Cyclostratigraphy and Geophysical Methods in the Upper Part of the Karstic Biscayne Aquifer, Southeastern Florida
By Kevin J. Cunningham1, Janine L. Carlson2, G. Lynn Wingard3, Edward Robinson4 and Michael A. Wacker1
ABSTRACT
This report identifies and characterizes candidate ground-water flow zones in the upper part of the shal-low, eogenetic karst limestone of the Biscayne aquifer in the Lake Belt area of north-central Miami-Dade County using cyclostratigraphy, ground-penetrating radar (GPR), borehole geophysical logs, and continu-ously drilled cores. About 60 miles of GPR profiles were used to calculate depths to shallow geologic contacts and hydrogeologic units, image karst features, and produce qualitative views of the porosity distribu-tion. Descriptions of the lithology, rock fabrics, and cyclostratigraphy, and interpretation of depositional environments of 50 test coreholes were linked to the geophysical interpretations to provide an accurate hydrogeologic framework. Molluscan and benthic fora-miniferal paleontologic constraints guided interpreta-tion of depositional environments represented by rock-fabric facies. Digital borehole images were used to characterize and quantify large-scale vuggy porosity. Preliminary heat-pulse flowmeter data were coupled with the digital borehole image data to identify candi-date ground-water flow zones.
1U.S. Geological Survey, Miami, Florida2Colorado School of Mines, Golden, Colorado3U.S. Geological Survey, Reston, Virginia4University of the West Indies, Kingston, Jamaica
Combined results show that the porosity and permeability of the karst limestone of the Biscayne aquifer have a highly heterogeneous and anisotropic distribution that is mostly related to secondary porosity overprinting vertical stacking of rock-fabric facies within high-frequency cycles (HFCs). This distribution of porosity produces a dual-porosity system consisting of diffuse-carbonate and conduit flow zones. The nonuniform ground-water flow in the upper part of the Biscayne aquifer is mostly localized through secondary permeability, the result of solution-enlarged carbonate grains, depositional textures, bedding planes, cracks, root molds, and paleokarst surfaces. Many of the result-ing pore types are classified as touching vugs.
GPR, borehole geophysical logs, and whole-core analyses show that there is an empirical relation between formation porosity, permeability, formation electrical conductivity, and GPR reflection ampli-tudes—as porosity and permeability increase, forma-tion electrical conductivity increases and reflection amplitude decreases. This relation was observed throughout the entire vertical and lateral section of the upper part of the Biscayne aquifer in the study area. Further, upward-shallowing brackish- or freshwater-capped cycles of the upper part of the Fort Thompson Formation show low-amplitude reflections near their base that correspond to relatively higher porosity and permeability. This distribution is related to a systematic vertical stacking of rock-fabric facies within the cycle.
Abstract 1
Inferred flow characteristics of the porosity distribution within the upper part of the Biscayne aquifer were used to identify four ground-water flow classes, with each characterized by a discrete pore system that affects vertical and horizontal ground-water flow: (1) a low-permeability peat, muck, and marl ground-water flow class; (2) a horizontal conduit ground-water flow class; (3) a leaky, low-permeability ground-water flow class; and (4) a diffuse-carbonate ground-water flow class. At the top of the Biscayne aquifer, peat, muck, and marl can combine to form a relatively low-permeability layer of Holocene sediment that water moves through slowly. Most horizontal conduit flow is inferred to occur along touching vugs in portions of the following rock-fabric facies: (1) touching-vug pelecypod floatstone and rudstone, (2) sandy touching-vug pelecypod floatstone and rudstone, (3) vuggy wackestone and packstone, (4) laminated peloid grainstone and packstone, (5) peloid grainstone and packstone, and (6) peloid wackestone and pack-stone. Gastropod floatstone and rudstone, mudstone and wackestone, and pedogenic limestone rock-fabric facies are the main hosts for leaky, low-permeability units. This study provides evidence that the limestone that spans the base of the Miami Limestone and top of the Fort Thompson Formation has the potential to retard the vertical leakance of ground water; however, although the limestone contained in this zone has a relatively low-porosity and low-permeability matrix, common semivertical and irregular pores that transect or join to transect this zone produce what appears to be a very leaky unit. Diffuse-carbonate flow occurs in stratal units containing rock-fabric facies that generally are characterized by intergrain and separate-vug pores, and where flow is principally through a small-scale network of vug-to-matrix-to-vug connections. Rock-fabric facies that host diffuse flow are: (1) skeletal grainstone and packstone, (2) pelecypod floatstone and rudstone, (3) sandy skeletal grainstone and packstone, (4) sandy pelecypod floatstone and rudstone, and (5) quartz sandstone and skeletal sandstone.
At the borehole scale, there is a correspondence between vuggy porosity and depositional environ-ments, depositional textures, and vertical position of rock-fabric facies within the context of HFCs. In the upper part of the Fort Thompson Formation, zones of touching vugs (vug-to-vug connections) that have a sheet-like geometry occur just above flooding surfaces within HFCs. The correlation between vuggy porosity and geologic parameters allows for prediction of
2 Characterization of Aquifer Heterogeneity Using CyclostratigKarstic Biscayne Aquifer, Southeastern Florida
hydraulic parameters prior to drilling and for construc-tion of a geologically realistic, conceptual framework for numerical models. A benefit from this research will be the use of results for helping to define the field-scale pore system within the Biscayne aquifer.
INTRODUCTION
During the past century, the Everglades and its watershed have been altered substantially by human activities, including the development of a highly managed hydrologic system in southern Florida. This hydrologic system of canals, levees, and pumping stations was developed to meet increasing demand for water supply as a result of a rapidly growing urban population and intensive agricultural activities. As a consequence, much of the Everglades, the Biscayne aquifer, and major estuarine systems in southern Flor-ida presently do not receive sufficient quantity or distri-bution of water during times when it is most needed. Adequate water supply is essential to the restoration of the Everglades and its watershed.
In southeastern Florida, ground-water supply is augmented by surface storage of water in large-scale water-conservation areas (WCA’s; fig. 1) and Ever-glades National Park (ENP). Surface water seeps into the Biscayne aquifer from the wetlands, then moves as ground water beneath a system of levees and canals on the eastern perimeter of the wetlands, flowing toward agricultural, urban, and coastal areas to the east. Sustainable ground-water levels east of the wetlands are critical for maintaining water levels at water-supply wells and preventing saltwater intrusion at the coast.
Managing the water levels in the WCA’s and ENP is critical for establishing rates and volumes of water seeping from these areas to the Biscayne aquifer. A realistic, conceptual hydrogeologic model of the Biscayne aquifer, especially its karst limestone, is needed to accurately model the movement of ground water and determine a water budget to meet natural, agricultural, and urban needs.
Numerous studies have shown that two or more subaquifers that are separated by semiconfining units comprise the karst limestone of the Biscayne aquifer (Klein and Sherwood, 1961; Guardiario, 1996; Brown and Caldwell Environmental Engineers and Consult-ants, 1998; Cunningham and Wright, 1998; Kaufmann and Switanek, 1998; Nemeth and others, 2000; Sonen-shein, 2001; Cunningham, 2004). Geophysical and
raphy and Geophysical Methods in the Upper Part of the
Introduction 3
EXPLANATION
WATER-CONSERVATION AREAAND NUMBER
EVERGLADES NATIONAL PARK
EVERGLADES AGRICULTURALAREA
1
2A
3A
3A
3B
2B
BIG CYPRESS NATIONALPRESERVE
NATIVE AMERICAN LAND
25 MILES
25 KILOMETERS
0
0
STUDY AREA
GU
LF
OF
ME
XIC
O AT
LA
NT
ICO
CE
AN
LakeOkeechobee
Figure 1. Location of study area, Federal and State lands, and agricultural areas in southern Florida.
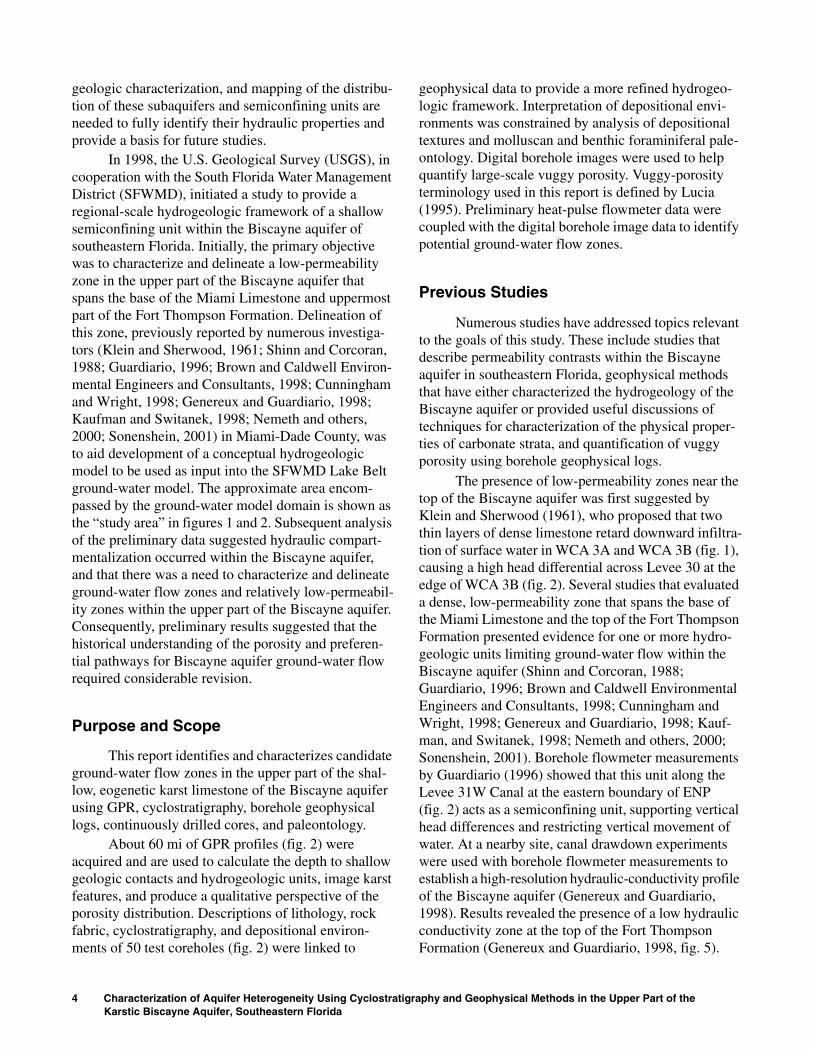
geologic characterization, and mapping of the distribu-tion of these subaquifers and semiconfining units are needed to fully identify their hydraulic properties and provide a basis for future studies.
In 1998, the U.S. Geological Survey (USGS), in cooperation with the South Florida Water Management District (SFWMD), initiated a study to provide a regional-scale hydrogeologic framework of a shallow semiconfining unit within the Biscayne aquifer of southeastern Florida. Initially, the primary objective was to characterize and delineate a low-permeability zone in the upper part of the Biscayne aquifer that spans the base of the Miami Limestone and uppermost part of the Fort Thompson Formation. Delineation of this zone, previously reported by numerous investiga-tors (Klein and Sherwood, 1961; Shinn and Corcoran, 1988; Guardiario, 1996; Brown and Caldwell Environ-mental Engineers and Consultants, 1998; Cunningham and Wright, 1998; Genereux and Guardiario, 1998; Kaufman and Switanek, 1998; Nemeth and others, 2000; Sonenshein, 2001) in Miami-Dade County, was to aid development of a conceptual hydrogeologic model to be used as input into the SFWMD Lake Belt ground-water model. The approximate area encom-passed by the ground-water model domain is shown as the “study area” in figures 1 and 2. Subsequent analysis of the preliminary data suggested hydraulic compart-mentalization occurred within the Biscayne aquifer, and that there was a need to characterize and delineate ground-water flow zones and relatively low-permeabil-ity zones within the upper part of the Biscayne aquifer. Consequently, preliminary results suggested that the historical understanding of the porosity and preferen-tial pathways for Biscayne aquifer ground-water flow required considerable revision.
Purpose and Scope
This report identifies and characterizes candidate ground-water flow zones in the upper part of the shal-low, eogenetic karst limestone of the Biscayne aquifer using GPR, cyclostratigraphy, borehole geophysical logs, continuously drilled cores, and paleontology.
About 60 mi of GPR profiles (fig. 2) were acquired and are used to calculate the depth to shallow geologic contacts and hydrogeologic units, image karst features, and produce a qualitative perspective of the porosity distribution. Descriptions of lithology, rock fabric, cyclostratigraphy, and depositional environ-ments of 50 test coreholes (fig. 2) were linked to
4 Characterization of Aquifer Heterogeneity Using CyclostratigKarstic Biscayne Aquifer, Southeastern Florida
geophysical data to provide a more refined hydrogeo-logic framework. Interpretation of depositional envi-ronments was constrained by analysis of depositional textures and molluscan and benthic foraminiferal pale-ontology. Digital borehole images were used to help quantify large-scale vuggy porosity. Vuggy-porosity terminology used in this report is defined by Lucia (1995). Preliminary heat-pulse flowmeter data were coupled with the digital borehole image data to identify potential ground-water flow zones.
Previous Studies
Numerous studies have addressed topics relevant to the goals of this study. These include studies that describe permeability contrasts within the Biscayne aquifer in southeastern Florida, geophysical methods that have either characterized the hydrogeology of the Biscayne aquifer or provided useful discussions of techniques for characterization of the physical proper-ties of carbonate strata, and quantification of vuggy porosity using borehole geophysical logs.
The presence of low-permeability zones near the top of the Biscayne aquifer was first suggested by Klein and Sherwood (1961), who proposed that two thin layers of dense limestone retard downward infiltra-tion of surface water in WCA 3A and WCA 3B (fig. 1), causing a high head differential across Levee 30 at the edge of WCA 3B (fig. 2). Several studies that evaluated a dense, low-permeability zone that spans the base of the Miami Limestone and the top of the Fort Thompson Formation presented evidence for one or more hydro-geologic units limiting ground-water flow within the Biscayne aquifer (Shinn and Corcoran, 1988; Guardiario, 1996; Brown and Caldwell Environmental Engineers and Consultants, 1998; Cunningham and Wright, 1998; Genereux and Guardiario, 1998; Kauf-man, and Switanek, 1998; Nemeth and others, 2000; Sonenshein, 2001). Borehole flowmeter measurements by Guardiario (1996) showed that this unit along the Levee 31W Canal at the eastern boundary of ENP (fig. 2) acts as a semiconfining unit, supporting vertical head differences and restricting vertical movement of water. At a nearby site, canal drawdown experiments were used with borehole flowmeter measurements to establish a high-resolution hydraulic-conductivity profile of the Biscayne aquifer (Genereux and Guardiario, 1998). Results revealed the presence of a low hydraulic conductivity zone at the top of the Fort Thompson Formation (Genereux and Guardiario, 1998, fig. 5).
raphy and Geophysical Methods in the Upper Part of the
80°40´
26°00´
25°45´
25°30´
80°25´ 80°10´
G-3671
G-3673
G-3674G-3720
G-3721
G-3722
G-3723
G-3725
G-3726
G-3727
G-3728
G-3731
G-3732 G-3733
G-3734
G-3729
G-3730
G-3675
G-3678
G-3679
G-3680
G-3681G-3710G-3711G-3712G-3713
G-3682
G-3714G-3715
G-3716
G-3683G-3684
G-3685
G-3686G-3687 G-3688
G-3689
G-3690
G-3691
G-3692
G-3693
G-3694
G-3695
G-3696
G-3697
G-3717
G-3724
G-3718
G-3719
BROWARD COUNTY
MIAMI-DADE COUNTY
G-3672
Miami
Bis
cayn
eB
ay
Kro
me
Ave
nu
e
Krome Avenue GPR Site
Old SouthDade Landfill
5 MILES
5 KILOMETERS
0
0
G-3696
EXPLANATION
TEST COREHOLELOCATION AND NUMBER
STUDY AREA
LEVEE NUMBER
CANAL NUMBER
GROUND-PENETRATINGRADAR TRACK
WaterConservation
Area 3B
WaterConservation
Area 3A
EvergladesNational
Park
L-67
A
L-67
C
L-29
L-31N
L-31W
L-30
C-1W
Bird Road Canal
C-4
C-4
C-6
C-9
Snapper
Cre
ekE
xten
sion
Mia
mi-
Dade-
Bro
ward
/
Pen
nsu
co
L-3
0
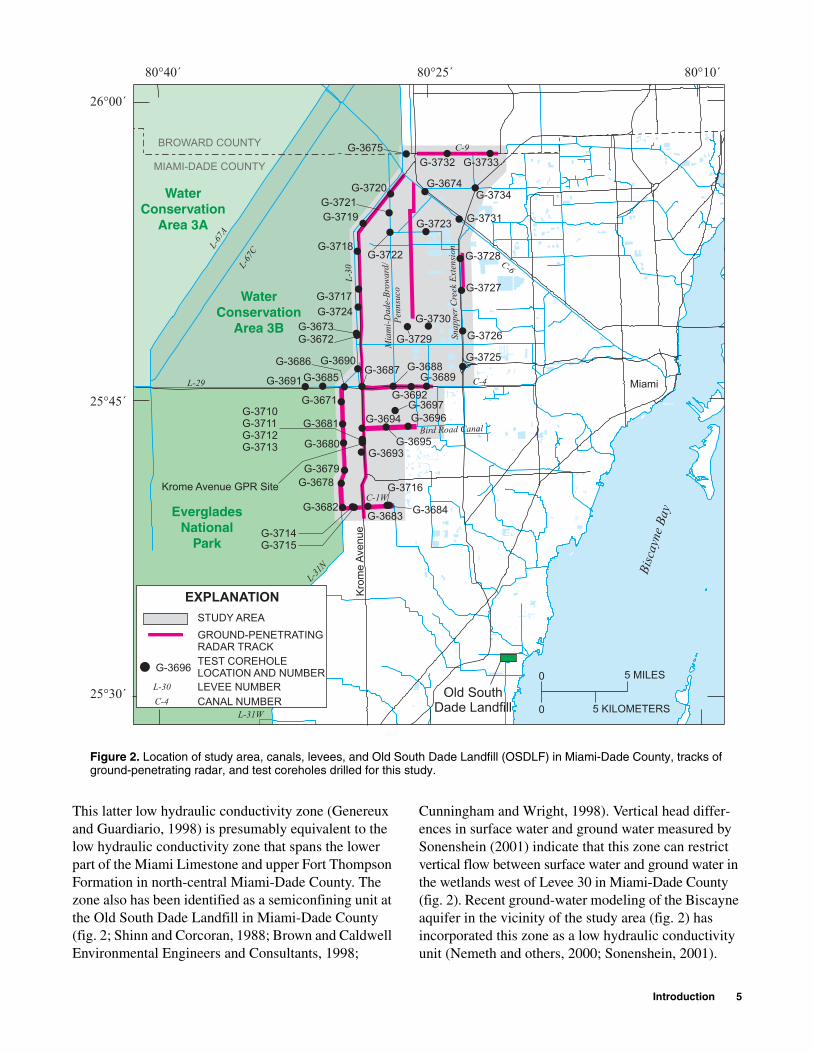
Figure 2. Location of study area, canals, levees, and Old South Dade Landfill (OSDLF) in Miami-Dade County, tracks of ground-penetrating radar, and test coreholes drilled for this study.
This latter low hydraulic conductivity zone (Genereux and Guardiario, 1998) is presumably equivalent to the low hydraulic conductivity zone that spans the lower part of the Miami Limestone and upper Fort Thompson Formation in north-central Miami-Dade County. The zone also has been identified as a semiconfining unit at the Old South Dade Landfill in Miami-Dade County (fig. 2; Shinn and Corcoran, 1988; Brown and Caldwell Environmental Engineers and Consultants, 1998;
Cunningham and Wright, 1998). Vertical head differ-ences in surface water and ground water measured by Sonenshein (2001) indicate that this zone can restrict vertical flow between surface water and ground water in the wetlands west of Levee 30 in Miami-Dade County (fig. 2). Recent ground-water modeling of the Biscayne aquifer in the vicinity of the study area (fig. 2) has incorporated this zone as a low hydraulic conductivity unit (Nemeth and others, 2000; Sonenshein, 2001).
Introduction 5
Although GPR is most commonly used in geologic studies of siliciclastic strata (for example, Beres and Haeni, 1991; Smith and Jol, 1992; van Over-meeren, 1998) and crystalline rocks (for example, Grasmueck, 1996; Lane and others, 2000), its use in studying karst-carbonate rocks is becoming more common (Ballard, 1983; Beck and Wilson, 1988; Barr, 1993; Benson, 1995; McMechan and others, 1998; Cunningham, 2000; Cunningham and Aviantara, 2001; Cunningham, 2004). However, the integrated use of GPR and digital borehole images in analyzing karst-carbonate rocks is a new application (Cunningham, 2000; Cunningham and Aviantara, 2001). Additionally, no published examples were found that demonstrate the use of GPR to delineate the distribution of porosity within a carbonate high-frequency cyclostratigraphy. Lithologic and hydraulic features that have been inferred from GPR profiles include sediment type and thickness (Beres and Haeni, 1991), karst features (Barr, 1993; Benson, 1995; McMechan and others, 1998), subaerial-exposure surfaces (Kruse and others, 2000), depth to water table, and clay bed occurrence (Johnson, 1992; Barr, 1993). McMechan and others (1998) used GPR to image a near-surface paleocave system in Lower Ordovician Ellenberger dolomites of central Texas. Martinez and others (1998) showed that small-scale (less than 1 centimeter, 0.39 in.) lithologic hetero-geneity that affects permeability can be identified with GPR imaging behind Pennsylvanian cyclic limestone outcrops of Kansas and can provide quantitative data for use in fluid-flow modeling. Dagallier and others (2000) showed that GPR could be used to identify the internal organization of lithologic units within Jurassic limestone in France. Kruse and others (2000) found that GPR was an effective method to map the altitude and structure of shallow limestone cap rock in the prairie, cypress swamp, and hardwood hammock of the Faka-hatchee Strand State Preserve in southwestern Florida. Beres and others (2001) demonstrated that GPR is an excellent tool for identifying and delineating shallow subsurface cavities in karstic Jurassic limestone in Switzerland.
The relation between the spatial distribution of porosity within high-frequency carbonate cycles and amplitude of reflections on GPR profiles has been demonstrated and is reported separately in Cunningham (2004). Results of that study have improved the under-standing of the distribution of porosity in the young (Pleistocene) platform carbonates that comprise the
6 Characterization of Aquifer Heterogeneity Using CyclostratigKarstic Biscayne Aquifer, Southeastern Florida
unconfined surficial Biscayne aquifer, and provide a framework to guide collection of future hydraulic measurements.
Kindinger (2002) has shown the utility of seismic-reflection profiles in better defining the hydrogeologic framework of the middle and lower parts of the Biscayne aquifer. Kindinger (2002) collected more than 68 line-mi of seismic-reflection data from eight major canals to develop a better understanding of the geology and hydrogeology of the Lake Belt area, which approximates the study area herein. About 80 percent of the data were considered useful to this investigation and generally were usable to an altitude of about 100 ft below NGVD 29. The Fort Thompson Formation portion of the usable data shows several continuous horizons and numerous vertical to semivertical features that are inferred to represent shallow solution pipes or large vugs. Many solution pipes and collapse structures were inferred from the profiles within the Tamiami Formation (Kindinger, 2002).
Many recent studies have verified that digital electronic images of borehole walls can be useful in quantifying vuggy porosity (Hickey, 1993; Newberry and others, 1996; Hurley and others, 1998; 1999) in petroleum reservoirs and fractures in aquifers (Will-iams and Johnson, 2000). By quantifying vuggy poros-ity in borehole images, these researchers could identify fluid-flow zones. Cunningham and others (2004) report in detail the development of a method for quantifying vuggy porosity seen in digital borehole images collected in the limestone of the Biscayne aquifer.
Acknowledgments
Several USGS employees assisted with this study. Dick Hodges and Alton Anderson provided initial support in geophysical logging. Anthony Brown, Debby Arnold, Claude Jean-Poix, David Schmerge, and Marc Stewart assisted with field activities. The USGS Branch of Geophysical Applications and Support provided essential geophysical instrumentation and technical advice during field activities of borehole image processing system (BIPS) and GPR data collec-tion, especially Marc Buursink, Carol Johnson, John Lane, and John Williams. Claude Jean-Poix and Carlos Zarikian assisted with data analysis and illustrations. Joann Dixon created three-dimensional visualization products. John Lane, Robert Renken, Jane Eggleston, Mike Deacon, and Rhonda Howard at the USGS and Florentin Maurrasse at Florida International University provided reviews.
raphy and Geophysical Methods in the Upper Part of the

METHODS OF INVESTIGATION
A combination of multidisciplinary techniques was used to produce an improved visualization of the pore system within a cyclic hydrogeologic framework of the upper part of the Biscayne aquifer. This approach included the integration of GPR methods, core analy-ses, borehole geophysical logs, cyclostratigraphy, quantification of vuggy porosity in borehole images, and paleontology.
Ground-Penetrating Radar Surveys
When combined with hydrogeologic data, GPR can contribute substantially to the characterization of hydrogeologic properties of shallow limestone aqui-fers. Numerous GPR profiles were collected (about 60 mi) and used to characterize the hydrogeologic frame-work of the upper part of the Biscayne aquifer.
Two types of GPR field surveys were conducted for this study: (1) continuous measurement common-offset reflection surveys, and (2) common mid-point (CMP) velocity surveys (Annan and Davis, 1976; Davis and Annan, 1989). The common-offset reflection surveys were performed to produce two-dimensional profiles of the GPR reflections, and the CMP surveys to calculate radar velocities propagating through the solid and fluid material comprising the Biscayne aquifer. All GPR data were collected using a subsurface inter-face radar (SIR) System-10A+ with a dual 100-MHz antenna fixed-offset array. A time-varying gain was used during collection of each GPR profile. The common-offset reflection surveys were collected while towing the antennas 55 ft behind a truck with a connecting rope and cable at a rate of about 0.5 mi/hr. The separation between the center point of antennas was 35 in. Processing of profiles included a horizontal filter pass and, for some profiles, a constant-velocity migration of the continuous survey data using radar data analyzer (RADAN) for WinNT software. Visual representation of the GPR data was accomplished using RADAN for WinNT software and RADAN-to-bitmap conversion utility. Descriptions of radar-reflec-tion configuration patterns were based on comparison to seismic examples in Mitchum and others (1977).
Radar propagation velocities were calculated using depths to reflectors that could be determined from: (1) positive correlation of profile reflections with core-sample lithologies and borehole images, and (2) CMP survey data. Calculation of velocities (v) from
comparison of profile reflections with core-sample lithologies and borehole images was established by dividing the one-way travel time (t) to a reflection by the depth (d) of its corresponding lithologic contact as verified in core or images. The equation t/d = v results in the velocity (v) between the land surface and selected lithologic contact. The method presented in Telford and others (1990) was used to determine velocities using CMP surveys.
Drilling, Well Completion, Core Analysis, and Geophysical Logging
Nearly all of the 50 test coreholes were drilled following GPR data acquisition (table 1 and fig. 2). Test coreholes were located along the GPR profile tracts where they would be most useful for verification of GPR attributes. Collection of continuous 3.4- or 4-in. diameter cores was preferred to the normal rotary method, which produces small cutting samples collected over relatively wide depth intervals. The test coreholes were drilled by either Amdrill Inc., employ-ing a wireline coring method, or by U.S. Drilling Inc., using a conventional coring method (table 1). Borehole geophysical logs were collected by the USGS in 45 of the 50 test coreholes drilled during this study and included induction resistivity, natural gamma ray, spon-taneous potential, single-point resistivity, caliper, and digital borehole image logs (app. I). Borehole geophys-ical logs were not collected at the G-3694 and G-3697 test coreholes (fig. 2) due to problems with locating the well or destruction of the well after drilling. The bore-hole geophysical-logging tools were run in boreholes filled with clear freshwater. Each borehole was cased with 3.5- or 5-in. solid polyvinyl chlorinated (PVC) surface casing set to a depth between 4 and 19 ft below land surface (app. I). Data were acquired in digital format and archived in the USGS National Water Infor-mation System (NWIS) database. The digital borehole image logs were acquired using an RaaX BIPS digital optical logging tool. A Mount Sopris Model HFP-2293 heat-pulse flowmeter was used to assess borehole fluid movement in the G-3710 test corehole. A technique described by Paillet (2000) to estimate vertical ground-water borehole flow was utilized with the flowmeter measurements collected in the G-3710 test corehole. This method has been previously applied to southern Florida aquifers (Paillet and Reese, 2000). Most geophysical logs collected as part of this study are provided in appendix I.
Methods of Investigation 7

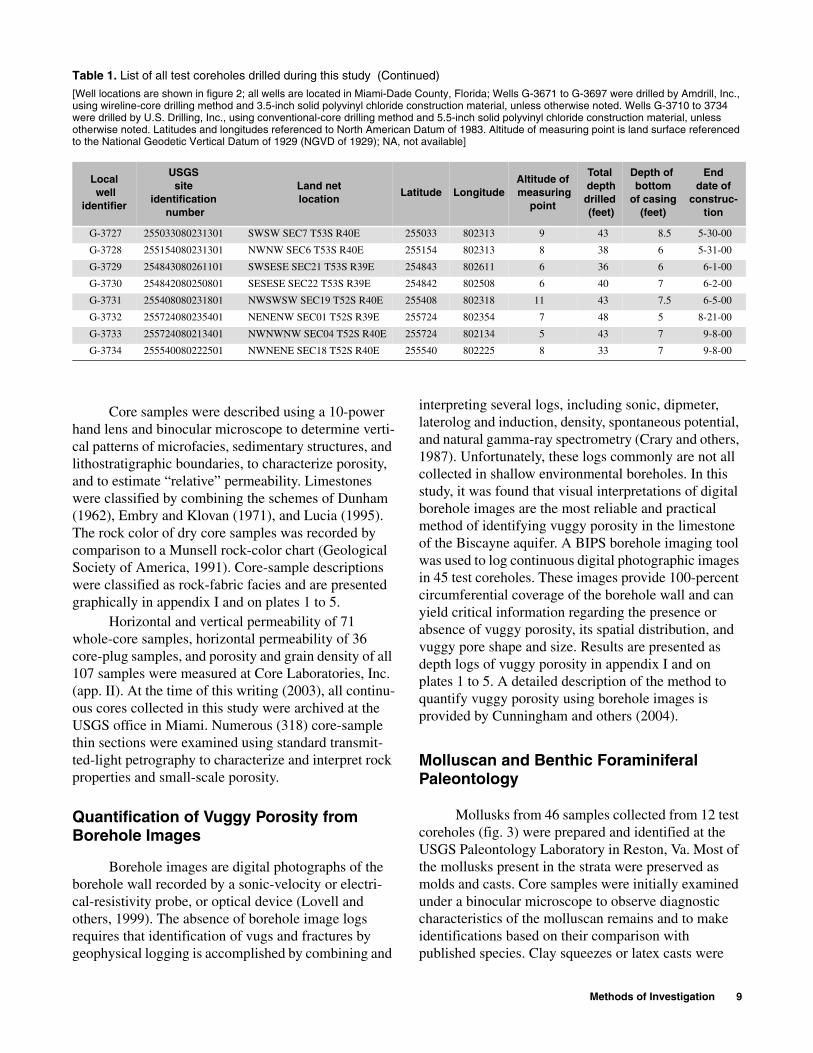
Table 1. List of all test coreholes drilled during this study
[Well locations are shown in figure 2; all wells are located in Miami-Dade County, Florida; Wells G-3671 to G-3697 were drilled by Amdrill, Inc., using wireline-core drilling method and 3.5-inch solid polyvinyl chloride construction material, unless otherwise noted. Wells G-3710 to 3734 were drilled by U.S. Drilling, Inc., using conventional-core drilling method and 5.5-inch solid polyvinyl chloride construction material, unless otherwise noted. Latitudes and longitudes referenced to North American Datum of 1983. Altitude of measuring point is land surface referenced to the National Geodetic Vertical Datum of 1929 (NGVD of 1929); NA, not available]
Local well
identifier
USGSsite
identification number
Land net location
Latitude LongitudeAltitude of measuring
point
Total depthdrilled (feet)
Depth of bottom
of casing (feet)
End date of
construc-tion
G-3671 254456080295301 SESE SEC11 T54S R38E 254456 802953 12 150 NA 8-7-98
G-3672 254822080290201 SENE SEC25 T53S R38E 254822 802902 20 45 18 8-8-98
G-3673 254822080290202 SENE SEC25 T53S R38E 254822 802902 20 160 18 8-10-98
G-3674 255529080251101 NWNW SEC14 T52S R39E 255529 802511 8 160 NA 8-16-98
G-3675 255723080261301 SESNE SEC27 T50S R39E 255723 802613 8 90 NA 8-21-98
G-3678 254050080295401 NW SEC1 T55S R38E 254050 802954 12 35 10 5-22-99
G-3679 254129080294301 SE SEC35 T54S R38E 254129 802943 10.5 40 10 5-23-99
G-3680 254252080294601 NW SEC25 T54S R38E 254252 802946 11 40 10 5-23-99
G-3681 254349080294901 NW SEC24 T54S R38E 254349 802949 9.5 45 10 5-23-99
G-3682 253937080295001 SWNW SEC12 T55S R38E 253937 802950 13.5 30 10 5-24-99
G-3683 253940080282601 SENE SEC7 T55S R39E 253940 802826 12 35 10 5-24-99
G-3684 253943080272201 SE SEC8 T55S R39E 253943 802722 11.5 35 10 5-24-99
G-3685 254543080305501 SE SEC3 T54S R38E 254543 803055 14 30 10 5-25-99
G-3686 254541080294301 SW SEC1 T54S R38E 254541 802943 11 30 10 5-25-99
G-3687 254542080284401 SW SEC6 T54S R39E 254542 802844 12.5 30 10 5-25-99
G-3688 254542080270001 SE SEC5 T54S R39E 254542 802700 9.5 30 10 5-26-99
G-3689 254542080259001 SE SEC3 T54S R39E 254542 802590 9 30 10 5-26-99
G-3690 254635080285801 SE SEC1 T54S R38E 254635 802858 11.5 30 10 5-26-99
G-3691 254542080315301 SE SEC4 T54S R38E 254542 803153 14 35 10 5-27-99
G-3692 254541080260001 SE SEC4 T54S R39E 254541 802600 9 30 NA 5-27-99
G-3693 254224080284701 SE SEC25 T54S R38E 254224 802847 11.5 35 NA 6-2-99
G-3694 254336080284401 NWNW SEC19 T54S R39E 254336 802844 11 35 10 6-2-99
G-3695 254339080272401 NW SEC20 T54S R39E 254339 802724 10.5 35 10 6-3-99
G-3696 254341080261101 NW SEC21 T54S R39E 254341 802611 11 35 10 6-3-99
G-3697 254429080265401 NENE SEC17 T54S R39E 254429 802654 9 30 NA 6-3-99
G-3710 254310080284801 SESE SEC24 T54S R38E 254310 802848 10 33 8 4-20-00
G-3711 254300080284701 SESE SEC24 T54S R38E 254300 802847 10 37 8 4-20-00
G-3712 254250080284601 SESE SEC24 T54S R38E 254250 802846 10 28 7 5-1-00
G-3713 254245080284501 SESE SEC24 T54S R38E 254245 802845 10 32.5 7 5-2-00
G-3714 253937080292901 SENW SEC12 T55S R38E 253937 802929 13 23 8 5-3-00
G-3715 253938080292301 SENW SEC12 T55S R38E 253938 802923 13 23 8 5-3-00
G-3716 253943080272301 SE SEC8 T55S R39E 253943 802723 9 28 8 5-4-00
G-3717 255039080290101 SESE SEC12 T53S R38E 255039 802901 9 43 7.75 5-8-00
G-3718 255220080290301 SESE SEC36 T52S R38E 255220 802903 9 30 6.3 5-9-00
G-3719 255355080284301 NENW SEC30 T52S R39E 255355 802843 9 30 6.5 5-10-00
G-3720 255530080271301 NWNW SEC16 T52S R39E 255530 802713 9 31 5 5-11-00
G-3721 255424080271201 NESE SEC20 T52S R39E 255424 802712 10 30 9 5-12-00
G-3722 255326080270901 NESE SEC29 T52S R39E 255326 802709 10 32 7.75 5-12-00
G-3723 255328080251201 NESE SEC27 T52S R39E 255328 802512 8 45 7 5-15-00
G-3724 254942080285801 NENE SEC24 T53S R38E 254942 802858 9 30 7 5-16-00
G-3725 254655080231201 NENE SEC1 T53S R39E 254655 802312 6 31.5 6.5 5-17-00
G-3726 254825080231201 NENE SEC25 T53S R39E 254825 802312 7 33 10 5-18-00
8 Characterization of Aquifer Heterogeneity Using Cyclostratigraphy and Geophysical Methods in the Upper Part of the Karstic Biscayne Aquifer, Southeastern Florida
55033 802313 9 43 8.5 5-30-00
55154 802313 8 38 6 5-31-00
54843 802611 6 36 6 6-1-00
54842 802508 6 40 7 6-2-00
55408 802318 11 43 7.5 6-5-00
55724 802354 7 48 5 8-21-00
55724 802134 5 43 7 9-8-00
55540 802225 8 33 7 9-8-00
nued)
County, Florida; Wells G-3671 to G-3697 were drilled by Amdrill, Inc., onstruction material, unless otherwise noted. Wells G-3710 to 3734
d and 5.5-inch solid polyvinyl chloride construction material, unless Datum of 1983. Altitude of measuring point is land surface referenced ot available]
titude LongitudeAltitude of measuring
point
Total depthdrilled (feet)
Depth of bottom
of casing (feet)
End date of
construc-tion
Core samples were described using a 10-power hand lens and binocular microscope to determine verti-cal patterns of microfacies, sedimentary structures, and lithostratigraphic boundaries, to characterize porosity, and to estimate “relative” permeability. Limestones were classified by combining the schemes of Dunham (1962), Embry and Klovan (1971), and Lucia (1995). The rock color of dry core samples was recorded by comparison to a Munsell rock-color chart (Geological Society of America, 1991). Core-sample descriptions were classified as rock-fabric facies and are presented graphically in appendix I and on plates 1 to 5.
Horizontal and vertical permeability of 71 whole-core samples, horizontal permeability of 36 core-plug samples, and porosity and grain density of all 107 samples were measured at Core Laboratories, Inc. (app. II). At the time of this writing (2003), all continu-ous cores collected in this study were archived at the USGS office in Miami. Numerous (318) core-sample thin sections were examined using standard transmit-ted-light petrography to characterize and interpret rock properties and small-scale porosity.
Quantification of Vuggy Porosity from Borehole Images
Borehole images are digital photographs of the borehole wall recorded by a sonic-velocity or electri-cal-resistivity probe, or optical device (Lovell and others, 1999). The absence of borehole image logs requires that identification of vugs and fractures by geophysical logging is accomplished by combining and
G-3727 255033080231301 SWSW SEC7 T53S R40E 2
G-3728 255154080231301 NWNW SEC6 T53S R40E 2
G-3729 254843080261101 SWSESE SEC21 T53S R39E 2
G-3730 254842080250801 SESESE SEC22 T53S R39E 2
G-3731 255408080231801 NWSWSW SEC19 T52S R40E 2
G-3732 255724080235401 NENENW SEC01 T52S R39E 2
G-3733 255724080213401 NWNWNW SEC04 T52S R40E 2
G-3734 255540080222501 NWNENE SEC18 T52S R40E 2
Table 1. List of all test coreholes drilled during this study (Conti
[Well locations are shown in figure 2; all wells are located in Miami-Dadeusing wireline-core drilling method and 3.5-inch solid polyvinyl chloride cwere drilled by U.S. Drilling, Inc., using conventional-core drilling methootherwise noted. Latitudes and longitudes referenced to North Americanto the National Geodetic Vertical Datum of 1929 (NGVD of 1929); NA, n
Local well
identifier
USGSsite
identification number
Land net location
La
interpreting several logs, including sonic, dipmeter, laterolog and induction, density, spontaneous potential, and natural gamma-ray spectrometry (Crary and others, 1987). Unfortunately, these logs commonly are not all collected in shallow environmental boreholes. In this study, it was found that visual interpretations of digital borehole images are the most reliable and practical method of identifying vuggy porosity in the limestone of the Biscayne aquifer. A BIPS borehole imaging tool was used to log continuous digital photographic images in 45 test coreholes. These images provide 100-percent circumferential coverage of the borehole wall and can yield critical information regarding the presence or absence of vuggy porosity, its spatial distribution, and vuggy pore shape and size. Results are presented as depth logs of vuggy porosity in appendix I and on plates 1 to 5. A detailed description of the method to quantify vuggy porosity using borehole images is provided by Cunningham and others (2004).
Molluscan and Benthic Foraminiferal Paleontology
Mollusks from 46 samples collected from 12 test coreholes (fig. 3) were prepared and identified at the USGS Paleontology Laboratory in Reston, Va. Most of the mollusks present in the strata were preserved as molds and casts. Core samples were initially examined under a binocular microscope to observe diagnostic characteristics of the molluscan remains and to make identifications based on their comparison with published species. Clay squeezes or latex casts were
Methods of Investigation 9
80°25´
25°45´
EXPLANATION
TEST COREHOLELOCATION AND NUMBER
STUDY AREA
LINE OF GEOLOGICSECTION
CC
CC'
G-3671
G-3684
G-3687 G-3689
G-3695
C-1W
L-29 C-4
L-3
1N
G-3696
CC'CC
0 1 2 3 MILES
0 1 2 3 KILOMETERS
Figure 4. Location of test coreholes sampled for foraminiferal paleontology, and line of geologic section CC-CC’ (fig. 12).
made of the molluscan molds where appropriate to aid in identification. After initial identifications were made, samples were split open to expose fresh surfaces and the process repeated.
Identification of benthic foraminifera was made at the genus level, where possible, for 67 thin sections selected by lithology from five test coreholes (fig. 4). Six biofacies were recognized. One was distinguished by an absence of benthic foraminifera and the five others were based on data from Bock and others (1971), and on biofacies suggested by Poag (1981) adapted to thin section analysis. Poag’s (1981) classifi-cation of biofacies is based on predominant benthic foraminifera genera in a sample. Poag (1981) suggests counting 200 to 300 free specimens to establish the presence of a particular biofacies; however, the number of recognizable genera in samples used here is much less, so the interpretation of the biofacies assignments are somewhat speculative.
10 Characterization of Aquifer Heterogeneity Using CyclostratigKarstic Biscayne Aquifer, Southeastern Florida
25°45´
80°25´
EXPLANATION
TEST COREHOLELOCATION AND NUMBER
STUDY AREA
G-3696
LINE OF GEOLOGICSECTION
AA'AA
0
0
3 MILES
3 KILOMETERS
1 2
1 2
G-3720
G-3722
G-3723
G-3725
G-3732
G-3734
G-3680
G-3681G-3695
BROWARD COUNTY
BB'
AA
AA'
BB
G-3678
G-3679
L-67
AL-
67C
L-29 C-4
C-6
C-9
L-3
0N
L-3
1N
G-3696
MIAMI-DADE COUNTY
Figure 3. Location of test coreholes sampled for molluscan paleontology and lines of geologic sections AA-AA’ and BB-BB’ (figs. 7 and 8).
GEOLOGIC FRAMEWORK
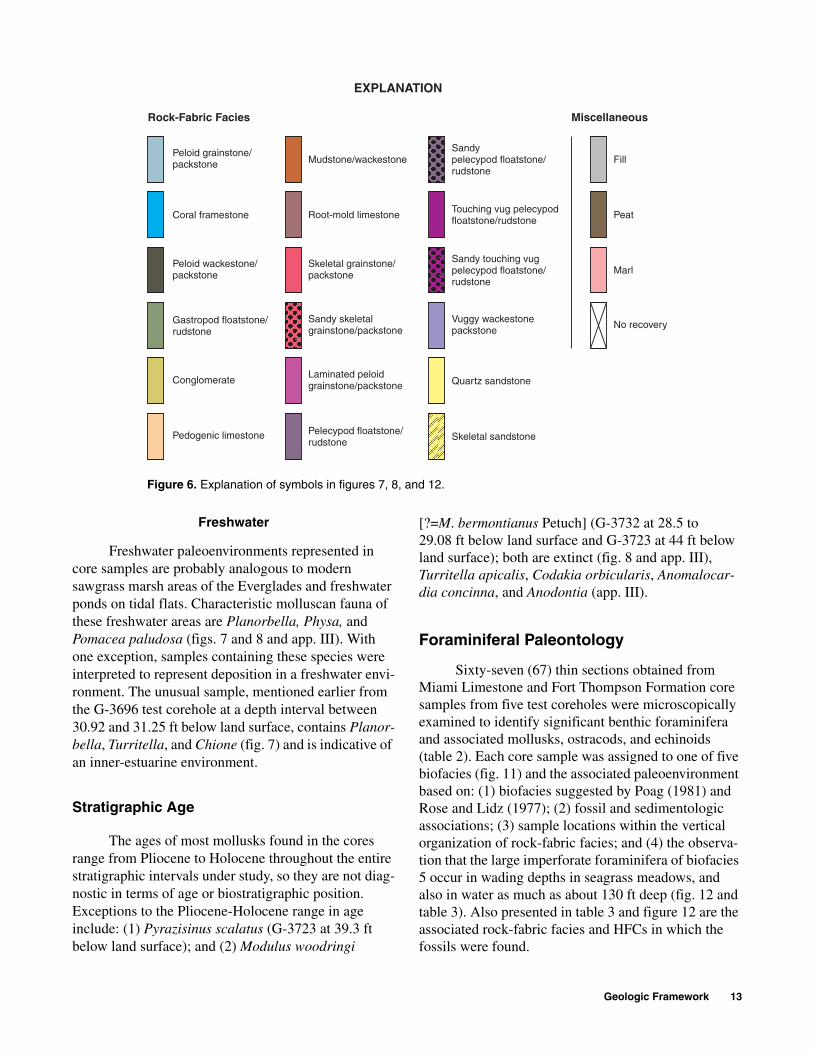
Lithostratigraphy, rock-fabric facies, cyclos-tratigraphy, paleontology, and depositional facies were used to define a unique geologic framework for the rocks that make up the Biscayne aquifer in north-central Miami-Dade County. Lithostratigraphy is the description and systematic organization of rocks and sediments into distinctively named units based on the lithologic character of the rocks and sediments, and their stratigraphic relations (Jackson, 1997). “Rock-fabric facies” is a descriptive term intended to include lithologic character and pore-space properties. Vertical stacking of rock-fabric facies was related in terms of HFCs, pore-size distribution, and relative permeability. Cyclostratigraphy is defined here as the analysis of foot-scale depositional cycles, defined similarly as upward shallowing cycles (James, 1979), and deposited on ancient carbonate shelves or ramps. Molluscan and foraminiferal paleontology was useful in helping to establish paleoenvironments and depositional facies.
Lithostratigraphy
Lithostratigraphic units of interest in this study are contained within the Biscayne aquifer. They include the Tamiami Formation (Pinecrest Sand Member), Anastasia Formation, Key Largo Limestone, Anastasia Formation, Fort Thompson Formation, Miami Limestone, and Pamlico Sand (Fish and Stewart, 1991). Included in this report (present study) are the Lake Flirt Marl and peat of Holocene age within the Biscayne aquifer. These Quaternary units are present
raphy and Geophysical Methods in the Upper Part of the
locally in the study area (Parker and Cooke, 1944; Causaras, 1987); however, the focus of this study is on the upper part of the Fort Thompson Formation, Miami Limestone, Lake Flirt Marl, and Holocene peat (fig. 5). The lithology, limiting extent, and thickness of lithos-tratigraphic units were determined by examination of continuously drilled cores, borehole geophysical logs (especially digital optical borehole images), and GPR profiles. Graphical displays of lithologic core descrip-tions prepared for this study are presented in appendix I.
Molluscan Paleontology
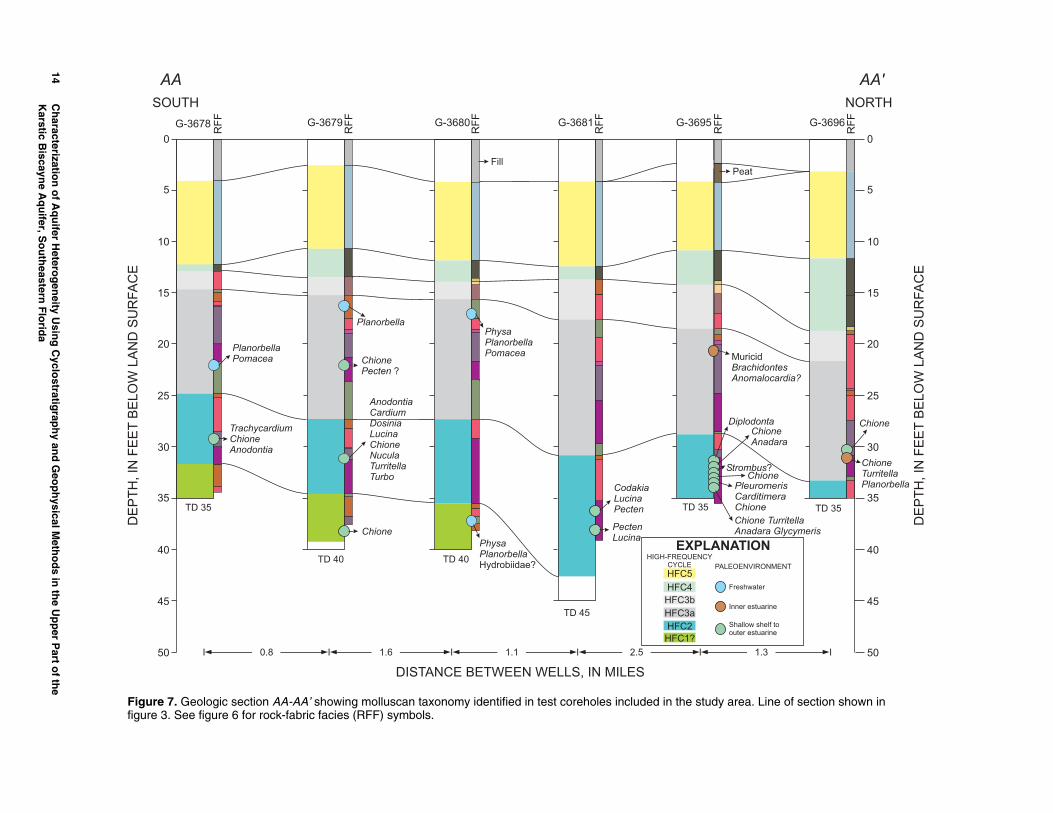
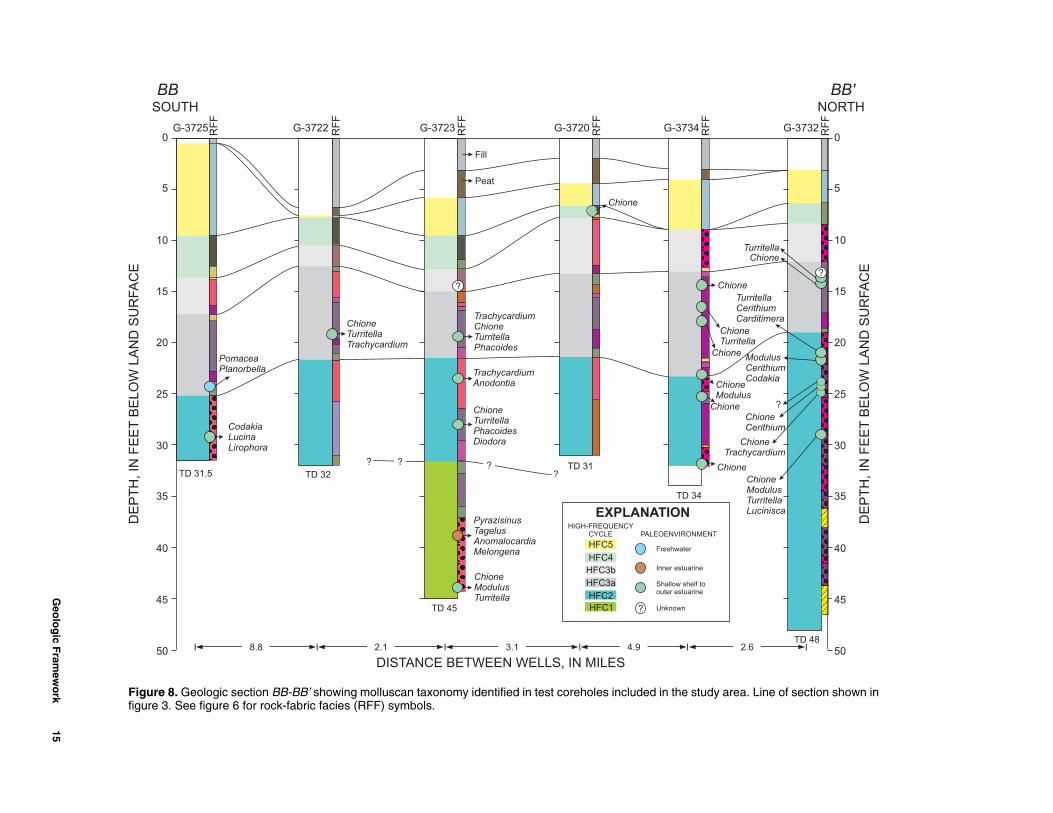
Paleoenvironments and stratigraphic age of the Fort Thompson Formation were evaluated in the 46 core samples collected for molluscan paleontology from 12 test coreholes (fig. 3). Molluscan species diversity in the samples was low, and most of the species identified have a broad tolerance to change in salinity and water depth, so the samples have been clas-sified within only three paleoenvironments based on the mollusks: shallow shelf to outer estuarine, inner estuarine, and freshwater (figs. 6-8 and app. III). Detailed information on the mollusks in specific samples is presented in appendix III.
Paleoenvironments
A paleoenvironmental analysis of the carbonate rocks that comprise the Biscayne aquifer is considered important for developing a hydrogeologic framework used to classify and categorize porosity types, and map distribution of permeability within the Biscayne aqui-fer. The porosity and permeability are related to the vertical arrangement of depositional environments, and thus, paleoenvironments within the Miami Limestone and Fort Thompson Formation.
Shallow Shelf to Outer Estuarine
Most core samples indicative of shallow-shelf to outer-estuarine environments are dominated by the mollusk Chione cancellata (figs. 7 and 8 and app. III). Chione cancellata, an abundant species within the Quaternary rock and sediment of southern Florida, is somewhat tolerant of salinity fluctuations, and has been known to survive hypersaline episodes. Core samples dominated by Chione may represent deposition in an estuarine environment with fluctuating salinity, although this mollusk can also thrive in shelf environ-ments. This species is found in modern-day estuarine
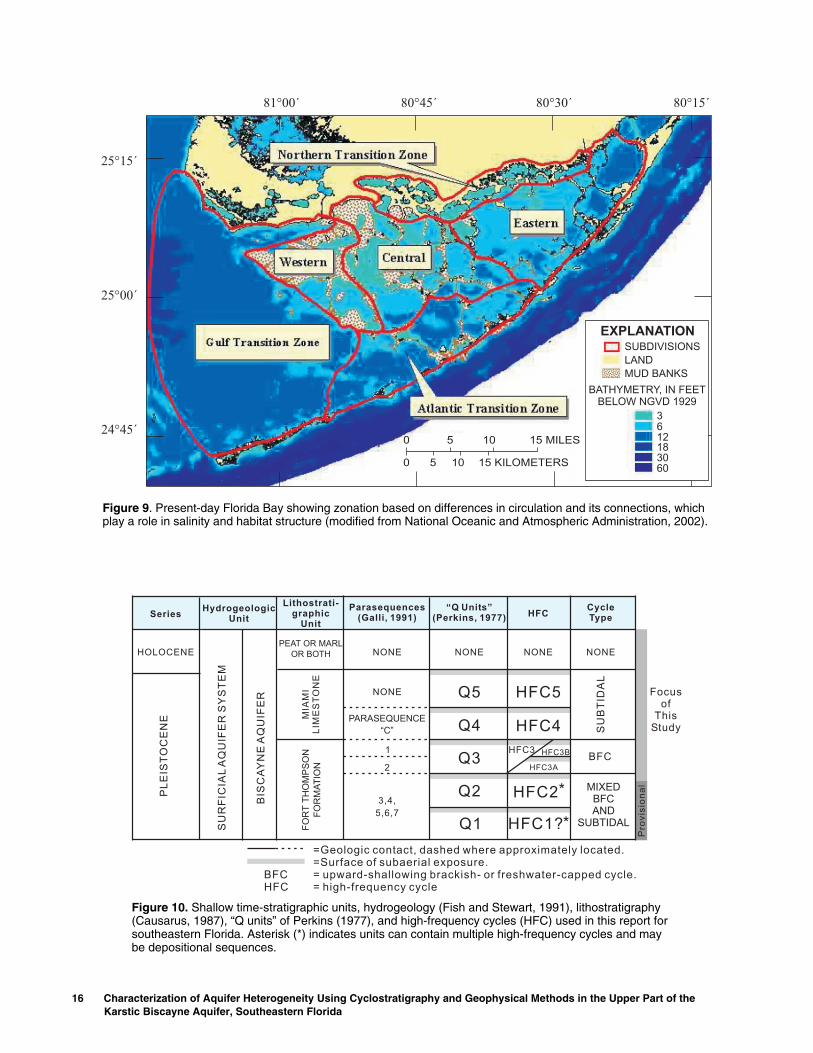
and shelf environments in salinities typically ranging from 24,000 to 35,000 mg/L; however, Chione cancel-lata can tolerate 16,000 to 40,000+ mg/L. In Florida Bay, live specimens have been identified in eastern, central, western, Atlantic, and Gulf transition zones (fig. 9), but not in the northern transitional zone and areas subject to freshwater outflows.
Other molluscan fauna found in samples represen-tative of the shallow-shelf to outer-estuarine environ-ments include Trachycardium, Anodontia, Lucina pensylvanica, Lucinisca nassula, Turbo castaneus, Turritella, Codakia, Dosinia, Lirophora, Modulus, and Cerithium (figs. 7 and 8 and app. III). The majority of the species live in salinities from 25,000 to 40,000 mg/L, with some more tolerant of fluctuating salinities than others. Species less tolerant of salinity fluctuations (Trachycardium, Anodontia, Codakia, and Dosinia) presumably were deposited in a shallow-shelf to outer-estuarine environment in which salinity consistently ranged from 25,000 to 35,000 mg/L. A modern analogue is the western and Gulf transition zones of Florida Bay (fig. 9). Codakia orbicularis is typically considered a shelf species, but it has also been found alive in Florida Bay in the eastern, central and Gulf transition zones (fig. 9) in salinities ranging from 29,000 to 38,000 mg/L. Modulus and Cerithium are present in some of the samples and indicate that sub-aquatic vegetation, such as Thalassia or macrobenthic algae, was present at the time of deposition. Other molluscan fauna found in samples characterized as being shallow shelf to outer estuarine include Carditimera floridana and Pleuromeris tridenta (figs. 7 and 8 and app. III).
Inner Estuarine
Three core samples contained molluscan assem-blages indicative of an inner-estuarine environment. One core sample obtained from a depth between 21.08 and 21.58 ft below land surface near the top of HFC3b (fig. 7) in the G-3695 test corehole is distinctive; the presence of Brachidontes and Anomalocardia sp. indi-cates deposition in an inner-estuarine environment (fig. 7 and app. III). These species are typical of the northern transition zone in present-day Florida Bay (fig. 9) and can tolerate wide extremes of salinity. The second core sample obtained from a 30.92- to 31.25-ft depth below land surface near the base of HFC3b (figs. 7 and 10) in the G-3696 test corehole contains a mixed assemblage. The mixed assemblage may represent the inner-estuarine environment based on the co-occurrence of Planorbella, a freshwater gastropod, and the estuarine
Geologic Framework 11

VERTICAL SCALE GREATLY EXAGGERATED
EXPLANATION
HYDROSTRATIGRAPHIC BOUNDARY
LITHOSTRATIGRAPHIC BOUNDARY
CONFINING TO SEMICONFINING UNIT
OOLITIC LIMESTONE
PELECYPOD RUDSTONE AND FLOATSTONE;MINOR CALCRETE BEDS AND LAMINATIONS;LOCALLY FLOATSTONEPLANORBELLA
PELECYPOD RUDSTONE AND FLOATSTONE;MINOR PELECYPOD-RICH QUARTZ SAND ANDSANDSTONE
REEF ROCK AND MARINE CARBONATE
QUARTZ SAND OR SANDSTONE
SILT
TERRIGENOUS MUDSTONE
CSU
ICU
SA
Fm
INTERMEDIATE CONFINING UNIT
SAND AQUIFER
FORMATION
Pamlico Sand
Thin intercalationsof Holocene Lake Flirt Marland peat or peat only partlycover Miami Limestone
Pinecrest Sand
Unnamedformation
Key Largo Limestone
Key Largo Limestone
Fort ThompsonFormation
Ana-stasia
Fm
Anastasia
Fm
Miami Limestone
TamiamiFormation
SemiconfiningUnit
CSU
Water-table Aquifer
ICU Peace River Formation
EAST
NGVD1929
100100
5050
200200
150150
ALT
ITU
DE
,IN
FE
ET
BE
LO
WN
GV
D1
92
9
ALT
ITU
DE
,IN
FE
ET
BE
LO
WN
GV
D1
92
9Miami Limestone
WEST
Ochopee Limestone
OchopeeLimestone
SA
BiscayneAquifer
BiscayneAquifer
Gray LimestoneAquifer
5 MILES
5 KILOMETERS
0
0
NGVD1929
Figure 5. Relation of geologic and hydrogeologic units of the surficial aquifer system across central Miami-Dade County (modified from Reese and Cunningham, 2000).
to marine species Turritella and Chione (fig. 7 and app. III). This sample probably indicates an inner-estuarine environment. The third core sample collected from a depth of 39.3 ft below land surface in HFC1 in the G-3723 test corehole (figs. 8 and 10 and app. III) may indicate deposition in a specific inner-estuarine environment; namely, a shallow-water or estuarine mud-flat environment with fluctuating salinities that was located in close proximity to mangroves.
12 Characterization of Aquifer Heterogeneity Using CyclostratigKarstic Biscayne Aquifer, Southeastern Florida
This could be analogous to modern mangrove islands or to the dwarf mangrove fringe seen at the northern transitional zone of present-day Florida Bay (fig. 9) and could represent deposition in close proximity to a mangrove island in an estuary, or on the fringe environ-ment where the transition between terrestrial and estua-rine habitat occurs. Characteristic molluscan fauna include Pyrazisinus (extinct), Tagelus, Anomalocardia, and Melongena (fig. 8 and app. III).
raphy and Geophysical Methods in the Upper Part of the
Peloid grainstone/packstone
Peloid wackestone/packstone
Gastropod floatstone/rudstone
Conglomerate
Sandypelecypod floatstone/rudstone
Coral framestone
Fill
Peat
Marl
No recoveryVuggy wackestonepackstone
Touching vug pelecypodfloatstone/rudstone
Mudstone/wackestone
Root-mold limestone
Skeletal grainstone/packstone
Sandy skeletalgrainstone/packstone
Laminated peloidgrainstone/packstone
Pedogenic limestone Pelecypod floatstone/rudstone
Quartz sandstone
Skeletal sandstone
S touching vugfloatstone/
rudstone
andypelecypod
EXPLANATION
Rock-Fabric Facies Miscellaneous
Figure 6. Explanation of symbols in figures 7, 8, and 12.
Freshwater
Freshwater paleoenvironments represented in core samples are probably analogous to modern sawgrass marsh areas of the Everglades and freshwater ponds on tidal flats. Characteristic molluscan fauna of these freshwater areas are Planorbella, Physa, and Pomacea paludosa (figs. 7 and 8 and app. III). With one exception, samples containing these species were interpreted to represent deposition in a freshwater envi-ronment. The unusual sample, mentioned earlier from the G-3696 test corehole at a depth interval between 30.92 and 31.25 ft below land surface, contains Planor-bella, Turritella, and Chione (fig. 7) and is indicative of an inner-estuarine environment.
Stratigraphic Age
The ages of most mollusks found in the cores range from Pliocene to Holocene throughout the entire stratigraphic intervals under study, so they are not diag-nostic in terms of age or biostratigraphic position. Exceptions to the Pliocene-Holocene range in age include: (1) Pyrazisinus scalatus (G-3723 at 39.3 ft below land surface); and (2) Modulus woodringi
[?=M. bermontianus Petuch] (G-3732 at 28.5 to 29.08 ft below land surface and G-3723 at 44 ft below land surface); both are extinct (fig. 8 and app. III), Turritella apicalis, Codakia orbicularis, Anomalocar-dia concinna, and Anodontia (app. III).
Foraminiferal Paleontology
Sixty-seven (67) thin sections obtained from Miami Limestone and Fort Thompson Formation core samples from five test coreholes were microscopically examined to identify significant benthic foraminifera and associated mollusks, ostracods, and echinoids (table 2). Each core sample was assigned to one of five biofacies (fig. 11) and the associated paleoenvironment based on: (1) biofacies suggested by Poag (1981) and Rose and Lidz (1977); (2) fossil and sedimentologic associations; (3) sample locations within the vertical organization of rock-fabric facies; and (4) the observa-tion that the large imperforate foraminifera of biofacies 5 occur in wading depths in seagrass meadows, and also in water as much as about 130 ft deep (fig. 12 and table 3). Also presented in table 3 and figure 12 are the associated rock-fabric facies and HFCs in which the fossils were found.
Geologic Framework 13
14C
haracterizatio
n o
f Aq
uifer H
eterog
eneity U
sing
Cyclo
stratigrap
hy an
d G
eop
hysical M
etho
ds in
the U
pp
er Part o
f the
Karstic B
iscayne A
qu
ifer, So
uth
eastern F
lorid
a
0
10
15
5
20
25
35
30
40
45
50
hionenadara
romerisitimerane
ne Turritellaara Glycymeris
onta
us?
Chione
ChioneTurritellaPlanorbella
ididontesalocardia?
hione
RF
F
G-3696
NORTH
DE
PT
H,
INF
EE
TB
EL
OW
LA
ND
SU
RF
AC
E
TD 35
I1.3
N
ter
tuarine
shelf totuarine
RONMENT
AA'
Line of section shown in
PhysaPlanorbellaPomacea
PhysaPlanorbellaHydrobiidae?
AnodontiaCardiumDosiniaLucinaChioneNuculaTurritellaTurbo
Chione
Planorbella
ChionePecten ?
0
10
15
5
20
25
35
30
40
45
50
PlanorbellaPomacea
TrachycardiumChioneAnodontia
CodakiaLucinaPecten
PectenLucina
CA
PleuCardChio
ChioAnad
Diplod
Stromb
MuricBrachAnom
C
G-3680G-3679G-3678
RF
F
RF
F
RF
F
RF
F
RF
F
G-3681 G-3695
SOUTH
DE
PT
H,
INF
EE
TB
EL
OW
LA
ND
SU
RF
AC
E
I I I I I0.8 1.6 1.1 2.5
DISTANCE BETWEEN WELLS, IN MILES
FillPeat
TD 35
TD 40 TD 40
TD 45
TD 35
EXPLANATIO
HFC4
HFC3b
HFC3a
HFC2
HFC5
Freshwa
Inner es
Shallowouter es
HIGH-FREQUENCYCYCLE PALEOENVI
HFC1?
AA
Figure 7. Geologic section AA-AA’ showing molluscan taxonomy identified in test coreholes included in the study area.figure 3. See figure 6 for rock-fabric facies (RFF) symbols.
Geo
log
ic Fram
ewo
rk
15
ritellahione
neardium
ionerithium
ioneodulusrritellacinisca
tellahiumitimera
dulusrithiumdakia
?
G-3732
NORTH
TD 48I
BB'
0
10
15
5
20
25
35
30
40
45
50
?
DE
PT
H,
INF
EE
TB
EL
OW
LA
ND
SU
RF
AC
E
RF
F
ine of section shown in
TrachycardiumChioneTurritellaPhacoides
PyrazisinusTagelusAnomalocardiaMelongena
ChioneModulusTurritella
ChioneTurritella
Chione
Chione
ChioneModulus
Chione
Chione
CodakiaLucinaLirophora
PomaceaPlanorbella Trachycardium
Anodontia
ChioneTurritella
DiodoraPhacoides
Chione
TurC
ChioTrachyc
ChCe
ChMTuLu
ChioneTurritellaTrachycardium
TurriCeritCard
MoCeCo
G-3723G-3725 G-3722 G-3720 G-3734
SOUTH
TD 31.5
?
TD 32
TD 45
?TD 31
TD 34
Fill
Peat
I I I I I
DISTANCE BETWEEN WELLS, IN MILES
EXPLANATION
Freshwater
Inner estuarine
Shallow shelf toouter estuarine
HFC4
HFC3b
HFC3a
HFC2
HFC5
HFC1
BB
2.64.93.12.18.8
HIGH-FREQUENCYCYCLE PALEOENVIRONMENT
0
10
15
5
20
25
35
30
40
45
50
Unknown?
?
DE
PT
H,
INF
EE
TB
EL
OW
LA
ND
SU
RF
AC
E
RF
F
RF
F
RF
F
RF
F
RF
F
? ?
Figure 8. Geologic section BB-BB’ showing molluscan taxonomy identified in test coreholes included in the study area. Lfigure 3. See figure 6 for rock-fabric facies (RFF) symbols.
16 Characterization of Aquifer Heterogeneity Using Cyclostratigraphy and Geophysical Methods in the Upper Part of the Karstic Biscayne Aquifer, Southeastern Florida
25°15´
25°00´
24°45´
81°00´ 80°45´ 80°30´ 80°15´
0
0
15 MILES
15 KILOMETERS
5 10
5 10
EXPLANATIONSUBDIVISIONS
LAND
MUD BANKS
BATHYMETRY, IN FEETBELOW NGVD 1929
3612183060
Figure 9. Present-day Florida Bay showing zonation based on differences in circulation and its connections, which play a role in salinity and habitat structure (modified from National Oceanic and Atmospheric Administration, 2002).
PL
EIS
TO
CE
NE
HOLOCENE
Series
Lithostrati-graphic
Unit
HydrogeologicUnit
MIA
MI
LIM
ES
TO
NE
FO
RT
TH
OM
PS
ON
FO
RM
AT
ION
PEAT OR MARL
OR BOTH
SU
RF
ICIA
LA
QU
IFE
RS
YS
TE
M
BIS
CA
YN
EA
QU
IFE
R
“Q Units”(Perkins, 1977) HFC
CycleType
Q5 HFC5
Q4 HFC4 SU
BT
IDA
L
Pro
vis
ion
al
BFC
MIXEDBFCAND
SUBTIDAL
Q3HFC3B
HFC3A
HFC3
Q2 HFC2
HFC1?Q1
Parasequences(Galli, 1991)
1
2
3,4,
5,6,7
PARASEQUENCE
“C”
Focusof
ThisStudy
NONE NONE NONE NONE
NONE
*
*
=Geologic contact, dashed where approximately located.=Surface of subaerial exposure.= upward-shallowing brackish- or freshwater-capped cycle.= high-frequency cycle
BFCHFC
Figure 10. Shallow time-stratigraphic units, hydrogeology (Fish and Stewart, 1991), lithostratigraphy (Causarus, 1987), “Q units” of Perkins (1977), and high-frequency cycles (HFC) used in this report for southeastern Florida. Asterisk (*) indicates units can contain multiple high-frequency cycles and may be depositional sequences.
Geo
log
ic Fram
ewo
rk
17
oles G-3671,
sent. Biofacies: biofacies 1, foraminifera 3, Elphidium predominant; biofacies 4,
Par
aso
rite
s
Pen
ero
plid
s
Pen
ero
plis
Am
ph
iste
gin
a
Mo
llusk
s
Gas
tro
po
ds
Pel
ecyp
od
s
Ost
raco
ds
Ech
ino
ids
X
X X
X X
X
X X X
X
X
X X
X X X
X X X
X X
X X
X
X
X X X
X
X X
X
X X
X
Table 2. Occurrence of stratigraphically important benthic foraminiferal taxa, mollusks, ostracods, and echinoids in test corehG-3684, G-3687, G-3689, and G-3695
[Abbreviations: HFC, high frequency cycle; P, predominant foraminiferal taxa; Q, presence is questionable; RF, rotaliform foraminifera; X, preabsent (commonly contains smoothed-walled ostracods, commonly together with gastropods); biofacies 2, Ammonia predominant; biofacies miliolids predominant; biofacies 5, archaiasinids, soritids, and peneroplids predominant]
Sample depth (below ground level,
in feet)
HFC Rock-fabric faciesBio-
facies
RF
Ro
talia
Am
mo
nia
Elp
hid
ium
Mili
olid
s
So
riti
ds
So
rite
s
Arc
hai
asin
ids
Arc
hai
as
An
dro
sin
a
Cyc
lorb
icu
lina
G-3671
6.0 HFC5 Peloid grainstone and packstone 4 X
9.0 HFC5 Peloid grainstone and packstone 4 X
13.5 HFC3b Mudstone and wackestone 2/3 X Q
14.5 HFC3b Pedogenic limestone (root-mold limestone) ?
18.5 HFC3b Skeletal grainstone and packstone 5 X X Q X
19.5 HFC3a Mudstone and wackestone 5 X X
20.8 HFC3a Laminated peloid grainstone and packstone 5 X X X X
21.2 HFC3a Pelecypod floatstone and rudstone 5 X X X
25.0 HFC3a Touching-vug pelecypod floatstone and rudstone 3 X P X
26.0 HFC3a Touching-vug pelecypod floatstone and rudstone 1
27.2 HFC3a Gastropod floatstone and rudstone 1
27.8 HFC3a Gastropod floatstone and rudstone 1
29.5 HFC3a Gastropod floatstone and rudstone 1
29.8 HFC3a Gastropod floatstone and rudstone 1/2 X
30.2 HFC2 Skeletal grainstone and packstone 2 X P
34.8 HFC2 Pelecypod floatstone and rudstone ?
38.0 HFC2 Skeletal grainstone and packstone 5 X X X X X
41.0 HFC2 Gastropod floatstone and rudstone 1
42.0 HFC2 Gastropod floatstone and rudstone 1
42.2 HFC2 Gastropod floatstone and rudstone 1
43.0 HFC2 Gastropod floatstone and rudstone 1
46.0 HFC1 Touching-vug pelecypod floatstone and rudstone 2/5 X X X X
49.5 HFC1 Touching-vug pelecypod floatstone and rudstone 4? X
50.8 HFC1 Sandy touching vug pelecypod floatstone and rudstone ?
53.0 HFC1 Skeletal sandstone ?

18C
haracterizatio
n o
f Aq
uifer H
eterog
eneity U
sing
Cyclo
stratigrap
hy an
d G
eop
hysical M
etho
ds in
the U
pp
er Part o
f the
Karstic B
iscayne A
qu
ifer, So
uth
eastern F
lorid
a
X
X X
X X X
X X
X P P
X X X
X X
X X X
X X
X X X
X X
X X
X X
X X X X
Q X X X
X
X X
X
X
X X X
X
X X X
s G-3671,
nt. Biofacies: biofacies 1, foraminifera Elphidium predominant; biofacies 4,
Par
aso
rite
s
Pen
ero
plid
s
Pen
ero
plis
Am
ph
iste
gin
a
Mo
llusk
s
Gas
tro
po
ds
Pel
ecyp
od
s
Ost
raco
ds
Ech
ino
ids
G-3684
16.0 HFC4 Peloid wackestone and packstone ?
16.4 HFC4 Peloid wackestone and packstone 5 X X X
17.4 HFC3b Mudstone and wackestone 2 P X
19.8 HFC3b Skeletal grainstone and packstone 5 X
22.0 HFC3a Mudstone and wackestone 1?/2 X P X
23.2 HFC3a Pelecypod floatstone and rudstone 5 X X X P
27.2 HFC3a Pelecypod floatstone and rudstone 5 X X
30.7 HFC3a Touching-vug pelecypod floatstone and rudstone 4
31.5 HFC2 Skeletal grainstone and packstone 5 X X X X X X
G-3687
14.0 HFC3a Mudstone and wackestone 3 Q X
15.0 HFC3a Skeletal grainstone and packstone 4/5 X X X X
16.2 HFC3a Skeletal grainstone and packstone 4/5 X X X X
17.7 HFC3a Skeletal grainstone and packstone 4/5 X X Q
20.0 HFC3a Gastropod floatstone and rudstone 1
21.6 HFC2 Skeletal grainstone and packstone 4/5 X X X
24.7 HFC2 Skeletal grainstone and packstone 2 X X
26.2 HFC2 Touching-vug pelecypod floatstone and rudstone 5 X X X
27.5 HFC2 Touching-vug pelecypod floatstone and rudstone 5? X X
G-3689
8.9 HFC4 Peloid grainstone and packstone ?
10.4 HFC4 Peloid grainstone and packstone 5 X
12.5 HFC4 Peloid wackestone and packstone 5 X X
13.4 HFC4 Gastropod floatstone and rudstone 1
13.9 HFC4 Conglomerate 5 X X
14.8 HFC3b Mudstone and wackestone 3 X X P X
Table 2. Occurrence of stratigraphically important benthic foraminiferal taxa, mollusks, ostracods, and echinoids in test coreholeG-3684, G-3687, G-3689, and G-3695 (Continued)
[Abbreviations: HFC, high frequency cycle; P, predominant foraminiferal taxa; Q, presence is questionable; RF, rotaliform foraminifera; X, preseabsent (commonly contains smoothed-walled ostracods, commonly together with gastropods); biofacies 2, Ammonia predominant; biofacies 3, miliolids predominant; biofacies 5, archaiasinids, soritids, and peneroplids predominant]
Sample depth (below ground level,
in feet)
HFC Rock-fabric faciesBio-
facies
RF
Ro
talia
Am
mo
nia
Elp
hid
ium
Mili
olid
s
So
riti
ds
So
rite
s
Arc
hai
asin
ids
Arc
hai
as
An
dro
sin
a
Cyc
lorb
icu
lina
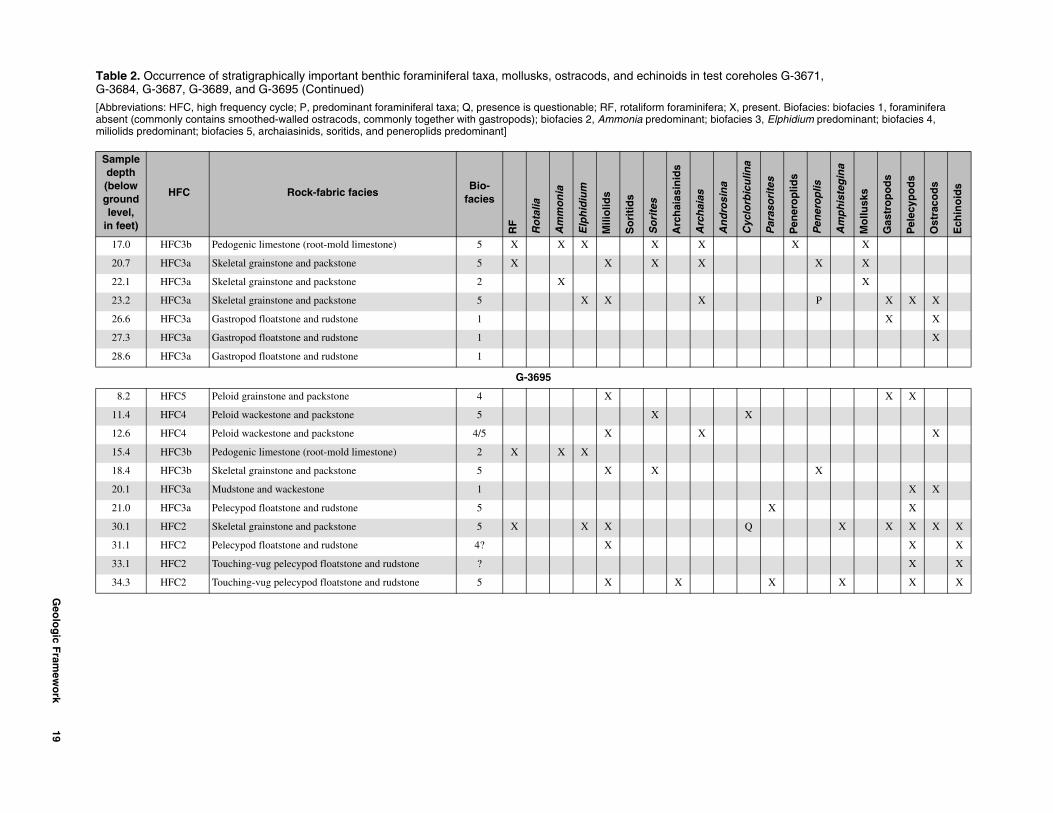
Geo
log
ic Fram
ewo
rk
19
X X
X X
X
P X X X
X X
X
X X
X
X
X X
X X
X X X X X
X X
X X
X X X X
oles G-3671,
sent. Biofacies: biofacies 1, foraminifera 3, Elphidium predominant; biofacies 4,
Par
aso
rite
s
Pen
ero
plid
s
Pen
ero
plis
Am
ph
iste
gin
a
Mo
llusk
s
Gas
tro
po
ds
Pel
ecyp
od
s
Ost
raco
ds
Ech
ino
ids
17.0 HFC3b Pedogenic limestone (root-mold limestone) 5 X X X X X
20.7 HFC3a Skeletal grainstone and packstone 5 X X X X
22.1 HFC3a Skeletal grainstone and packstone 2 X
23.2 HFC3a Skeletal grainstone and packstone 5 X X X
26.6 HFC3a Gastropod floatstone and rudstone 1
27.3 HFC3a Gastropod floatstone and rudstone 1
28.6 HFC3a Gastropod floatstone and rudstone 1
G-3695
8.2 HFC5 Peloid grainstone and packstone 4 X
11.4 HFC4 Peloid wackestone and packstone 5 X X
12.6 HFC4 Peloid wackestone and packstone 4/5 X X
15.4 HFC3b Pedogenic limestone (root-mold limestone) 2 X X X
18.4 HFC3b Skeletal grainstone and packstone 5 X X
20.1 HFC3a Mudstone and wackestone 1
21.0 HFC3a Pelecypod floatstone and rudstone 5
30.1 HFC2 Skeletal grainstone and packstone 5 X X X Q
31.1 HFC2 Pelecypod floatstone and rudstone 4? X
33.1 HFC2 Touching-vug pelecypod floatstone and rudstone ?
34.3 HFC2 Touching-vug pelecypod floatstone and rudstone 5 X X
Table 2. Occurrence of stratigraphically important benthic foraminiferal taxa, mollusks, ostracods, and echinoids in test corehG-3684, G-3687, G-3689, and G-3695 (Continued)
[Abbreviations: HFC, high frequency cycle; P, predominant foraminiferal taxa; Q, presence is questionable; RF, rotaliform foraminifera; X, preabsent (commonly contains smoothed-walled ostracods, commonly together with gastropods); biofacies 2, Ammonia predominant; biofacies miliolids predominant; biofacies 5, archaiasinids, soritids, and peneroplids predominant]
Sample depth (below ground level,
in feet)
HFC Rock-fabric faciesBio-
facies
RF
Ro
talia
Am
mo
nia
Elp
hid
ium
Mili
olid
s
So
riti
ds
So
rite
s
Arc
hai
asin
ids
Arc
hai
as
An
dro
sin
a
Cyc
lorb
icu
lina
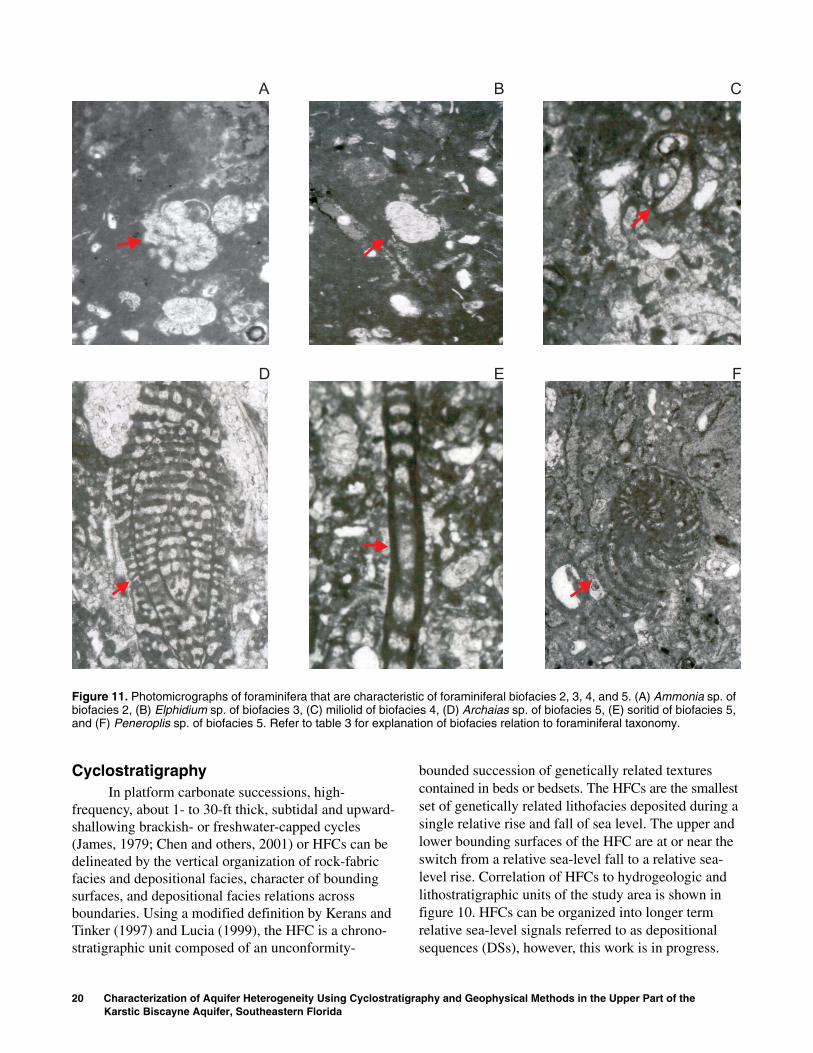
D E F
CBA
Figure 11. Photomicrographs of foraminifera that are characteristic of foraminiferal biofacies 2, 3, 4, and 5. (A) Ammonia sp. of biofacies 2, (B) Elphidium sp. of biofacies 3, (C) miliolid of biofacies 4, (D) Archaias sp. of biofacies 5, (E) soritid of biofacies 5, and (F) Peneroplis sp. of biofacies 5. Refer to table 3 for explanation of biofacies relation to foraminiferal taxonomy.
CyclostratigraphyIn platform carbonate successions, high-
frequency, about 1- to 30-ft thick, subtidal and upward-shallowing brackish- or freshwater-capped cycles (James, 1979; Chen and others, 2001) or HFCs can be delineated by the vertical organization of rock-fabric facies and depositional facies, character of bounding surfaces, and depositional facies relations across boundaries. Using a modified definition by Kerans and Tinker (1997) and Lucia (1999), the HFC is a chrono-stratigraphic unit composed of an unconformity-
20 Characterization of Aquifer Heterogeneity Using CyclostratigKarstic Biscayne Aquifer, Southeastern Florida
bounded succession of genetically related textures contained in beds or bedsets. The HFCs are the smallest set of genetically related lithofacies deposited during a single relative rise and fall of sea level. The upper and lower bounding surfaces of the HFC are at or near the switch from a relative sea-level fall to a relative sea-level rise. Correlation of HFCs to hydrogeologic and lithostratigraphic units of the study area is shown in figure 10. HFCs can be organized into longer term relative sea-level signals referred to as depositional sequences (DSs), however, this work is in progress.
raphy and Geophysical Methods in the Upper Part of the

Geo
log
ic Fram
ewo
rk
21
SOUTH
G-3684
CC'
4.5 I
PLANATION
Biofacies ?
TD 35
Biofacies 5
Biofacies 1?/2Biofacies 5
Biofacies 5
Biofacies 5
Biofacies 5Biofacies 4
?
?
ofacies 4?
ofacies 5
ofacies 4/5
ofacies 2
ofacies 5
ofacies 1
ofacies 5
ofacies 5ofacies 4?
ofacies ?
Freshwater to brackish
Inner shelf and near shore,frequently tidally influenced
Marine shelf
Unknown
Inner shelf and near shore,open ocean
?
ofacies 5
0
10
15
5
20
25
35
30
40
45
50
55
YPALEOENVIRONMENT
DE
PT
H,
INF
EE
TB
EL
OW
LA
ND
SU
RF
AC
E
RF
F
. Line of section shown in figure 4. nomy.
DISTANCE BETWEEN WELLS, IN MILES
G-3689G-3671 G-3695G-3687
NORTH
CC
1.5 5.0 3.3I I I I
Fill
HFC5
HFC4
HFC3b
HFC3a
HFC2
HFC1?
? ?
??
EX
HFC4
HFC3b
HFC3a
HFC2
HFC5
HFC1?
Peat and Marl
TD 30
TD 150
TD 30
TD 35
Biofacies 3Biofacies 4/5Biofacies 4/5
Biofacies 4/5
Biofacies 1Biofacies 4/5
Biofacies 2Biofacies 5
?
Biofacies 5?
Biofacies ?
Biofacies 5
?
Biofacies 5
Biofacies 1Biofacies 5Biofacies 3Biofacies 5
Biofacies 5Biofacies 2Biofacies 5
Biofacies 1Biofacies 1Biofacies 1
Biofacies 4
Biofacies 4??
Biofacies 2/3Biofacies ?
?
Biofacies 5
Biofacies 5Biofacies 5Biofacies 5
Biofacies 3Biofacies 1??Biofacies 1Biofacies 1Biofacies 1Biofacies 1/2Biofacies 2
Biofacies ?Biofacies 5
Biofacies 1Biofacies 1Biofacies 1
Biofacies 1
Biofacies 2/5
Biofacies 4??
Biofacies ??
Biofacies ??
?
Bi
Bi
Bi
Bi
Bi
Bi
Bi
BiBi
?
Bi?
Bi
?
0
10
15
5
20
25
35
30
40
45
50
55
HIGH-FREQUENCCYCLE
DE
PT
H,
INF
EE
TB
EL
OW
LA
ND
SU
RF
AC
E
RF
F
RF
F
RF
F
RF
FFigure 12. Geologic section CC-CC’ showing foraminiferal taxonomy identified in test coreholes included in the study areaSee figure 6 for rock-fabric facies (RFF) symbols. Refer to table 3 for explanation of biofacies relation to foraminiferal taxo
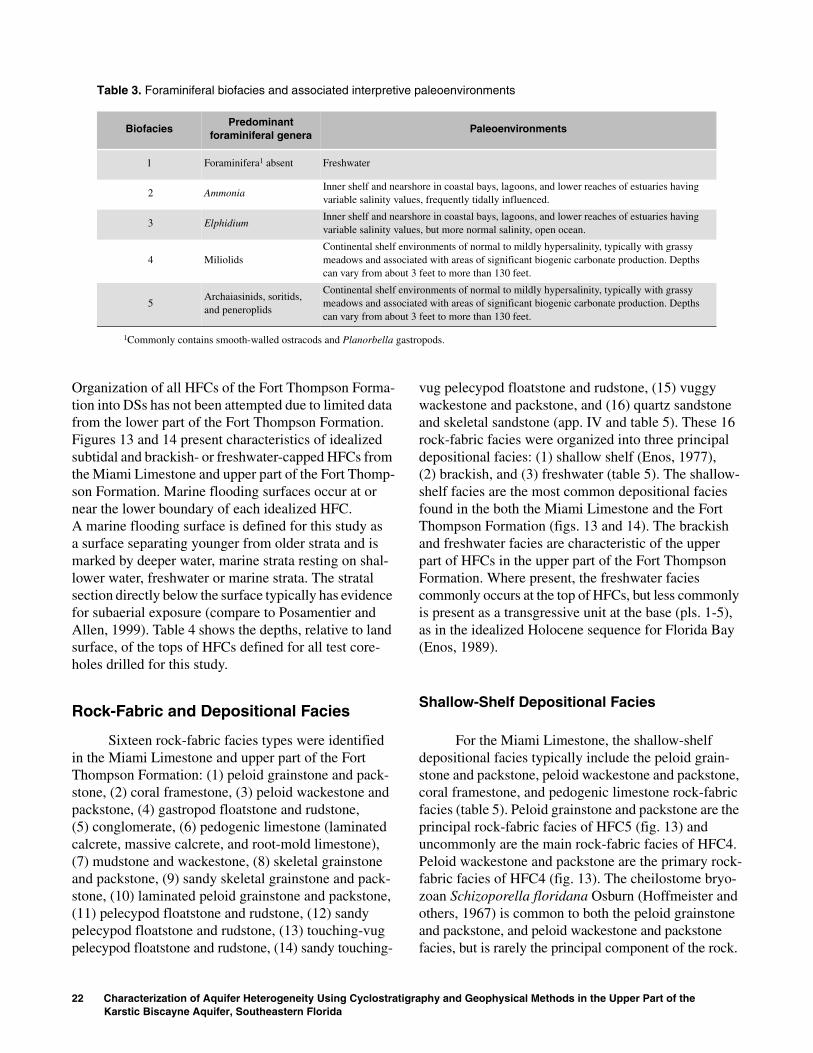
Table 3. Foraminiferal biofacies and associated interpretive paleoenvironments
BiofaciesPredominant
foraminiferal generaPaleoenvironments
1 Foraminifera1 absent Freshwater
2 AmmoniaInner shelf and nearshore in coastal bays, lagoons, and lower reaches of estuaries having variable salinity values, frequently tidally influenced.
3 ElphidiumInner shelf and nearshore in coastal bays, lagoons, and lower reaches of estuaries having variable salinity values, but more normal salinity, open ocean.
4 MiliolidsContinental shelf environments of normal to mildly hypersalinity, typically with grassy meadows and associated with areas of significant biogenic carbonate production. Depths can vary from about 3 feet to more than 130 feet.
5Archaiasinids, soritids, and peneroplids
Continental shelf environments of normal to mildly hypersalinity, typically with grassy meadows and associated with areas of significant biogenic carbonate production. Depths can vary from about 3 feet to more than 130 feet.
1Commonly contains smooth-walled ostracods and Planorbella gastropods.
Organization of all HFCs of the Fort Thompson Forma-tion into DSs has not been attempted due to limited data from the lower part of the Fort Thompson Formation. Figures 13 and 14 present characteristics of idealized subtidal and brackish- or freshwater-capped HFCs from the Miami Limestone and upper part of the Fort Thomp-son Formation. Marine flooding surfaces occur at or near the lower boundary of each idealized HFC. A marine flooding surface is defined for this study as a surface separating younger from older strata and is marked by deeper water, marine strata resting on shal-lower water, freshwater or marine strata. The stratal section directly below the surface typically has evidence for subaerial exposure (compare to Posamentier and Allen, 1999). Table 4 shows the depths, relative to land surface, of the tops of HFCs defined for all test core-holes drilled for this study.
Rock-Fabric and Depositional Facies
Sixteen rock-fabric facies types were identified in the Miami Limestone and upper part of the Fort Thompson Formation: (1) peloid grainstone and pack-stone, (2) coral framestone, (3) peloid wackestone and packstone, (4) gastropod floatstone and rudstone, (5) conglomerate, (6) pedogenic limestone (laminated calcrete, massive calcrete, and root-mold limestone), (7) mudstone and wackestone, (8) skeletal grainstone and packstone, (9) sandy skeletal grainstone and pack-stone, (10) laminated peloid grainstone and packstone, (11) pelecypod floatstone and rudstone, (12) sandy pelecypod floatstone and rudstone, (13) touching-vug pelecypod floatstone and rudstone, (14) sandy touching-
22 Characterization of Aquifer Heterogeneity Using CyclostratigKarstic Biscayne Aquifer, Southeastern Florida
vug pelecypod floatstone and rudstone, (15) vuggy wackestone and packstone, and (16) quartz sandstone and skeletal sandstone (app. IV and table 5). These 16 rock-fabric facies were organized into three principal depositional facies: (1) shallow shelf (Enos, 1977), (2) brackish, and (3) freshwater (table 5). The shallow-shelf facies are the most common depositional facies found in the both the Miami Limestone and the Fort Thompson Formation (figs. 13 and 14). The brackish and freshwater facies are characteristic of the upper part of HFCs in the upper part of the Fort Thompson Formation. Where present, the freshwater facies commonly occurs at the top of HFCs, but less commonly is present as a transgressive unit at the base (pls. 1-5), as in the idealized Holocene sequence for Florida Bay (Enos, 1989).
Shallow-Shelf Depositional Facies
For the Miami Limestone, the shallow-shelf depositional facies typically include the peloid grain-stone and packstone, peloid wackestone and packstone, coral framestone, and pedogenic limestone rock-fabric facies (table 5). Peloid grainstone and packstone are the principal rock-fabric facies of HFC5 (fig. 13) and uncommonly are the main rock-fabric facies of HFC4. Peloid wackestone and packstone are the primary rock-fabric facies of HFC4 (fig. 13). The cheilostome bryo-zoan Schizoporella floridana Osburn (Hoffmeister and others, 1967) is common to both the peloid grainstone and packstone, and peloid wackestone and packstone facies, but is rarely the principal component of the rock.
raphy and Geophysical Methods in the Upper Part of the
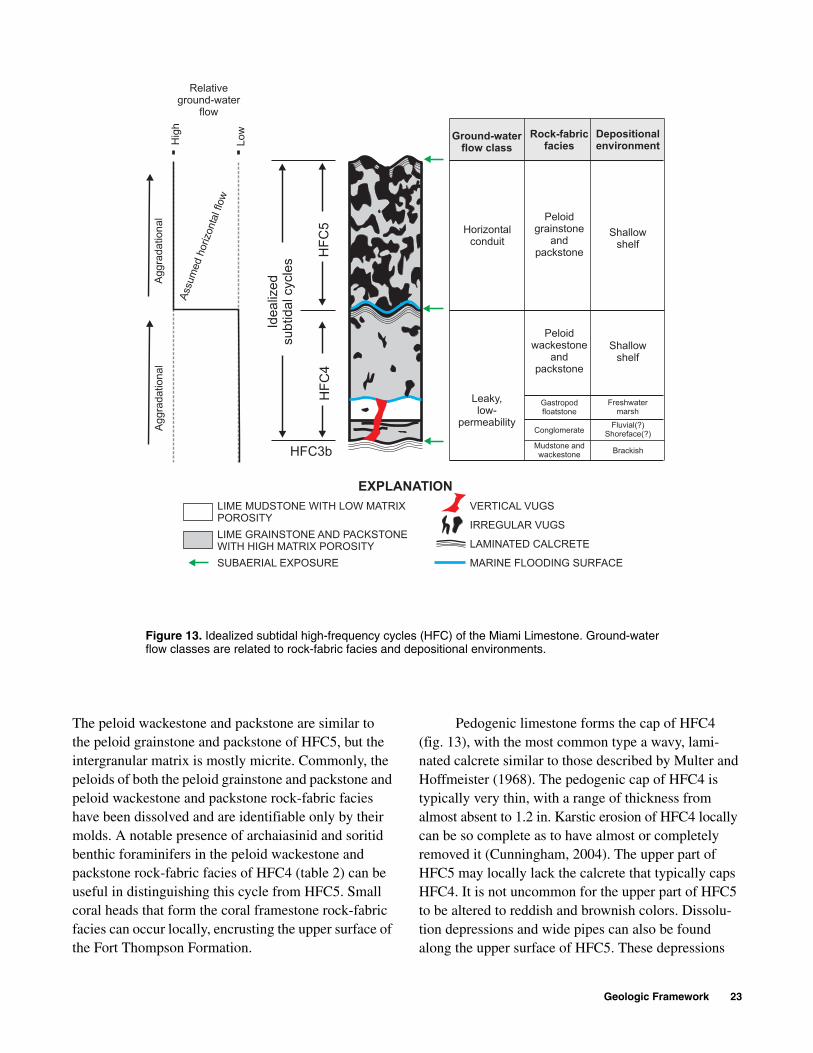
Geologic Framework 23
The peloid wackestone and packstone are similar to the peloid grainstone and packstone of HFC5, but the intergranular matrix is mostly micrite. Commonly, the peloids of both the peloid grainstone and packstone and peloid wackestone and packstone rock-fabric facies have been dissolved and are identifiable only by their molds. A notable presence of archaiasinid and soritid benthic foraminifers in the peloid wackestone and packstone rock-fabric facies of HFC4 (table 2) can be useful in distinguishing this cycle from HFC5. Small coral heads that form the coral framestone rock-fabric facies can occur locally, encrusting the upper surface of the Fort Thompson Formation.
Pedogenic limestone forms the cap of HFC4 (fig. 13), with the most common type a wavy, lami-nated calcrete similar to those described by Multer and Hoffmeister (1968). The pedogenic cap of HFC4 is typically very thin, with a range of thickness from almost absent to 1.2 in. Karstic erosion of HFC4 locally can be so complete as to have almost or completely removed it (Cunningham, 2004). The upper part of HFC5 may locally lack the calcrete that typically caps HFC4. It is not uncommon for the upper part of HFC5 to be altered to reddish and brownish colors. Dissolu-tion depressions and wide pipes can also be found along the upper surface of HFC5. These depressions
HF
C4
HFC3b
HF
C5
Ide
aliz
ed
su
btid
alcycle
s
Ass
um
ed
horizo
nta
l flo
wHorizontal
conduit
Leaky,low-
permeability
Freshwatermarsh
Fluvial(?)Shoreface(?)
Rock-fabricfacies
Depositionalenvironment
Shallowshelf
Peloidgrainstone
andpackstone
Relativeground-water
flow
Lo
w
Hig
h
Shallowshelf
Gastropodfloatstone
Peloidwackestone
andpackstone
Conglomerate
Ag
gra
da
tio
na
lA
gg
rad
atio
na
l
Ground-waterflow class
LIME GRAINSTONE AND PACKSTONEWITH HIGH MATRIX POROSITY
LIME MUDSTONE WITH LOW MATRIXPOROSITY
LAMINATED CALCRETE
IRREGULAR VUGS
MARINE FLOODING SURFACE
EXPLANATION
SUBAERIAL EXPOSURE
Mudstone andwackestone
Brackish
VERTICAL VUGS
Figure 13. Idealized subtidal high-frequency cycles (HFC) of the Miami Limestone. Ground-water flow classes are related to rock-fabric facies and depositional environments.
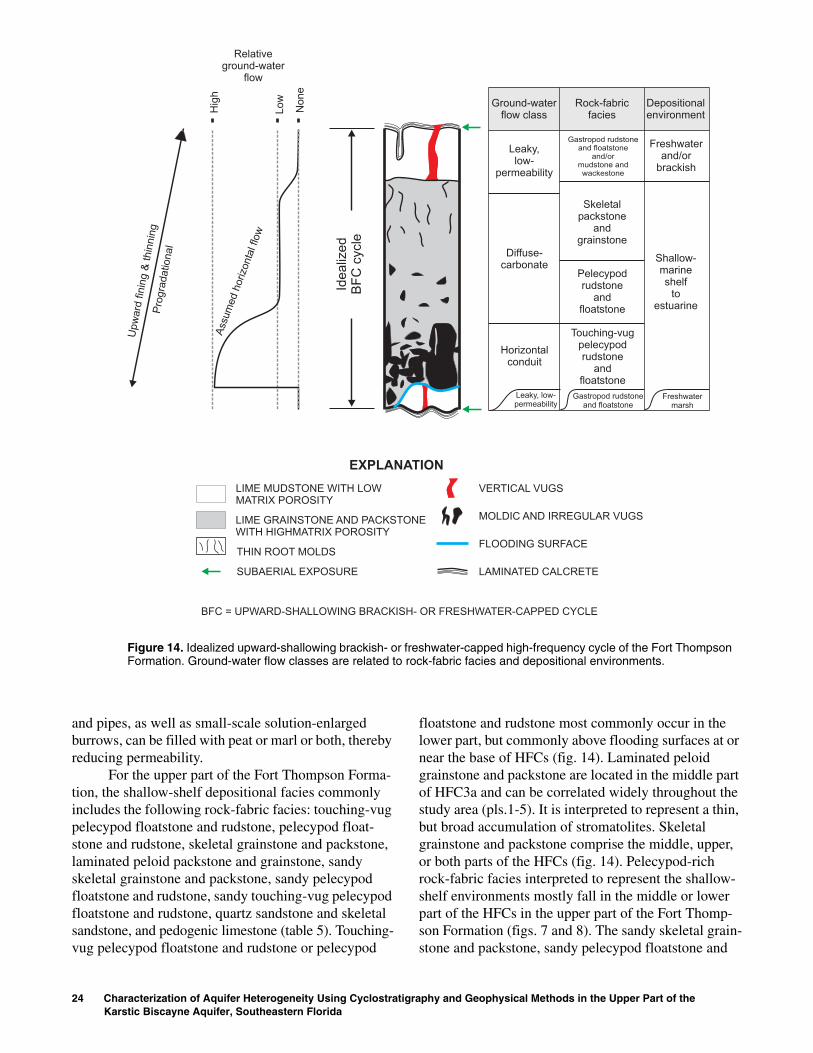
LIME GRAINSTONE AND PACKSTONEWITH HIGHMATRIX POROSITY
LIME MUDSTONE WITH LOWMATRIX POROSITY
LAMINATED CALCRETE
MOLDIC AND IRREGULAR VUGS
FLOODING SURFACE
VERTICAL VUGS
THIN ROOT MOLDS
EXPLANATION
SUBAERIAL EXPOSURE
BFC = UPWARD-SHALLOWING BRACKISH- OR FRESHWATER-CAPPED CYCLE
Ide
aliz
ed
BF
Ccycle
Upw
ard
finin
g&
thin
nin
gP
rogra
dational
Ass
um
ed
horizo
nta
l flo
w
Horizontalconduit
Diffuse-carbonate
Leaky,low-
permeability
Leaky, low-permeability
Freshwatermarsh
Freshwaterand/or
brackish
Gastropod rudstoneand floatstone
and/ormudstone andwackestone
Rock-fabricfacies
Ground-waterflow class
Depositionalenvironment
Skeletalpackstone
andgrainstone
Lo
w
No
ne
Hig
h
Shallow-marineshelf
toestuarine
Touching-vugpelecypodrudstone
andfloatstone
Pelecypodrudstone
andfloatstone
Gastropod rudstoneand floatstone
Relativeground-water
flow
Figure 14. Idealized upward-shallowing brackish- or freshwater-capped high-frequency cycle of the Fort Thompson Formation. Ground-water flow classes are related to rock-fabric facies and depositional environments.
and pipes, as well as small-scale solution-enlarged burrows, can be filled with peat or marl or both, thereby reducing permeability.
For the upper part of the Fort Thompson Forma-tion, the shallow-shelf depositional facies commonly includes the following rock-fabric facies: touching-vug pelecypod floatstone and rudstone, pelecypod float-stone and rudstone, skeletal grainstone and packstone, laminated peloid packstone and grainstone, sandy skeletal grainstone and packstone, sandy pelecypod floatstone and rudstone, sandy touching-vug pelecypod floatstone and rudstone, quartz sandstone and skeletal sandstone, and pedogenic limestone (table 5). Touching-vug pelecypod floatstone and rudstone or pelecypod
24 Characterization of Aquifer Heterogeneity Using CyclostratigKarstic Biscayne Aquifer, Southeastern Florida
floatstone and rudstone most commonly occur in the lower part, but commonly above flooding surfaces at or near the base of HFCs (fig. 14). Laminated peloid grainstone and packstone are located in the middle part of HFC3a and can be correlated widely throughout the study area (pls.1-5). It is interpreted to represent a thin, but broad accumulation of stromatolites. Skeletal grainstone and packstone comprise the middle, upper, or both parts of the HFCs (fig. 14). Pelecypod-rich rock-fabric facies interpreted to represent the shallow-shelf environments mostly fall in the middle or lower part of the HFCs in the upper part of the Fort Thomp-son Formation (figs. 7 and 8). The sandy skeletal grain-stone and packstone, sandy pelecypod floatstone and
raphy and Geophysical Methods in the Upper Part of the
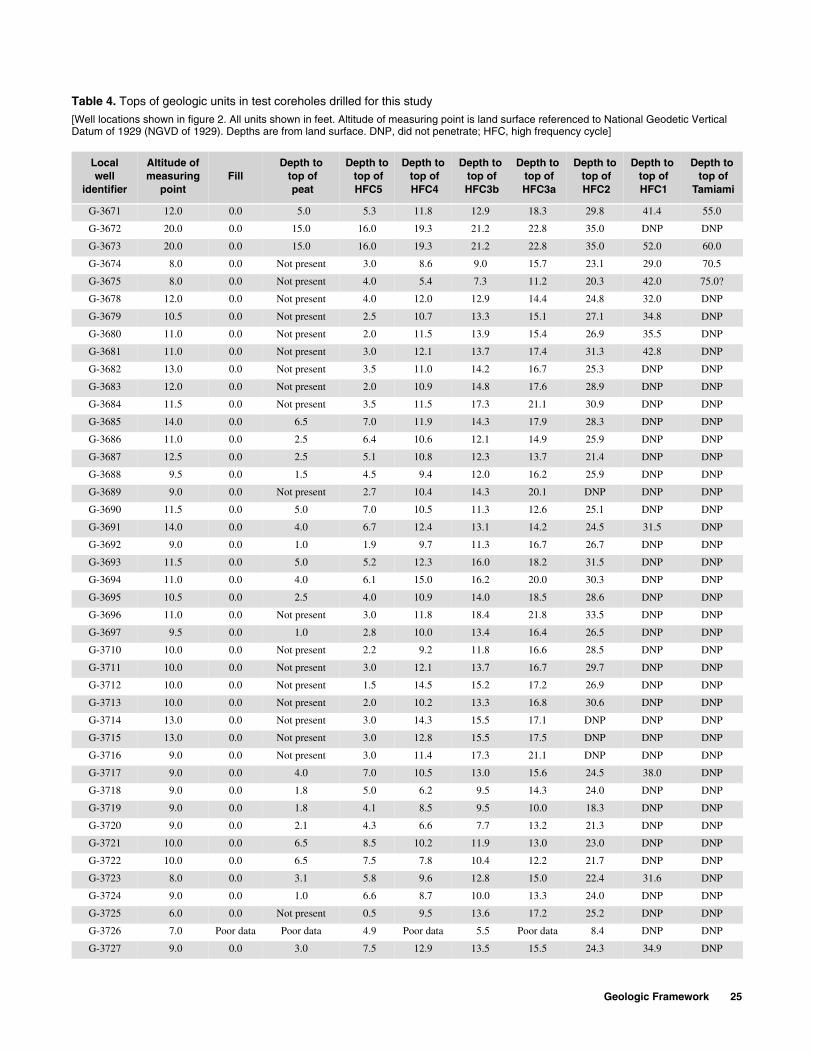
Table 4. Tops of geologic units in test coreholes drilled for this s
[Well locations shown in figure 2. All units shown in feet. Altitude of meaDatum of 1929 (NGVD of 1929). Depths are from land surface. DNP, did
Localwell
identifier
Altitude of measuring
pointFill
Depth to top of peat
Depth to top of HFC5
D
G-3671 12.0 0.0 5.0 5.3
G-3672 20.0 0.0 15.0 16.0
G-3673 20.0 0.0 15.0 16.0
G-3674 8.0 0.0 Not present 3.0
G-3675 8.0 0.0 Not present 4.0
G-3678 12.0 0.0 Not present 4.0
G-3679 10.5 0.0 Not present 2.5
G-3680 11.0 0.0 Not present 2.0
G-3681 11.0 0.0 Not present 3.0
G-3682 13.0 0.0 Not present 3.5
G-3683 12.0 0.0 Not present 2.0
G-3684 11.5 0.0 Not present 3.5
G-3685 14.0 0.0 6.5 7.0
G-3686 11.0 0.0 2.5 6.4
G-3687 12.5 0.0 2.5 5.1
G-3688 9.5 0.0 1.5 4.5
G-3689 9.0 0.0 Not present 2.7
G-3690 11.5 0.0 5.0 7.0
G-3691 14.0 0.0 4.0 6.7
G-3692 9.0 0.0 1.0 1.9
G-3693 11.5 0.0 5.0 5.2
G-3694 11.0 0.0 4.0 6.1
G-3695 10.5 0.0 2.5 4.0
G-3696 11.0 0.0 Not present 3.0
G-3697 9.5 0.0 1.0 2.8
G-3710 10.0 0.0 Not present 2.2
G-3711 10.0 0.0 Not present 3.0
G-3712 10.0 0.0 Not present 1.5
G-3713 10.0 0.0 Not present 2.0
G-3714 13.0 0.0 Not present 3.0
G-3715 13.0 0.0 Not present 3.0
G-3716 9.0 0.0 Not present 3.0
G-3717 9.0 0.0 4.0 7.0
G-3718 9.0 0.0 1.8 5.0
G-3719 9.0 0.0 1.8 4.1
G-3720 9.0 0.0 2.1 4.3
G-3721 10.0 0.0 6.5 8.5
G-3722 10.0 0.0 6.5 7.5
G-3723 8.0 0.0 3.1 5.8
G-3724 9.0 0.0 1.0 6.6
G-3725 6.0 0.0 Not present 0.5
G-3726 7.0 Poor data Poor data 4.9 P
G-3727 9.0 0.0 3.0 7.5
tudy
suring point is land surface referenced to National Geodetic Vertical not penetrate; HFC, high frequency cycle]
epth totop of HFC4
Depth to top of HFC3b
Depth to top of HFC3a
Depth to top of HFC2
Depth to top of HFC1
Depth to top of
Tamiami
11.8 12.9 18.3 29.8 41.4 55.0
19.3 21.2 22.8 35.0 DNP DNP
19.3 21.2 22.8 35.0 52.0 60.0
8.6 9.0 15.7 23.1 29.0 70.5
5.4 7.3 11.2 20.3 42.0 75.0?
12.0 12.9 14.4 24.8 32.0 DNP
10.7 13.3 15.1 27.1 34.8 DNP
11.5 13.9 15.4 26.9 35.5 DNP
12.1 13.7 17.4 31.3 42.8 DNP
11.0 14.2 16.7 25.3 DNP DNP
10.9 14.8 17.6 28.9 DNP DNP
11.5 17.3 21.1 30.9 DNP DNP
11.9 14.3 17.9 28.3 DNP DNP
10.6 12.1 14.9 25.9 DNP DNP
10.8 12.3 13.7 21.4 DNP DNP
9.4 12.0 16.2 25.9 DNP DNP
10.4 14.3 20.1 DNP DNP DNP
10.5 11.3 12.6 25.1 DNP DNP
12.4 13.1 14.2 24.5 31.5 DNP
9.7 11.3 16.7 26.7 DNP DNP
12.3 16.0 18.2 31.5 DNP DNP
15.0 16.2 20.0 30.3 DNP DNP
10.9 14.0 18.5 28.6 DNP DNP
11.8 18.4 21.8 33.5 DNP DNP
10.0 13.4 16.4 26.5 DNP DNP
9.2 11.8 16.6 28.5 DNP DNP
12.1 13.7 16.7 29.7 DNP DNP
14.5 15.2 17.2 26.9 DNP DNP
10.2 13.3 16.8 30.6 DNP DNP
14.3 15.5 17.1 DNP DNP DNP
12.8 15.5 17.5 DNP DNP DNP
11.4 17.3 21.1 DNP DNP DNP
10.5 13.0 15.6 24.5 38.0 DNP
6.2 9.5 14.3 24.0 DNP DNP
8.5 9.5 10.0 18.3 DNP DNP
6.6 7.7 13.2 21.3 DNP DNP
10.2 11.9 13.0 23.0 DNP DNP
7.8 10.4 12.2 21.7 DNP DNP
9.6 12.8 15.0 22.4 31.6 DNP
8.7 10.0 13.3 24.0 DNP DNP
9.5 13.6 17.2 25.2 DNP DNP
oor data 5.5 Poor data 8.4 DNP DNP
12.9 13.5 15.5 24.3 34.9 DNP
Geologic Framework 25
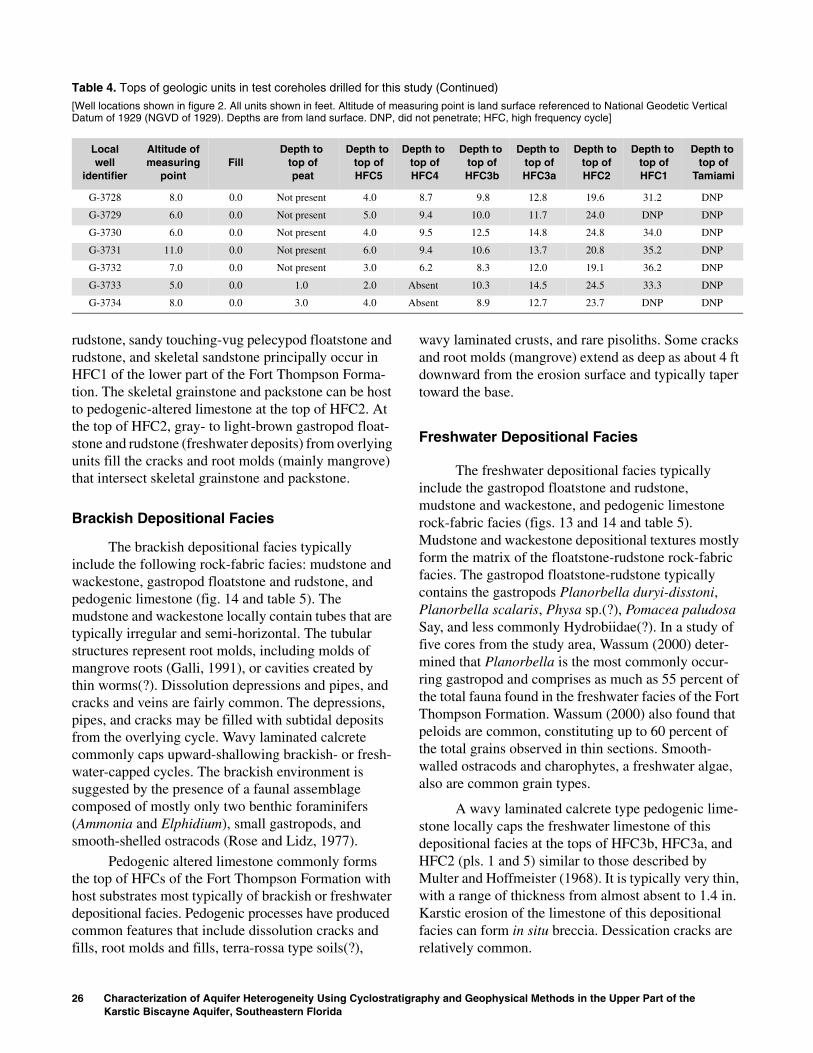
rudstone, sandy touching-vug pelecypod floatstone and rudstone, and skeletal sandstone principally occur in HFC1 of the lower part of the Fort Thompson Forma-tion. The skeletal grainstone and packstone can be host to pedogenic-altered limestone at the top of HFC2. At the top of HFC2, gray- to light-brown gastropod float-stone and rudstone (freshwater deposits) from overlying units fill the cracks and root molds (mainly mangrove) that intersect skeletal grainstone and packstone.
Brackish Depositional Facies
The brackish depositional facies typically include the following rock-fabric facies: mudstone and wackestone, gastropod floatstone and rudstone, and pedogenic limestone (fig. 14 and table 5). The mudstone and wackestone locally contain tubes that are typically irregular and semi-horizontal. The tubular structures represent root molds, including molds of mangrove roots (Galli, 1991), or cavities created by thin worms(?). Dissolution depressions and pipes, and cracks and veins are fairly common. The depressions, pipes, and cracks may be filled with subtidal deposits from the overlying cycle. Wavy laminated calcrete commonly caps upward-shallowing brackish- or fresh-water-capped cycles. The brackish environment is suggested by the presence of a faunal assemblage composed of mostly only two benthic foraminifers (Ammonia and Elphidium), small gastropods, and smooth-shelled ostracods (Rose and Lidz, 1977).
Pedogenic altered limestone commonly forms the top of HFCs of the Fort Thompson Formation with host substrates most typically of brackish or freshwater depositional facies. Pedogenic processes have produced common features that include dissolution cracks and fills, root molds and fills, terra-rossa type soils(?),
26 Characterization of Aquifer Heterogeneity Using CyclostratigKarstic Biscayne Aquifer, Southeastern Florida
wavy laminated crusts, and rare pisoliths. Some cracks and root molds (mangrove) extend as deep as about 4 ft downward from the erosion surface and typically taper toward the base.
Freshwater Depositional Facies
The freshwater depositional facies typically include the gastropod floatstone and rudstone, mudstone and wackestone, and pedogenic limestone rock-fabric facies (figs. 13 and 14 and table 5). Mudstone and wackestone depositional textures mostly form the matrix of the floatstone-rudstone rock-fabric facies. The gastropod floatstone-rudstone typically contains the gastropods Planorbella duryi-disstoni, Planorbella scalaris, Physa sp.(?), Pomacea paludosa Say, and less commonly Hydrobiidae(?). In a study of five cores from the study area, Wassum (2000) deter-mined that Planorbella is the most commonly occur-ring gastropod and comprises as much as 55 percent of the total fauna found in the freshwater facies of the Fort Thompson Formation. Wassum (2000) also found that peloids are common, constituting up to 60 percent of the total grains observed in thin sections. Smooth-walled ostracods and charophytes, a freshwater algae, also are common grain types.
A wavy laminated calcrete type pedogenic lime-stone locally caps the freshwater limestone of this depositional facies at the tops of HFC3b, HFC3a, and HFC2 (pls. 1 and 5) similar to those described by Multer and Hoffmeister (1968). It is typically very thin, with a range of thickness from almost absent to 1.4 in. Karstic erosion of the limestone of this depositional facies can form in situ breccia. Dessication cracks are relatively common.
G-3728 8.0 0.0 Not present 4.0 8.7 9.8 12.8 19.6 31.2 DNP
G-3729 6.0 0.0 Not present 5.0 9.4 10.0 11.7 24.0 DNP DNP
G-3730 6.0 0.0 Not present 4.0 9.5 12.5 14.8 24.8 34.0 DNP
G-3731 11.0 0.0 Not present 6.0 9.4 10.6 13.7 20.8 35.2 DNP
G-3732 7.0 0.0 Not present 3.0 6.2 8.3 12.0 19.1 36.2 DNP
G-3733 5.0 0.0 1.0 2.0 Absent 10.3 14.5 24.5 33.3 DNP
G-3734 8.0 0.0 3.0 4.0 Absent 8.9 12.7 23.7 DNP DNP
Table 4. Tops of geologic units in test coreholes drilled for this study (Continued)
[Well locations shown in figure 2. All units shown in feet. Altitude of measuring point is land surface referenced to National Geodetic Vertical Datum of 1929 (NGVD of 1929). Depths are from land surface. DNP, did not penetrate; HFC, high frequency cycle]
Localwell
identifier
Altitude of measuring
pointFill
Depth to top of peat
Depth to top of HFC5
Depth to top of HFC4
Depth to top of HFC3b
Depth to top of HFC3a
Depth to top of HFC2
Depth to top of HFC1
Depth to top of
Tamiami
raphy and Geophysical Methods in the Upper Part of the
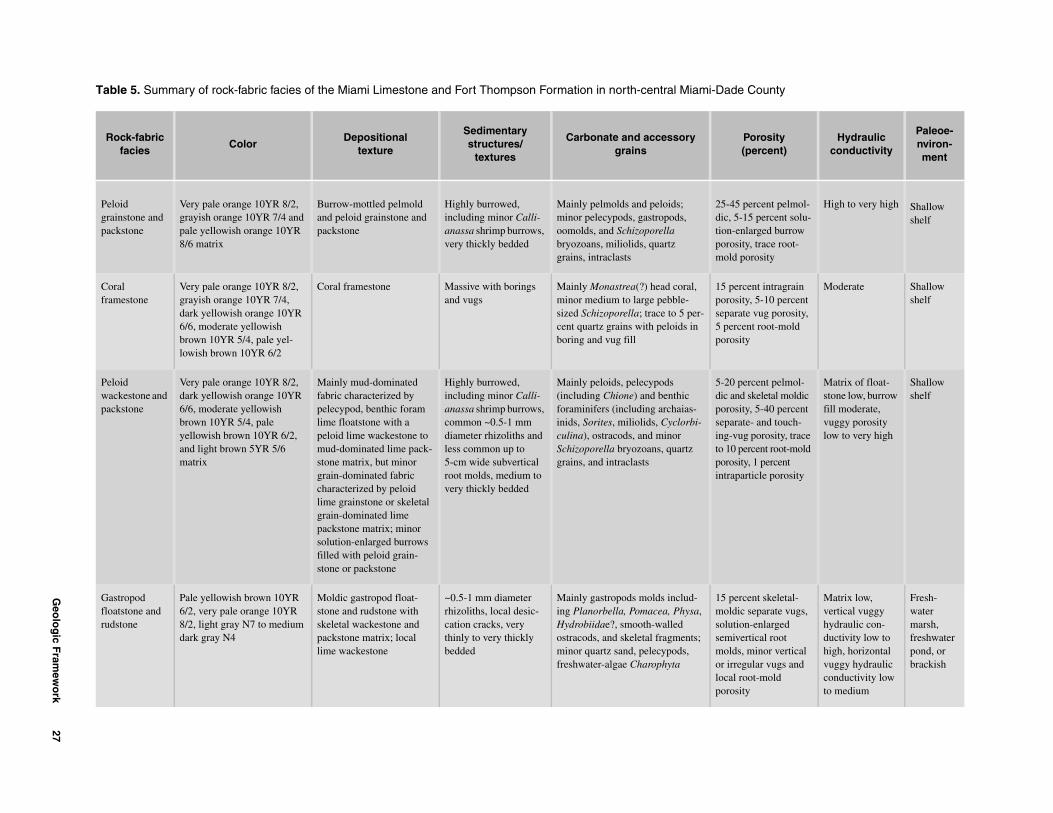
Geo
log
ic Fram
ewo
rk
27
ounty
rosityrcent)
Hydraulic conductivity
Paleoe-nviron-ment
cent pelmol-percent solu-ged burrow trace root-sity
High to very high Shallow shelf
t intragrain 5-10 percent ug porosity,
root-mold
Moderate Shallow shelf
ent pelmol-eletal moldic 5-40 percent and touch-orosity, trace ent root-mold percent
cle porosity
Matrix of float-stone low, burrow fill moderate, vuggy porosity low to very high
Shallow shelf
t skeletal-parate vugs, nlarged
cal root inor vertical ar vugs and -mold
Matrix low, vertical vuggy hydraulic con-ductivity low to high, horizontal vuggy hydraulic conductivity low to medium
Fresh-water marsh, freshwater pond, or brackish
Table 5. Summary of rock-fabric facies of the Miami Limestone and Fort Thompson Formation in north-central Miami-Dade C
Rock-fabricfacies
ColorDepositional
texture
Sedimentary structures/
textures
Carbonate and accessory grains
Po(pe
Peloid grainstone and packstone
Very pale orange 10YR 8/2, grayish orange 10YR 7/4 and pale yellowish orange 10YR 8/6 matrix
Burrow-mottled pelmold and peloid grainstone and packstone
Highly burrowed, including minor Calli-anassa shrimp burrows, very thickly bedded
Mainly pelmolds and peloids; minor pelecypods, gastropods, oomolds, and Schizoporella bryozoans, miliolids, quartz grains, intraclasts
25-45 perdic, 5-15 tion-enlarporosity, mold poro
Coral framestone
Very pale orange 10YR 8/2, grayish orange 10YR 7/4, dark yellowish orange 10YR 6/6, moderate yellowish brown 10YR 5/4, pale yel-lowish brown 10YR 6/2
Coral framestone Massive with borings and vugs
Mainly Monastrea(?) head coral, minor medium to large pebble-sized Schizoporella; trace to 5 per-cent quartz grains with peloids in boring and vug fill
15 percenporosity, separate v5 percentporosity
Peloid wackestone and packstone
Very pale orange 10YR 8/2, dark yellowish orange 10YR 6/6, moderate yellowish brown 10YR 5/4, pale yellowish brown 10YR 6/2, and light brown 5YR 5/6 matrix
Mainly mud-dominated fabric characterized by pelecypod, benthic foram lime floatstone with a peloid lime wackestone to mud-dominated lime pack-stone matrix, but minor grain-dominated fabric characterized by peloid lime grainstone or skeletal grain-dominated lime packstone matrix; minor solution-enlarged burrows filled with peloid grain-stone or packstone
Highly burrowed, including minor Calli-anassa shrimp burrows, common ~0.5-1 mm diameter rhizoliths and less common up to 5-cm wide subvertical root molds, medium to very thickly bedded
Mainly peloids, pelecypods (including Chione) and benthic foraminifers (including archaias-inids, Sorites, miliolids, Cyclorbi-culina), ostracods, and minor Schizoporella bryozoans, quartz grains, and intraclasts
5-20 percdic and skporosity, separate- ing-vug pto 10 percporosity, 1intraparti
Gastropod floatstone and rudstone
Pale yellowish brown 10YR 6/2, very pale orange 10YR 8/2, light gray N7 to medium dark gray N4
Moldic gastropod float-stone and rudstone with skeletal wackestone and packstone matrix; local lime wackestone
~0.5-1 mm diameter rhizoliths, local desic-cation cracks, very thinly to very thickly bedded
Mainly gastropods molds includ-ing Planorbella, Pomacea, Physa, Hydrobiidae?, smooth-walled ostracods, and skeletal fragments; minor quartz sand, pelecypods, freshwater-algae Charophyta
15 percenmoldic sesolution-esemivertimolds, mor irregullocal rootporosity
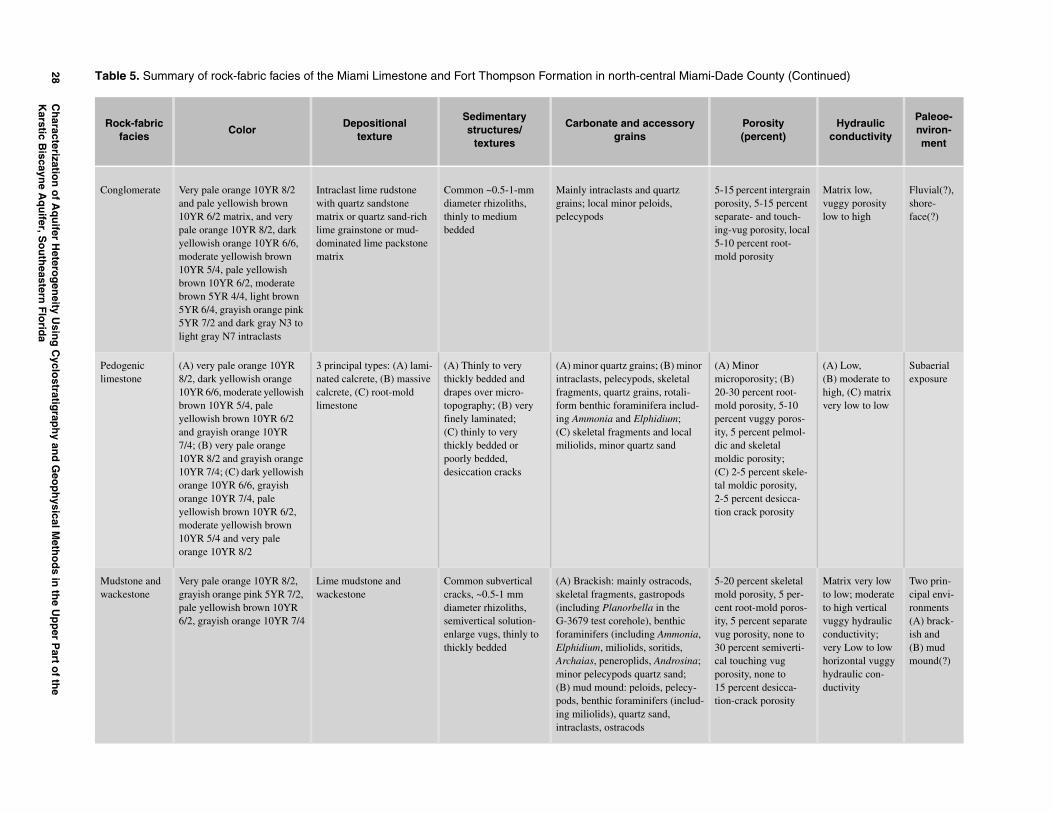
28C
haracterizatio
n o
f Aq
uifer H
eterog
eneity U
sing
Cyclo
stratigrap
hy an
d G
eop
hysical M
etho
ds in
the U
pp
er Part o
f the
Karstic B
iscayne A
qu
ifer, So
uth
eastern F
lorid
a
t intergrain 5 percent d touch-osity, local t root-ty
Matrix low, vuggy porosity low to high
Fluvial(?), shore-face(?)
ty; (B) nt root-ty, 5-10 gy poros-t pelmol-etal sity; ent skele-orosity, desicca-orosity
(A) Low, (B) moderate to high, (C) matrix very low to low
Subaerial exposure
t skeletal ty, 5 per-old poros-t separate , none to emiverti- vug ne to esicca-orosity
Matrix very low to low; moderate to high vertical vuggy hydraulic conductivity; very Low to low horizontal vuggy hydraulic con-ductivity
Two prin-cipal envi-ronments (A) brack-ish and (B) mud mound(?)
nty (Continued)
sityent)
Hydraulic conductivity
Paleoe-nviron-ment
Conglomerate Very pale orange 10YR 8/2 and pale yellowish brown 10YR 6/2 matrix, and very pale orange 10YR 8/2, dark yellowish orange 10YR 6/6, moderate yellowish brown 10YR 5/4, pale yellowish brown 10YR 6/2, moderate brown 5YR 4/4, light brown 5YR 6/4, grayish orange pink 5YR 7/2 and dark gray N3 to light gray N7 intraclasts
Intraclast lime rudstone with quartz sandstone matrix or quartz sand-rich lime grainstone or mud-dominated lime packstone matrix
Common ~0.5-1-mm diameter rhizoliths, thinly to medium bedded
Mainly intraclasts and quartz grains; local minor peloids, pelecypods
5-15 percenporosity, 5-1separate- aning-vug por5-10 percenmold porosi
Pedogenic limestone
(A) very pale orange 10YR 8/2, dark yellowish orange 10YR 6/6, moderate yellowish brown 10YR 5/4, pale yellowish brown 10YR 6/2 and grayish orange 10YR 7/4; (B) very pale orange 10YR 8/2 and grayish orange 10YR 7/4; (C) dark yellowish orange 10YR 6/6, grayish orange 10YR 7/4, pale yellowish brown 10YR 6/2, moderate yellowish brown 10YR 5/4 and very pale orange 10YR 8/2
3 principal types: (A) lami-nated calcrete, (B) massive calcrete, (C) root-mold limestone
(A) Thinly to very thickly bedded and drapes over micro-topography; (B) very finely laminated; (C) thinly to very thickly bedded or poorly bedded, desiccation cracks
(A) minor quartz grains; (B) minor intraclasts, pelecypods, skeletal fragments, quartz grains, rotali-form benthic foraminifera includ-ing Ammonia and Elphidium; (C) skeletal fragments and local miliolids, minor quartz sand
(A) Minor microporosi20-30 percemold porosipercent vugity, 5 percendic and skelmoldic poro(C) 2-5 perctal moldic p2-5 percent tion crack p
Mudstone and wackestone
Very pale orange 10YR 8/2, grayish orange pink 5YR 7/2, pale yellowish brown 10YR 6/2, grayish orange 10YR 7/4
Lime mudstone and wackestone
Common subvertical cracks, ~0.5-1 mm diameter rhizoliths, semivertical solution-enlarge vugs, thinly to thickly bedded
(A) Brackish: mainly ostracods, skeletal fragments, gastropods (including Planorbella in the G-3679 test corehole), benthic foraminifers (including Ammonia, Elphidium, miliolids, soritids, Archaias, peneroplids, Androsina; minor pelecypods quartz sand; (B) mud mound: peloids, pelecy-pods, benthic foraminifers (includ-ing miliolids), quartz sand, intraclasts, ostracods
5-20 percenmold porosicent root-mity, 5 percenvug porosity30 percent scal touchingporosity, no15 percent dtion-crack p
Table 5. Summary of rock-fabric facies of the Miami Limestone and Fort Thompson Formation in north-central Miami-Dade Cou
Rock-fabricfacies
ColorDepositional
texture
Sedimentary structures/
textures
Carbonate and accessory grains
Poro(perc

Geo
log
ic Fram
ewo
rk
29
cent skeletal rosity, ent intergrain trace to t pelmoldic 5-15 percent porosity,
intraparticle
Matrix moderate Shallow shelf
ent skeletal parate and vugs
Matrix medium, vugs medium to very high
Shallow shelf
cent moldic 10-20 per-grain poros-ng plane vug -20 percent
Matrix moder-ate, bedding plane vugs high to very high
Intertidal
cent moldic, ent inter-gular nd touching
Matrix moder-ate, irregular vugs low to very high
Shallow shelf
ounty (Continued)
rosityrcent)
Hydraulic conductivity
Paleoe-nviron-ment
Skeletal grainstone and packstone
Very pale orange 10YR 8/2, pale yellowish brown 10YR 6.2, grayish orange 10YR 7/4; light gray N7 to very light gray N8
Skeletal grainstone and packstone
Principally massive and highly burrowed, thickly to very thickly bedded
Mainly skeletal fragments, benthic foraminifers (including archaias-inids, soritids, miliolids, pener-oplids, Elphidium, Ammonia, Androsina, Amphistegina, rotaliforms), peloids, pelecypods (including Trachycardium, Anodontia), ostracods, gastro-pods, echinoids; minor quartz grains; trace red algae
15-30 permoldic po5-15 percporosity, 10 percenporosity, root-mold1 percent
Sandy skeletal grainstone and packstone
Very pale orange 10YR 8/2, very light gray N8
Sandy skeletal grainstone and packstone
Thickly to very thickly bedded
Mainly peloids, quartz sand, mollusks (including Chione, Modulus, Turritella, Codakia, Lucina, Lirophora, Pyrazisinus, Tagelus, Anomalocardia, Melongena, Lucinisca, Carditimera, Codakia, Cerithium), skeletal fragments
2-10 percmolds, setouching
Laminated peloid grain-stone and packstone
Very pale orange 10YR 8/2 Peloid grainstone and packstone
Thinly laminated to very thinly bedded
Mainly peloids; minor quartz grains, skeletal fragments, and benthic foraminifers (including miliolids, Elphidium, Androsina, rotaliforms), mollusk fragments
10-15 perporosity, cent interity, beddiporosity 5
Pelecypod floatstone and rudstone
Very pale orange 10YR 8/2, very light gray N8
Pelecypod floatstone and rudstone with skeletal wackestone, packstone or grainstone matrix
Thickly to very thickly bedded
Mainly mollusks (Chione, Turritella, Trachycardium, Bellucina, Diodora, Muricid, Brachidontes, Anomalocardia?) benthic foraminifers (including archaiasinids, peneroplids, miliolids, Parasorites, soritids, Amphistegina, Ammonia, Elphidium, Androsina, rotali-forms), peloids, ostracods; minor quartz grains; trace echinoids
10-25 per5-15 percgrain, irreseparate avugs
Table 5. Summary of rock-fabric facies of the Miami Limestone and Fort Thompson Formation in north-central Miami-Dade C
Rock-fabricfacies
ColorDepositional
texture
Sedimentary structures/
textures
Carbonate and accessory grains
Po(pe

30C
haracterizatio
n o
f Aq
uifer H
eterog
eneity U
sing
Cyclo
stratigrap
hy an
d G
eop
hysical M
etho
ds in
the U
pp
er Part o
f the
Karstic B
iscayne A
qu
ifer, So
uth
eastern F
lorid
a
ent skeletal Matrix medium Shallow shelf
ent skeletal rosity, 5-100 parate and
vugs
Matrix medium, vugs medium to very high
Shallow shelf
ent skeletal Matrix medium Shallow shelf
ent irregular nd touching
Matrix low, vugs moderate to very high
Shallow shelf (mud bank)
ent skeletal Matrix medium Shallow shelf
ounty (Continued)
rosityrcent)
Hydraulic conductivity
Paleoe-nviron-ment
Sandy pelecypod floatstone and rudstone
Very pale orange 10YR 8/2, very light gray N8
Pelecypod floatstone and rudstone with sandy wackestone or packstone matrix
Thickly to very thickly bedded
Mainly peloids, quartz sand, pelecypods, skeletal fragments, benthic foraminifers
5-20 percmolds,
Touching-vug pelecypod floatstone and rudstone
Very pale orange 10YR 8/2, very light gray N8
Pelecypod floatstone and rudstone with peloid and skeletal fragment wackestone and packstone matrix
Medium to very thickly bedded
Mainly peloids, mollusks (including Chione, Modulus, Turritella, Codakia, Lucina, Pecten, Diplodonta, Strombus?, Pleuromeris, Carditimera, Anadara, Glycymeris, Anodonita, Cardium, Dosinia, Nucula, Turbo, Glycymeris, Pecten?), skeletal fragments, benthic foraminifers (including soritids, archaiasinids, miliolids, Ammonia, Parasorites, Amphistegina, Elphidium, peneroplids, rotaliforms, Androsina), ostracods, echinoids; trace Porites? coral
2-25 percmoldic popercent setouching
Sandy touching-vug pelecypod floatstone and rudstone
Pelecypod floatstone and rudstone with
Thickly to very thickly bedded
Mainly peloids, quartz sand, mollusks (including Chione, Cerithium, Trachycardium, Modulus, Turritella, Lucinisca), skeletal fragments
5-20 percmolds,
Vuggy wackestone and packstone
Very pale orange 10YR 8/2 Peloid wackestone and packstone
Thickly to very thickly bedded
Mainly peloids, benthic foramini-fers (including miliolids), gastro-pods; minor to abundant quartz grains
5-25 percseparate avugs
Quartz sandstone and skeletal sandstone
Very pale orange 10YR 8/2, very light gray N8
Skeletal sandstone Thickly to very thickly bedded
Mainly quartz sand, peloids, pelecypods, skeletal fragments, gastropods
2-10 percmolds
Table 5. Summary of rock-fabric facies of the Miami Limestone and Fort Thompson Formation in north-central Miami-Dade C
Rock-fabricfacies
ColorDepositional
texture
Sedimentary structures/
textures
Carbonate and accessory grains
Po(pe
The common micrite-rich mudstone and wacke-stone rock-fabric facies comprising these depositional facies result in relatively low permeability. The dessi-cation cracks and root molds may be enlarged by mete-oric dissolution, enhancing the vertical permeability of the limestone of these depositional facies, and provid-ing small conduits for vertical passage of ground water through the limestone of these depositional facies. However, touching vugs that are oriented with a preferred horizontal orientation are not common, so the overall horizontal permeability of the limestone of these freshwater facies is relatively low.
High-Frequency Cycles
Two types of HFCs are present in the upper part of the Biscayne aquifer in the study area (fig. 10). One is an upward-shallowing brackish- or freshwater-capped cycle, composed of a succession of textures that mostly decrease upward in grain size, mainly shallows upward in terms of water depth, and is capped by a brackish or freshwater depositional facies (fig. 14). Upward shallowing brackish- or freshwater-capped cycles are exclusive to the Fort Thompson Formation. Comprising the Miami Limestone, the second type of HFC, a subtidal cycle, is formed by vertical aggrada-tion of shallow-shelf, peloidal, highly burrowed, marine sediments (fig. 13). Depositional environments of the Miami Limestone are discussed in more detail by Hoffmeister and others (1967), Perkins (1977), and Evans (1984). A type of subtidal cycle is under investi-gation in the lower part of the Fort Thompson Forma-tion. Cycle boundaries are abrupt, and generally upper boundaries have a pedogenic-limestone cap. A marine flooding surface occurs at or near the base of the HFCs (figs. 13 and 14). Cycle thicknesses may range up to about 20 ft in the lower part of the Fort Thompson Formation. Cycle durations are of about 10,000 to 120,000 years based on sediment ages (Broeker and Thurber, 1965; Osmond and others, 1965; Mitterer, 1975, Multer and others, 2002). The HFCs of the upper part of the Fort Thompson Formation and Miami Lime-stone may correspond to the fourth- and fifth-order Milankovitch cycles as defined by Goldhammer and others (1987).
Upward-Shallowing Brackish- or Freshwater-Capped Cycles
The upward-shallowing brackish- or freshwater-capped cycles in the upper part of the Fort Thompson Formation are similar to the idealized stratigraphic sequence that Enos (1989) described for the Holocene sediments of Florida Bay. In ascending order, the conceptual upward-shallowing brackish- or freshwater-capped cycle of the upper part of the Fort Thompson Formation consists of: (1) molluscan-rich rudstones and floatstones that can have abundant touching skele-tal molds and irregular vugs (the lower boundary of these facies forms a marine flooding surface that over-lies the freshwater marsh or pond deposit); (2) skeletal grainstone and packstone with abundant moldic porosity; (3) low-permeability brackish lime mudstone and wackestone that can contain the benthic foraminifera Ammonia and Elphidium (Rose and Lidz, 1977), ostra-cods, and gastropods; (4) a freshwater marsh or pond deposit containing smooth-walled ostracods and pulmonate gastropods, a low-permeability matrix, and mostly “nontouching” fossil molds; and (5) a calcrete unit that forms the upper bounding surface of the cycle (fig. 14).
The upward-shallowing brackish- or freshwater-capped cycles are typically characterized by shallow-shelf depositional environments in the lower part and grade upward to brackish or freshwater facies. All accommodation was filled during deposition of the shallowing-upward brackish- or freshwater-capped cycles, which are considered regressive. The presence of a pedogenic limestone cycle cap is indicative of subaerial exposure and a relative fall in sea level, punctuating the end of cycle development.
Three shallowing-upward brackish- or freshwater-capped HFCs are recognized in the upper part of the Fort Thompson Formation (fig. 10): HFC3b, HFC3a, and the upper part of HFC2. Correlation of these HFCs to the marine units of Perkins (1977) is based on simi-larities of lithologies he described, and his mapping of the paleotopography of the lower bounding surface of the marine units. Perkins (1977) delineated three marine units or “Q units” separated by regional discon-tinuity surfaces within the Fort Thompson in southern Florida (fig. 10). Only four test coreholes drilled during the course of this study fully penetrated the Q1 unit of Perkins (fig. 2; G-3671, G-3673, G-3674, and G-3675).
Geologic Framework 31
In a study throughout Miami-Dade County, Galli (1991) defined the Fort Thompson Formation as a single depositional sequence bounded below and above by inconformities that correspond to the contacts between the Tamiami and Fort Thompson Formations and between the Fort Thompson Formation and Miami Limestone, respectively. Galli (1991, fig. 6) dissected this depositional sequence into seven parasequences (fig. 10) that thicken toward the northern boundary of Miami-Dade County and thin to the south. To the south, Galli (1991) shows that there is onlap of the oldest parasequences onto an unconformity at the top of the Tamiami Formation with the top of the Tamiami Formation increasing in elevation to the west and south.
Subtidal Cycles
The Miami Limestone is composed of two subtidal cycles, which typically are composed of shallow-shelf depositional facies that have an abrupt subaerial erosion surface at the top capped by a pedogenic limestone (fig. 13). In general, the subtidal cycles are characterized by a relatively homogeneous succession of shallow-shelf deposits. The sediments contained in the two Miami Limestone subtidal cycles correspond to the bryozoan facies of the Miami Lime-stone as designated by Hoffmeister and others (1967). They described the sediments of this facies as composed of pellets, ooids, skeletal sands, and bryozo-ans, and interpreted the environment for its deposition as a marine shelf lagoon. Later, both Perkins (1977) and Evans (1984) stated that the bryozoan facies was deposited on an open-marine platform. Herein, HFC4 of the Miami Limestone mostly corresponds to fora-miniferal biofacies 5 and HFC5 mostly to foraminiferal biofacies 4, which are both interpreted to represent shallow-shelf depositional environments of normal to mildly hypersaline conditions (figs. 11 and 12 and tables 2 and 3). The base of HFC4 can consist of a freshwater limestone, also recognized by Halley and Evans (1983), that represents development of a fresh-water marsh during initial transgression of the under-lying exposure surface at the top of HFC3b.
The subtidal cycles are only partially developed because accommodation was not completely filled prior to subaerial erosion. Their occurrence suggests that the increase in accommodation outpaced sediment aggradation because of the absence of any peritidal
32 Characterization of Aquifer Heterogeneity Using CyclostratigKarstic Biscayne Aquifer, Southeastern Florida
depositional facies. Deposition of the cycles was followed by a prolonged period of subaerial exposure, based on the intensity of subaerial erosion of the upper boundary between HFC4 and HFC5, and the ages of the sediments in HFC4 and HFC5 (Broeker and Thurber, 1965; Osmond and others, 1965; Mitterer, 1975; Cunningham, 2004). Subtidal cycles also are present in the lower part of the Fort Thompson Forma-tion; however, characterizing these cycles is beyond the scope of this study.
The lower subtidal cycle (HFC4) and the upper subtidal cycle (HFC5) of the Miami Limestone are respectively equivalent to the Q4 and Q5 units of Perkins (1977) (fig. 10). HFC4 and HFC5 both contain the miliolid, bryozoan, pellet packstone and grainstone lithologic facies of Perkins (1977). The five marine units or “Q units” of Perkins (1977) were the first recognized unconformity-bound, time-stratigraphic units within the Miami Limestone and Fort Thompson Formation of southernmost peninsular Florida. Figure 10 shows the relation of the Q units to the HFCs of this study.
CHARACTERIZATION OF CYCLOSTRATI-GRAPHY, POROSITY, AND PERMEABILITY USING GROUND-PENETRATING RADAR
Interpreted GPR profiles were integrated with test corehole data to construct maps showing the top of HFC4 (figs. 15-17). The upper surface of the HFC4 cycle is considered important because it is the approxi-mate top of the semiconfining unit that extends across the base of the Miami Limestone and the top of the Fort Thompson Formation. A GPR profile for a single site along Krome Avenue (fig. 2) is used herein to illustrate how GPR was used to characterize the upper part of the Biscayne aquifer. The Krome Avenue GPR site is located about 8 mi south of the C-4 Canal and along a flat unpaved road that is parallel to and about 30 ft west of Krome Avenue (fig. 2). Additional information on the GPR investigation of the Krome Avenue site, as well as results of a study of a GPR site in ENP that investigates the characterization of porosity and perme-ability within the limestone of the Biscayne aquifer, can be found in Cunningham (2004).
raphy and Geophysical Methods in the Upper Part of the
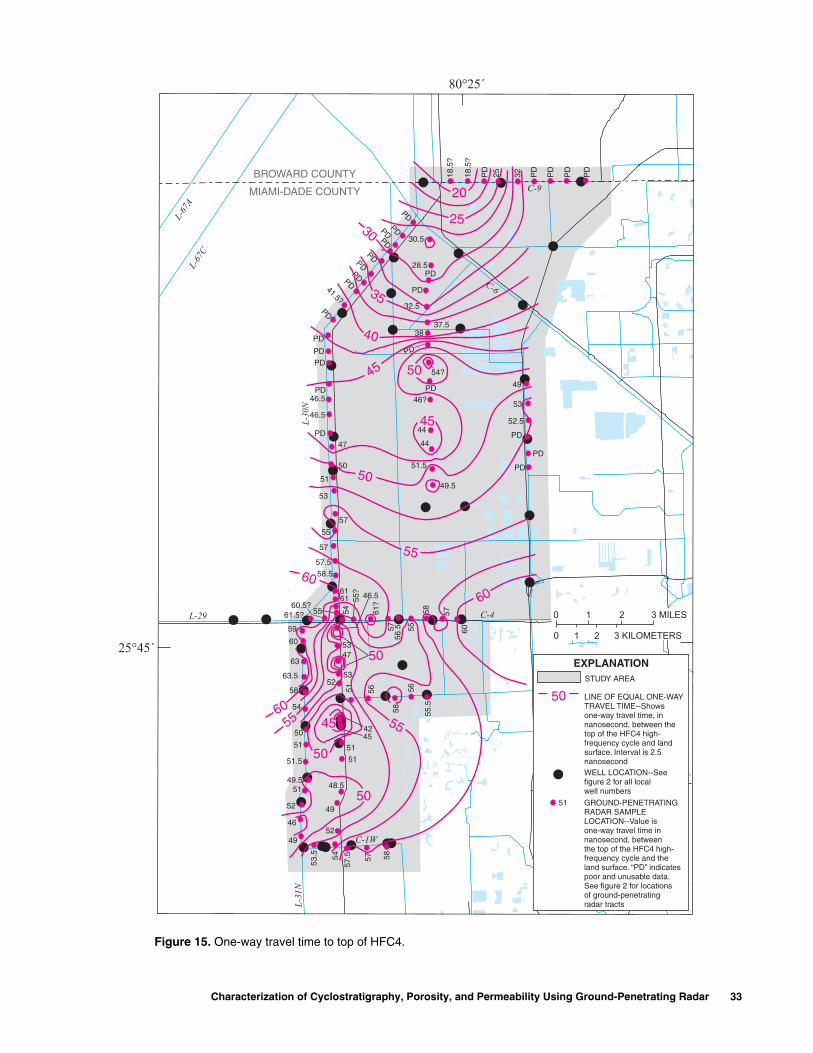
41.5?
PDPD
PDPDPD
PD
PDPD
PD
PD
3
P
PD
PD
PDPD
46.5
46.5
47
50
51
53
57
55
57
57.558.5
6161
5560.5?
61.5?
59
60
63
63.5
46.5
5347
5352
5455
?
61?
58
54
50
51
51.5
49.551
52
46
49
4245
51
51
48.5
49
52
51 56
58
53.5 54
57.5 57 58
5756
.5
C-1W
L-3
0N
L-67
AL-
67C
L-29
L-3
1N
25°45´
30
40
35
545
50
5
55
50
50
60
6055
50
45
BROWARD COUNTY
MIAMI-DADE COUNTY
Figure 15. One-way travel time to top of HFC4.
Characterization of Cyclostratigraphy, P
18.5
?
18.5
?
PD
25 32 PD
PD
PD
PD
30.5
28.5PD
PD
2.5
37.538
D
54?
PD46?
44
44
51.5
49.5
49
53
52.5
PD
PD
PD
56
55.5
55
58 57
60
C-4
C-6
C-9
80°25´
0
0
3 MILES
3 KILOMETERS
1 2
1 2
LINE OF EQUAL ONE-WAYTRAVEL TIME--Showsone-way travel time, innanosecond, between thetop of the HFC4 high-frequency cycle and landsurface. Interval is 2.5nanosecond
51 GROUND-PENETRATINGRADAR SAMPLELOCATION--Value isone-way travel time innanosecond, betweenthe top of the HFC4 high-frequency cycle and theland surface. “PD” indicatespoor and unusable data.See figure 2 for locationsof ground-penetratingradar tracts
WELL LOCATION--Seefigure 2 for all localwell numbers
EXPLANATIONSTUDY AREA
50
25
20
0
45
5
60
orosity, and Permeability Using Ground-Penetrating Radar 33

Figure16. Electromagnetic-wave velocity betwe
34 Characterization of Aquifer Heterogeneity Using CyclostratigKarstic Biscayne Aquifer, Southeastern Florida
en land surface and top of HFC4.
raphy and Geophysical Methods in the Upper Part of the
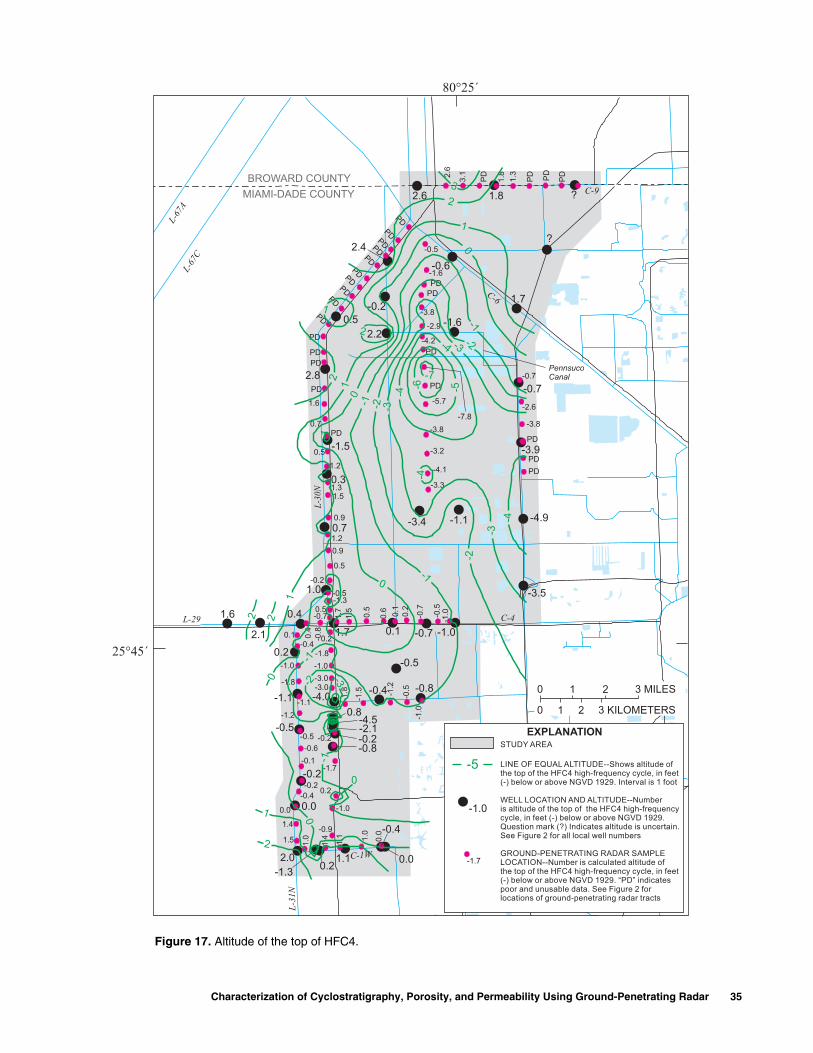
25°45´
BROWARD COUNTY
MIAMI-DADE COUNTY
2.4
0.5
2.8
-1.5
-0.2
2.2
0.3
0.7
1.0
0.4
2.1
1.6
1.7 0.1
-00.2
-1.1
-0.5
-0.2
0.0
2.0
-1.30.2
1.1
-0.4
0.
-4.0-0.4
0.8
-2.1-4.5
-0.2-0.8
PD
PD
PD
PD
PD
PD
PD
PD
PD
PD
PD
1.6
PD
PD
PD
0.7PD
0.5
1.2
1.31.5
0.9
1.2
0.9
0.5
-0.2
-0.5-1.3
0.5-0.7
0.1-0.4
-1.0
-1.8
-1.1
-1.2
-0.5
-0.6
-0.1
-0.2
-0.4
0.0
1.4
1.5 1.0
1.4 1.1 1.0
0.0
0.2
-1.8
-1.0
-3.0-3.0
-0.9
-1.0
0.2
-1.7
-0.2
-1.8
-1.5 -1
.2
0.4
-0.8
1.7
1.5 0.5
0.6 0.1
2
1
01
1
-1
-1-2
-30
2 2
2
1
-1 -2 -3-4
-12
0
0
0
C-1W
L-67
AL-
67C
L-29
L-3
0N
L-3
1N
Figure 17. Altitude of the top of HFC4.
Characterization of Cyclostratigraphy, P
80°25´
1.8 ?2.6
?
-0.6
-1.6
1.7
-0.7
-3.9
-4.9
-3.5
-1.1-3.4
-0.7 -1.0
.5
0
-0.8
2.6
3.1
PD
1.8
1.3
PD
PD
PD
-0.7
-2.6
-3.8
PD
PD
PD
-0.5
-1.6
PD
PD
-3.8
PD
-7.8
PD
-2.9
-4.2
-5.7
-3.8
-3.2
-4.1
-3.3
-0.5
-1.0
0.2
-0.7
-0.5
-1.0
0
1
-1-2-3-4
2
3
-4
-3
-2
-1
-4
-5-6
-7
LINE OF EQUAL ALTITUDE--Shows altitude ofthe top of the HFC4 high-frequency cycle, in feet(-) below or above NGVD 1929. Interval is 1 foot
WELL LOCATION AND ALTITUDE--Numberis altitude of the top of the HFC4 high-frequencycycle, in feet (-) below or above NGVD 1929.Question mark (?) Indicates altitude is uncertain.See Figure 2 for all local well numbers
GROUND-PENETRATING RADAR SAMPLELOCATION--Number is calculated altitude ofthe top of the HFC4 high-frequency cycle, in feet(-) below or above NGVD 1929. “PD” indicatespoor and unusable data. See Figure 2 forlocations of ground-penetrating radar tracts
-5
C-4
C-6
C-9
-1.0
-1.7
0
0
3 MILES
3 KILOMETERS
1 2
1 2
EXPLANATIONSTUDY AREA
PennsucoCanal
orosity, and Permeability Using Ground-Penetrating Radar 35
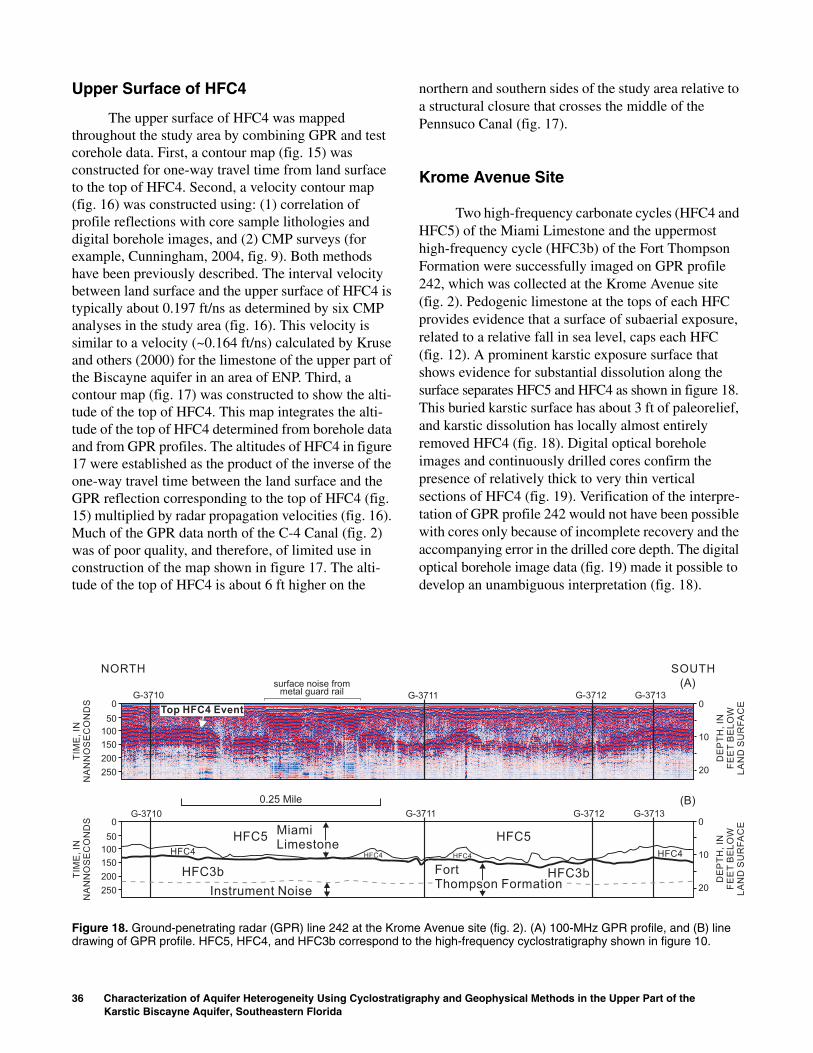
Upper Surface of HFC4
The upper surface of HFC4 was mapped throughout the study area by combining GPR and test corehole data. First, a contour map (fig. 15) was constructed for one-way travel time from land surface to the top of HFC4. Second, a velocity contour map (fig. 16) was constructed using: (1) correlation of profile reflections with core sample lithologies and digital borehole images, and (2) CMP surveys (for example, Cunningham, 2004, fig. 9). Both methods have been previously described. The interval velocity between land surface and the upper surface of HFC4 is typically about 0.197 ft/ns as determined by six CMP analyses in the study area (fig. 16). This velocity is similar to a velocity (~0.164 ft/ns) calculated by Kruse and others (2000) for the limestone of the upper part of the Biscayne aquifer in an area of ENP. Third, a contour map (fig. 17) was constructed to show the alti-tude of the top of HFC4. This map integrates the alti-tude of the top of HFC4 determined from borehole data and from GPR profiles. The altitudes of HFC4 in figure 17 were established as the product of the inverse of the one-way travel time between the land surface and the GPR reflection corresponding to the top of HFC4 (fig. 15) multiplied by radar propagation velocities (fig. 16). Much of the GPR data north of the C-4 Canal (fig. 2) was of poor quality, and therefore, of limited use in construction of the map shown in figure 17. The alti-tude of the top of HFC4 is about 6 ft higher on the
36 Characterization of Aquifer Heterogeneity Using CyclostratigKarstic Biscayne Aquifer, Southeastern Florida
G-3710
NORTH
G-3710 G
TIM
E,
INN
AN
NO
SE
CO
ND
ST
IME
,IN
NA
NN
OS
EC
ON
DS
HFC5
HFC3b
HFC4HFC4100
150
250
50
0
200
100
150
250
50
0
200
Instrument Noise
0.25 Mile
MiamiLimestone
surface noise frommetal guard rail
Top HFC4 Event
Figure 18. Ground-penetrating radar (GPR) line 242 at the Kromdrawing of GPR profile. HFC5, HFC4, and HFC3b correspond to
northern and southern sides of the study area relative to a structural closure that crosses the middle of the Pennsuco Canal (fig. 17).
Krome Avenue Site
Two high-frequency carbonate cycles (HFC4 and HFC5) of the Miami Limestone and the uppermost high-frequency cycle (HFC3b) of the Fort Thompson Formation were successfully imaged on GPR profile 242, which was collected at the Krome Avenue site (fig. 2). Pedogenic limestone at the tops of each HFC provides evidence that a surface of subaerial exposure, related to a relative fall in sea level, caps each HFC (fig. 12). A prominent karstic exposure surface that shows evidence for substantial dissolution along the surface separates HFC5 and HFC4 as shown in figure 18. This buried karstic surface has about 3 ft of paleorelief, and karstic dissolution has locally almost entirely removed HFC4 (fig. 18). Digital optical borehole images and continuously drilled cores confirm the presence of relatively thick to very thin vertical sections of HFC4 (fig. 19). Verification of the interpre-tation of GPR profile 242 would not have been possible with cores only because of incomplete recovery and the accompanying error in the drilled core depth. The digital optical borehole image data (fig. 19) made it possible to develop an unambiguous interpretation (fig. 18).
raphy and Geophysical Methods in the Upper Part of the
SOUTH
G-3711
-3711
G-3712
G-3712
G-3713
G-3713
DE
PT
H,
INF
EE
TB
EL
OW
LA
ND
SU
RF
AC
E
DE
PT
H,
INF
EE
TB
EL
OW
LA
ND
SU
RF
AC
E
HFC3b
HFC5
HFC4HFC4
FortThompson Formation
0
20
10
(A)
(B)
0
20
10
e Avenue site (fig. 2). (A) 100-MHz GPR profile, and (B) line the high-frequency cyclostratigraphy shown in figure 10.
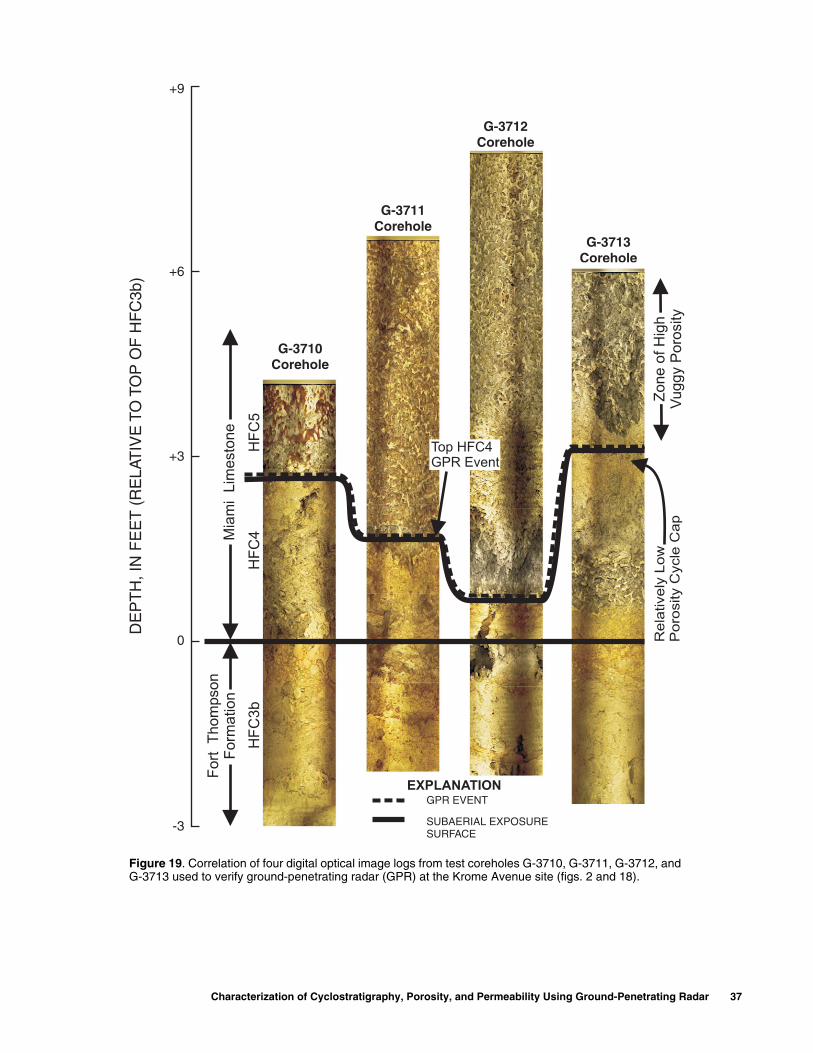
0
+3
+6
-3
Mia
mi
Lim
esto
ne
Fort
Thom
pson
Form
ation
G-3710Corehole
G-37Coreh
HF
C5
HF
C4
HF
C3b
DE
PT
H, I
N F
EE
T (
RE
LAT
IVE
TOTO
P O
F H
FC
3b)
+9
Figure 19. Correlation of four digital optical image logG-3713 used to verify ground-penetrating radar (GPR
Characterization of Cyclostratigraphy, P
GPR EVENT
SUBAERIAL EXPOSURESURFACE
11ole
G-3712Corehole
G-3713Corehole
Rela
tively
Low
Poro
sity
Cycle
Cap
Top HFC4GPR Event
EXPLANATION
Zone
ofH
igh
Vuggy
Poro
sity
s from test coreholes G-3710, G-3711, G-3712, and ) at the Krome Avenue site (figs. 2 and 18).
orosity, and Permeability Using Ground-Penetrating Radar 37
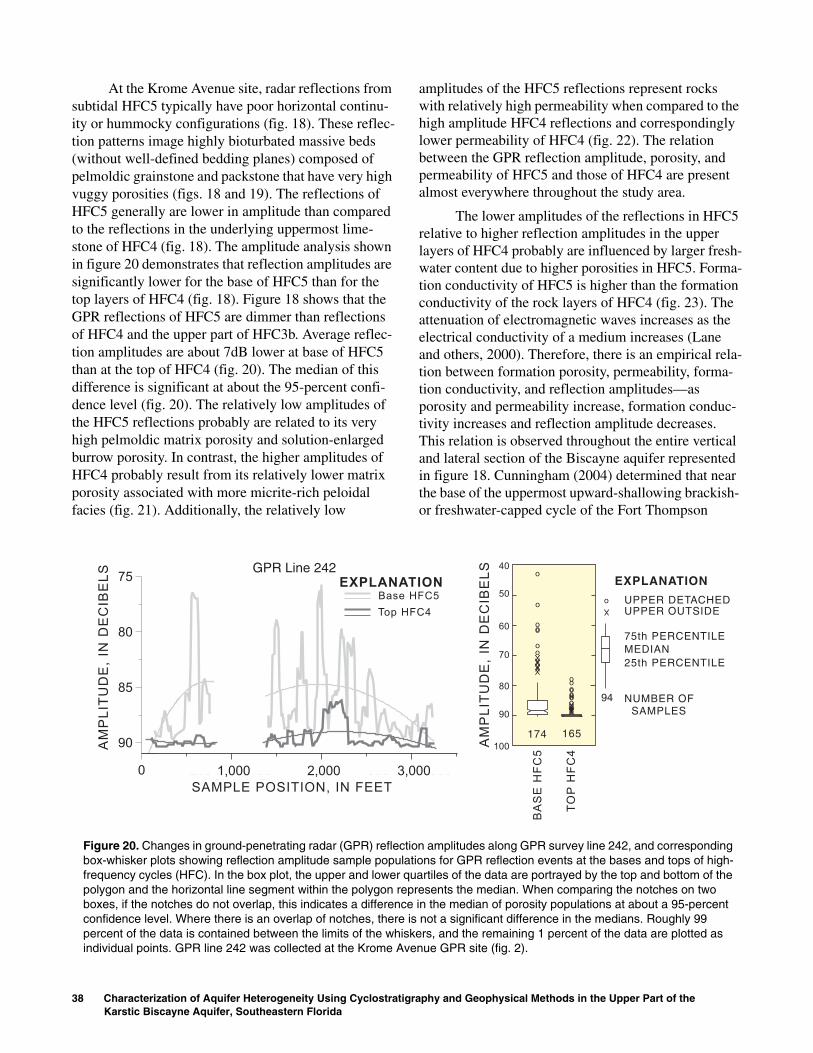
At the Krome Avenue site, radar reflections from subtidal HFC5 typically have poor horizontal continu-ity or hummocky configurations (fig. 18). These reflec-tion patterns image highly bioturbated massive beds (without well-defined bedding planes) composed of pelmoldic grainstone and packstone that have very high vuggy porosities (figs. 18 and 19). The reflections of HFC5 generally are lower in amplitude than compared to the reflections in the underlying uppermost lime-stone of HFC4 (fig. 18). The amplitude analysis shown in figure 20 demonstrates that reflection amplitudes are significantly lower for the base of HFC5 than for the top layers of HFC4 (fig. 18). Figure 18 shows that the GPR reflections of HFC5 are dimmer than reflections of HFC4 and the upper part of HFC3b. Average reflec-tion amplitudes are about 7dB lower at base of HFC5 than at the top of HFC4 (fig. 20). The median of this difference is significant at about the 95-percent confi-dence level (fig. 20). The relatively low amplitudes of the HFC5 reflections probably are related to its very high pelmoldic matrix porosity and solution-enlarged burrow porosity. In contrast, the higher amplitudes of HFC4 probably result from its relatively lower matrix porosity associated with more micrite-rich peloidal facies (fig. 21). Additionally, the relatively low
38 Characterization of Aquifer Heterogeneity Using CyclostratigKarstic Biscayne Aquifer, Southeastern Florida
0 200 400 600 800Sample Position (meters)
90
85
80
75
Am
plitu
de
(dB
)
GPR Line 242EXPLANA
Base
Top H
GPR Line 242
SAMPLE POSITION, IN FEET
3,2,0001,000
AM
PL
ITU
DE
,IN
DE
CIB
EL
S
Figure 20. Changes in ground-penetrating radar (GPR) reflectbox-whisker plots showing reflection amplitude sample populafrequency cycles (HFC). In the box plot, the upper and lower qpolygon and the horizontal line segment within the polygon reboxes, if the notches do not overlap, this indicates a differenceconfidence level. Where there is an overlap of notches, there percent of the data is contained between the limits of the whisindividual points. GPR line 242 was collected at the Krome Av
amplitudes of the HFC5 reflections represent rocks with relatively high permeability when compared to the high amplitude HFC4 reflections and correspondingly lower permeability of HFC4 (fig. 22). The relation between the GPR reflection amplitude, porosity, and permeability of HFC5 and those of HFC4 are present almost everywhere throughout the study area.
The lower amplitudes of the reflections in HFC5 relative to higher reflection amplitudes in the upper layers of HFC4 probably are influenced by larger fresh-water content due to higher porosities in HFC5. Forma-tion conductivity of HFC5 is higher than the formation conductivity of the rock layers of HFC4 (fig. 23). The attenuation of electromagnetic waves increases as the electrical conductivity of a medium increases (Lane and others, 2000). Therefore, there is an empirical rela-tion between formation porosity, permeability, forma-tion conductivity, and reflection amplitudes—as porosity and permeability increase, formation conduc-tivity increases and reflection amplitude decreases. This relation is observed throughout the entire vertical and lateral section of the Biscayne aquifer represented in figure 18. Cunningham (2004) determined that near the base of the uppermost upward-shallowing brackish- or freshwater-capped cycle of the Fort Thompson
raphy and Geophysical Methods in the Upper Part of the
X
X
X
X
X
X
X
X
X
X
o
oooooooo
o
o
ooo
o
o
X
X
174 165100
80
60
40
50
70
90
25th PERCENTILEMEDIAN75th PERCENTILE
UPPER OUTSIDE
NUMBER OFSAMPLES
EXPLANATION
UPPER DETACHEDX
94
o
AM
PL
ITU
DE
,IN
DE
CIB
EL
S
BA
SE
HF
C5
TO
PH
FC
4
1000
TIONHFC5
FC4
000
ion amplitudes along GPR survey line 242, and corresponding tions for GPR reflection events at the bases and tops of high-uartiles of the data are portrayed by the top and bottom of the presents the median. When comparing the notches on two in the median of porosity populations at about a 95-percent
is not a significant difference in the medians. Roughly 99 kers, and the remaining 1 percent of the data are plotted as enue GPR site (fig. 2).
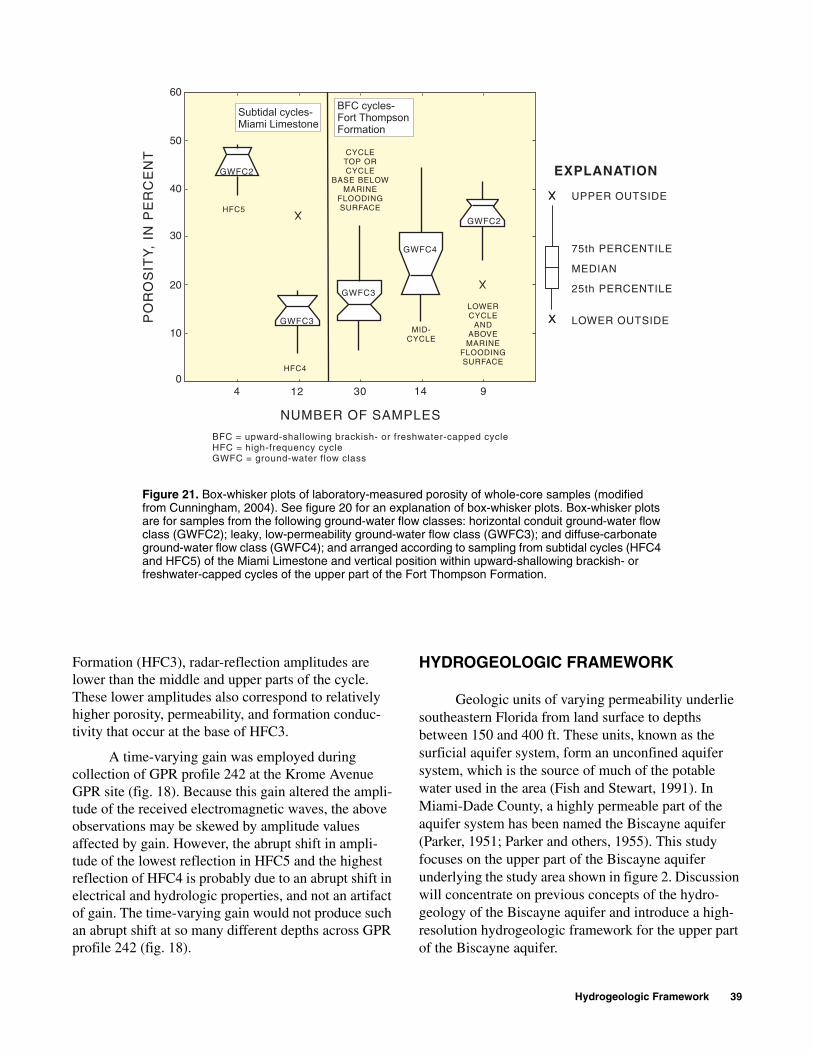
NUMBER OF SAMPLES
1430124 9
40
60
50
30
10
20
0
75th PERCENTILE
MEDIAN
25th PERCENTILE
LOWER OUTSIDE
UPPER OUTSIDE
X
X
X
X
PO
RO
SIT
Y,
INP
ER
CE
NT
LOWERCYCLE
ANDABOVE
MARINEFLOODINGSURFACE
MID-CYCLE
CYCLETOP ORCYCLE
BASE BELOWMARINE
FLOODINGSURFACE
HFC4
HFC5
GWFC2
GWFC2
GWFC3
GWFC3
GWFC4
EXPLANATION
X
BFC = upward-shallowing brackish- or freshwater-capped cycleHFC = high-frequency cycleGWFC = ground-water flow class
X
Subtidal cycles-Miami Limestone
BFC cycles-Fort ThompsonFormation
Figure 21. Box-whisker plots of laboratory-measured porosity of whole-core samples (modified from Cunningham, 2004). See figure 20 for an explanation of box-whisker plots. Box-whisker plots are for samples from the following ground-water flow classes: horizontal conduit ground-water flow class (GWFC2); leaky, low-permeability ground-water flow class (GWFC3); and diffuse-carbonate ground-water flow class (GWFC4); and arranged according to sampling from subtidal cycles (HFC4 and HFC5) of the Miami Limestone and vertical position within upward-shallowing brackish- or freshwater-capped cycles of the upper part of the Fort Thompson Formation.
Formation (HFC3), radar-reflection amplitudes are lower than the middle and upper parts of the cycle. These lower amplitudes also correspond to relatively higher porosity, permeability, and formation conduc-tivity that occur at the base of HFC3.
A time-varying gain was employed during collection of GPR profile 242 at the Krome Avenue GPR site (fig. 18). Because this gain altered the ampli-tude of the received electromagnetic waves, the above observations may be skewed by amplitude values affected by gain. However, the abrupt shift in ampli-tude of the lowest reflection in HFC5 and the highest reflection of HFC4 is probably due to an abrupt shift in electrical and hydrologic properties, and not an artifact of gain. The time-varying gain would not produce such an abrupt shift at so many different depths across GPR profile 242 (fig. 18).
HYDROGEOLOGIC FRAMEWORK
Geologic units of varying permeability underlie southeastern Florida from land surface to depths between 150 and 400 ft. These units, known as the surficial aquifer system, form an unconfined aquifer system, which is the source of much of the potable water used in the area (Fish and Stewart, 1991). In Miami-Dade County, a highly permeable part of the aquifer system has been named the Biscayne aquifer (Parker, 1951; Parker and others, 1955). This study focuses on the upper part of the Biscayne aquifer underlying the study area shown in figure 2. Discussion will concentrate on previous concepts of the hydro-geology of the Biscayne aquifer and introduce a high-resolution hydrogeologic framework for the upper part of the Biscayne aquifer.
Hydrogeologic Framework 39
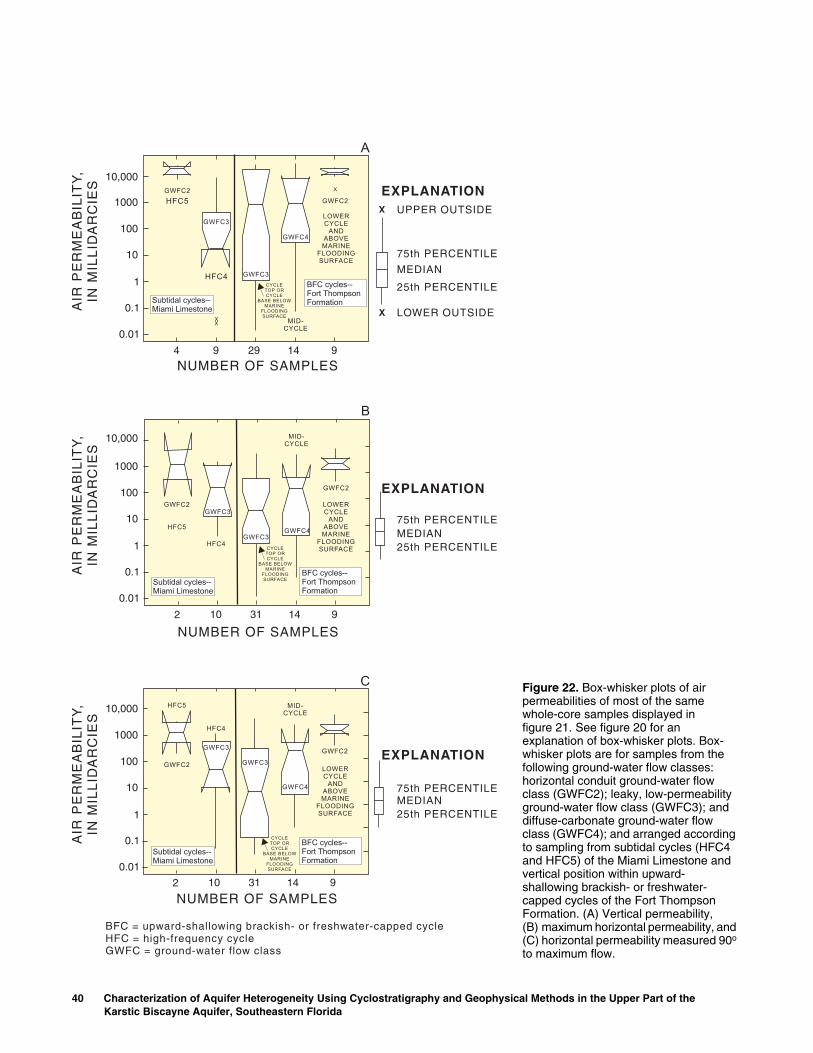
MID-CYCLE
HFC4
HFC5
AIR
PE
RM
EA
BIL
ITY
,IN
MIL
LID
AR
CIE
SA
IRP
ER
ME
AB
ILIT
Y,
INM
ILL
IDA
RC
IES
AIR
PE
RM
EA
BIL
ITY
,IN
MIL
LID
AR
CIE
S
1
10,000
1000
100
10
0.1
0.01
X
XX
NUMBER OF SAMPLES4 9 29 14 9
EXP
EXP
EXP
75
ME
25
LO
UP
X
X
75ME25
MID-CYCLE
NUMBER OF SAMPLES2 10 31 14 9
75ME25
MID-CYCLE
GWFC2
GWFC2
GWFC2
GWFC2
GWFC2
HFC5
HFC5
GWFC2
NUMBER OF SAMPLES2 10 31 14 9
A
B
C
1
10,000
1000
100
10
0.1
0.01
10,000
1000
100
10
0.1
0.01
GWFC3
GWFC4
GWFC4
GWFC4
GWFC3
GWFC3
GWFC3
GWFC3
GWFC3
HFC4
HFC4
LOWERCYCLE
ANDABOVEMARINE
FLOODINGSURFACE
LOWERCYCLE
ANDABOVEMARINE
FLOODINGSURFACE
LOWERCYCLE
ANDABOVEMARINE
FLOODINGSURFACE
CYCLETOP ORCYCLE
BASE BELOWMARINE
FLOODINGSURFACE
CYCLETOP ORCYCLE
BASE BELOWMARINE
FLOODINGSURFACE
CYCLETOP ORCYCLE
BASE BELOWMARINE
FLOODINGSURFACE
Subtidal cycles--Miami Limestone
Subtidal cycles--Miami Limestone
Subtidal cycles--Miami Limestone
BFC cycles--Fort ThompsonFormation
BFC cycles--Fort ThompsonFormation
BFC cycles--Fort ThompsonFormation
BFC = upward-shallowing brackish- or freshwater-cappedHFC = high-frequency cycleGWFC = ground-water flow class
1
40 Characterization of Aquifer Heterogeneity Using CyclostratigKarstic Biscayne Aquifer, Southeastern Florida
LANATION
LANATION
LANATION
th PERCENTILE
DIAN
th PERCENTILE
WER OUTSIDE
PER OUTSIDE
th PERCENTILEDIAN
th PERCENTILE
th PERCENTILEDIAN
th PERCENTILE
cycle
Figure 22. Box-whisker plots of air permeabilities of most of the same whole-core samples displayed in figure 21. See figure 20 for an explanation of box-whisker plots. Box-whisker plots are for samples from the following ground-water flow classes: horizontal conduit ground-water flow class (GWFC2); leaky, low-permeability ground-water flow class (GWFC3); and diffuse-carbonate ground-water flow class (GWFC4); and arranged according to sampling from subtidal cycles (HFC4 and HFC5) of the Miami Limestone and vertical position within upward-shallowing brackish- or freshwater-capped cycles of the Fort Thompson Formation. (A) Vertical permeability, (B) maximum horizontal permeability, and (C) horizontal permeability measured 90o
to maximum flow.
raphy and Geophysical Methods in the Upper Part of the
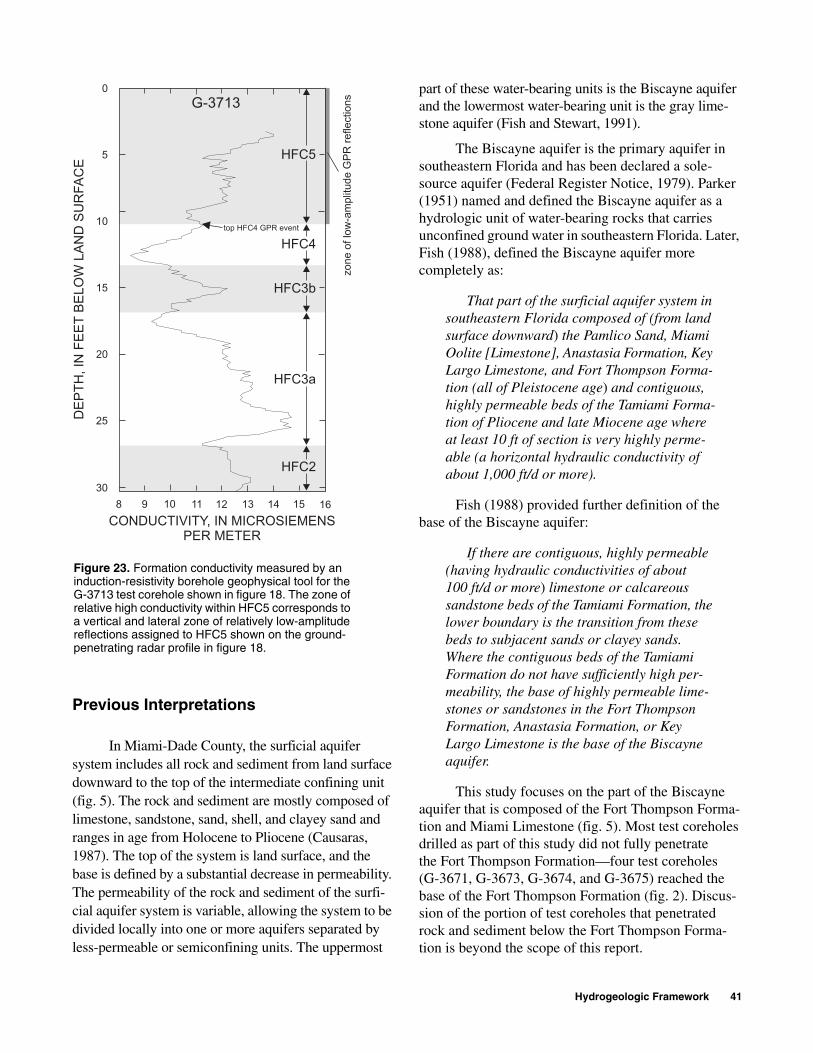
1612 14108 9 11 13 15
CONDUCTIVITY, IN MICROSIEMENSPER METER
HFC5
G-3713
HFC4
top HFC4 GPR event
zo
ne
oflo
w-a
mp
litu
de
GP
Rre
fle
ctio
ns
HFC3b
HFC2
HFC3a
0
10
5
15
25
20
DE
PT
H,
INF
EE
TB
EL
OW
LA
ND
SU
RFA
CE
30
Figure 23. Formation conductivity measured by an induction-resistivity borehole geophysical tool for the G-3713 test corehole shown in figure 18. The zone of relative high conductivity within HFC5 corresponds to a vertical and lateral zone of relatively low-amplitude reflections assigned to HFC5 shown on the ground-penetrating radar profile in figure 18.
Previous Interpretations
In Miami-Dade County, the surficial aquifer system includes all rock and sediment from land surface downward to the top of the intermediate confining unit (fig. 5). The rock and sediment are mostly composed of limestone, sandstone, sand, shell, and clayey sand and ranges in age from Holocene to Pliocene (Causaras, 1987). The top of the system is land surface, and the base is defined by a substantial decrease in permeability. The permeability of the rock and sediment of the surfi-cial aquifer system is variable, allowing the system to be divided locally into one or more aquifers separated by less-permeable or semiconfining units. The uppermost
part of these water-bearing units is the Biscayne aquifer and the lowermost water-bearing unit is the gray lime-stone aquifer (Fish and Stewart, 1991).
The Biscayne aquifer is the primary aquifer in southeastern Florida and has been declared a sole-source aquifer (Federal Register Notice, 1979). Parker (1951) named and defined the Biscayne aquifer as a hydrologic unit of water-bearing rocks that carries unconfined ground water in southeastern Florida. Later, Fish (1988), defined the Biscayne aquifer more completely as:
That part of the surficial aquifer system in southeastern Florida composed of (from land surface downward) the Pamlico Sand, Miami Oolite [Limestone], Anastasia Formation, Key Largo Limestone, and Fort Thompson Forma-tion (all of Pleistocene age) and contiguous, highly permeable beds of the Tamiami Forma-tion of Pliocene and late Miocene age where at least 10 ft of section is very highly perme-able (a horizontal hydraulic conductivity of about 1,000 ft/d or more).
Fish (1988) provided further definition of the base of the Biscayne aquifer:
If there are contiguous, highly permeable (having hydraulic conductivities of about 100 ft/d or more) limestone or calcareous sandstone beds of the Tamiami Formation, the lower boundary is the transition from these beds to subjacent sands or clayey sands. Where the contiguous beds of the Tamiami Formation do not have sufficiently high per-meability, the base of highly permeable lime-stones or sandstones in the Fort Thompson Formation, Anastasia Formation, or Key Largo Limestone is the base of the Biscayne aquifer.
This study focuses on the part of the Biscayne aquifer that is composed of the Fort Thompson Forma-tion and Miami Limestone (fig. 5). Most test coreholes drilled as part of this study did not fully penetrate the Fort Thompson Formation—four test coreholes (G-3671, G-3673, G-3674, and G-3675) reached the base of the Fort Thompson Formation (fig. 2). Discus-sion of the portion of test coreholes that penetrated rock and sediment below the Fort Thompson Forma-tion is beyond the scope of this report.
Hydrogeologic Framework 41
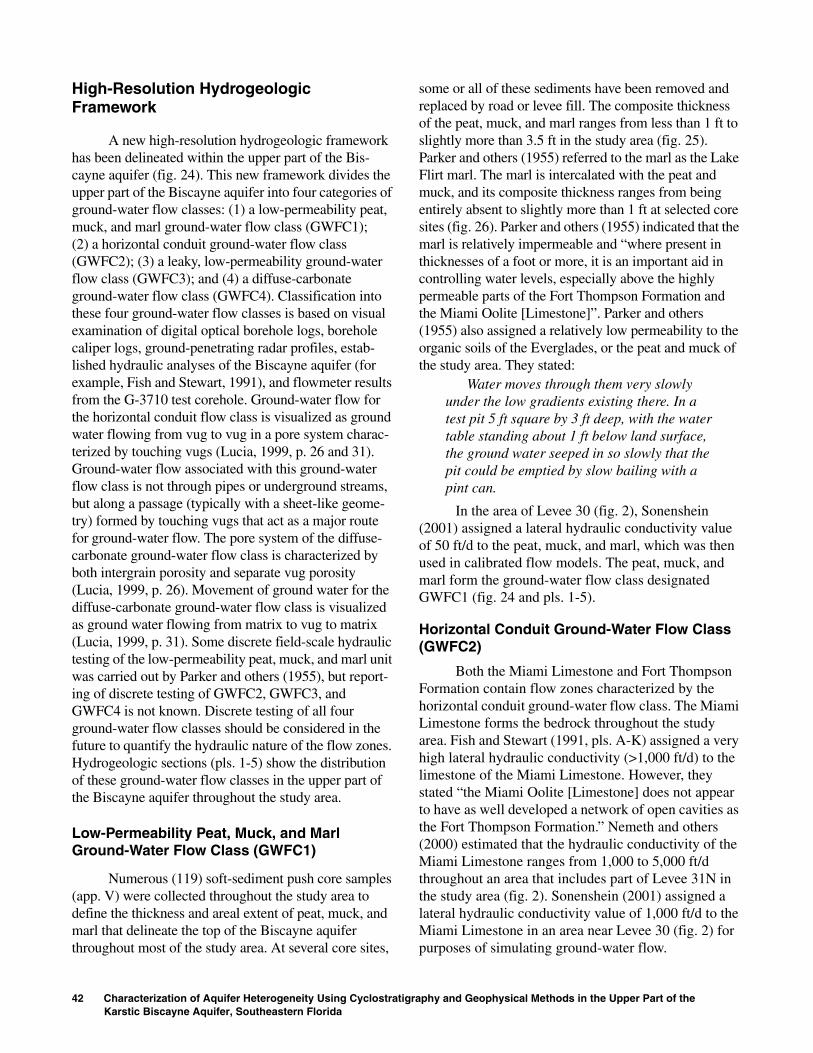
High-Resolution Hydrogeologic Framework
A new high-resolution hydrogeologic framework has been delineated within the upper part of the Bis-cayne aquifer (fig. 24). This new framework divides the upper part of the Biscayne aquifer into four categories of ground-water flow classes: (1) a low-permeability peat, muck, and marl ground-water flow class (GWFC1); (2) a horizontal conduit ground-water flow class (GWFC2); (3) a leaky, low-permeability ground-water flow class (GWFC3); and (4) a diffuse-carbonate ground-water flow class (GWFC4). Classification into these four ground-water flow classes is based on visual examination of digital optical borehole logs, borehole caliper logs, ground-penetrating radar profiles, estab-lished hydraulic analyses of the Biscayne aquifer (for example, Fish and Stewart, 1991), and flowmeter results from the G-3710 test corehole. Ground-water flow for the horizontal conduit flow class is visualized as ground water flowing from vug to vug in a pore system charac-terized by touching vugs (Lucia, 1999, p. 26 and 31). Ground-water flow associated with this ground-water flow class is not through pipes or underground streams, but along a passage (typically with a sheet-like geome-try) formed by touching vugs that act as a major route for ground-water flow. The pore system of the diffuse-carbonate ground-water flow class is characterized by both intergrain porosity and separate vug porosity (Lucia, 1999, p. 26). Movement of ground water for the diffuse-carbonate ground-water flow class is visualized as ground water flowing from matrix to vug to matrix (Lucia, 1999, p. 31). Some discrete field-scale hydraulic testing of the low-permeability peat, muck, and marl unit was carried out by Parker and others (1955), but report-ing of discrete testing of GWFC2, GWFC3, and GWFC4 is not known. Discrete testing of all four ground-water flow classes should be considered in the future to quantify the hydraulic nature of the flow zones. Hydrogeologic sections (pls. 1-5) show the distribution of these ground-water flow classes in the upper part of the Biscayne aquifer throughout the study area.
Low-Permeability Peat, Muck, and Marl Ground-Water Flow Class (GWFC1)
Numerous (119) soft-sediment push core samples (app. V) were collected throughout the study area to define the thickness and areal extent of peat, muck, and marl that delineate the top of the Biscayne aquifer throughout most of the study area. At several core sites,
42 Characterization of Aquifer Heterogeneity Using CyclostratigKarstic Biscayne Aquifer, Southeastern Florida
some or all of these sediments have been removed and replaced by road or levee fill. The composite thickness of the peat, muck, and marl ranges from less than 1 ft to slightly more than 3.5 ft in the study area (fig. 25). Parker and others (1955) referred to the marl as the Lake Flirt marl. The marl is intercalated with the peat and muck, and its composite thickness ranges from being entirely absent to slightly more than 1 ft at selected core sites (fig. 26). Parker and others (1955) indicated that the marl is relatively impermeable and “where present in thicknesses of a foot or more, it is an important aid in controlling water levels, especially above the highly permeable parts of the Fort Thompson Formation and the Miami Oolite [Limestone]”. Parker and others (1955) also assigned a relatively low permeability to the organic soils of the Everglades, or the peat and muck of the study area. They stated:
Water moves through them very slowly under the low gradients existing there. In a test pit 5 ft square by 3 ft deep, with the water table standing about 1 ft below land surface, the ground water seeped in so slowly that the pit could be emptied by slow bailing with a pint can.
In the area of Levee 30 (fig. 2), Sonenshein (2001) assigned a lateral hydraulic conductivity value of 50 ft/d to the peat, muck, and marl, which was then used in calibrated flow models. The peat, muck, and marl form the ground-water flow class designated GWFC1 (fig. 24 and pls. 1-5).
Horizontal Conduit Ground-Water Flow Class (GWFC2)
Both the Miami Limestone and Fort Thompson Formation contain flow zones characterized by the horizontal conduit ground-water flow class. The Miami Limestone forms the bedrock throughout the study area. Fish and Stewart (1991, pls. A-K) assigned a very high lateral hydraulic conductivity (>1,000 ft/d) to the limestone of the Miami Limestone. However, they stated “the Miami Oolite [Limestone] does not appear to have as well developed a network of open cavities as the Fort Thompson Formation.” Nemeth and others (2000) estimated that the hydraulic conductivity of the Miami Limestone ranges from 1,000 to 5,000 ft/d throughout an area that includes part of Levee 31N in the study area (fig. 2). Sonenshein (2001) assigned a lateral hydraulic conductivity value of 1,000 ft/d to the Miami Limestone in an area near Levee 30 (fig. 2) for purposes of simulating ground-water flow.
raphy and Geophysical Methods in the Upper Part of the
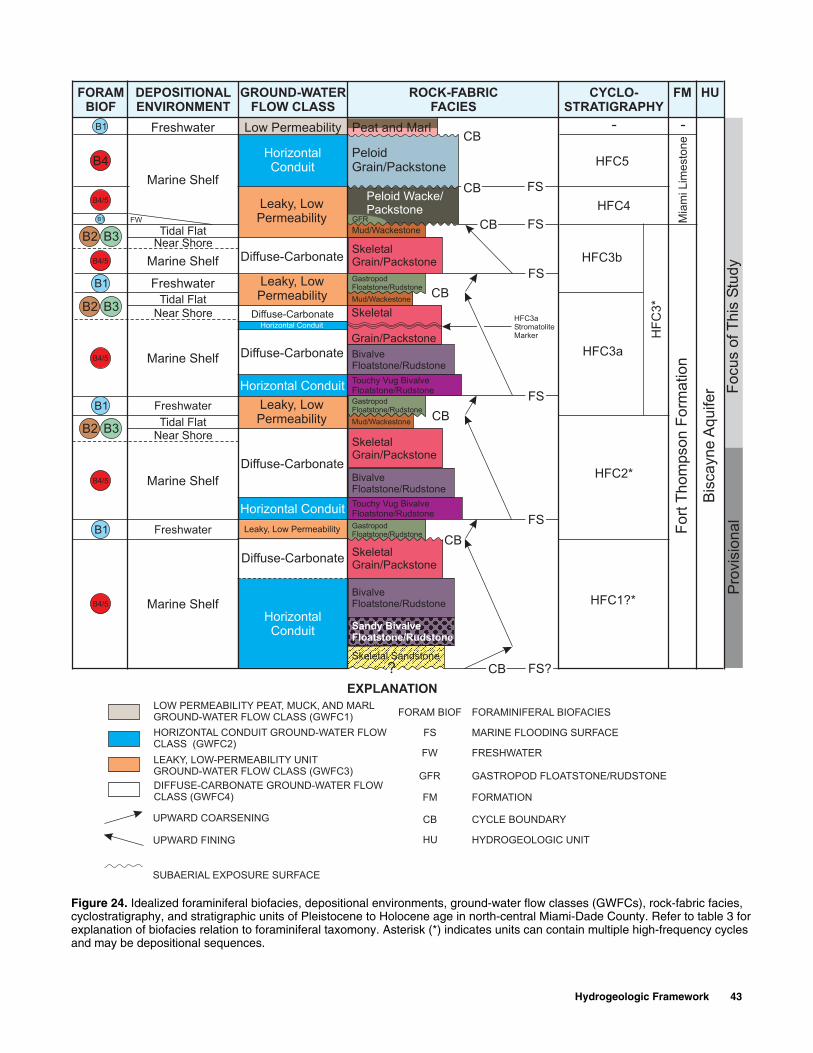
LEAKY, LOW-PERMEABILITY UNITGROUND-WATER FLOW CLASS (GWFC3)
Freshwater Low Permeability Peat and M
HorizontalConduit
Leaky, LowPermeability
Diffuse-Carbonate
Diffuse-CarbonateHorizontal Conduit
Diffuse-Carbonate
Horizontal Conduit
Diffuse-Carbonate
Horizontal Conduit
Leaky, Low Permeability
Diffuse-Carbonate
HorizontalConduit
Marine Shelf
Tidal Flat
Marine Shelf
Freshwater
Tidal Flat
Near Shore
Marine Shelf
Freshwater
Tidal FlatNear Shore
Marine Shelf
Freshwater
Marine Shelf
FW
Near Shore
PeloidGrain/Pac
Peloid WPacksto
GFR
SkeletalGrain/Pack
Mud/Wackesto
DEPOSITIONALENVIRONMENT
GROUND-WATERFLOW CLASS
GastropodFloatstone/Ruds
Mud/Wackestone
Skeletal
Grain/Pack
BivalveFloatstone/R
Touchy Vug BiFloatstone/Ru
SkeletalGrain/Pack
BivalveFloatstone/R
Touchy Vug BiFloatstone/Ru
GastropodFloatstone/Ruds
SkeletalGrain/Pack
BivalveFloatstone/R
Sandy BivalFloatstone/R
?Skeletal San
GastropodFloatstone/Ruds
Mud/Wackestone
FORAMBIOF
B4/5
B1
B1
B1
B1
B4/5
B4/5
B4/5
B4/5
B4
B3B2
B3B2
B3B2
B1
Leaky, LowPermeability
Leaky, LowPermeability
EXPLANA
SUBAERIAL EXPOSURE SURFACE
HORIZONTAL CONDUIT GROUND-WATER FLOWCLASS (GWFC2)
DIFFUSE-CARBONATE GROUND-WATER FLOWCLASS (GWFC4)
UPWARD COARSENING
UPWARD FINING
LOW PERMEABILITY PEAT, MUCK, AND MARLGROUND-WATER FLOW CLASS (GWFC1) FO
Figure 24. Idealized foraminiferal biofacies, depositional environcyclostratigraphy, and stratigraphic units of Pleistocene to Holocexplanation of biofacies relation to foraminiferal taxomony. Asterand may be depositional sequences.
arl
HFC5
HFC4
HFC3b
HFC3a
HFC2*
HFC1?*
-
kstone
acke/ne
FS
stone
ne
ROCK-FABRICFACIES
CYCLO-STRATIGRAPHY
FM HU
-
Mia
miL
ime
sto
ne
Fo
rtT
ho
mpso
nF
orm
atio
n
Bis
ca
yn
eA
qu
ife
r Fo
cu
so
fT
his
Stu
dy
tone
stone
HFC3aStromatoliteMarker
FS
FS
udstone
valvedstone
stone
udstone
valvedstone
FS
tone
stone
udstone
veudstone
FS?dstone
FS
tone
CB
CB
CB
CB
CB
CB
CB
HF
C3
*
TION
RAM BIOF
FS
FW
GFR
FM
CB
HU
FORAMINIFERAL BIOFACIES
MARINE FLOODING SURFACE
FRESHWATER
GASTROPOD FLOATSTONE/RUDSTONE
FORMATION
CYCLE BOUNDARY
HYDROGEOLOGIC UNIT
Pro
vis
ion
al
ments, ground-water flow classes (GWFCs), rock-fabric facies, ene age in north-central Miami-Dade County. Refer to table 3 for isk (*) indicates units can contain multiple high-frequency cycles
Hydrogeologic Framework 43

26°00´
25°45´
BROWAR
MIAMI-DAD
3
1
1.52
2.5
3
0.5
3
3.25
2
2.2
5
2.5
2.75
Figure 25. Composite thickness of Holocene peat, muck, and marl.
44 Characterization of Aquifer Heterogeneity Using CyclostratigKarstic Biscayne Aquifer, Southeastern Florida
80°24´
D COUNTY
E COUNTY
2
2
1
0
2
1
2
2.5 1
.75
3
2
1.5
1.7
5
2
1
0.75
1.75
0.75
1.5
1.75
1.75
1.2
5
1
1.5
AB
SE
NT
EXPLANATION
LINE OF EQUALTHICKNESS--Compositethickness of Holocene peatand marl. Interval is 0.25 feet
COREHOLE LOCATION
2
LIM
ITO
FD
ATA
0
0
3 MILES
3 KILOMETERS
1 2
1 2
raphy and Geophysical Methods in the Upper Part of the

26°00´
25°45´
80°24´
BROWARD COUNTY
MIAMI-DADE COUNTYLIM
ITO
FD
ATA
ABSENT
1.01.2
1.2 1.4
1.0
0.8
0.6
0.4
0.2
0.4
0.2
0.6 0.2
0.4
0.4
0.60.8
0.2
0
0
0
0
0
0
1.0
1.0
ABSENT
AB
SE
NT
ABSENT
EXP
LINTHIthicmar
CO
1.0
0
0
1
1 2
LANATION
E OF EQUALCKNESS--Compositekness of Holocenel. Interval is 0.2 feet
REHOLE LOCATION
3 MILES
3 KILOMETERS
2
Figure 26. Composite thickness of Holocene marl.
Hydrogeologic Framework 45
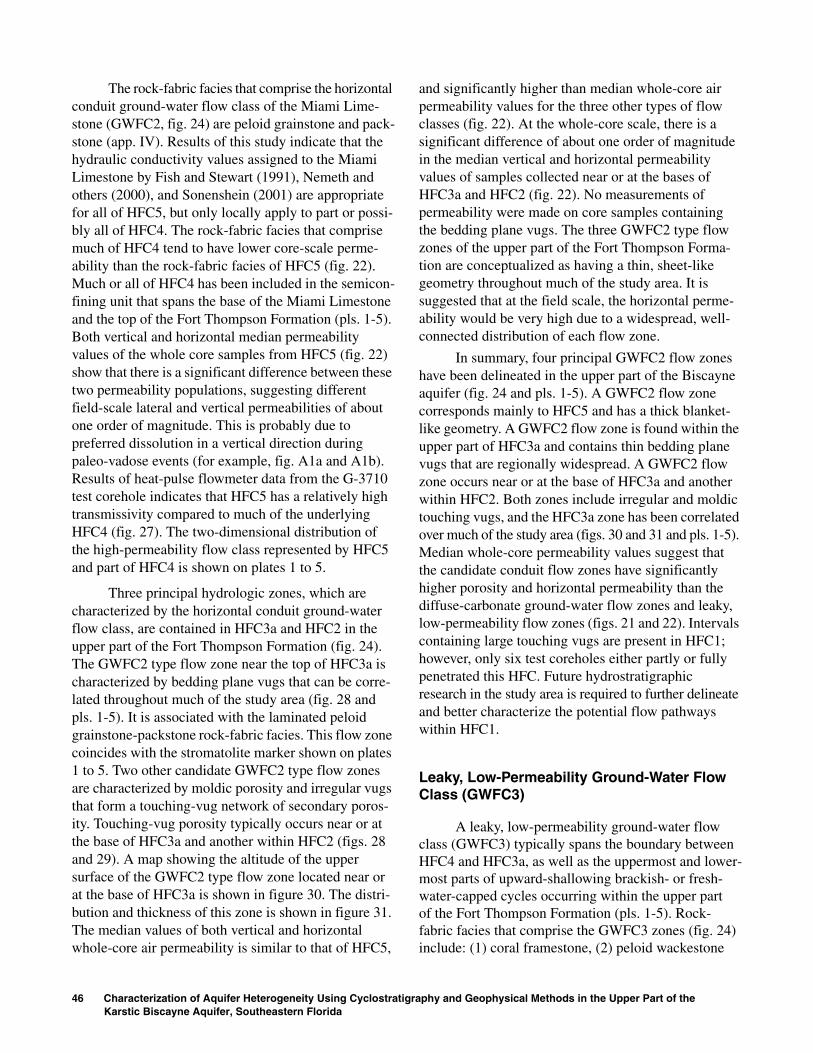
The rock-fabric facies that comprise the horizontal conduit ground-water flow class of the Miami Lime-stone (GWFC2, fig. 24) are peloid grainstone and pack-stone (app. IV). Results of this study indicate that the hydraulic conductivity values assigned to the Miami Limestone by Fish and Stewart (1991), Nemeth and others (2000), and Sonenshein (2001) are appropriate for all of HFC5, but only locally apply to part or possi-bly all of HFC4. The rock-fabric facies that comprise much of HFC4 tend to have lower core-scale perme-ability than the rock-fabric facies of HFC5 (fig. 22). Much or all of HFC4 has been included in the semicon-fining unit that spans the base of the Miami Limestone and the top of the Fort Thompson Formation (pls. 1-5). Both vertical and horizontal median permeability values of the whole core samples from HFC5 (fig. 22) show that there is a significant difference between these two permeability populations, suggesting different field-scale lateral and vertical permeabilities of about one order of magnitude. This is probably due to preferred dissolution in a vertical direction during paleo-vadose events (for example, fig. A1a and A1b). Results of heat-pulse flowmeter data from the G-3710 test corehole indicates that HFC5 has a relatively high transmissivity compared to much of the underlying HFC4 (fig. 27). The two-dimensional distribution of the high-permeability flow class represented by HFC5 and part of HFC4 is shown on plates 1 to 5.
Three principal hydrologic zones, which are characterized by the horizontal conduit ground-water flow class, are contained in HFC3a and HFC2 in the upper part of the Fort Thompson Formation (fig. 24). The GWFC2 type flow zone near the top of HFC3a is characterized by bedding plane vugs that can be corre-lated throughout much of the study area (fig. 28 and pls. 1-5). It is associated with the laminated peloid grainstone-packstone rock-fabric facies. This flow zone coincides with the stromatolite marker shown on plates 1 to 5. Two other candidate GWFC2 type flow zones are characterized by moldic porosity and irregular vugs that form a touching-vug network of secondary poros-ity. Touching-vug porosity typically occurs near or at the base of HFC3a and another within HFC2 (figs. 28 and 29). A map showing the altitude of the upper surface of the GWFC2 type flow zone located near or at the base of HFC3a is shown in figure 30. The distri-bution and thickness of this zone is shown in figure 31. The median values of both vertical and horizontal whole-core air permeability is similar to that of HFC5,
46 Characterization of Aquifer Heterogeneity Using CyclostratigKarstic Biscayne Aquifer, Southeastern Florida
and significantly higher than median whole-core air permeability values for the three other types of flow classes (fig. 22). At the whole-core scale, there is a significant difference of about one order of magnitude in the median vertical and horizontal permeability values of samples collected near or at the bases of HFC3a and HFC2 (fig. 22). No measurements of permeability were made on core samples containing the bedding plane vugs. The three GWFC2 type flow zones of the upper part of the Fort Thompson Forma-tion are conceptualized as having a thin, sheet-like geometry throughout much of the study area. It is suggested that at the field scale, the horizontal perme-ability would be very high due to a widespread, well-connected distribution of each flow zone.
In summary, four principal GWFC2 flow zones have been delineated in the upper part of the Biscayne aquifer (fig. 24 and pls. 1-5). A GWFC2 flow zone corresponds mainly to HFC5 and has a thick blanket-like geometry. A GWFC2 flow zone is found within the upper part of HFC3a and contains thin bedding plane vugs that are regionally widespread. A GWFC2 flow zone occurs near or at the base of HFC3a and another within HFC2. Both zones include irregular and moldic touching vugs, and the HFC3a zone has been correlated over much of the study area (figs. 30 and 31 and pls. 1-5). Median whole-core permeability values suggest that the candidate conduit flow zones have significantly higher porosity and horizontal permeability than the diffuse-carbonate ground-water flow zones and leaky, low-permeability flow zones (figs. 21 and 22). Intervals containing large touching vugs are present in HFC1; however, only six test coreholes either partly or fully penetrated this HFC. Future hydrostratigraphic research in the study area is required to further delineate and better characterize the potential flow pathways within HFC1.
Leaky, Low-Permeability Ground-Water Flow Class (GWFC3)
A leaky, low-permeability ground-water flow class (GWFC3) typically spans the boundary between HFC4 and HFC3a, as well as the uppermost and lower-most parts of upward-shallowing brackish- or fresh-water-capped cycles occurring within the upper part of the Fort Thompson Formation (pls. 1-5). Rock-fabric facies that comprise the GWFC3 zones (fig. 24) include: (1) coral framestone, (2) peloid wackestone
raphy and Geophysical Methods in the Upper Part of the
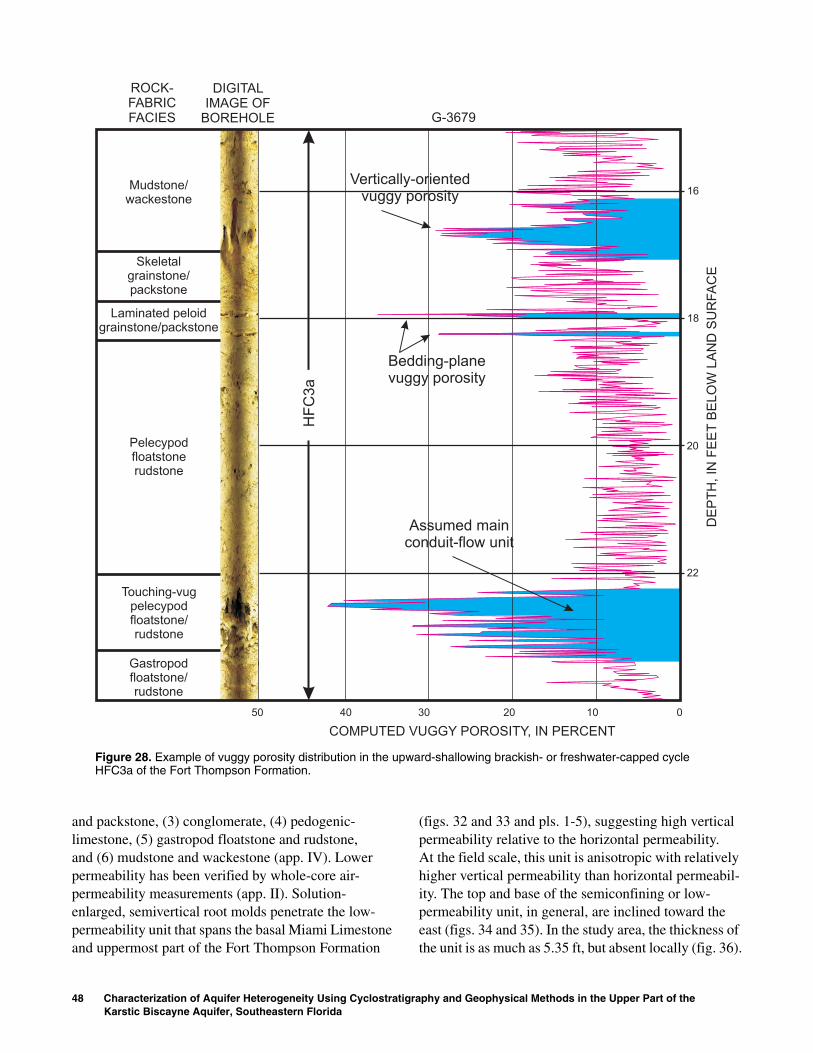
48 Characterization of Aquifer Heterogeneity Using Cyclostratigraphy and Geophysical Methods in the Upper Part of the Karstic Biscayne Aquifer, Southeastern Florida
and packstone, (3) conglomerate, (4) pedogenic-limestone, (5) gastropod floatstone and rudstone, and (6) mudstone and wackestone (app. IV). Lower permeability has been verified by whole-core air-permeability measurements (app. II). Solution-enlarged, semivertical root molds penetrate the low-permeability unit that spans the basal Miami Limestone and uppermost part of the Fort Thompson Formation
(figs. 32 and 33 and pls. 1-5), suggesting high vertical permeability relative to the horizontal permeability. At the field scale, this unit is anisotropic with relatively higher vertical permeability than horizontal permeabil-ity. The top and base of the semiconfining or low-permeability unit, in general, are inclined toward the east (figs. 34 and 35). In the study area, the thickness of the unit is as much as 5.35 ft, but absent locally (fig. 36).
3040 20 10 0D
EP
TH
,IN
FE
ET
BE
LO
WLA
ND
SU
RF
AC
E
COMPUTED VUGGY POROSITY, IN PERCENT
20
22
Assumed mainconduit-flow unit
Bedding-planevuggy porosity
Vertically-orientedvuggy porosity
HF
C3
a
G-3679
DIGITALIMAGE OF
BOREHOLE
ROCK-FABRICFACIES
50
18
16Mudstone/
wackestone
Skeletalgrainstone/packstone
Laminated peloidgrainstone/packstone
Pelecypodfloatstonerudstone
Touching-vugpelecypodfloatstone/rudstone
Gastropodfloatstone/rudstone
Figure 28. Example of vuggy porosity distribution in the upward-shallowing brackish- or freshwater-capped cycle HFC3a of the Fort Thompson Formation.
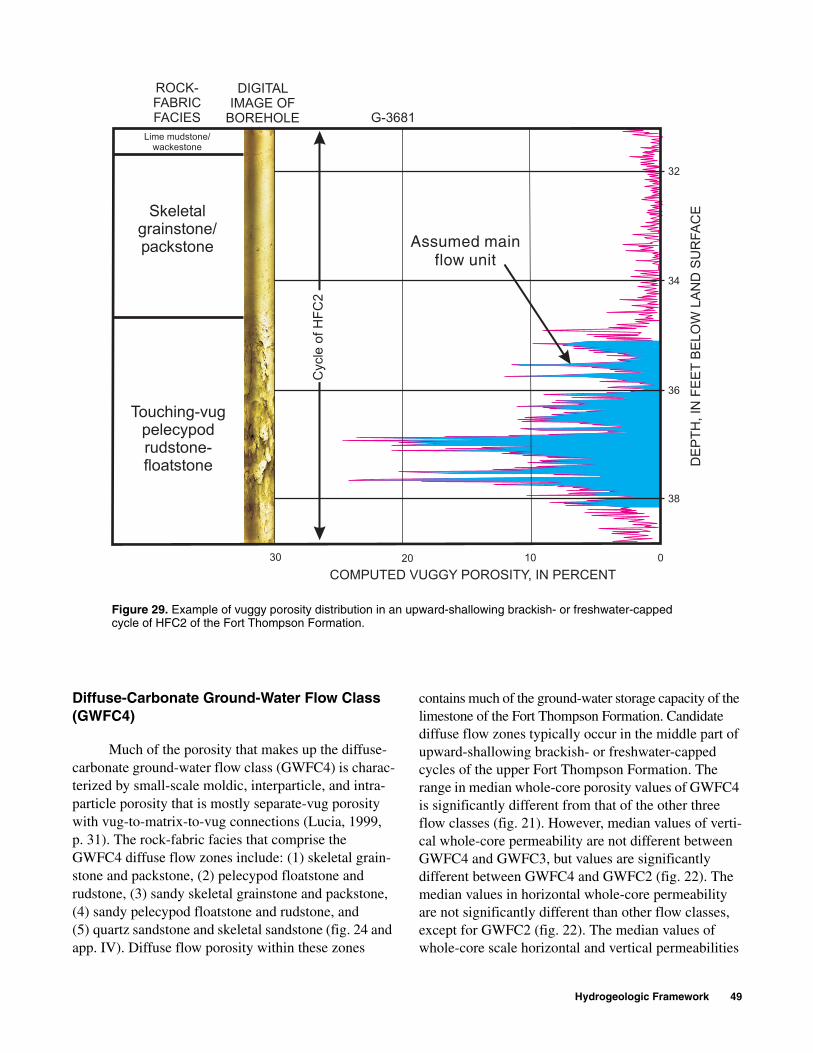
Hydrogeologic Framework 49
Diffuse-Carbonate Ground-Water Flow Class (GWFC4)
Much of the porosity that makes up the diffuse-carbonate ground-water flow class (GWFC4) is charac-terized by small-scale moldic, interparticle, and intra-particle porosity that is mostly separate-vug porosity with vug-to-matrix-to-vug connections (Lucia, 1999, p. 31). The rock-fabric facies that comprise the GWFC4 diffuse flow zones include: (1) skeletal grain-stone and packstone, (2) pelecypod floatstone and rudstone, (3) sandy skeletal grainstone and packstone, (4) sandy pelecypod floatstone and rudstone, and (5) quartz sandstone and skeletal sandstone (fig. 24 and app. IV). Diffuse flow porosity within these zones
contains much of the ground-water storage capacity of the limestone of the Fort Thompson Formation. Candidate diffuse flow zones typically occur in the middle part of upward-shallowing brackish- or freshwater-capped cycles of the upper Fort Thompson Formation. The range in median whole-core porosity values of GWFC4 is significantly different from that of the other three flow classes (fig. 21). However, median values of verti-cal whole-core permeability are not different between GWFC4 and GWFC3, but values are significantly different between GWFC4 and GWFC2 (fig. 22). The median values in horizontal whole-core permeability are not significantly different than other flow classes, except for GWFC2 (fig. 22). The median values of whole-core scale horizontal and vertical permeabilities
30 20 10 0
DE
PT
H,
INF
EE
TB
EL
OW
LA
ND
SU
RF
AC
E
COMPUTED VUGGY POROSITY, IN PERCENT
34
36
38
32
Assumed mainflow unit
Lime mudstone/wackestone
Skeletalgrainstone/packstone
Touching-vugpelecypodrudstone-floatstone
Cycle
of
HF
C2
DIGITALIMAGE OF
BOREHOLE
ROCK-FABRICFACIES G-3681
Figure 29. Example of vuggy porosity distribution in an upward-shallowing brackish- or freshwater-capped cycle of HFC2 of the Fort Thompson Formation.
Computedvuggy
porosity (%)
Cyclo-strati-
graphy
Dig
ita
lim
ag
eo
fb
ore
ho
leHFC5
Sem
2
Inferredbased o
HFC4
HFC3b
HFC3a
HFC2
80 60 40 20
0 0.4Fl
30
25
20
15
10
5
De
pth
(ft)
Depth
(ft) 0 0.4
FLOW, IN G
DE
PT
H,IN
FE
ET
BE
LO
WLA
ND
SU
RFA
CE
Figure 27. Heat-pulse flowmeter measurement of relative bupper part of the Biscayne aquifer can be subdivided into seInitial results show: (1) HFC5 is interpreted as one single flolocal flow zone, (3) the basal part of HFC3a forms a flow zonflow zone.
4 6 8 10 12Caliper(inches)
Flow zone
Flow zone only locally
Flow zoneonly locally
Flow zone
Peta
l-D
ivert
er
Dia
mete
r
iconfining unit
Diffuseflow zone
Semiconfining unit
Relativetransmissivity
in percentof total
boreholetransmissivity
G-3710
portion of subaquifern whole-core
CALIPER,IN INCHES
12
Diffuseflow zone
0.8 1.2 1.6ow (gal/min)
Legend
Ambient Flow
Injected Flow
0.8 1.2 1.6
ALLONS PER MINUTE
EXPLANATION
AMBIENT FLOW
INJECTED FLOW
0 50 100
55%
12%
14%
19%
104 6 8
orehole transmissivity, indicating that limestone of the veral flow and diffuse zones and a semiconfining unit. w zone, (2) the basal part of HFC4 is interpreted to form a e, and (4) the top of HFC3a has potential to act as a local
Hydrogeologic Framework 47
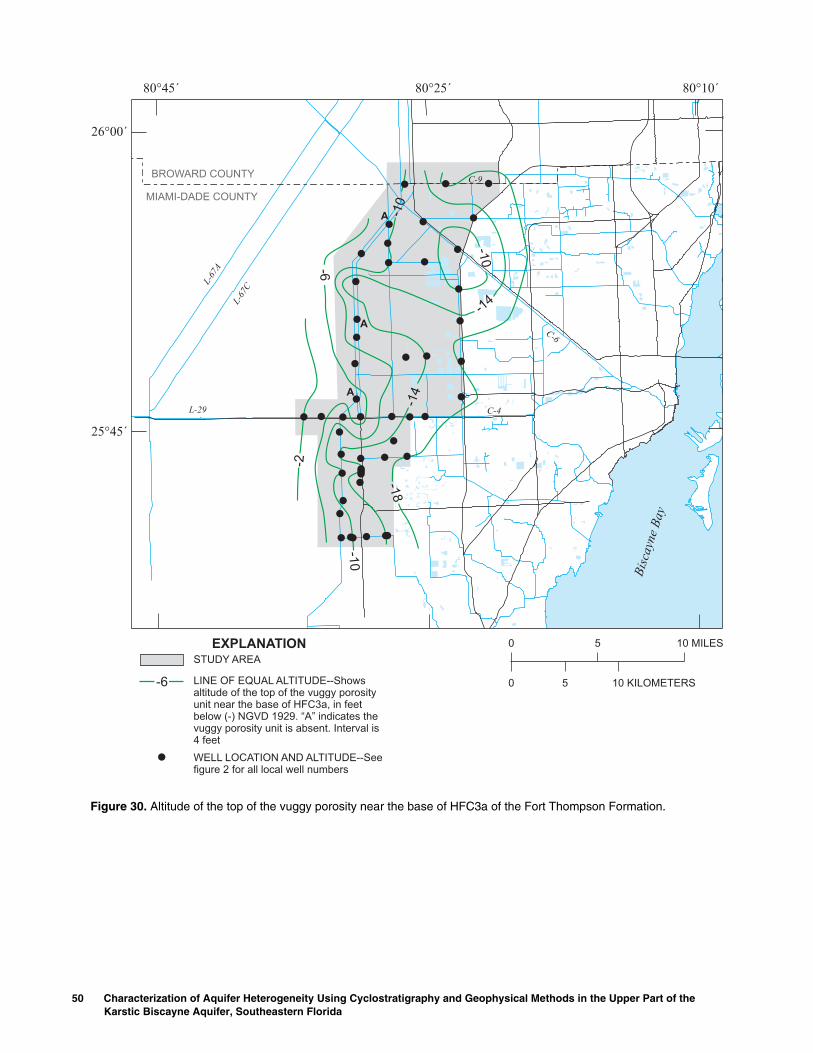
A
A
A
BROWARD COUNTY
MIAMI-DADE COUNTY
-6
-10
-14
-10
-14
-10
-18
-2
80°45´
26°00´
25°45´
80°25´ 80°10´
LINE OF EQUAL ALTITUDE--Showsaltitude of the top of the vuggy porosityunit near the base of HFC3a, in feetbelow (-) NGVD 1929. “A” indicates thevuggy porosity unit is absent. Interval is4 feet
-6
EXPLANATIONSTUDY AREA
Bis
cayn
eB
ay
WELL LOCATION AND ALTITUDE--Seefigure 2 for all local well numbers
0 5 10 MILES
0 5 10 KILOMETERS
L-67
A
L-67
C
L-29
C-9
C-4
C-6
Figure 30. Altitude of the top of the vuggy porosity near the base of HFC3a of the Fort Thompson Formation.
50 Characterization of Aquifer Heterogeneity Using CyclostratigKarstic Biscayne Aquifer, Southeastern Florida
raphy and Geophysical Methods in the Upper Part of the
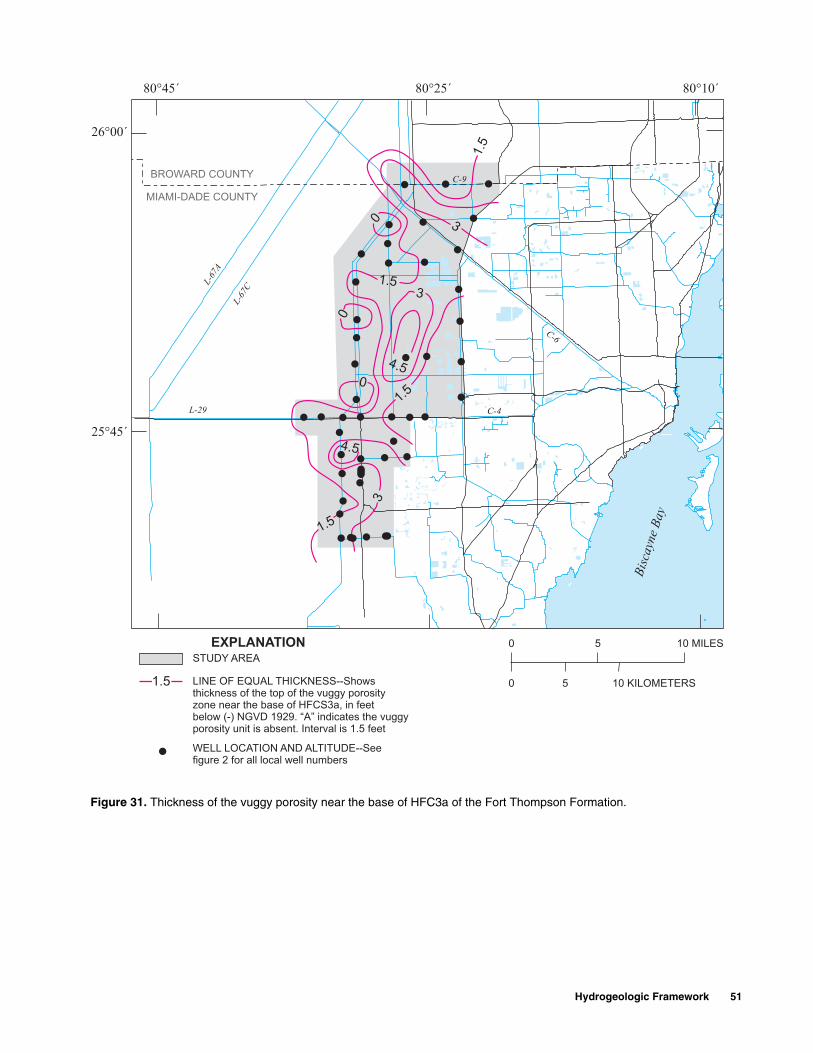
3
3
1.5
1.5
1.5
3
1.5
0
0
04.5
4.5
MIAMI-DADE COUNTY
BROWARD COUNTY
0 5 10 MILES
0 5 10 KILOMETERS
80°45´
26°00´
25°45´
80°25´ 80°10´
LINE OF EQUAL THICKNESS--Showsthickness of the top of the vuggy porosityzone near the base of HFCS3a, in feetbelow (-) NGVD 1929. “A” indicates the vuggyporosity unit is absent. Interval is 1.5 feet
1.5
EXPLANATIONSTUDY AREA
Bis
cayn
eB
ay
WELL LOCATION AND ALTITUDE--Seefigure 2 for all local well numbers
L-67
A
L-67
C
L-29
C-9
C-4
C-6
Figure 31. Thickness of the vuggy porosity near the base of HFC3a of the Fort Thompson Formation.
Hydrogeologic Framework 51
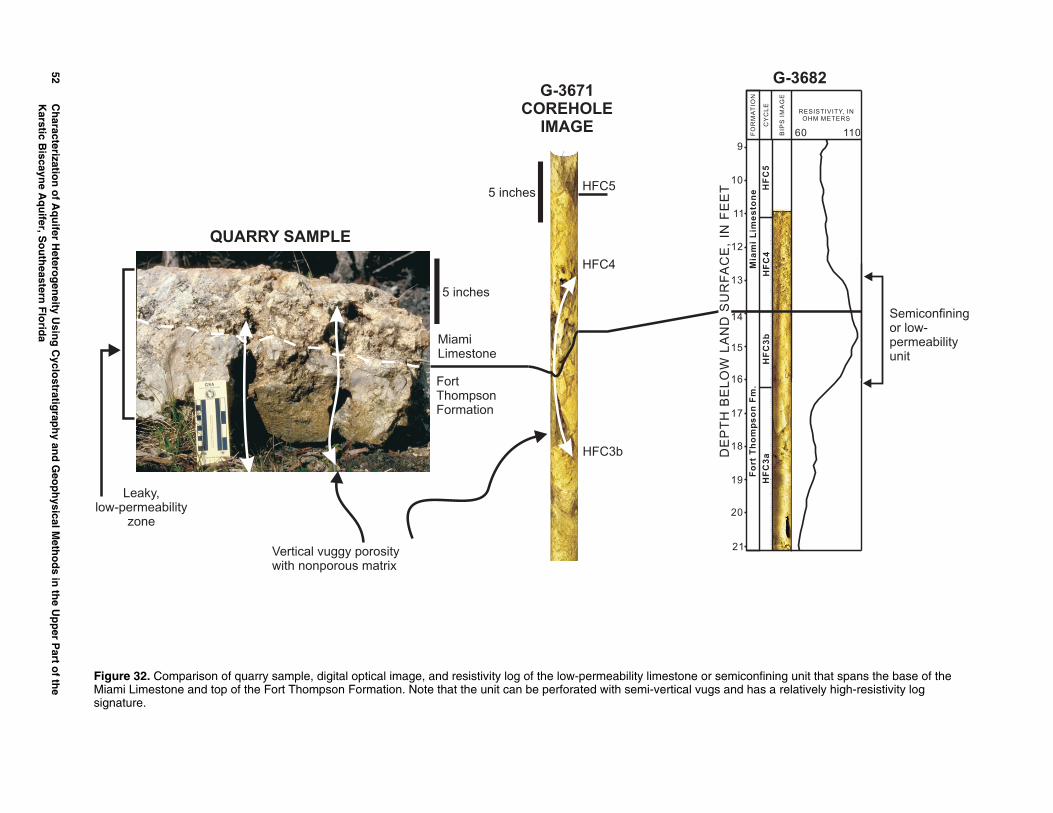
52C
haracterizatio
n o
f Aq
uifer H
eterog
eneity U
sing
Cyclo
stratigrap
hy an
d G
eop
hysical M
etho
ds in
the U
pp
er Part o
f the
Karstic B
iscayne A
qu
ifer, So
uth
eastern F
lorid
a
G-3682
Mia
mi
Lim
es
ton
e
HF
C4
HF
C3
aH
FC
5H
FC
3b
110
Fo
rtT
ho
mp
so
nF
m.
FO
RM
AT
ION
CY
CL
E
BIP
SIM
AG
E
RESISTIVITY, INOHM METERS
60
Semiconfiningor low-permeabilityunit
fining unit that spans the base of the s a relatively high-resistivity log
G-3671COREHOLE
IMAGE
QUARRY SAMPLE
MiamiLimestone
HFC5
HFC4
HFC3b
FortThompsonFormation
5 inches
5 inches
Vertical vuggy porositywith nonporous matrix
Leaky,low-permeability
zone
10
9
11
18
19
12
13
15
20
21
14
16
17
DE
PT
HB
EL
OW
LA
ND
SU
RF
AC
E,
INF
EE
T
Figure 32. Comparison of quarry sample, digital optical image, and resistivity log of the low-permeability limestone or semiconMiami Limestone and top of the Fort Thompson Formation. Note that the unit can be perforated with semi-vertical vugs and hasignature.
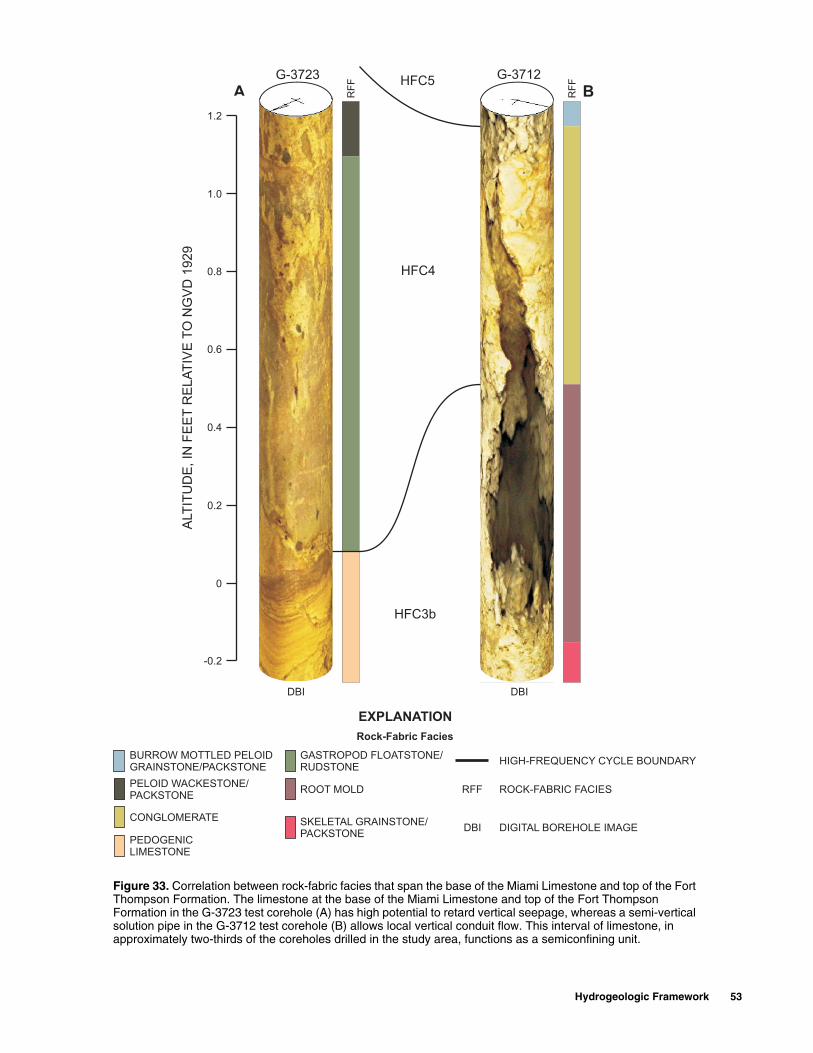
Figure 33. Correlation between rock-fabric facies that spThompson Formation. The limestone at the base of the Formation in the G-3723 test corehole (A) has high potensolution pipe in the G-3712 test corehole (B) allows locaapproximately two-thirds of the coreholes drilled in the s
G-3723
A
1.0
1.2
0.2
-0.2
0.4
ALT
ITU
DE
,IN
FE
ET
RE
LA
TIV
ET
ON
GV
D1
92
9
0.6
0.8
0
H
HF
H
RF
F
DBI
Rock-Fabr
EXPLAN
BURROW MOTTLED PELOIDGRAINSTONE/PACKSTONE
PELOID WACKESTONE/PACKSTONE
GASTROPOD FLOATSRUDSTONE
CONGLOMERATE
PEDOGENICLIMESTONE
ROOT MOLD
SKELETAL GRAINSTOPACKSTONE
an the base of the Miami Limestone and top of the Fort Miami Limestone and top of the Fort Thompson tial to retard vertical seepage, whereas a semi-vertical
l vertical conduit flow. This interval of limestone, in tudy area, functions as a semiconfining unit.
G-3712
B
FC4
C3b
FC5
DBI
RF
F
ic Facies
ATION
TONE/
NE/
HIGH-FREQUENCY CYCLE BOUNDARY
ROCK-FABRIC FACIES
DIGITAL BOREHOLE IMAGE
RFF
DBI
Hydrogeologic Framework 53
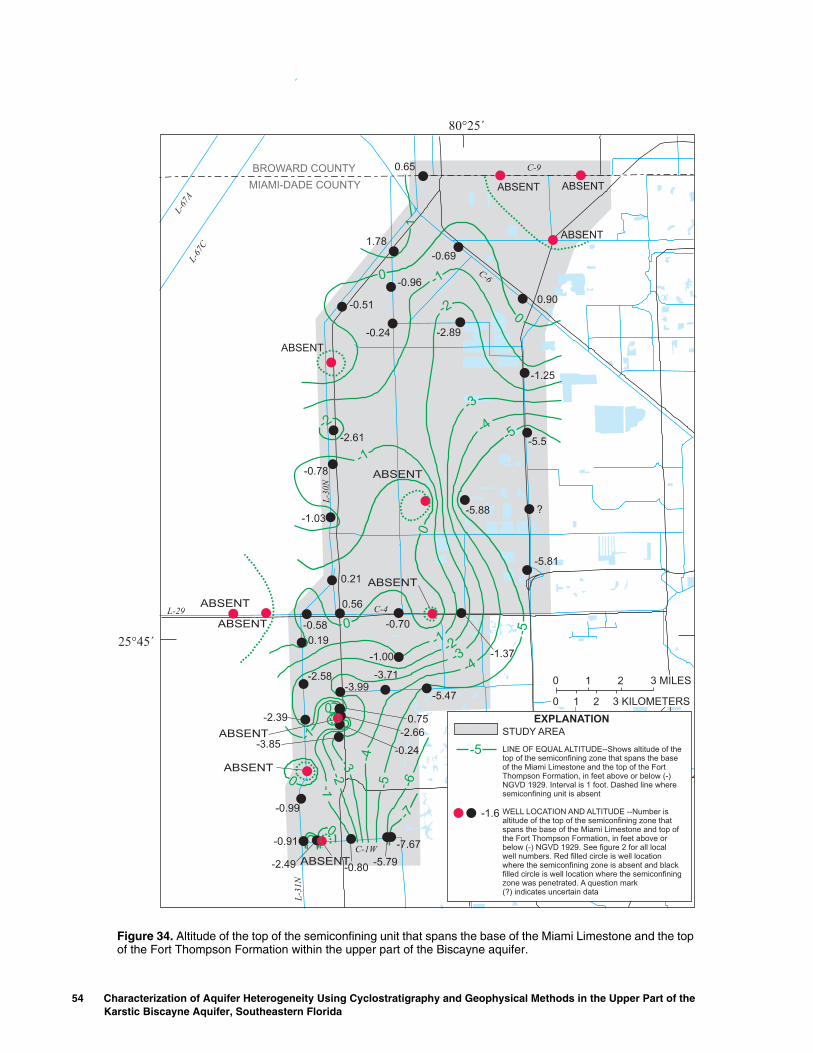
Figure 34. Altitude of the top of the semiconfining unit thof the Fort Thompson Formation within the upper part o
54 Characterization of Aquifer Heterogeneity Using CyclostratigKarstic Biscayne Aquifer, Southeastern Florida
at spans the base of the Miami Limestone and the top f the Biscayne aquifer.
raphy and Geophysical Methods in the Upper Part of the
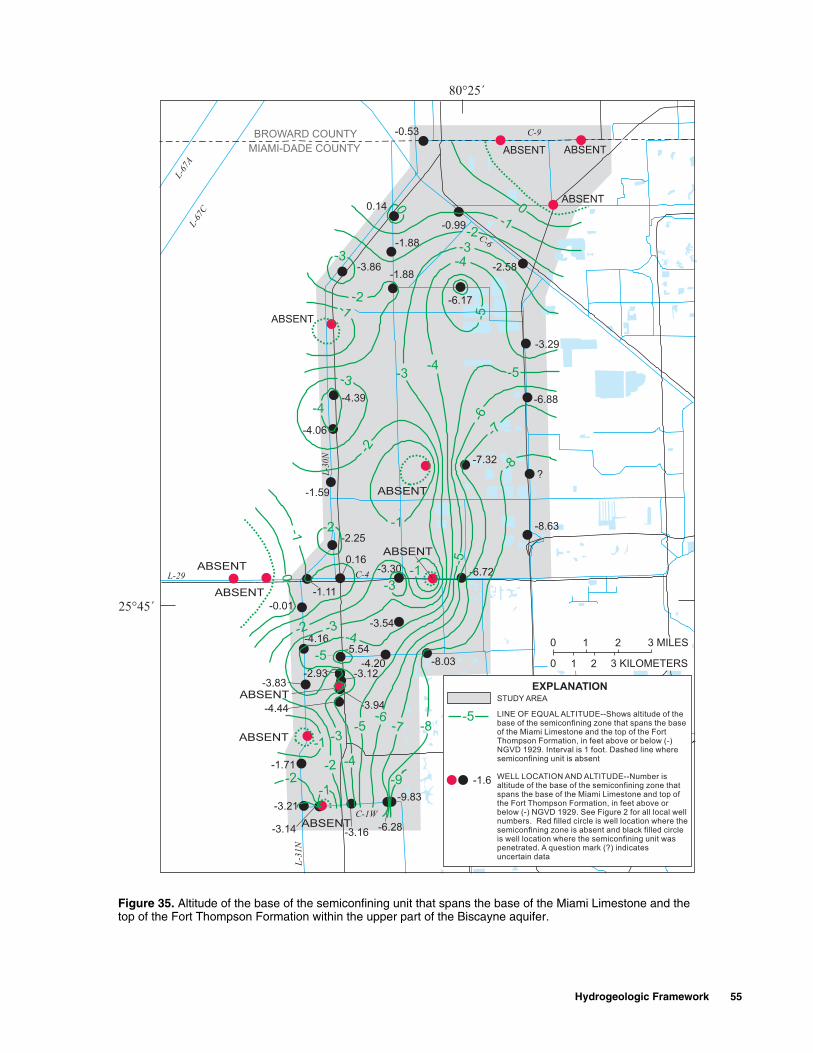
Figure 35. Altitude of the base of the semiconfining unitop of the Fort Thompson Formation within the upper pa
t that spans the base of the Miami Limestone and the rt of the Biscayne aquifer.
Hydrogeologic Framework 55
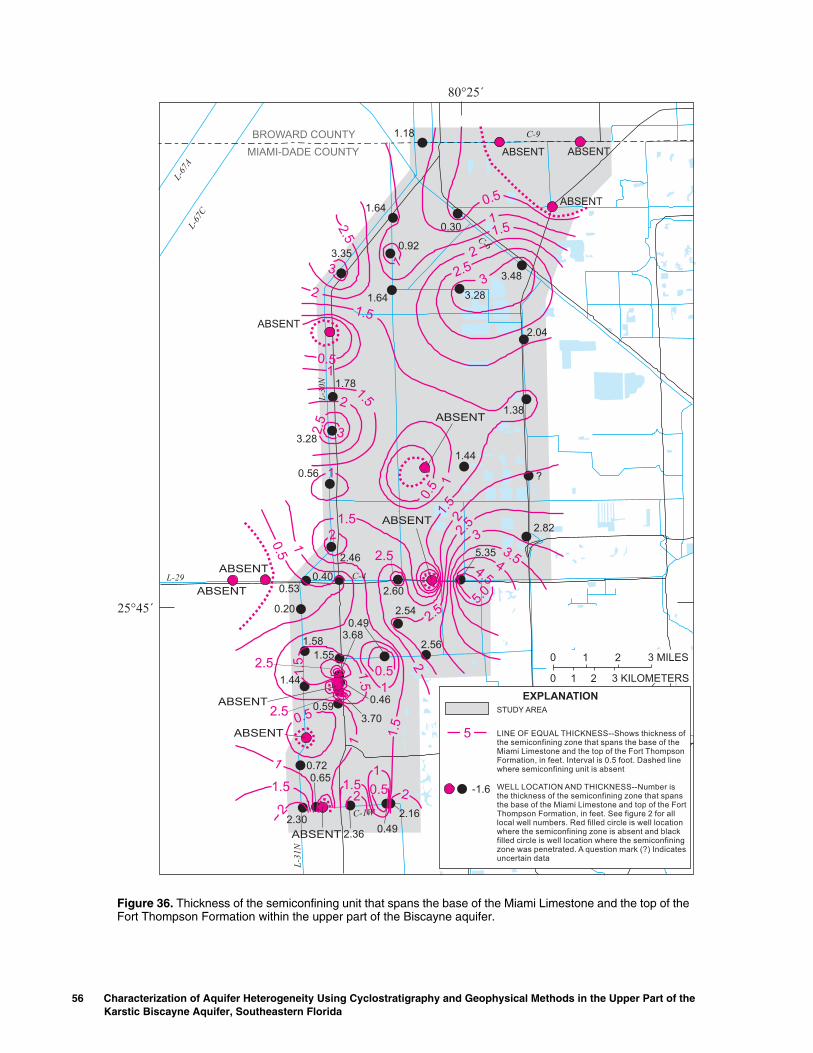
Figure 36. Thickness of the semiconfining unit that spanFort Thompson Formation within the upper part of the B
56 Characterization of Aquifer Heterogeneity Using CyclostratigKarstic Biscayne Aquifer, Southeastern Florida
s the base of the Miami Limestone and the top of the iscayne aquifer.
raphy and Geophysical Methods in the Upper Part of the
of the diffuse flow class (GWFC4) are not significantly different, suggesting that permeability is heterogeneous but isotropic at the core scale. The hydraulic properties of diffuse flow zones have been tested only with flowmeter measurements at the G-3710 test corehole (fig. 27), and the relation between whole-core and aquifer-test perme-ability measurements, and hydraulic properties has not been evaluated.
High-Resolution Hydrogeologic Framework Along Selected Canals
The high-resolution hydrogeologic framework developed in this study has been projected from one-dimensional data at test coreholes onto selected study area canal walls and displayed as two-dimensional cross sections (figs. 37 and 38). These cross sections are intended to assist in any future seepage studies of the canals and evaluation of migration of surface-water microorganisms into the karst limestone of the Biscayne aquifer (Bruno and others, 2003). Most of the test coreholes for this study were drilled on right-of-ways beside canals, so the projection of the hydrogeology developed at each well onto canal walls is only across a distance of several tens of feet. The lateral conduit flow zone of HFC5 is exposed fully on the walls of most of the canals shown in figures 37 and 38. HFC3a is, at least, partly exposed in the canal walls of most canals except the C-4 and Bird Road Canals (figs. 37 and 38). The lateral conduit flow zone of HFC2 is only exposed in the canal walls of the Snapper Creek Extension Canal (fig. 37). Because the Snapper Creek Extension Canal is the deepest canal shown in figure 37, and has the greatest number of flow zones exposed along its walls, it is likely the most vulnerable to migration of microorganisms, including pathogenic varieties, into and through the network of conduit flow zones that are present in the deeper limestone of the Biscayne aquifer.
Biscayne Aquifer Pore System and Evolution
The Biscayne aquifer is an eogenetic karst aquifer. The term eogenetic karst is applied to the land surface and the pore system of young limestone (generally not older than Quaternary) undergoing shallow, meteoric diagenesis (Vacher and Mylroie, 2002) that results in a dual-porosity system consisting of matrix and conduit porosity. This differs from older karst systems con-tained in consolidated carbonate rock in which the rock
matrix contributes little to the porosity system, and ground-water flow is dominated by conduit and frac-ture porosity (Vacher and Mylroie, 2002). The move-ment of ground-water in the karstic Biscayne aquifer is both conduit and diffuse-carbonate ground-water flow. Conduit and diffuse-carbonate ground-water flow have been documented in the Floridan aquifer system (USA), the Yucatan aquifer (Mexico), and the North Coast limestone aquifer (Puerto Rico). These three aquifers are composed largely of Tertiary rocks (Thrailkill, 1976, p. 759; Renken and others, 2002; Ward and others, 2003). Cressler (1993) described large-scale karst features of the limestone of the Biscayne aquifer, such as caves and sink holes.
Analysis of the pore system at the core scale and interpolated connection at the interwell scale indicates that ground-water flow in the Biscayne aquifer is hetero-geneous, anisotropic, and mostly constrained to sec-ondary permeability caused by solution enlargement of depositional textures, bedding planes, cracks, and root molds. All of these dissolution features are classified as touching vugs and contribute to conduit flow. The size, shape, and spatial distribution of much of the touching vugs in the Pleistocene carbonate rocks of the Biscayne aquifer are related to rock-fabric facies that are best described by a stratigraphic framework composed of HFCs. Small-scale intergrain and separate-vug porosity (Lucia, 1999, p. 26) contributes to diffuse-carbonate ground-water flow through the limestone of the Bis-cayne aquifer. This small-scale porosity also is related to rock-fabric facies, and its relatively high volume suggests that it contains much of the ground-water stor-age for the Biscayne aquifer. Figure 39 shows a three-dimensional hydrogeologic model of the arrangement of three ground-water flow classes (GWFC2, GWFC3, and GWFC4) in much of the upper part of the Biscayne aquifer. Also, shown is the relation between the three ground-water flow classes and HFCs.
Presence of small-scale, semivertical conduits within the large-scale, horizontal conduit flow zones of the Biscayne aquifer suggests enlargement of pores by dissolution during downward flow of meteoric water through the flow paths in a vadose environment at times of low stands in relative sea level. It is possible that dissolution of carbonate grains and depositional textures was especially active during flow of meteoric water along the tops of low-permeability units bounded at their tops by flooding surfaces, creating lateral flow zones near or at the base of cycles. Numerous vadose events occurred during the deposition of the limestone
Hydrogeologic Framework 57
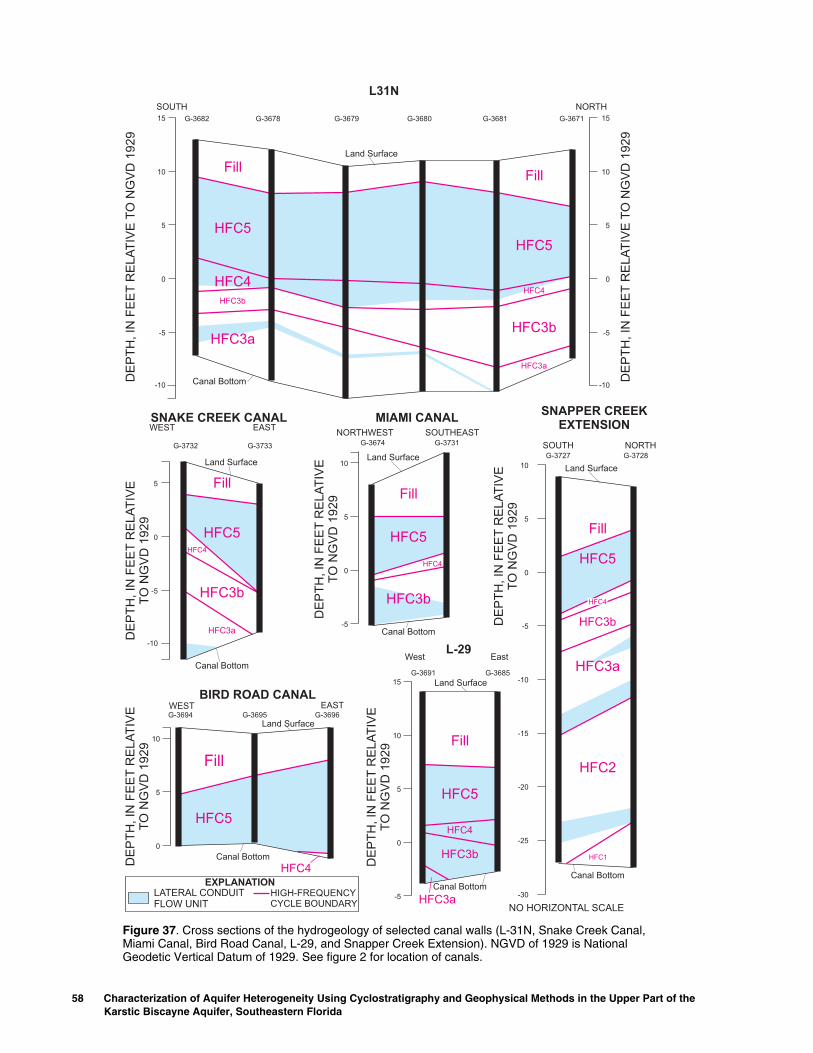
HFC5
HFC4
HFC3b
HFC3a
L31N
SOUTH
G-3679G-3678G-3682
Canal Bottom
Land Surface
Land SurfaceLand Surfa
Land Surface
Fill
DE
PT
H,
INF
EE
TR
EL
AT
IVE
TO
NG
VD
19
29
HIGH-FREQUENCYCYCLE BOUNDARY
EXPLANATIONLATERAL CONDUITFLOW UNIT
15
5
0
-5
10
-10
SNAKE CREEK CANALWEST EAST
G-3732 G-3733
Canal Bottom
HFC5HFC4
HFC3a
HFC3b
Fill5
0
-5
-10
DE
PT
H,
INF
EE
TR
EL
AT
IVE
TO
NG
VD
19
29
HF
HFC
MIAMNORTHWEST
G-3674
Canal
F
DE
PT
H,
INF
EE
TR
EL
AT
IVE
TO
NG
VD
19
29
5
0
-5
10
HFC5
BIRD ROAD CANALWESTG-3694 G-3695
Canal Bottom
EAST
Fill
G-3696
HFC4
DE
PT
H,
INF
EE
TR
EL
AT
IVE
TO
NG
VD
19
29
5
0
10
W
15
5
0
-5
10
DE
PT
H,
INF
EE
TR
EL
AT
IVE
TO
NG
VD
19
29
Figure 37. Cross sections of the hydrogeology of seleMiami Canal, Bird Road Canal, L-29, and Snapper CreGeodetic Vertical Datum of 1929. See figure 2 for loca
58 Characterization of Aquifer Heterogeneity Using CyclostratigKarstic Biscayne Aquifer, Southeastern Florida
NORTH
G-3671G-3681G-3680
ce
Land Surface
Land Surface
HFC5
HFC4
HFC3b
HFC3a
Fill
HFC2
HFC5
HFC3b
HFC3a
SNAPPER CREEKEXTENSION
NORTHG-3728G-3727
Canal Bottom
SOUTH
Fill
HFC4
HFC1
NO HORIZONTAL SCALE
DE
PT
H,
INF
EE
TR
EL
AT
IVE
TO
NG
VD
19
29
-30
5
0
-5
-10
-15
-20
-25
10
15
5
0
-5
10
-10
C5
HFC4
3b
I CANAL
G-3731
Bottom
SOUTHEAST
illD
EP
TH
,IN
FE
ET
RE
LA
TIV
ET
ON
GV
D1
92
9
HFC5
HFC4
HFC3b
HFC3a
L-29est
G-3691 G-3685
Canal Bottom
East
Fill
cted canal walls (L-31N, Snake Creek Canal, ek Extension). NGVD of 1929 is National tion of canals.
raphy and Geophysical Methods in the Upper Part of the

Hyd
rog
eolo
gic F
ramew
ork
59
Land Surface
and Surface
HFC3a
ARD/PENNSUCO CANAL
EAST
21 G-3722G-3723
South/West
1WEAST
G-3715 G-3683 G-3716
HORIZONTAL SCALE
al, C-4, and C1W). NGVD of
L-30N
HFC5
HFC4
HFC3b
HFC3a
NORTHSOUTH
G-3719G-3718
G-3717G-3724
Land Surface
Land Surface
LG-3673
Levee L30N
G-3690D
EP
TH
,IN
FE
ET
RE
LA
TIV
ET
ON
GV
D1929
Canal Bottom
Fill
HFC5
HFC4
HFC3b
HFC3a
Fill
HFC5
HFC3b
MIAMI-DADE-BROW
NORTH
G-3720 G-37
Canal Bottom
Fill
HFC5
HFC4
C-4WEST EAST
G-3686G-3687
G-3688 G-3692G-3689
Canal Bottom
Fill
C-WEST
G-3714
Canal Bottom
HFC5
HFC4
HFC3b
Fill
HFC3a
G-3682
HIGH-FREQUENCYCYCLE BOUNDARY
EXPLANATIONLATERAL CONDUITFLOW UNIT
NO
5
-5
-10
0
10
DE
PT
H,IN
FE
ET
RE
LA
TIV
ET
ON
GV
D1929
5
-5
-10
-15
0
15
10
20
DE
PT
H,IN
FE
ET
RE
LA
TIV
ET
ON
GV
D29
19
5
-5
-10
-15
0
10
HFC4
DE
PT
H,IN
FE
ET
RE
LA
TIV
ET
ON
GV
D1929
DE
PT
H,IN
FE
ET
RE
LA
TIV
ET
ON
GV
D29
19
5
0
10
5
-5
0
15
10
Figure 38. Cross sections of the hydrogeology of selected canal walls (L-30N, Miami-Dade-Broward/Pennsuco Can1929 is National Geodetic Vertical Datum of 1929. See figure 2 for location of canals.
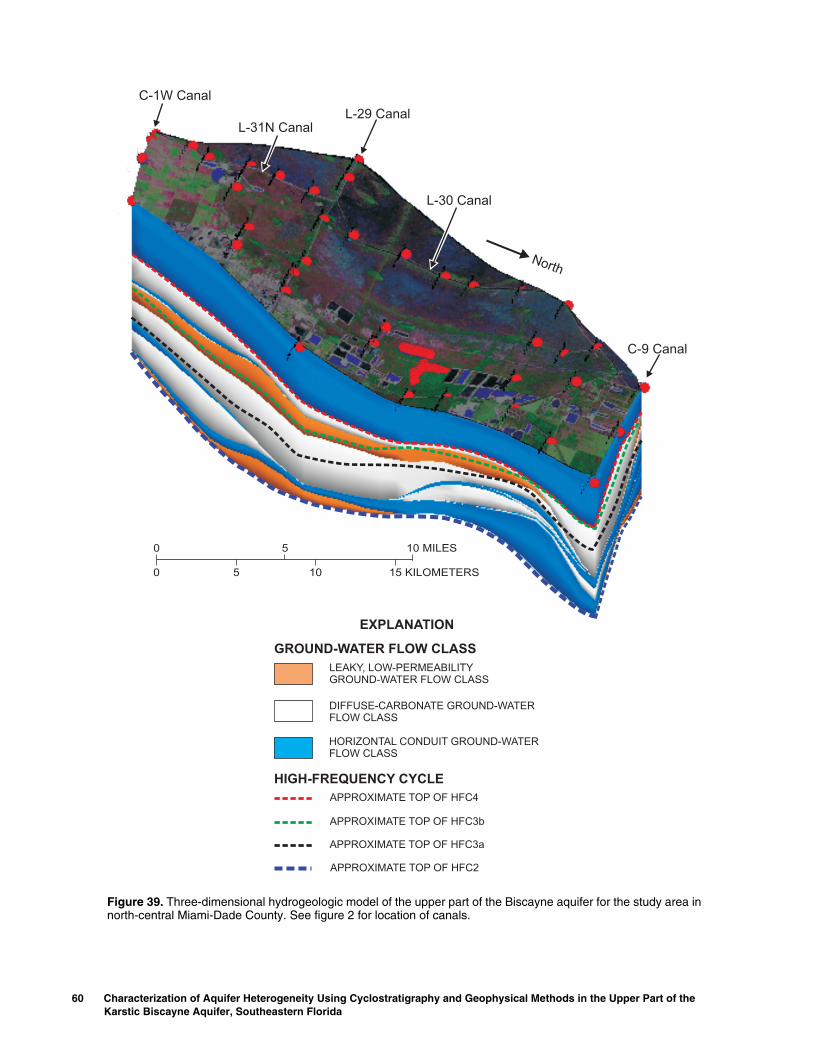
0
0
1
15 K
5
5 10
L-29 Cana
C-1W Canal
L-31N Canal
EXPLAN
DIFFUSE-CARBFLOW CLASS
HORIZONTAL CFLOW CLASS
APPROXIMATE
APPROXIMATE
APPROXIMATE
APPROXIMATE
GROUND-WATER FLO
HIGH-FREQUENCY C
LEAKY, LOW-PEGROUND-WATE
Figure 39. Three-dimensional hydrogeologic model of thenorth-central Miami-Dade County. See figure 2 for locatio
60 Characterization of Aquifer Heterogeneity Using CyclostratigKarstic Biscayne Aquifer, Southeastern Florida
North
0 MILES
ILOMETERS
l
C-9 Canal
L-30 Canal
ATION
ONATE GROUND-WATER
ONDUIT GROUND-WATER
TOP OF HFC2
TOP OF HFC4
TOP OF HFC3b
TOP OF HFC3a
W CLASS
YCLE
RMEABILITYR FLOW CLASS
upper part of the Biscayne aquifer for the study area in n of canals.
raphy and Geophysical Methods in the Upper Part of the
that comprises the Biscayne aquifer, each event related to distinct relative Quaternary sea-level falls (Perkins, 1977). Cumulative dissolution along flow paths was greatest in the lower high-frequency cycles (HFC1 and HFC2) of the Fort Thompson Formation, thus, contribut-ing to high permeability. Determining the precise ages of most of the cycles of the Miami Limestone and Fort Thompson Formation could permit calculation of the dissolution rates required to produce a network of touch-ing vugs, and thus, a karst aquifer. The paleontology data collected during this study did not produce precise ages.
SUMMARY AND CONCLUSIONS
In southeastern Florida, ground-water supply is augmented by surface storage of water in large-scale WCA’s and ENP. Surface water seeps into the Biscayne aquifer from the wetlands, then moves as ground water beneath a system of levees and canals on the eastern perimeter of the wetlands, and continues to flow toward agricultural, urban, and coastal areas to the east. Sustainable ground-water levels east of the wetlands are critical for maintaining water levels at water-supply wells and preventing saltwater intrusion at the coast. Managing the water levels in the WCA’s and ENP is critical for establishing rates and volumes of water seeping from these areas to the Biscayne aquifer. A realistic, conceptual hydrogeologic model of the Biscayne aquifer, especially its karst limestone, is criti-cal input to accurately model the movement of ground water for determining a water budget to meet natural, agricultural, and urban needs.
In 1998, the USGS, in cooperation with the SFWMD, initiated a study to provide a regional-scale hydrogeologic framework and characterization of two of the semiconfining units within the Biscayne aquifer. During the earliest stages of this study, the primary goal was to characterize and map a low-permeability unit in the upper part of the Biscayne aquifer that spans the base of the Miami Limestone and the top of the Fort Thompson Formation. Mapping of this unit was to serve as input into the SFWMD Lake Belt ground-water model. During the early phase of this investiga-tion, collected data suggested additional hydraulic compartmentalization of the Biscayne aquifer. This led to the need to characterize and delineate all candidate flow zones and relatively low-permeability units within the upper part of the Biscayne aquifer. That is, it was
realized that the historical view of the Biscayne did not adequately describe the porosity system and pathways of ground-water flow within the aquifer.
About 60 mi of GPR profiles were used to calculate depths to shallow geologic contacts and hydrogeologic units, image karst features, and produce qualitative views of the porosity distribution. Descriptions of the lithology, rock fabrics, and cyclostratigraphy, and inter-pretation of depositional environments of 50 test core-holes were linked to the geophysical interpretations to provide an accurate hydrogeologic framework. Molluscan and benthic foraminiferal paleontologic constraints guided interpretation of depositional environments represented by rock-fabric facies. Digital borehole images were used to help quantify large-scale vuggy porosity. Preliminary heat-pulse flowmeter data were coupled with the digital borehole image data to identify candidate ground-water flow zones.
Combined results of surface and borehole geophysics, and continuously drilled cores show that vuggy porosity, matrix porosity and hydraulic conduc-tivity of the karst limestone of the upper part of the Biscayne aquifer have a distribution that is highly heterogeneous and anisotropic. This distribution is mostly related to a relatively predictable vertical arrangement of depositional environments and deposi-tional textures within a carbonate architecture of HFCs. This high-resolution study of the shallow, karst Biscayne aquifer serves as a guide for developing improved and more accurate karst-aquifer models.
In general, the results of this study suggest that:
• The young (Tertiary) eogenetic karst limestone of the Biscayne aquifer has a dual-porosity system con-sisting of diffuse-carbonate and conduit flow zones.
• Porosity and permeability in the limestone of the Biscayne aquifer is heterogeneous and anisotropic.
• Rock-fabric facies and HFCs are two key scales for developing conceptual hydrogeologic models of shallow-water platform carbonate aquifers.
• Sixteen rock-fabric facies were identified for the Miami Limestone and Fort Thompson Formation, and these were organized into three depositional facies: (1) shallow shelf, (2) brackish, and (3) freshwater.
• Two types of HFCs are present in the Miami Lime-stone and Fort Thompson Formation in the Lake Belt area: (1) upward-shallowing brackish- or freshwater-capped cycles and (2) subtidal cycles.
Summary and Conclusions 61

• For young karst platform carbonates, GPR is an effective tool capable of providing a continuous two-dimensional delineation of karst features, cyclostratigraphy, and zones of relatively low and high porosity and permeability.
• Digital borehole images provide opportunities to characterize the size, shape and distribution of vuggy porosity and delineate candidate ground-water flow zones.
• A new hydrogeologic framework has been con-structed for the upper part of the Biscayne aquifer that is divided into four ground-water flow classes: (1) a low-permeability peat, muck, and marl ground-water flow class; (2) a high-permeability, horizontal conduit ground-water flow class; (3) a leaky, low-permeability ground-water flow class; and (4) a diffuse-carbonate ground-water flow class.
• The horizontal conduit flow class is characteristic of a major flow zone comprising much of the upper part of the Miami Limestone, and at least, three principal flow zones within HFC3a and HFC2 of the Fort Thompson Formation.
• In the upper part of the Fort Thompson Formation, conduit flow zones are best developed near or at the base of HFCs immediately above the marine flood-ing surfaces and are associated with dissolution of depositional textures within specific rock-fabric facies.
62 Characterization of Aquifer Heterogeneity Using CyclostratigKarstic Biscayne Aquifer, Southeastern Florida
• A semiconfining zone of low permeability spanning the basal Miami Limestone and upper part of the Fort Thompson Formation is typically leaky due to sec-ondary dissolution and enlargement of cracks, root molds, and associated paleokarstic surfaces.
• Within the upper part of the Fort Thompson Forma-tion, matrix porosity is principally lowest below flooding surfaces.
• Mapping indicates that all principal horizontal conduit flow zones have an extensive sheet-like three-dimensional geometry.
• The presence of the gastropods Planorbella duryild-isstoni, Planobella scalaris, Physa sp.(?), Pomacea paludosa Say, and Hydrobidae(?) is useful in distin-guishing freshwater limestone in the Fort Thompson Formation.
• A notable presence of archaiasinid and soritid benthic foraminifers in the peloid wackestone and packstone facies of HFC4 can be useful in distin-guishing this cycle from HFC5, both HFCs of the Miami Limestone.
• The paleontology data collected during this study did not result in precise ages and almost entirely range from Pliocene to Holocene.
SELECTED REFERENCES
Abbott, R.T., 1974, American seashells: New York, Van Nostrand Reinhold Company, 663 p.
Annan, A.P., and Davis, J.L., 1976, Impulse radar soundings in permafrost: Radio Science, v. 11, p. 383-394.
Ballard, R.F., 1983, Electromagnetic (radar) techniques applied to cavity detection: U.S. Army Corps of Engi-neers Water Way Experimental Station Technical Report GL-83-1, Report 5, 90 p.
Barr, G.L., 1993, Applications of ground penetrating radar methods in determining hydrogeologic conditions in a karst area, west-central Florida: U.S. Geological Survey Water-Resources Investigations Report 92-4141, 26 p.
Beck, B.F., and Wilson, W.L., 1988, Interpretation of ground penetrating radar profiles in karst terrane: Proceedings of the Second Conference on Environmental Problems in Karst Terranes and their Solutions, Nashville, Tenn., November 16-18, 1988, p. 347-367.
Benson, A.K., 1995, Applications of ground penetrating radar in assessing some geologic hazards: Examples of groundwater contamination, faults, and cavities: Journal of Applied Geophysics, v. 33, no. 1-3, p. 177-193.
Beres, Milan, Jr., and Haeni, F.P., 1991, Application of ground-penetrating radar methods in hydrogeologic studies: Ground Water, v. 29, no. 3, p. 375-386.
Beres, Milan, Jr., Luester, Marc, and Olivier, Raymond, 2001, Integration of ground-penetrating radar and microgravimetric methods to map shallow caves: Journal of Applied Geophysics v. 46, no. 4, p. 249-262.
Bock, W.D., Lynts, G.W., Smith S., and others, 1971, A symposium of Recent south Florida foraminifera: Miami Geological Society Memoir 1, 245 p.
Broecker, W.S., and Thurber, D.L., 1965, Uranium-series dating of corals and oolites from Bahaman and Florida Key limestones: Science, v. 149, no. 3679, p. 58-60.
raphy and Geophysical Methods in the Upper Part of the

Brown and Caldwell Environmental Engineers and Consult-ants, 1998, Remedial action-plan: Old South Dade Landfill: Report prepared for Miami-Dade County Department of Solid Waste Management, variously paged.
Bruno, M.C., Cunningham, K.J., and Perry, S.A., 2003, Copepod communities from surface and ground waters in the southern Everglades: Southeastern Naturalist, v. 2, no. 4, p. 523-546.
Causaras, C.R., 1987, Geology of the surficial aquifer sys-tem, Dade County, Florida: U.S. Geological Survey Water-Resources Investigations Report 86-4126, 240 p., 3 sheets.
Chen, Diazhao, Tucker, M.E., Jiang, Maosheng, and Zhu, Jingquan, 2001, Long-distance correlation between tec-tonic-controlled, isolated carbonate platforms by cyclo-stratigraphy and sequence stratigraphy in the Devonian of South China: Sedimentology, v. 48, no. 1, p. 57-78.
Crary, Steve, Dennis, Bob, Denoo, Stan, and others, 1987, Fracture detection with logs: The Technical Review, v. 35, p. 22-34.
Cressler, Alan, 1993, The caves of Dade County, Florida, in Georgia Underground: Dogwood City Grotto, Inc., of the National Speleological Society, Inc., v. 30, no. 3, p. 9-16.
Cunningham, K.J., 2000, Characterization of karst in Pleis-tocene upward-shallowing carbonate cycles of the upper Biscayne aquifer: Implications for restoration of the Everglades hydroperiod, southeastern Florida, USA (abstract): The International Symposium and Field Seminar on Present State and Future Trends of Karst Studies, September 17-26, 2000, Marmaris, Turkey.
-------- 2004, Application of ground-penetrating radar, digi-tal optical borehole images, and cores for characteriza-tion of porosity, hydraulic conductivity, and paleokarst in the Biscayne aquifer, southeastern Florida, USA: Journal of Applied Geophysics, v. 55, p. 61-76.
Cunningham, K.J., and Aviantara, Alexander, 2001, Charac-terization of the karstic Biscayne aquifer in southeastern Florida using ground-penetrating radar, digital optical borehole images and cores (abstract), in Kuniansky, E.L., ed., U.S. Geological Survey Karst Interest Group Proceedings, St. Petersburg, Florida, February 13-16, 2001: U.S. Geological Survey Water-Resources Investi-gations Report 01-4011, p. 134.
Cunningham, K.J., Carlson, J.I., and Hurley, N.F., 2004, New method for quantification of vuggy porosity from digital optical borehole images as applied to the karstic Pleistocene limestone of the Biscayne aquifer, south-eastern Florida: Journal of Applied Geophysics, v. 55, p. 77-90.
Cunningham, K.J., and Wright, J.M., 1998, Sequence-strati-graphic interpretation and aquifer characterization as critical processes in aquifer management: Local aquifer
remediation in the Biscayne aquifer, southeastern Florida: American Geophysical Union Fall Meeting, San Francisco, Calif., Abstracts volume, p. H242.
Dagallier, Guy, Laitinen, A.I., Malartre, Fabrice, and others, 2000, Ground penetrating radar application in a shallow marine Oxfordian limestone sequence located on the eastern flank of the Paris Basin, NE France: Sedimen-tary Geology, v. 130, no. 3-4, p. 149-165.
Davis, J.L., and Annan, A.P., 1989, Ground-penetrating radar for high-resolution mapping of soil and rock stratigraphy: Geophysical Prospect, v. 37, no. 5, p. 531-551.
Dunham, R.J., 1962, Classification of carbonate rocks according to depositional textures, in Ham, W.E., ed., Classification of carbonate rocks: American Association of Petroleum Geologists Memoir 1, p. 108-121.
Embry, A.F., and Klovan, J.E., 1971, A late Devonian reef tract on Northeastern Banks Island, N.W.T.: Bulletin of Canadian Petroleum Geology, v. 19, no. 4, p. 730-781.
Enos, Paul, 1977, Holocene sediment accumulations of the south Florida shelf margin, in Enos, Paul, and Perkins, R.D., eds., Quaternary sedimentation in south Florida, part II: Geological Society of America Memoir 147, p. 131-198.
-------- 1989, Islands in the bay—A key habitat of Florida Bay: Bulletin of Marine Science, v. 44, no. 1, p. 365-386.
Evans, C.C., 1984, Development of an ooid sand shoal complex: The importance of antecedent and syndeposi-tional topography, in Harris, P.H. ed., Carbonate sands–A core workshop: Society of Economic Petrologists and Mineralogists Core Workshop no. 5, p. 392-428.
Federal Register Notice, October 11, 1979, v. 44, no. 198.Fish, J.E., 1988, Hydrogeology, aquifer characteristics,
and ground-water flow of the surficial aquifer system, Broward County, Florida: U.S. Geological Survey Water-Resources Investigations Report 87-4034, 92 p.
Fish, J.E., and Stewart, Mark, 1991, Hydrogeology of the surficial aquifer system, Dade County, Florida: U.S. Geological Survey Water-Resources Investigations Report 80-4108, 50 p.
Galli, Gianni, 1991, Mangrove-generated structures and depositional model of the Pleistocene Fort Thompson Formation (Florida Plateau): Facies, v. 25, p. 297-314.
Genereux, David, and Guardiario, Jose, 1998, A canal draw-down experiment for determination of aquifer param-eters: Journal of Hydrologic Engineering, v. 3, no. 4, p. 294-302.
Geological Society of America, 1991, Rock color chart: Baltimore, Md., Munsell color.
Goldhammer, R.K., Dunn, P.A., and Hardie, L.A., 1987, High-frequency glacio-eustatic sea level oscillations with Milankovitch characteristics recorded in the Middle Triassic platform carbonates in northern Italy: American Journal of Science, v. 287, no. 9, p. 853-892.
Selected References 63
Grasmueck, Mark, 1996, 3-D ground-penetrating radar applied to fracture imaging in gneiss: Geophysics, v. 61, no. 4, p. 1050-1064.
Guardiario, J.D.A., Jr., 1996, Determination of hydraulic conductivity and dispersivity in the Biscayne aquifer, Taylor Slough, Everglades National Park: Miami, Flor-ida International University, M.S. Thesis, 195 p.
Halley, R.B., and Evans, C.C., 1983, The Miami Limestone: A guide to selected outcrops and their interpretation: Miami Geological Society, 67 p.
Heilprin, Angelo, 1887, Explorations on the west coast of Florida and in the Okeechobee wilderness: Philadelphia, Wagner Free Institute of Science, Transactions, v. 1.
Hickey, J.J., 1993, Characterizing secondary porosity of carbonate rocks using borehole video data [abstract]: Geological Society of America, Abstracts with Pro-grams, 25, Southeastern Section, p. 23.
Hoffmeister, J.E., Stockman, K.W., and Multer, H.G., 1967, Miami Limestone of Florida and its recent Bahamian counterpart: Geological Society of America Bulletin, v. 79, no. 2, p. 175-190.
Hunter, M.E., 1968, Molluscan guide fossils in the Late Miocene sediments of southern Florida: Gulf Coast Association of Geological Societies Transactions, v. 18, p. 439-450.
Hurley, N.F., Pantoja, David, and Zimmerman, R.A., 1999, Flow unit determination in a vuggy dolomite reservoir, Dagger Draw Field, New Mexico: Oslo, Norway. Trans-actions, June edition.
Hurley, N.F., Zimmerman, R.A., and Pantoja, David, 1998, Quantification of vuggy porosity in a dolomite reservoir from borehole images and core, Dagger Draw Field, New Mexico: Society of Petroleum Engineers Annual Technical Conference and Exhibition, New Orleans, La., Paper 49323, p. 789-802.
Jackson, J.A., ed., 1997, Glossary of geology (4th ed.): Alex-andria, Va., American Geological Institute, 769 p.
James, N.P., 1979, Shallowing upward sequences in carbon-ates, Chapter 10, in Walker, R.G., ed., Facies models: St. John’s, Geological Association of Canada, Geoscience Canada Reprint Series 1, p. 109-199.
Johnson, D.G., 1992, Use of ground-penetrating radar for water-table mapping, Brewster and Harwick, Massachu-setts: U.S. Geological Survey Water-Resources Investi-gations Report 90-4086, 27 p.
Kaufman, R.S., and Switanek, M.P., 1998, Confinement of the Biscayne aquifer in northwest Dade County, Florida: Geological Society of America 47th Annual Meeting Southeastern Section Abstracts with Programs, March 30-31, Charleston, W.V., p. 20.
Kerans, Charles, and Tinker, S.W., 1997, Sequence stratigra-phy and characterization of carbonate reservoirs: Society of Economic Paleontologist and Mineralogists Short Course Notes no. 40, 130 p.
64 Characterization of Aquifer Heterogeneity Using CyclostratigKarstic Biscayne Aquifer, Southeastern Florida
Kindinger, Jack, 2002, Lake Belt area: High-resolution seis-mic reflection survey, Miami-Dade County, Florida: U.S. Geological Survey Open-File Report, 02-325, 24 p.
Klein, Howard, and Sherwood, C.B., 1961, Hydrologic con-ditions in the vicinity of Levee 30, northern Dade County, Florida: Tallahassee, Florida Bureau of Geol-ogy Report of Investigations 24, 24 p.
Kruse, S.E., Schneider, J.C., Campagna, D.J., and others, 2000, Ground penetrating radar imaging of cap rock, caliche and carbonate strata: Journal of Applied Geo-physics, v. 43, no. 2-4, p. 239-249.
Lane, J.W. Jr., Buursink, M.L., Haeni, F.P., and Versteeg, R.J., 2000, Evaluation of ground-penetrating radar to detect free-phase hydrocarbons in fractured rocks—Results of numerical modeling and physical experi-ments: Ground Water, v. 38, no. 6, p. 929-938.
Lovell, M.A., Williamson, Gail, and Harvey, P.K., eds., 1999, Borehole imaging: Applications and case histo-ries: London, Geological Society, Special Publications, no. 159, 296 p.
Lucia, F.J., 1995, Rock-fabric/petrophysical classification of carbonate pore space for reservoir characterization: American Association Petroleum Geologists Bulletin, v. 79, no. 9, p. 1275-1300.
-------- 1999, Carbonate reservoir characterization: Berlin, Springer-Verlag, 226 p.
Lyons, W.G., 1992, Caloosahatchee-age and younger mol-luscan assemblages at APAC mine, Sarasota County, Florida: Tallahassee, Florida Geological Survey Special Publication No. 36, p. 133-160.
Mansfield, W.C., 1930, Miocene gastropods and scaphopods of the Choctawhatchee Formation of Florida: Tallahas-see, Florida Geological Survey Bulletin No. 3, 142 p.
Martinez, Alex, Kruger, J. M., and Franseen, E.K., 1998, Utility of ground-penetrating radar in near-surface, high-resolution imaging of Lansing-Kansas City (Pennsylvanian) Limestone reservoir analogs, in Current research in earth sciences: Kansas Geological Survey Bulletin 241, pt. 3, p. 43-59.
McMechan, G.A., Loucks, R.G., Zeng, Xiaoxian, and Mescher, Paul, 1998, Ground penetrating radar imaging of a collapsed paleocave system in the Ellenburger dolo-mite, central Texas: Journal of Applied Geophysics, v. 39, no. 1, p. 1-10.
Mitchum, Jr., R.M., Vail, P.R., and Sangree, J.B., 1977, Seis-mic stratigraphy and global changes of sea level, part 6: Stratigraphic interpretation of seismic reflection patterns in depositional sequences, in Payton, C.E. ed., Seismic stratigraphy—Applications to hydrocarbon exploration: American Association of Petroleum Geologists Memoir 26, p. 117-133.
raphy and Geophysical Methods in the Upper Part of the
Mitterer, R.M., 1975, Ages and diagenetic temperatures of Pleistocene deposits of Florida based on isoleucine epimerization in Mercenaria: Earth and Planetary Science Letters, v. 28, p. 275-282.
Multer, H.G., Gischler, Eberhard, Lundberg, Joyce, and oth-ers, 2002, Key Largo Limestone revisited: Pleistocene shelf-edge facies, Florida Keys, USA: Facies, v. 46, p. 229-272.
Multer, H.G., and Hoffmeister, J.E., 1968, Subaerial lami-nated crusts of the Florida Keys: Geological Society of America Bulletin, v. 79, no. 2, p. 183-192.
National Oceanic and Atmospheric Administration, 2002, NOAA’s South Florida Ecosystem Research and Moni-toring Program: accessed November 19, 2002, at http://www.aoml.noaa.gov/ocd/sferpm/sub.html .
Nemeth, M.S., Wilcox, W.M., and Solo-Gabriele, H.M., 2000, Evaluation of the use of reach transmissivity to quantify leakage beneath Levee 31N, Miami-Dade County, Florida: U.S. Geological Survey Water-Resources Investigations Report 00-4066, 80 p.
Newberry, B.M, Grace, L.M., and Stief, D.D., 1996, Analy-sis of carbonate dual porosity systems from borehole electrical images: Society of Petroleum Engineers Per-mian Basin Oil and Gas Recovery Conference, Midland, Texas, Paper 35158, p. 123-125.
Osmond, J.K., Carpenter, J.R., and Windom, H.L., 1965, 230Th/234U age of the Pleistocene corals and oolites of Florida: Journal of Geophysical Research, v. 70, no. 8, p. 1843-1847.
Paillet, F.L., 2000, A field technique for estimating aquifer parameters using flow log data: Ground Water, v. 38, no. 4, p. 510-521.
Paillet, F.L., and Reese, R.S., 2000, Integrating borehole logs and aquifer tests in aquifer characterization: Ground Water, v. 38, no. 5, p. 713-725.
Parker, G.G., 1951, Geologic and hydrologic factors in the perennial yield of the Biscayne aquifer: American Water Works Association Journal, v. 43, no. 10, p. 817-835.
Parker, G.G., and Cooke, C.W., 1944, Late Cenozoic geol-ogy of southern Florida with a discussion of the ground water: Tallahassee, Florida Geological Survey Bulletin 27, 119 p.
Parker, G.G., Ferguson, G.E., Love, S.K., and others, 1955, Water resources of southeastern Florida: U.S. Geologi-cal Survey Water-Supply Paper 1255, 965 p.
Perkins, R.D., 1977, Depositional framework of Pleistocene rocks in south Florida, in Enos, Paul, and Perkins, R.D., eds., Quaternary sedimentation in south Florida, part II: Geological Society of America Memoir 147, p. 131-198.
Poag, C.W., 1981, Ecologic atlas of benthic foraminifera of the Gulf of Mexico: New York, Academic Press, 174 p.
Posamentier, H.W., and Allen, G.P., 1999, Siliciclastic sequence stratigraphy—Concepts and applications: Society of Economic Paleontologists and Mineralogists (Society for Sedimentary Geology) Concepts in Sedi-mentology and Paleontology no. 7, 204 p.
Reese, R.S., and Cunningham, K.J., 2000, Hydrogeology of the gray limestone aquifer in southern Florida: U.S. Geological Survey Water-Resources Investigations Report 99-4213, 244 p.
Renken, R.A., Ward, W.C., Gill, I.P., and others, 2002, Geol-ogy and hydrogeology of the Caribbean Islands aquifer system of the commonwealth of Puerto Rico and the U.S. Virgin Islands: U.S. Geological Survey Profes-sional Paper 1419, 139 p.
Rose, P.R., and Lidz, Barbara, 1977, Diagnostic foramin-iferal assemblages of shallow-water modern environ-ments: South Florida and the Bahamas: Sedimenta VI, University of Miami, Florida, 55 p.
Scott, T.M., 1992, Coastal Plains stratigraphy: The dichot-omy of biostratigraphy and lithostratigraphy—A philo-sophical approach to an old problem, in Scott, T.M., and Missimer, T.M., eds., Plio-Pleistocene stratigraphy and paleontology of southern Florida: Tallahassee, Florida Geological Survey Special Publication No. 36, p. 21-25.
-------- 2001, Text to accompany the geologic map of Florida: Tallahassee, Florida Geological Survey Open-File Report no. 80, 30 p.
Shinn, E.A., and Corcoran, Eugene, 1988, Contamination by landfill leachate, south Biscayne Bay, Florida: Final report to Sea Grant, University of Florida, 11 p.
Smith, D.G., and Jol, H.M., 1992, Ground-penetrating radar investigation of a Lake Bonneville delta, Provo level, Brigham City, Utah: Geology v. 20, no. 12, p. 1083-1086.
Sonenshein, R.S., 2001, Methods to quantify seepage beneath Levee 30, Miami-Dade County, Florida: U.S. Geological Survey Water-Resources Investigations Report 01-4074, 36 p.
Telford, W.M., Geldart, L.P., and Sheriff, R.E., 1990, Applied geophysics (2d ed.): New York, N.Y., Cam-bridge University Press, 770 p.
Thrailkill, J.V., 1976, Carbonate equilibria in karst waters, in Karst hydrology and water resources, proceedings of the U.S.-Yugoslavian Symposium, Dubrovnik, June 2-7, 1975: Fort Collins, Colorado, Water Resources Publica-tions, p. 745-771.
Vacher, H.L., and Mylroie, J.E., 2002, Eogenetic karst from the perspective of an equivalent porous medium: Carbonates and Evaporites, v. 17, no. 2, p. 182-196.
Selected References 65
van Overmeeren, R.A., 1998, Radar facies of unconsolidated sediments in The Netherlands: A radar stratigraphy interpretation method for hydrogeology: Journal of Applied Geophysics, v. 40, no. 1-3, p. 1-18.
Ward, W.C., Cunningham, K.J., Renken, R.A., Wacker, M.A., and Carlson, J.I., 2003, Sequence-stratigraphic analysis of the Regional Observation Monitoring Pro-gram (ROMP) 29A test corehole and its relation to car-bonate porosity and regional transmissivity in the Floridan aquifer system, Highlands County, Florida: U.S. Geological Survey Open-File Report 03-201, 34 p.
66 Characterization of Aquifer Heterogeneity Using CyclostratigKarstic Biscayne Aquifer, Southeastern Florida
Warmke, G.L., and Abbott, R.T., 1962, Caribbean seashells: Narberth, Penn., Livingston Publishing Company, 348 p.
Wassum, L.D., 2000, Lithostratigraphic and hydrogeologic evaluation of the upper Biscayne aquifer in north-central Miami-Dade County, Florida: Miami, Florida Interna-tional University, Unpublished M.S. thesis, 170 p.
Williams, J.H., and Johnson, C.D., 2000, Borehole-wall imaging with acoustic and optical televiewers for frac-tured-bedrock aquifer investigations: Proceedings 7th Minerals and Geotechnology Logging Symposium, Golden, CO, October 24-26, 2000, p. 43-53.
raphy and Geophysical Methods in the Upper Part of the