characterization of ambient volatile organic compounds
TRANSCRIPT

Atmos. Chem. Phys., 21, 15239–15257, 2021https://doi.org/10.5194/acp-21-15239-2021© Author(s) 2021. This work is distributed underthe Creative Commons Attribution 4.0 License.
Characterization of ambient volatile organic compounds, sourceapportionment, and the ozone–NOx–VOC sensitivities in a heavilypolluted megacity of central China: effect of sporting events andemission reductionsShijie Yu1,2,�, Fangcheng Su1,2,�, Shasha Yin2,3, Shenbo Wang2,3, Ruixin Xu2,3, Bing He4, Xiangge Fan4,Minghao Yuan4, and Ruiqin Zhang2,3
1College of Chemistry, Zhengzhou University, Zhengzhou 450001, China2Institute of Environmental Sciences, Zhengzhou University, Zhengzhou 450001, China3School of Ecology and Environment, Zhengzhou University, Zhengzhou, 450001, China4Environmental Protection Monitoring Center Station of Zhengzhou, Zhengzhou 450007, China�These authors contributed equally to this work.
Correspondence: Ruiqin Zhang ([email protected])
Received: 6 April 2021 – Discussion started: 21 May 2021Revised: 30 August 2021 – Accepted: 6 September 2021 – Published: 13 October 2021
Abstract. The implementation of strict emission control dur-ing the 11th National Minority Games (NMG) in September2019 provided a valuable opportunity to assess the impact ofsuch emission controls on the characteristics of VOCs andother air pollutants. Here, we investigated the characteris-tics of VOCs and the O3–NOx–VOC sensitivity comprehen-sively in Zhengzhou before, during, and after the NMG bydelivering field measurements combined with WRF-CMAQ(Weather Research and Forecasting Community MultiscaleAir Quality) model simulations. The average mixing ratios ofVOCs during the control periods were 121± 55 µgm−3 anddecreased by about 19 % and 11 % before and after emis-sion reduction. The ozone precursors (NOx) also decreasedsignificantly during the control period; however, the ozonepollution was severe during the entire observation period.Positive matrix factorization analysis indicated seven ma-jor sources of ambient VOCs, including coal combustion,biomass burning, vehicle exhausts, industrial processes, bio-genic emissions, solvent utilization, and liquefied petroleumgas (LPG). The results show that the major source emissions,such as coal combustion and solvent utilization, were sig-nificantly reduced during the control period. As for ozoneformation potential (OFP), the value during the control pe-riod was 183± 115 µgm−3, which was 0.23 and 0.17 timeslower than before and after the control period, respectively.
Solvent utilization and combustion controls were the mostimportant measures taken to reduce OFP during the NMGperiod. Control policies can effectively reduce carcinogenicrisk. However, non-cancer risks of ambient VOC exposureswere all exceeding the safe level (hazard quotient= 1) dur-ing the sampling periods, and emphasis on the reduction ofacrolein emissions was needed. In addition, the WRF-CMAQmodel simulation indicated that O3 formation was controlledby VOCs in Zhengzhou. The results of the Empirical Ki-netic Modeling Approach showed that the NOx reduction inZhengzhou might lead to higher ozone pollution. It is sug-gested that reduction ratios of the precursors (VOCs : NOx)should be more than 2, which can effectively alleviate ozonepollution.
1 Introduction
Volatile organic compounds (VOCs), important precursorsfor the generation of near-surface ozone (O3) and secondaryorganic aerosols (SOAs), have received widespread attentionin the world (Baudic et al., 2016; Sahu et al., 2017; Xiong andDu, 2020; Yadav et al., 2019; Yang et al., 2019a; Zeng et al.,2018; Zhang et al., 2015). Moreover, some VOCs have ad-
Published by Copernicus Publications on behalf of the European Geosciences Union.

15240 S. Yu et al.: VOC characteristics during the control period
verse impacts on human health, which induce cancer directlyand are associated with increased long-term health risks (Huet al., 2018; Jaars et al., 2018). Since the beginning of the 21stcentury, heavy air pollution events have frequently occurredin China, characterized by regional and complex air pollution(R. Li et al., 2019; Ma et al., 2019). Therefore, the improve-ment of air quality has become a hot issue, especially forlarge-scale activities held in megacities, and how to ensureair quality has become the key to success of the activities.
Air quality assurance refers to the systematic emission re-duction and control measures of pollution sources to ensureair quality during special activities. Temporarily enhancedcontrol measures could provide a scenario to analyze the re-sponse relationship between emission sources of pollutantsand ambient air quality. Many scholars have carried out re-search on pollutant characteristics and their source appor-tionment under different control measures for a variety ofspecial activities. Those studies included the 2008 BeijingOlympic Games (Schleicher et al., 2012; Wang et al., 2009),the 2010 World Expo in Shanghai (Chan et al., 2015; Wanget al., 2014), the 2014 Asia-Pacific Economic CooperationSummit in Beijing (Li et al., 2015, 2017), the 70th China Vic-tory Day Parade anniversary (Huang et al., 2018; Ren et al.,2019), and the G20 summit in Hangzhou (H. Li et al., 2019;Zhang et al., 2020). These studies all suggested that enhancedemission-reduction strategies had significant effects on im-proving air quality. O3 pollution might not be improved andeven worsen during the control period (Xu et al., 2019). Therelationship between O3 and its precursors is nonlinear, andunreasonable reduction of O3 precursors might not necessar-ily alleviate O3 pollution. Hence, it is necessary to achievean in-depth understanding of the mechanisms involved in O3formation, especially under the emission-reduction scenario.However, studies on these special events have mostly focusedon particulate matter and its components and to a much lesserdegree on ozone and VOCs. In particular, the discussion onO3 sensitivity and implications for control strategies throughthe combination of model- and observation-based methods isstill lacking. Furthermore, these studies mainly focused on afew metropolises in China, especially in the three most de-veloped regions, the Beijing–Tianjin–Hebei (BTH) region,the Yangtze River Delta (YRD) region, and the Pearl RiverDelta (PRD) region.
From 8–16 September 2019, the 11th National Minor-ity Games (NMG) was held in Zhengzhou, China. As thehost city, Zhengzhou took emergency pollution control mea-sures in the city and neighboring regions from 26 Augustto 18 September for enhancing air quality during the NMGperiod. Considering the ozone pollution is the main type ofpollution in the region in September (Yu et al., 2020), theZhengzhou municipal government focused on the emissionreduction of VOCs and NOx to alleviate O3 pollution. Basedon the bottom-up emission inventories and observation-basedsource apportionment, major anthropogenic sources of VOCsin the area include vehicular exhaust, liquefied petroleum gas
(LPG) evaporation, solvent usage, and industrial emissions(Bai et al., 2020; B. Li et al., 2019). Thus, they were the targetemission sources when temporary invention measures wereadopted for controlling air pollution during the NMG period.A detailed description of the control measures is shown inTable S1 in the Supplement. It is an excellent opportunity todetermine the effects of emission control policies using thereal atmosphere as a natural laboratory. Therefore, it is nec-essary to investigate VOC characteristics and sources, as wellas their effects on ozone production before, during, and afterthe control period.
This study measured 106 VOC species using an online gaschromatograph–mass spectrometer with a flame ionizationdetector (GC-MS/FID). Meanwhile, the Weather Researchand Forecasting Community Multiscale Air Quality (WRF-CMAQ) model was used to investigate the nonlinearity of O3response to precursor reductions. The main objectives of thisstudy are to (1) analyze the effects of emergent emission-reduction strategies on the VOC characteristics; (2) identifythe crucial sources of VOCs in Zhengzhou and their changesduring the NMG period; (3) investigate the contribution toozone formation and risk assessment under control measures;and (4) assess the O3–NOx–VOC sensitivity and proposecontrol strategies for ozone episodes.
2 Methodology
2.1 Site description and chemical analysis
The sampling site is located on the rooftop of a four-storybuilding at the municipal environmental monitoring station(MEM; 113.61◦ E, 34.75◦ N), about 6.6 km away from theZhengzhou Olympic Sports Center (Fig. S1 in the Supple-ment). The surrounding area of the sampling site is mainly acommercial and residential district, and the station is 300 mwest of Qinling Road and 200 m south of Zhongyuan Road.No significant industrial sources were present around thesampling sites. The above-mentioned two roads carry veryheavy traffic. Accordingly, mobile sources may contributemore to the VOC concentrations of the site.
VOC samples were collected from 6 August to 30 Septem-ber 2019 and were divided into three periods, including thepre-NMG period (6–25 August), the NMG period (26 Augustto 18 September), and the post-NMG period (19–30 Septem-ber). By comparing the characteristics of VOC pollution dur-ing the three periods, the effects of control policies by gov-ernment can clearly be identified and assessed.
It should be pointed out that the MEM station is locatedin the air monitoring network operated by Zhengzhou en-vironmental monitoring center. The meteorological param-eters (temperature, relative humidity, atmospheric pressure,wind direction, and wind speed) and trace gases (O3, NO,and NOx) were observed at the sampling site simultaneously.
Atmos. Chem. Phys., 21, 15239–15257, 2021 https://doi.org/10.5194/acp-21-15239-2021

S. Yu et al.: VOC characteristics during the control period 15241
Information detailing relevant equipment was described byB. Li et al. (2019).
Ambient VOCs were collected and analyzed continuouslyusing an online GC-MS/FID, and the time resolution is 1 h(TH-PKU 300B, Wuhan Tianhong Instrument Co. China).This measurement was described by Li et al. (2018). Briefly,this system has two gas channels and dual detectors, in whichthe C2–C5 non-methane hydrocarbons (NMHCs) were sepa-rated on a PLOT Al2O3 column (15 m× 0.32 mm× 6.0 µm,Dikma Technologies, Beijing, China) and quantified byFID, while the other species were separated on a DB-624column (60 m× 0.25 mm× 1.4 µm, Agilent Technologies,Santa Clara, CA, USA) and detected by a mass selective de-tector with a Deans switch.
To ensure the validity and reliability of observation data,these chemical analyses were subjected to quality assuranceand quality control procedures. We used external and inter-nal standard methods to quantify the C2–C5 and C5–C12compounds, respectively. Before monitoring, the standardcurves of five concentrations (0.4–8 ppbv) were made usingPAMS (photochemical assessment monitoring stations) stan-dard gas, TO-15 Calibration Standards (US EPA, 1999), andfour internal standards, including bromochloromethane, 1,4-difluorobenzene, chlorobenzene-d5, and bromofluoroben-zene. The above standard gases and internal standard gaseswere provided by Apel Riemer Environmental, USA. Inaddition, we input 4 ppbv PAMS+TO-15 standard gas at00:00 LST (local standard time) every day to calibrate thedata and check the stability. The coefficients of determi-nation (R2) of calibration curves were mostly above 0.99,and the method detection limit (MDL) ranged from 0.004 to0.36 µgm−3 for each species. A total of 106 VOC specieswere detected, including alkanes (29), alkenes (11), aromat-ics (17), halocarbons (35), oxygenated VOCs (OVOCs) (12),acetylene, and carbon disulfide (Table S2 in the Supplement).
2.2 WRF-CMAQ model
The WRF-CMAQ modeling system was applied to simu-late ozone concentration and investigate O3 sensitivity inthis study. The modeling system has been widely usedfor regional-scale air quality studies (Byun et al., 1999;Chemel et al.,2014), and more details can be found at http://cmascenter.org/cmaq/ (last access: 10 October 2021).
In this paper, the simulation period was from 00:00 LSTon 5 August 2019 to 23:00 LST on 30 September 2019,which corresponded to the NMG sampling periods. To elim-inate the impact of the initial conditions, a 5 d spin-up periodwas set in the simulation. We applied a four-nested domainwith a grid resolution of 36 km× 36 km, 12 km× 12 km,4 km× 4 km, and 1 km× 1 km, respectively (as shown inFig. S2 in the Supplement). The gridded anthropogenicemission inventory by Tsinghua University was applied inCMAQ, and the local emission inventory of Henan Provincewas also input into the model (Bai et al., 2020). These mod-
eling systems have been successfully used in previous sim-ulations by Zhang et al. (2014) and N. Wang et al. (2019).The results of WRF-CMAQ model evaluation in Zhangzhouwere reported in our previous studies (Su et al., 2021).
The CMAQ developed by the US EPA was used to sim-ulate the ozone pollution processes in Zhengzhou in Augustand September 2019. The sensitivity of emission sources toozone pollution in Zhengzhou was analyzed using the DDM-3D source sensitivity identification tool (Hakami et al.,2007).
2.3 Source apportionment using the PMF model
Positive matrix factorization (PMF) analysis of VOCs wasperformed with the US EPA PMF 5.0 program; this receptormodel is widely used for source analysis. Detailed informa-tion about this method is described in the user manual andrelated literature (Norris et al., 2014; Xiong and Du, 2020;Yenisoy-Karakas et al., 2020).
It must be said that not all of the VOC species were used inthe PMF analysis. According to previous studies, the princi-ples for VOC species choice are listed as follows (Hui et al.,2019): (1) species with more than 25 % data missing or thatfell below the MDLs were rejected; (2) species with a signal-to-noise ratio lower than 1.5 were excluded; and (3) specieswith representative source tracers of emission sources wereretained. Eventually, a total of 42 VOC species were selectedfor the source apportionment analysis. In this study, a seven-factor solution was chosen in the PMF analysis based on twoparameters (Ulbrich et al., 2009): (1) Qtrue/Qrobust values and(2) Qtrue/Qtheoretical values (Fig. S3 in the Supplement).
2.4 Potential source contribution function (PSCF)
The potential source contribution function (PSCF) is a func-tion with conditional probability for calculating backwardtrajectories and identifying potential source regions. The de-tailed descriptions of this method were described by Bressiet al. (2014) and Waked et al. (2014). Briefly, PSCF analysisis normally used to identify possible source areas of pollu-tants, such as ozone, NOx, and VOCs. PSCF calculates theprobability that a source is located at latitude i and longi-tude j as
PSCFij =mij
nij
, (1)
where nij is the number of times that the trajectories passedthrough the cell (i,j ), and mij is the number of times that asource concentration was high when the trajectories passedthrough the cell (i,j ) (C. Song et al., 2019). In order to re-duce the uncertainty caused by decreasing a small nij value,
https://doi.org/10.5194/acp-21-15239-2021 Atmos. Chem. Phys., 21, 15239–15257, 2021

15242 S. Yu et al.: VOC characteristics during the control period
a Wij function was used in this study as calculated by Eq. (2):
Wij =
1.0, 3nave < nij
0.7, 1.5nave < nij ≤ 3nave
0.4, 1.0nave < nij ≤ 1.5nave
0.2, nij ≤ nave.
(2)
In this study, the PSCFs were calculated by applying theTrajStat plugins on MeteInfoMap software version 1.4.4. The48 h backward trajectories arriving at Zhengzhou with a tra-jectory height of 200 m were calculated every hour (00:00–23:00 LT, local time). The studied domain was in the rangeof 15 to 65◦ N and 85 to 145◦ E in a grid of 0.1◦× 0.1◦ cells,which contains almost all regions overlaid with entire airflowtransport pathways.
2.5 Calculation of O3 formation potential
To understand the impact of the VOC species on ozone for-mation, ozone formation potential (OFP) was used, employ-ing the following equation (Carter, 2010a):
OFPi = [VOC]i ·MIRi, (3)
where [VOC]i is the mass concentration of each VOC, withunits of milligrams per cubic meter (mgm−3), and MIR is themaximum incremental reactivity (gO3 per gram of VOC);the MIR value of each VOC is obtained from Carter (1994).
2.6 Health risk assessment
The risk assessment derived from the guidelines proposed bythe US EPA (2009) was used to evaluate the adverse healtheffects of each identified VOC in ambient air to human healthand evaluate the impact of emission reduction on health risks.In this paper, the carcinogenic and non-carcinogenic riskswere calculated to assess the impacts of VOCs on humanhealth, using Eqs. (4)–(7).
Risk= IUR ·EC (4)EC= (CA ·ET ·EF ·ED)/AT (5)HQ= EC/(RfC · 1000) (6)
HI=∑
HQi, (7)
where IUR is the estimated unit risk value (m3 µg−1); EC isthe exposure concentration (mgm−3); CA is the environmen-tal concentration (µgm−3); ET is the exposure time (hd−1);EF is the exposure frequency (dyr−1); ED is the exposuretime (years); AT is the average time (h); RfC is the refer-ence concentration (mgm−3); HQ is the non-cancer inhala-tion hazard quotient; and HI is the hazard index. Risk proba-bility values, including RfC and IUR, were obtained throughthe risk model calculator established by the University ofTennessee (RAIS, 2016) and are listed in Table S3 in theSupplement.
Out of all measured species in this paper, only 46 VOCspecies with known toxicity values were considered, includ-ing 44 noncarcinogenic species and 21 carcinogenic species.Target VOCs and associated toxicity values of health risk as-sessment are presented in Table S4 in the Supplement.
3 Results and discussion
3.1 Overall observations
3.1.1 Characteristics of O3 and other pollution gases
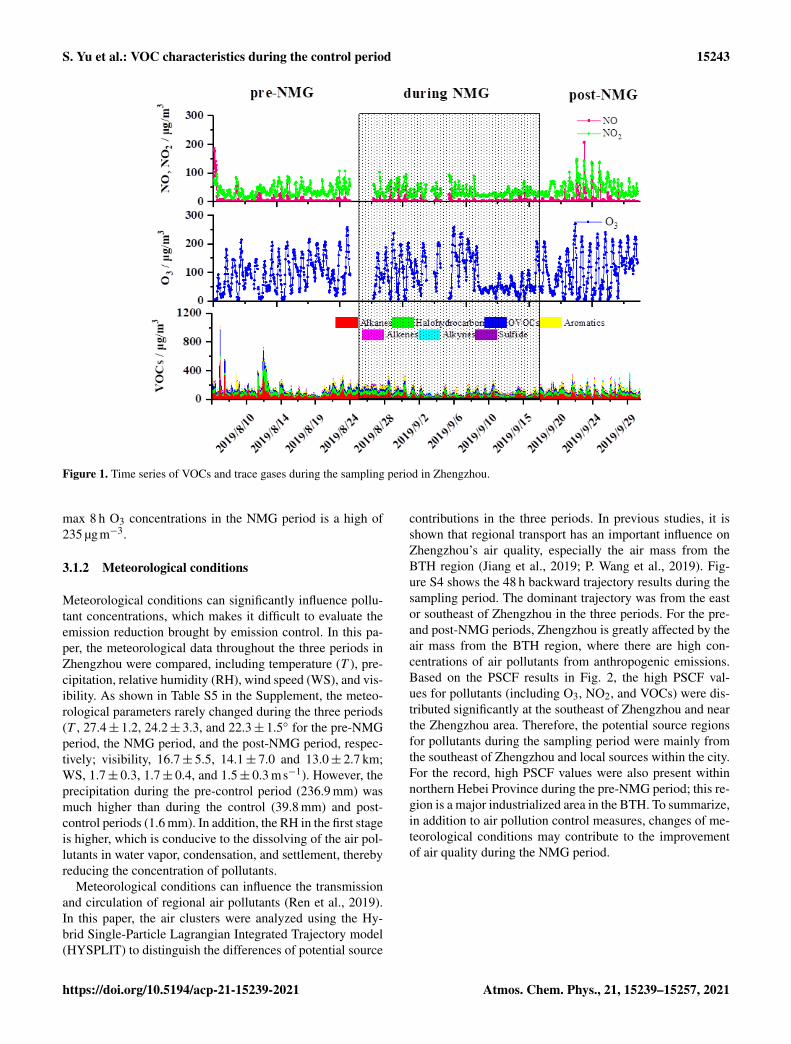
Figure 1 shows the temporal trends of the O3 and other pol-lutant mixing ratios during the sampling period. During thepre-NMG period, the highest O3 hourly concentration was252 µgm−3 at 15:00 LST on 23 August; meanwhile the max8 h O3 value also appeared on this day (219 µgm−3). In addi-tion, max 8 h O3 concentrations were present on a total of 7 d,exceeding the ambient air quality standard (GB 3095-2012)Grade II standard of 160 µgm−3. At this stage, the ozonepollution cause concern as the days exceeding the standardaccounted for 50 %. The highest hourly concentrations ofVOCs and NOx were 1017 and 357 µgm−3, with a meanconcentration of 150± 93 and 49± 46 µgm−3, respectively.Higher O3 precursor concentrations were observed, whichmay be an important factor leading to serious photochem-istry pollution.
During the control period, the O3 precursor concentrationsshowed a decreasing trend, with a mean concentration of121± 55 µgm−3 VOCs and 39± 26 µgm−3 NOx. However,the ozone pollution was not dramatically alleviated; and mildand moderate O3 pollution levels accounted for 52 % and10 %, respectively, during the NMG period according to GB3095-2012. The phenomenon has been reported that photo-chemistry is still severe under emergency emission-reductionstrategies (R. Li et al., 2019). Due to the highly nonlin-ear relationships between ozone and its precursors, it is notstraightforward to mitigate ozone pollution by reducing theemissions of VOCs and NOx (Tan et al., 2018; S. Wang et al.,2019). A special phenomenon needs to be pointed out that theozone concentration during the evening peak is much higherthan that in the pre-NMG period. The weak titration effectmay be the main reason for the phenomena above (Chi et al.,2018; Zou et al., 2019). At the end of the control period, theconcentration of precursors increased rapidly, and NOx con-centration increased by nearly 1.6 times compared with thecontrol stage. At the same time, the ozone pollution was stillsevere; the proportions of mild and moderate pollution dayswere 83 % and 8 %, respectively.
On the whole, the concentration of ozone precursors de-creased during the control period (as shown in Fig.S4), andthe ozone pollution was severe during the entire observa-tion period. It should be noted that the maximum value of
Atmos. Chem. Phys., 21, 15239–15257, 2021 https://doi.org/10.5194/acp-21-15239-2021
S. Yu et al.: VOC characteristics during the control period 15243
Figure 1. Time series of VOCs and trace gases during the sampling period in Zhengzhou.
max 8 h O3 concentrations in the NMG period is a high of235 µgm−3.
3.1.2 Meteorological conditions
Meteorological conditions can significantly influence pollu-tant concentrations, which makes it difficult to evaluate theemission reduction brought by emission control. In this pa-per, the meteorological data throughout the three periods inZhengzhou were compared, including temperature (T ), pre-cipitation, relative humidity (RH), wind speed (WS), and vis-ibility. As shown in Table S5 in the Supplement, the meteo-rological parameters rarely changed during the three periods(T , 27.4± 1.2, 24.2± 3.3, and 22.3± 1.5◦ for the pre-NMGperiod, the NMG period, and the post-NMG period, respec-tively; visibility, 16.7± 5.5, 14.1± 7.0 and 13.0± 2.7 km;WS, 1.7± 0.3, 1.7± 0.4, and 1.5± 0.3 ms−1). However, theprecipitation during the pre-control period (236.9 mm) wasmuch higher than during the control (39.8 mm) and post-control periods (1.6 mm). In addition, the RH in the first stageis higher, which is conducive to the dissolving of the air pol-lutants in water vapor, condensation, and settlement, therebyreducing the concentration of pollutants.
Meteorological conditions can influence the transmissionand circulation of regional air pollutants (Ren et al., 2019).In this paper, the air clusters were analyzed using the Hy-brid Single-Particle Lagrangian Integrated Trajectory model(HYSPLIT) to distinguish the differences of potential source
contributions in the three periods. In previous studies, it isshown that regional transport has an important influence onZhengzhou’s air quality, especially the air mass from theBTH region (Jiang et al., 2019; P. Wang et al., 2019). Fig-ure S4 shows the 48 h backward trajectory results during thesampling period. The dominant trajectory was from the eastor southeast of Zhengzhou in the three periods. For the pre-and post-NMG periods, Zhengzhou is greatly affected by theair mass from the BTH region, where there are high con-centrations of air pollutants from anthropogenic emissions.Based on the PSCF results in Fig. 2, the high PSCF val-ues for pollutants (including O3, NO2, and VOCs) were dis-tributed significantly at the southeast of Zhengzhou and nearthe Zhengzhou area. Therefore, the potential source regionsfor pollutants during the sampling period were mainly fromthe southeast of Zhengzhou and local sources within the city.For the record, high PSCF values were also present withinnorthern Hebei Province during the pre-NMG period; this re-gion is a major industrialized area in the BTH. To summarize,in addition to air pollution control measures, changes of me-teorological conditions may contribute to the improvementof air quality during the NMG period.
https://doi.org/10.5194/acp-21-15239-2021 Atmos. Chem. Phys., 21, 15239–15257, 2021

15244 S. Yu et al.: VOC characteristics during the control period
Figure 2. The average weighted PSCF maps for O3, NO2, and VOCs in Zhengzhou during the three periods.
3.2 Characteristic of VOCs during the three periods
3.2.1 Mixing ratios and chemical speciation
As illustrated in Fig. 1, the mixing ratios of hourly totalVOCs (TVOCs) show an average value of 150± 93 µgm−3,ranging from 41 to 1017 µgm−3, before the control pe-riod. During control, this reduced to an average of121± 55 µgm−3, with a range from 37 to 333 µgm−3. Afterthe control period, the average VOC concentration increasedto 136± 60 µgm−3. Overall, it is clear that the emission con-trol policies were beneficial in reducing VOC concentration,decreasing by about 19 % and 11 % before and after emissionreduction.
The percentage distributions of VOC groups were simi-lar in the three sampling periods (Fig. S6 in the Supple-ment). Alkanes were the dominant group, accounting for37 %, 35 %, and 33 % of the total VOC concentration forthe three periods, respectively, followed by halocarbons. No-tably, OVOCs slightly decreased in the entire sampling pe-riod, comprising 17 %, 16 %, and 15 %, respectively. How-ever, the active components of aromatics increased over time.In addition to the impact of emission sources, meteorological
conditions and transport might be key factors that can influ-ence VOC compositions (Su et al., 2021).
The top 20 VOC species are summarized in Table 1. Thetop 20 substances were similar in the three stages, but theconcentration levels were quite different. Tracers of solventsources including hexane and dichloromethane (Huang andHsieh, 2019; Wei et al., 2019) decreased in the control pe-riod, reducing by 42 % and 47 %, respectively. The reductionof vinyl acetate and tetrachloroethylene is relatively large,which may be attributed to industrial emission reduction(Hsu et al., 2018; Zhang et al., 2015). In addition, the con-centration of acetylene is reduced by 55 % compared withthe pre-NMG period, as a potential result of the control ofcombustion sources (Liu et al., 2020; F. Wu et al., 2016).
3.2.2 Diurnal variations of ambient VOCs
The mean diurnal variations of TVOCs and their compoundsbefore, during, and after the control period are shown inFig. S7 in the Supplement. Clearly, the diurnal variations ofTVOCs during the three periods are similar, showing highervalues from evening till morning rush hours, while they arelowest in the afternoon. The composition of alkanes, alkenes,alkynes, and aromatics shows similar daily variations. Previ-
Atmos. Chem. Phys., 21, 15239–15257, 2021 https://doi.org/10.5194/acp-21-15239-2021

S. Yu et al.: VOC characteristics during the control period 15245
Table 1. Concentrations of the 20 most abundant species in Zhengzhou (unit: µgm−3).
Component Before Component During Component After
n-Hexane 16.5 n-Hexane 9.6 Dichloromethane 8.1Dichloromethane 12.6 Dichloromethane 6.7 n-Hexane 8.1Vinyl acetate 8.4 Acetone 6.5 Acetone 7Acetone 7.6 Ethane 5.7 Toluene 6.3Tetrachloroethylene 6.6 Tetrachloroethylene 5.3 1,2-Dichloroethane 6.11,2-Dichloroethane 5 Vinyl acetate 4.9 m,p-Xylene 5.8Toluene 4.9 1,2-Dichloroethane 4.6 Propane 5.1Chloroform 4.8 Toluene 4.5 Isopentane 5m,p-Xylene 4.7 m,p-Xylene 4.3 Benzene 4.3Isopentane 4.6 Propane 4.2 Ethane 4.3Ethane 4.2 Carbon tetrachloride 4.1 Tetrachloroethylene 4.1Carbon tetrachloride 3.9 Isopentane 3.7 Vinyl acetate 4Propane 3.8 Benzene 3.6 Carbon tetrachloride 3.6Benzene 3.6 Chloroform 3.5 Chloroform 3.1Acetylene 3.1 n-Butane 2.1 Acetylene 2.9n-Butane 2.5 Freon 11 2 n-Butane 2.8Isobutane 2.2 Isobutane 1.9 Isobutane 2.5Freon 11 2 n-Pentane 1.9 Ethylene 2.5n-Pentane 2 Ethylene 1.7 n-Pentane 2.5Ethylbenzene 1.5 Acetylene 1.4 Methyl chloride 1.9∑
top 20 species 104.5 82.2 90.0∑top 20 species /
∑VOCs 70 % 68 % 66 %
ous studies have suggested that VOCs can be oxidized by O3,OH radicals, and NO3 radicals (Carter, 2010b). In short, thereactions with O3 and OH radicals are the most importantchemical reactions during daytime, and the reactions withNO3 radicals and O3 are dominant reactions for VOCs oc-curring at night (Atkinson and Arey, 2003). However, the re-action rate of the OH radical is much higher than that of theNO3 radical, and thus, the concentration of TVOCs and itscompounds at night is generally higher than that during thedaytime (Atkinson and Arey, 2003). It should be noted thatthe average VOC mixing ratio at midnight during the con-trol period was significantly lower than that in the other twoperiods; in particular, the concentrations of aromatics com-pounds were significantly decreased.
As each source type has its own fingerprint, the mean diur-nal variations of tracers during the three periods are presentedin Fig. 3. Isopentane and n-pentane in the three periodshave several minor peaks (e.g., 02:00 and 18:30 LST). The02:00 LST peak is mainly from the freight trucks, and the07:00 LST peak is most likely from traffic rush-hour emis-sions (Gentner et al., 2009; K. Li et al., 2019; Zheng et al.2018). It should be noted that during the control period, thenighttime concentration significantly decreased, while thedaytime concentrations of the three stages are close. Toluene,ethylbenzene, and xylenes (Fig. 3) as well as the tracer gasesof NO and NO2 (Fig. S8 in the Supplement) in the three pe-riods had similar diurnal patterns to those of pentane. Allof the species mentioned above are tracers of traffic emis-
sion (Brito et al., 2015; Dörter et al., 2020; Yenisoy-Karakaset al., 2020). It is speculated that the control effect on mucktruck is significant during the control period. As shown inFig. 3, tracers of solvent utilization, such as hexane anddichloromethane, had different diurnal patterns to those ofthe vehicle source. During the pre-NMG period, the solventtracer emissions are so strong that they almost offset the day-time trough caused by photochemical reactions and boundarylayer height (K. Li et al., 2019). The daytime levels of theNMG period are lower than those of the first stage, whichmight be attributed to the intensive control over the use ofoutdoor solvents. Chloromethane and acetylene are tracers ofbiomass burning and combustion, respectively (McRobertset al., 2015; Schauer et al., 2001). During the control pe-riod, acetylene decreased significantly, while chloromethaneremained higher levels.
3.3 Source attribution and apportionment
3.3.1 Ratios of specific compounds
During the sampling period, the great changes in the mixingratios of VOCs may be caused by the altered contribution ofemission sources. Ratios of specific VOCs have commonlybeen used to identify emission sources.
Because i- and n-pentane have similar atmospheric life-times, these i/n ratios are widely used to examine the im-pact of vehicle emissions and combustion emissions, and thevalues varied according to sources (i.e., 0.56–0.80 for coal
https://doi.org/10.5194/acp-21-15239-2021 Atmos. Chem. Phys., 21, 15239–15257, 2021

15246 S. Yu et al.: VOC characteristics during the control period
Figure 3. Diurnal variations in concentrations of some reactive VOC species in Zhengzhou during the three periods.
combustion, 1.5–3.0 for liquid gasoline, 2.2–3.8 for vehicleemissions; Yan et al., 2017; Zheng et al., 2018). Isopentaneand n-pentane showed highly significant correlations duringthe three periods (R2 > 0.6), suggesting the source of thesetwo species was similar (Fig. S9 in the Supplement). In thisstudy, the ratios of i/n-pentane during the three periods were1.5, 1.7, and 1.5, indicating that the VOCs originated fromthe mixed sources of coal combustion and vehicle emissions.
The toluene / benzene (T/B) ratio has also been widely ap-plied to be an indicator of sources. A previous study reportedthat these two species are most probably from biomass burn-ing, coal combustion, vehicle emissions, and solvent use,
with the T/B ratios ranging between 0.2–0.6, 0.6–1.0, 1.0–2.0, and > 4, respectively (Hui et al., 2018; Kumar et al.,2018; M. Song et al., 2019). As shown in Fig. S9, low cor-relations (R2
= 0.3–0.5) were found during the three peri-ods, suggesting a more complex set of sources for the twospecies. The T/B ratio in the three periods was 0.78, 0.75,and 0.92, respectively, indicating that the VOCs were greatlyinfluenced by the mixed source of coal combustion and ve-hicle emissions. The ratio was lower in the control period.Acetylene concentration was low but the chloromethane con-centration was high during the control period, indicating thatbiomass burning had a greater impact during this period.
Atmos. Chem. Phys., 21, 15239–15257, 2021 https://doi.org/10.5194/acp-21-15239-2021
S. Yu et al.: VOC characteristics during the control period 15247
Figure 4. Source profiles calculated using the PMF model.
3.3.2 Identification of PMF factors
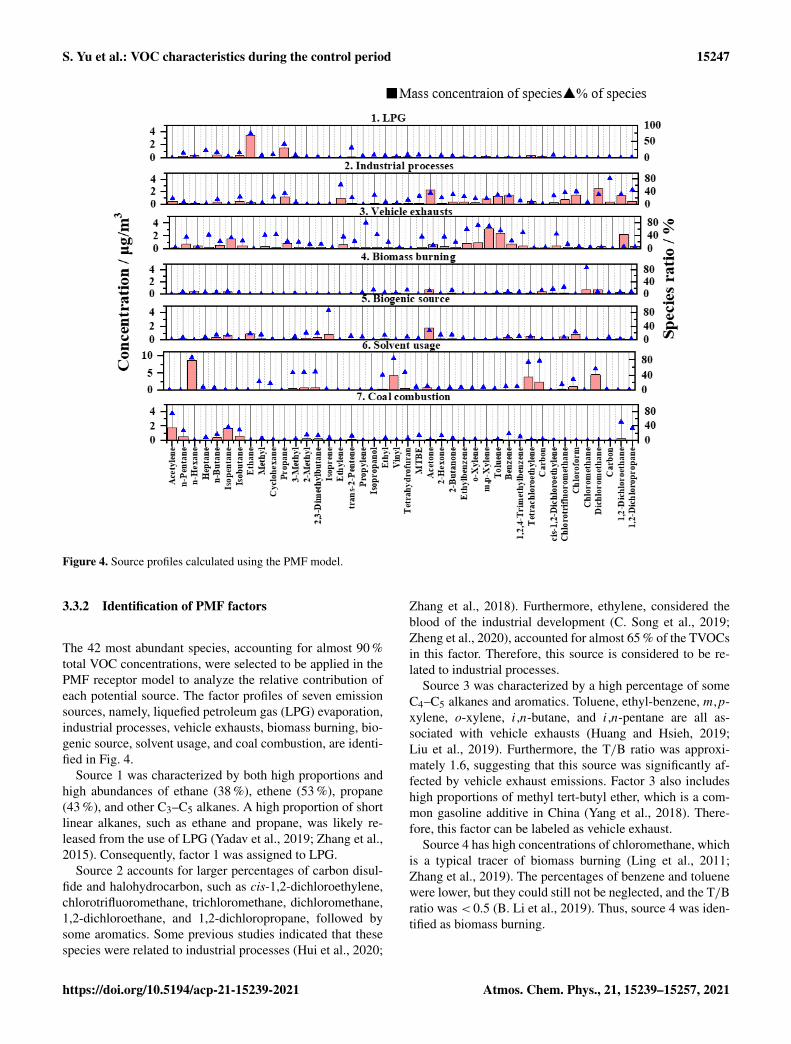
The 42 most abundant species, accounting for almost 90 %total VOC concentrations, were selected to be applied in thePMF receptor model to analyze the relative contribution ofeach potential source. The factor profiles of seven emissionsources, namely, liquefied petroleum gas (LPG) evaporation,industrial processes, vehicle exhausts, biomass burning, bio-genic source, solvent usage, and coal combustion, are identi-fied in Fig. 4.
Source 1 was characterized by both high proportions andhigh abundances of ethane (38 %), ethene (53 %), propane(43 %), and other C3–C5 alkanes. A high proportion of shortlinear alkanes, such as ethane and propane, was likely re-leased from the use of LPG (Yadav et al., 2019; Zhang et al.,2015). Consequently, factor 1 was assigned to LPG.
Source 2 accounts for larger percentages of carbon disul-fide and halohydrocarbon, such as cis-1,2-dichloroethylene,chlorotrifluoromethane, trichloromethane, dichloromethane,1,2-dichloroethane, and 1,2-dichloropropane, followed bysome aromatics. Some previous studies indicated that thesespecies were related to industrial processes (Hui et al., 2020;
Zhang et al., 2018). Furthermore, ethylene, considered theblood of the industrial development (C. Song et al., 2019;Zheng et al., 2020), accounted for almost 65 % of the TVOCsin this factor. Therefore, this source is considered to be re-lated to industrial processes.
Source 3 was characterized by a high percentage of someC4–C5 alkanes and aromatics. Toluene, ethyl-benzene, m,p-xylene, o-xylene, i,n-butane, and i,n-pentane are all as-sociated with vehicle exhausts (Huang and Hsieh, 2019;Liu et al., 2019). Furthermore, the T/B ratio was approxi-mately 1.6, suggesting that this source was significantly af-fected by vehicle exhaust emissions. Factor 3 also includeshigh proportions of methyl tert-butyl ether, which is a com-mon gasoline additive in China (Yang et al., 2018). There-fore, this factor can be labeled as vehicle exhaust.
Source 4 has high concentrations of chloromethane, whichis a typical tracer of biomass burning (Ling et al., 2011;Zhang et al., 2019). The percentages of benzene and toluenewere lower, but they could still not be neglected, and the T/Bratio was < 0.5 (B. Li et al., 2019). Thus, source 4 was iden-tified as biomass burning.
https://doi.org/10.5194/acp-21-15239-2021 Atmos. Chem. Phys., 21, 15239–15257, 2021

15248 S. Yu et al.: VOC characteristics during the control period
Source 5 accounts for larger percentages of isoprene, ac-counting for 86 % of the TVOCs in the source. Isopreneis an indicator of biogenic emissions and is emitted frommany plants (Guenther et al., 1995 and 1997). This factoralso included a considerable proportion of intermediate prod-ucts (Liu et al., 2019), such as acetone, 2-hexanone, and 2-butanone. Therefore, this source is considered to be biogenicemissions.
Source 6 was differentiated by C6–C8 alkanes, suchas n-hexane, methyl cyclopentane, 3-methylpentane, 2-methylpentane, and 2,3-dimethylbutane. The percentages ofethyl acetate, tetrachloroethylene, carbon tetrachloride, chlo-roform, and dichloromethane were high. These substancesare important organic solvents and typical tracers of solventusage (Hui et al., 2018, 2020). Meanwhile, there are virtuallyno other short-chain hydrocarbons in this source. Therefore,source 6 was primarily attributed to solvent usage rather thanindustrial processes or the vehicle emission source.
Source 7 was dominated by acetylene, which accountedfor 75 % of the TVOCs in the source. Acetylene is a typi-cal tracer of combustion emission (Hui et al., 2019; R. Wuet al., 2016). Some of the VOC species, such as alkanes andbenzene, are the main components in emissions from coalburning (Liu et al., 2019; M. Song et al., 2019; Yang et al.,2018). Thus, factor 7 was assigned to combustion emission.
3.3.3 Contributions of VOC sources
The concentrations of hourly mixing ratio and the relativecontributions of each VOC sources are illustrated in Figs. 5and S10 in the Supplement. Compared with the non-controlperiods, the contributions of coal combustion, vehicle ex-hausts, and solvent utilization are significantly reduced dur-ing the control period.
Conversely, the mixing ratios of LPG showed higher val-ues during the control period. Peak values of biomass com-bustion were frequently present during the second period,and biomass combustion accounts for a relatively high pro-portion in this stage. The highest concentration was observedin the afternoon of the 18 September. Zhengzhou and its sur-rounding areas are in the harvest period of crops in Septem-ber, so the emissions of biomass combustion need to be con-sidered. Figure S11 in the Supplement shows the hotspotsdiagram of Zhengzhou and its surrounding areas during theobservation period, and the number of fire spots in Septem-ber was significantly higher than that in August.
Time series of each identified source contributions areshown in Fig. 6. During the first period, solvent uti-lization (33 µgm−3) was the largest contributor and ac-counted for 30 % of TVOCs, followed by industrial processes(26 µgm−3, 23 %) and vehicle exhausts (24 µgm−3, 21 %).Although it was not a typical time for heating, coal combus-tion still accounted for 10 % of the TVOCs, probably dueto several coal-fired power plants around Zhengzhou (B. Liet al., 2019). In contrast, the proportion of biomass combus-
tion was very low during this period, accounting for only 2 %of the TVOCs.
During the control period, solvent utilization made thelargest contribution (23 %) to atmospheric VOCs, with theconcentration of 23 µgm−3, followed by industrial processes(22 %), vehicle emissions (22 %), and LPG (11 %). Biomassburning should not be ignored in this period, accounting for10 % of total VOCs. The contribution from coal combustionwas relatively low (3.5 µgm−3), accounting only for 4 % ofTVOCs.
For the third period, the largest contributor was fuelcombustion related to vehicle exhausts, with 30 µgm−3,accounting for 28 % of total VOCs. Industrial pro-cesses (23 µgm−3), solvent utilization (20 µgm−3), biomassburning (12 µgm−3), coal combustion (11 µgm−3), LPG(5.7 µgm−3), and biogenic emissions (5.6 µgm−3) accountedfor 21 %, 19 %, 11 %, 10 %, 5 %, and 5 % of total VOCs, re-spectively.
In summary, the concentrations of solvent utilization werereduced to the greatest extent during the control period,with the value of 10 µgm−3 in the pre-NMG period, fol-lowed by coal combustion (7.1 µgm−3), industrial processes(4.0 µgm−3), and vehicle exhausts (2.2 µgm−3). Reductionsof solvent utilization, coal combustion, industrial processesand vehicle exhausts were responsible for 80 %, 57 %, 32 %,and 18 % of the reductions in ambient VOCs, indicating thatthe control measures on solvent utilization and coal com-bustion were the most effective. In contrast, due to weakcontrol on biomass burning and LPG, contributions fromthese sources were elevated. September is a harvest monthin northern China, which means that biomass burning contri-butions might increase with time. Meanwhile, the peak con-tribution of this source occurred during the control periodbecause of a lack of relative control measures on LPG.
3.4 Atmospheric environmental implications
In this section, the atmospheric environmental implicationsof VOCs are discussed by calculating the values of risk as-sessment and ozone formation potential (OFP).
3.4.1 Risk assessment of individual VOC species
In addition to the impacts on ambient air quality, someVOC species are also toxic with various health impacts.In this paper, the non-carcinogenic risk (expressed by HQ)and carcinogenic risk (expressed by lifetime cancer risk,LCR) of hazardous VOC species were investigated, and theacceptable safety thresholds were 1 and 1× 10⁻⁶, respec-tively (US EPA, 2009). On the whole, the HQ of almost allsubstances is far below the safety threshold, indicating nochance of non-carcinogenic risk. However, only the HQ ofacrolein (1.8) exceeded the value of 1, suggesting the obvi-ous chance of non-carcinogenic effects (Fig. 7). As for LCR,six species were above 1× 10⁻⁶ in this study, including 1,2-
Atmos. Chem. Phys., 21, 15239–15257, 2021 https://doi.org/10.5194/acp-21-15239-2021

S. Yu et al.: VOC characteristics during the control period 15249
Figure 5. Time series of each identified source contributions and accumulated relative VOC contributions.
Figure 6. Source contributions to VOC concentration in the PMF model during the three periods.
dichloroethane (2.5× 10⁻⁵), chloroform (1.1× 10⁻⁵), 1,2-dibromoethane (8.1× 10⁻⁶), naphthalene (6.4× 10⁻⁶), ben-zene (5.2× 10⁻⁶), and tetrachloromethane (3.3× 10⁻⁶).
During the entire observation period, a total of sevenVOCs may pose potential risks to human health. Health risk
assessment in Zhengzhou was compared with other cities, asshown in Table S3. Overall, the values of risk assessment inthis study are evidently lower than those reported in Beijing(Gu et al., 2019) and Langfang (Yang et al., 2019a), whereasthey are higher than the summer of 2018 in Zhengzhou (Li
https://doi.org/10.5194/acp-21-15239-2021 Atmos. Chem. Phys., 21, 15239–15257, 2021

15250 S. Yu et al.: VOC characteristics during the control period
Figure 7. Non-carcinogenic risks of HQ and carcinogenic risks for individual VOC species.
et al., 2020). Evaluated health risk assessment before, dur-ing, and after the control period shows cumulative LCR was5.8× 10−5, 5.1× 10⁻⁵, and 6.3× 10⁻⁵, respectively, duringthe three periods (Fig. S12 in the Supplement). Control mea-sures can reduce non-carcinogenic risk. On the other hand,values of six substances still exceed the acceptable safetythreshold of LCR during the control period. As for non-carcinogenic risk assessment, the HI was 1.6, 2.1, and 2.1,respectively. Noticeably, the HQ of acrolein (1.9) during thecontrol period was higher than the other two periods, whichshould be paid more attention to. In summary, VOC concen-trations decreased significantly during the control period butstill posed health risks to humans. Therefore, we need to fo-cus on the targeted emission reduction of these characteristicsubstances to protect human health.
3.4.2 Variations of OFP
The OFP and their compositions during the three periods areshown in Fig. S13 and Table S6 in the Supplement. The totalOFP during the control period was 183± 115 µgm−3, whichwas 0.77 and 0.83 times lower than before and after the con-trol period, respectively. As shown in Fig. S13, the aromatics
Table 2. OFP contributions (µgm−3) of each VOC source duringthe sampling periods in Zhengzhou.
Source Source contribution
pre-NMG during NMG post-NMG
LPG 8.7 13 6.9Biomass burning 1.5 8.4 9.8Biogenic source 18.6 16.6 13.1Coal combustion 14.6 4.8 14.9Industrial processes 41.4 33.3 35.5Vehicle exhausts 72.1 65.3 89Solvent use 46.2 32.1 28.8
Total 203.1 173.5 198.0
were the dominant contributors to total OFP in all three peri-ods, comprising 42 %, 50 %, and 56 %, respectively, followedby OVOCs, alkanes, alkenes, halohydrocarbon, and acety-lene. Aromatics played a key role in ozone formation, whichis similar to the results of many previous reports (Wang et al.,2013; Zou et al., 2015).
Atmos. Chem. Phys., 21, 15239–15257, 2021 https://doi.org/10.5194/acp-21-15239-2021

S. Yu et al.: VOC characteristics during the control period 15251
Figure 8. Daily variations in the VOC/NOx ratio in Zhengzhou before, during, and after the NMG period.
The source contributions to OFP were calculated using thePMF model (Table 2). The most important source to ozoneformation was traffic emissions. Industrial emissions and sol-vent usage were the second and third sources of photochemi-cal ozone formation. Among them, solvent use has the great-est contribution to the OFP reduction with the emission re-duction during the control period, explaining a 48 % reduc-
tion in OFP. Although combustion contributes only 10 % ofthe total OFP, this source played an important role in the re-duction in OFP, explaining 33 % of the OFP reduction. Atthe same time, control of traffic and industry also reducedthe OFP during the games. Thus, solvent utilization and com-bustion controls were the most important measures taken toreduce OFP during the National Minority Games 2019 in
https://doi.org/10.5194/acp-21-15239-2021 Atmos. Chem. Phys., 21, 15239–15257, 2021

15252 S. Yu et al.: VOC characteristics during the control period
Figure 9. Spatial comparison of the O3–NOx–VOC sensitiveregime between August and September 2019 in Zhengzhou.
Zhengzhou. However, the current knowledge about forma-tion mechanisms of O3 is still very limited, and the next sec-tion discusses the sensitivity of ozone.
3.5 O3–NOx–VOC sensitivity and control strategies
The impact of ozone precursors on ozone formation can bedescribed as either a NOx-limited or VOC-limited regime,which is an important step in developing effective controlstrategies to reduce regional ozone pollution. The ratios ofVOCs/NOx have been widely used to determine the ozoneformation regime. Generally, VOC-sensitive regimes occurwhen VOC/NOx ratios are lower than 10 (ppbCppbv−1);ozone formation is NOx-limited when the ratios are greaterthan 20 (B. Li et al., 2019; Y. Li et al., 2021; Sillman, 1999).
The diurnal variations of the VOC/NOx ratios before, dur-ing, and after the control period are shown in Fig. 8, and theratios for the three periods showed similar daily variations.Higher ratios were observed at midnight (01:00–06:00), es-pecially during the control period (Fig. 8), due to the emis-sion reduction of NOx emissions, with a VOC/NOx ratio of10. Afterwards, the ratio decreased rapidly, indicating thatNOx concentration increased faster than NMHCs due to theeffect of vehicular emissions (Zou et al., 2019). Thereafter,the ratio of VOC/NOx also increased with the continuousaccumulation of O3 concentration.
At the peak time of O3 concentration (12:00–16:00), theaverage VOC/NOx ratio was approximately 9.3 during thepre-NMG period, which was slightly lower than 10 and thusproved that the ozone generation in this period was limited byVOCs. During the control period, the ratio in the afternoonwas lower than that in the pre-NMG period, with a meanvalue of 7.1. In this study, the mean values of VOCs/NOx(ppbvCppbv−1) were below 10 during all three periods, in-dicating that the O3 formation was sensitive to VOCs inZhengzhou, and the reductions of the VOC emissions willbe beneficial for O3 alleviation. Meanwhile, the daily vari-ation of VOC (MIR) / NOx is similar to that of VOCs/NOx(ppbvCppbv−1).
It should be noted that ozone sensitivity can only be ini-tially determined by the VOC/NOx ratio, and in the next sec-tion this will be verified by the WRF-CMAQ model.
As shown in Fig. 9, the values ofsensitivity_NOx / sensitivity_VOCs were generally lowerthan 0.8 in the urban district of Zhengzhou and its surround-ing areas, while the ratio of the western part of Zhengzhouis more than 1.2. Thus, O3 formation is quite sensitive toVOCs, and that means VOCs should be controlled as a prior-ity in the effective control of O3. To achieve a more effectivereduction, it is necessary to study reduction ratios that havethe greatest effect on control strategies in reducing ozoneconcentration.
The Empirical Kinetic Modeling Approach (EKMA) ofO3–VOC–NOx sensitivity analysis is presented in Fig. 10.The results reflect that reducing VOCs can alleviate ozonepollution, while reducing NOx concentration might lead tothe increase of ozone concentration. Some scholars havepointed out that the reaction rate constant between NOx andthe OH radical is 5.5 times higher than that of VOCs and theOH radical (Chen et al., 2019). Therefore, the reduction ofNOx may lead to an increase in OH radicals from the VOCoxidation cycle, thereby promoting the formation of O3.The responses of ozone to its precursors (VOCs and NOx)under different emission-reduction scenarios are shown inFig. 10. Reduction of ozone precursors will not improve pho-tochemical pollution when reduction ratios of the precursors(VOC : NOx) are less than 1. As shown in Fig. 10, O3 lev-els decreased most effectively for the only VOC reductionscheme, with VOCs : NOx= 2 : 1 (using mol ratio). It shouldbe noted that it is nearly impossible to reduce VOC emissionsonly while NOx remains unchanged because VOCs (particu-larly anthropogenic VOCs) and NOx are generally co-emitted(Chen et al., 2019).
During the NMG period, the government carried out strin-gent emission controls. The concentrations of ozone pre-cursors showed a decreasing trend, but the ozone pollutionwas still serious. Unreasonable emission reduction may bean important factor leading to ozone pollution. Combinedwith the results of this study, it is suggested that reductionratios of the precursors (VOCs : NOx) should be more than2 to effectively alleviate ozone pollution. Controlling VOCsources is the key to alleviating local ozone pollution, espe-cially the control of aromatic hydrocarbons. Solvent usageis a non-combustion process, and therefore reducing VOCemission from this source will not contribute to the decreaseof NOx emission. These findings could guide the formula-tion and implementation of effective O3 control strategies inZhengzhou.
4 Conclusions
A number of strict emission control measures were imple-mented in Zhengzhou and its surrounding area to ensuregood air quality during the NMG period. The concentra-tions of VOCs and NOx decreased significantly; however,O3 pollution has not been effectively alleviated. To provide
Atmos. Chem. Phys., 21, 15239–15257, 2021 https://doi.org/10.5194/acp-21-15239-2021

S. Yu et al.: VOC characteristics during the control period 15253
Figure 10. An O3 isopleth diagram versus NOx and VOCs using EKMA (a) and a variation chart of O3 concentration in each control path (b)during the pre-NMG period in Zhengzhou.
scientific references and guidance for atmospheric controlstrategies, this study systematically quantified the impacts ofthe characterization of VOC levels, photochemical reactivity,source contribution of the VOCs, and the ozone–NOx–VOCsensitivities during sporting events in Zhengzhou.
The mixing ratios of TVOCs during the control periodwere 121± 55 µg m−3 and decreased by about 19 % and11 % before and after emission reduction. Source apportion-ment showed that solvent usage, industrial processes, vehicleexhausts, LPG, biomass burning, biogenic source, and coalcombustion were the major sources of VOCs, and the sevensources accounted for 23 %, 23 %, 22 %, 11 %, 10 %, 8 %,and 4 % during the NMG period. The control measures onsolvent utilization and coal combustion were most effective,accounting for 80 % and 57 % of the reductions in ambientVOCs, respectively. However, contributions of biomass burn-ing were elevated. The total OFP during the control periodwas 183± 115 µgm−3, which was 0.23 and 0.17 times lowerthan before and after the control period, respectively. Mea-sures on solvent utilization and combustion were the mostimportant controls to reduce OFP during the NMG period.
The O3–NOx–VOC sensitivity showed that Zhengzhou isunder a VOC-sensitive regime. Reducing VOCs can allevi-ate ozone pollution, while excessively reducing NOx con-centration might lead to the increase of ozone concentra-tion. Unreasonable emission reduction may aggravate ozonepollution during the control period. It is suggested thatemission-reduction ratios of the precursors (VOC : NOx)should be more than 2. Considering that solvent usage is anon-combustion process, reducing VOC emission from thissource will not cause the decrease of NOx emission; thereforethe solvent source can be controlled preferentially.
Data availability. The data set is available to the public and can beaccessed upon request from Ruiqin Zhang ([email protected]).
Supplement. The supplement related to this article is available on-line at: https://doi.org/10.5194/acp-21-15239-2021-supplement.
Author contributions. SYu and RZ planned and organized the studyand were deeply involved in the writing of the manuscript. FS, SYi,and SW performed the atmospheric measurements and data anal-ysis and wrote the manuscript. BH, XF, and MY assisted heavilywith the atmospheric measurements and data analysis. FS and RXconducted the model development and data analysis. Other coau-thors provided useful insights on data analysis and contributed tothe writing of the manuscript. SYu and FS contributed equally tothis work.
Competing interests. The authors declare that they have no conflictof interest.
Disclaimer. Publisher’s note: Copernicus Publications remainsneutral with regard to jurisdictional claims in published maps andinstitutional affiliations.
Acknowledgements. This work was supported by the Study of Col-laborative Control of PM2.5 and O3 Pollution in Zhengzhou City(grant no. 20200321A) and the National Key Research and Devel-opment Program of China (grant no. 2017YFC0212403). We thankDong Zhang, Aizhi Huang, and Huan Zhang for their contributionsto the field observations.
https://doi.org/10.5194/acp-21-15239-2021 Atmos. Chem. Phys., 21, 15239–15257, 2021

15254 S. Yu et al.: VOC characteristics during the control period
Financial support. This research has been supported by the Studyof Collaborative Control of PM2.5 and O3 Pollution in ZhengzhouCity (grant no. 20200321A) and the National Key Research and De-velopment Program of China (grant no. 2017YFC0212403).
Review statement. This paper was edited by Christopher Cantrelland reviewed by two anonymous referees.
References
Atkinson, R. and Arey, J.: Atmospheric degradation ofvolatile organic compounds, Chem. Rev., 103, 4605–4638,https://doi.org/10.1021/cr0206420, 2003.
Bai, L., Lu, X., Yin, S., Zhang, H., Ma, S., Wang, C., Li, Y., andZhang, R.: A recent emission inventory of multiple air pollutant,PM2.5 chemical species and its spatial-temporal characteristicsin central China, J. Clean. Prod., 269, 112–114, 2020.
Baudic, A., Gros, V., Sauvage, S., Locoge, N., Sanchez, O., Sarda-Estève, R., Kalogridis, C., Petit, J.-E., Bonnaire, N., Baisnée, D.,Favez, O., Albinet, A., Sciare, J., and Bonsang, B.: Seasonalvariability and source apportionment of volatile organic com-pounds (VOCs) in the Paris megacity (France), Atmos. Chem.Phys., 16, 11961–11989, https://doi.org/10.5194/acp-16-11961-2016, 2016.
Bressi, M., Sciare, J., Ghersi, V., Mihalopoulos, N., Petit, J.-E.,Nicolas, J. B., Moukhtar, S., Rosso, A., Féron, A., Bonnaire, N.,Poulakis, E., and Theodosi, C.: Sources and geographical ori-gins of fine aerosols in Paris (France), Atmos. Chem. Phys., 14,8813–8839, https://doi.org/10.5194/acp-14-8813-2014, 2014.
Brito, J., Wurm, F., Serrano, A., Assuno, J., Artaxo, P., Godoy, J.,and Artaxo, P.: Vehicular Emission Ratios of VOCs in a Megac-ity Impacted by Extensive Ethanol Use: Results of AmbientMeasurements in Sao Paulo, Brazil, Environ. Sci. Technol., 49,11381, https://doi.org/10.1021/acs.est.5b03281, 2015.
Byun, D. and Ching, J.: Science Algorithms of the EPA Models-3Community Multiscale Air Quality (CMAQ) Modeling System,US Environmental Protection Agency, Office of Research andDevelopment, Washington, DC, USA, 1999.
Carter, W.: Development of ozone reactivity scales for volatile or-ganic compounds, J. Air Waste Manage., 44, 881–899, 1994.
Carter, W.: Updated Maximum Incremental Reactivity Scale andHydrocarbon Bin Reactivities for Regulatory Applications, pre-pared for California Air Resources Board Contract 07-339,College of Engineering Center for Environmental Researchand Technology, University of California, Riverside, California,2010a.
Carter, W.: Development of the SAPRC-07 chemical mechanism,Atmos. Environ., 44, 5324–5335, 2010b.
Chan, K. L., Hartl, A., Lam, Y. F., Xie, P. H., Liu, W. Q., Cheung,H. M., Lampel, J., Pöhler, D., Li, A., Xu, J., Zhou, H. J., Ning,Z., and Wenig, M. O.: Observations of tropospheric NO2 usingground based MAX-DOAS and OMI measurements during theShanghai World Expo 2010, Atmos. Environ., 119, 45–58, 2015.
Chen, X., Situ, S., Zhang, Q., Wang, X., Sha, C., Zhouc, L., Wu, L.,Wu, L., Ye, L., and Li, C.: The synergetic control of NO2 and O3concentrations in a manufacturing city of southern China, Atmos.Environ., 201, 402–416, 2019.
Chemel, C., Fisher, B., Kong, X., Francis, X., Sokhi, R., Good, N.,Collins, W., and Folberth, G.: Application of chemical transportmodel CMAQ to policy decisions regarding PM2.5 in the UK,Atmos. Environ., 82, 410–417, 2014.
Chi, X., Liu, C., Xie, Z., Fan, G., Wang, Y., He, P., Fan, S., Hong,Q., Wang, Z., Yu, X., Yue, F., Duan, J., Zhang, P., and Liu, J.:Observations of ozone vertical profiles and corresponding pre-cursors in the low troposphere in Beijing, China, Atmos. Res.,213, 224–235, 2018.
Dörter, M., Odabasi, M., and Yenisoy-Karaka, S.: Sourceapportionment of biogenic and anthropogenic VOCsin Bolu plateau, Sci. Total Environ., 731, 139201,https://doi.org/10.1016/j.scitotenv.2020.139201, 2020.
Gentner, D., Harley, R., Miller, A., and Goldstein, A.: Diurnaland seasonal variability of gasoline-related volatile organic com-pound emissions in Riverside, California, Environ. Sci. Technol.,43, 4247–4252, 2009.
Gu, Y., Li, Q., Wei, D., Gao, L., Tan, L., Su, G., Liu, G., Liu, W.,Li, C., and Wang, Q.: Emission characteristics of 99 NMVOCsin different seasonal days and the relationship with air qualityparameters in Beijing, China, Ecotox. Environ. Safe., 169, 797–806, 2019.
Guenther, A.: Seasonal and spatial variations in natural volatile or-ganic compound emissions, Ecol. Appl., 7, 34–45, 1997.
Guenther, A., Hewitt, C. N., Erickson, D., Fall, R., Geron, C.,Graedel, T., Harley, P., Klinger, L., Lerdau, M., McKay, W. A.,Pierce, T., Scholes, B., Steinbrecher, R., Tallamraju, R., Taylor,J., and Zimmerman, P.: A global model of natural volatile organiccompound emissions, J. Geophys. Res., 100, 8873–8892, 1995.
Hakami, A., Henze, D. K., Seinfeld, J. H., Singh, K.,Sandu, A., Kim, S., Byun, D., and Li, Q.: The ad-joint of CMAQ, Environ. Sci. Technol., 41, 7807–7817,https://doi.org/10.1021/es070944p, 2007.
Hsu, C. Y., Chiang, H. C., Shie, R. H., Ku, C. H., Lin, T. Y., Chen,M. J., Chen, N. T., and Chen, Y. C.: Ambient VOCs in residentialareas near a large-scale petrochemical complex: Spatiotemporalvariation, source apportionment and health risk, Environ. Pollut.,240, 95–104, 2018.
Hu, R., Liu, G., Zhang, H., Xue, H., and Wang, X.: Levels, charac-teristics and health risk assessment of VOCs in different func-tional zones of Hefei, Ecotox. Environ. Safe., 160, 301–307,2018.
Huang, W., Fang, D., Shang, J., Li, Z., Zhang, Y., Huo, P., Liu,Z., Schauer, J. J., and Zhang, Y.: Relative impact of short-termemissions controls on gas and particle-phase oxidative potentialduring the 2015 China Victory Day Parade in Beijing, China,Atmos. Environ., 183, 49–56, 2018.
Huang, Y. S. and Hsieh, C. C.: Ambient volatile organic compoundpresence in the highly urbanized city: source apportionment andemission position, Atmos. Environ., 206, 45–59, 2019.
Hui, L., Liu, X., Tan, Q., Feng, M., An, J., Qu, Y., Zhang, Y., andJiang, M.: Characteristics, source apportionment and contribu-tion of VOCs to ozone formation in Wuhan, Central China, At-mos. Environ., 192, 55–71, 2018.
Hui, L., Liu, X., Tan, Q., Feng, M., An, J., Qu, Y., Zhang, Y.,and Cheng, N.: VOC characteristics, sources and contributionsto SOA formation during haze events in Wuhan, Central China,Sci. Total Environ., 650, 2624–2639, 2019.
Atmos. Chem. Phys., 21, 15239–15257, 2021 https://doi.org/10.5194/acp-21-15239-2021
S. Yu et al.: VOC characteristics during the control period 15255
Hui, L., Liu, X., Tan, Q., Feng, M., An, J., Qu, Y., Zhang,Y., Deng, Y., Zhai, R., and Wang, Z.: VOC char-acteristics, chemical reactivity and sources in urbanWuhan, central China, Atmos. Environ., 224, 117340,https://doi.org/10.1016/j.atmosenv.2020.117340, 2020.
Jaars, K., Vestenius, M., van Zyl, P. G., Beukes, J. P., Hellén, H.,Vakkari, V., Venter, M., Josipovic, M., and Hakola, H.: Recep-tor modelling and risk assessment of volatile organic compoundsmeasured at a regional background site in South Africa, Atmos.Environ., 172, 133–148, 2018.
Jiang, N., Li, L., Wang, S., Li, Q., Dong, Z., Duan, S., Zhang,R., and Li, S.: Variation tendency of pollution characterization,sources, and health risks of PM2.5-bound polycyclic aromatichydrocarbons in an emerging megacity in China: Based on three-year data, Atmos. Res., 217, 81–92, 2019.
Kumar, A., Singh, D., Kumar, K., Singh, B. B., and Jain, V. K.: Dis-tribution of VOCs in urban and rural atmospheres of subtropicalIndia: Temporal variation, source attribution, ratios, OFP and riskassessment, Sci. Total Environ., 613-614, 492–501, 2018.
Li, B., Ho, S. S. H., Gong, S., Ni, J., Li, H., Han, L., Yang, Y.,Qi, Y., and Zhao, D.: Characterization of VOCs and their re-lated atmospheric processes in a central Chinese city during se-vere ozone pollution periods, Atmos. Chem. Phys., 19, 617–638,https://doi.org/10.5194/acp-19-617-2019, 2019.
Li, H., Wang, D., Cui, L., Gao, Y., Huo, J., Wang, X., Zhang, Z.,Tan, Y., Huang, Y., Cao, J., Chow, J., Lee, S., and Fu, Q.: Char-acteristics of atmospheric PM2.5 composition during the imple-mentation of stringent pollution control measures in shanghaifor the 2016 G20 summit, Sci. Total. Environ., 648, 1121–1129,https://doi.org/10.1016/j.scitotenv.2018.08.219, 2019.
Li, J., Xie, S. D., Zeng, L. M., Li, L. Y., Li, Y. Q., and Wu, R.R.: Characterization of ambient volatile organic compounds andtheir sources in Beijing, before, during, and after Asia-PacificEconomic Cooperation China 2014, Atmos. Chem. Phys., 15,7945–7959, 2015.
Li, J., Zhai, C., Yu, J., Liu, R., Li, Y., Zeng, L., and Xie, S.: Spa-tiotemporal variations of ambient volatile organic compoundsand their sources in Chongqing, a mountainous megacity inChina, Sci. Total Environ., 627, 1442–1452, 2018.
Li, K., Li, J., Wang, W., Tong, S., Liggio, J., and Ge, M.: Evaluatingthe effectiveness of joint emission control policies on the reduc-tion of ambient VOCs: Implications from observation during the2014 APEC summit in suburban Beijing, Atmos. Environ., 164,117–127, 2017.
Li, K., Li, J., Tong, S., Wang, W., Huang, R.-J., and Ge, M.:Characteristics of wintertime VOCs in suburban and urban Bei-jing: concentrations, emission ratios, and festival effects, At-mos. Chem. Phys., 19, 8021–8036, https://doi.org/10.5194/acp-19-8021-2019, 2019.
Li, R., Wang, Z., Cui, L., Fu, H., Zhang, L., Kong, L., Chen, W.,and Chen, J.: Air pollution characteristics in China during 2015-2016: Spatiotemporal variations and key meteorological factors,Sci. Total Environ., 648, 902–915, 2019.
Li, Y., Yin, S., Yu, S., Yuan, M., Dong, Z., Zhang, D., Yang,L., and Zhang, R.: Characteristics, source apportionment andhealth risks of ambient VOCs during high ozone period at anurban site in central plain, China, Chemosphere, 250, 126283,https://doi.org/10.1016/j.chemosphere.2020.126283, 2020.
Li, Y., Yin, S., Yu, S., Bai, L., Wang, X., Lu, X., and Ma, S.: Charac-teristics of ozone pollution and the sensitivity to precursors dur-ing early summer in central plain, China, J. Environ. Sci.-China,99, 354–368, 2021.
Ling, Z. H., Guo, H., Cheng, H. R., and Yu, Y. F.: Sources of am-bient volatile organic compounds and their contributions to pho-tochemical ozone formation at a site in the Pearl River Delta,southern China, Environ. Pollut., 159, 2310–2319, 2011.
Liu, Y., Wang, H., Jing, S., Gao, Y., Peng, Y., Lou, S.,Cheng, T., Tao, S., Li, L., Li, Y., Huang, D., Wang, Q.,and An, J.: Characteristics and sources of volatile organiccompounds (VOCs) in Shanghai during summer: Implica-tions of regional transport, Atmos. Environ., 215, 116902,https://doi.org/10.1016/j.atmosenv.2019.116902, 2019.
Liu, Y., Song, M., Liu, X., Zhang, Y., Hui, L., Kong, L., Zhang,Y., Zhang, C., Qu, Y., An, J., Ma, D., Tan, Q., and Feng,M.: Characterization and sources of volatile organic compounds(VOCs) and their related changes during ozone pollution daysin 2016 in Beijing, China, Environ. Pollut., 257, 113599,https://doi.org/10.1016/j.envpol.2019.113599, 2020.
Ma, T., Duan, F., He, K., Qin, Y., Tong, D., Geng, G., Liu, X., Li,H., Yang, S., Ye, S., Xu, B., Zhang, Q., and Ma, Y.: Air pollutioncharacteristics and their relationship with emissions and meteo-rology in the Yangtze River Delta region during 2014–2016, J.Environ. Sci.-China, 83, 8–20, 2019.
McRoberts, W., Keppler, F., Harper, D., and Hamilton, J.: Seasonalchanges in chlorine and methoxyl content of leaves of deciduoustrees and their impact on release of chloromethane and methanolat elevated temperatures, Environ. Chem., 12, 426–437, 2015.
Norris, G., Duvall, R., Brown, S., and Bai, S.: EPA Pos-itive Matrix Factorization (PMF) 5.0, Fundamentals andUser Guide, EPA/600/R-14/108, US Environmental ProtectionAgency, Washington, DC, 2014.
RAIS (The Risk Assessment Information System): availableat: http://rais.ornl.gov/tools/profile.php (last access: 10 Octo-ber 2019), 2016.
Ren, Y., Li, H., Meng, F., Wang, G., Zhang, H., Yang, T., Li, W.,Ji, Y., Bi, F., and Wang, X.: Impact of emission controls on airquality in Beijing during the 2015 China Victory Day Parade:Implication from organic aerosols, Atmos. Environ., 198, 207–214, 2019.
Sahu, L., Tripathi, N., and Yadav, R.: Contribution of biogenic andphotochemical sources to ambient VOCs during winter to sum-mer transition at a semi-arid urban site in India, Environ. Pollut.,229, 595–606, 2017.
Schauer, J., Kleeman, M., Cass, G., and Simoneit, B.: Measurementof emissions from air pollution sources. 3. C1-C29 organic com-pounds fromfireplace combustion of wood, Environ. Sci. Tech-nol., 35, 1716–1728, 2001.
Schleicher, N., Norra, S., and Chen, Y.: Efficiency of mitigationmeasures to reduce particulate air pollution-a case study duringthe Olympic Summer Games 2008 in Beijing, China, Sci. TotalEnviron., 427–428, 146–158, 2012.
Sillman, S.: The relation between ozone, NOx and hydrocarbonsin urban and polluted rural environments, Atmos. Environ., 33,1821–1845, 1999.
Song, C., Liu, B., Dai, Q., Li, H., and Mao, H.: Temper-ature dependence and source apportionment of volatileorganic compounds (VOCs) at an urban site on the
https://doi.org/10.5194/acp-21-15239-2021 Atmos. Chem. Phys., 21, 15239–15257, 2021

15256 S. Yu et al.: VOC characteristics during the control period
north China plain, Atmos. Environ., 207, 167–181,https://doi.org/10.1016/j.atmosenv.2019.03.030, 2019.
Song, M., Liu, X., Zhang, Y., Shao, M., Lu, K., Tan, Q.,Feng, M., and Qu, Y.: Sources and abatement mechanismsof VOCs in southern China, Atmos. Environ., 201, 28–40,https://doi.org/10.1016/j.atmosenv.2018.12.019, 2019.
Su, F., Xu, Q., Wang, K., Yin, S., Wang, S., Zhang, R., Tang, X.,and Ying, Q.: On the effectiveness of short-term intensive emis-sion controls on ozone and particulate matter in a heavily pol-luted megacity in central China, Atmos. Environ., 246, 118111,https://doi.org/10.1016/j.atmosenv.2020.118111, 2021.
Tan, Z., Lu, K., Dong, H., Hu, M., Li, X., Liu, Y., Lu, S., Shao, M.,Su, R., Wang, H., Wu, Y., Wahner, A., and Zhang, Y.: Explicitdiagnosis of the local ozone production rate and the ozone-NOx-VOC sensitivities, Sci. Bull., 63, 1067–1076, 2018.
Ulbrich, I. M., Canagaratna, M. R., Zhang, Q., Worsnop, D. R., andJimenez, J. L.: Interpretation of organic components from Posi-tive Matrix Factorization of aerosol mass spectrometric data, At-mos. Chem. Phys., 9, 2891–2918, https://doi.org/10.5194/acp-9-2891-2009, 2009.
US EPA: Air Method, Toxic Organics-15 (TO-15): Compendium ofMethods for the Determination of Toxic Organic Compounds inAmbient Air, 2nd edn., Determination of Volatile Organic Com-pounds (VOCs) in Air Collected in Specially-Prepared Canis-ters and Analyzed by Gas Chromatography/Mass Spectrometry(GC/MS), Cincinnati, 1999.
US EPA: Risk Assessment Guidance for Superfund Volume I: Hu-man Health Evaluation Manual (Part F, Supplemental Guidancefor Inhalation Risk Assessment), EPA-540-R-070–002, US En-vironmental Protection Agency, Washington, DC, USA, 2009.
Waked, A., Favez, O., Alleman, L. Y., Piot, C., Petit, J.-E., Delau-nay, T., Verlinden, E., Golly, B., Besombes, J.-L., Jaffrezo, J.-L., and Leoz-Garziandia, E.: Source apportionment of PM10 ina north-western Europe regional urban background site (Lens,France) using positive matrix factorization and including pri-mary biogenic emissions, Atmos. Chem. Phys., 14, 3325–3346,https://doi.org/10.5194/acp-14-3325-2014, 2014.
Wang, H., Chen, C., Wang, Q., Huang, C., Su, L., Huang, H., Lou,S., Zhou, M., Li, L., Qiao, L., and Wang, Y.: Chemical loss ofvolatile organic compounds and its impact on the source analysisthrough a two-year continuous measurement, Atmos. Environ.,80, 488–498, 2013.
Wang, M., Zhu, T., Zheng, J., Zhang, R. Y., Zhang, S. Q., Xie,X. X., Han, Y. Q., and Li, Y.: Use of a mobile laboratory toevaluate changes in on-road air pollutants during the Beijing2008 Summer Olympics, Atmos. Chem. Phys., 9, 8247–8263,https://doi.org/10.5194/acp-9-8247-2009, 2009.
Wang, N., Lyu, X., Deng, X., Huang, X., Jiang, F., and Ding,A.: Aggravating O3 pollution due to NOx emission con-trol in eastern China, Sci. Total Environ., 677, 732–744,https://doi.org/10.1016/j.scitotenv.2019.04.388, 2019.
Wang, P., Chen, Y., Hu, J., Zhang, H., and Ying, Q.: Attributionof tropospheric ozone to NOx and VOC emissions: consideringozone formation in the transition regime, Environ. Sci. Technol.,53, 1404–1412, 2019.
Wang, S., He, B., Yuan, M., Su, F., Yin, S., Yan, Q., Jiang,N., Zhang, R., and Tang, X.: Characterization of indi-vidual particles and meteorological conditions duringthe cold season in Zhengzhou using a single particle
aerosol mass spectrometer, Atmos. Res., 219, 13–23,https://doi.org/10.1016/j.atmosres.2018.12.021, 2019.
Wang, W., Jing, L., Zhan, J., Wang, B., Zhang, D. P., Zhang, H. W.,Wang, D. Q., Yang, Y., Zhao, J., Sun, Y. F., Bi, X. H., Wang,X. T., and Feng, J. L.: Nitrated polycyclic aromatic hydrocarbonpollution during the Shanghai World Expo 2010, Atmos. Envi-ron., 89, 242–248, 2014.
Wei, X.-Y., Liu, M., Yang, J., Du, W.-N., Sun, X., Huang, Y.-P.,Zhang, X., Khalil, S. K., Luo, D.-M., and Zhou, Y.-D.: Character-ization of PM2.5-bound PAHs and carbonaceous aerosols duringthree-month severe haze episode in Shanghai, China: Chemicalcomposition, source apportionment and long-range transporta-tion, Atmos. Environ., 203, 1–9, 2019.
Wu, F., Yu, Y., Sun, J., Zhang, J., Wang, J., Tang, G., and Wang, Y.:Characteristics, source apportionment and reactivity of ambientvolatile organic compounds at Dinghu Mountain in GuangdongProvince, China, Sci. Total Environ., 548–549, 347–359, 2016.
Wu, R., Li, J., Hao, Y., Li, Y., Zeng, L., and Xie, S.: Evolution pro-cess and sources of ambient volatile organic compounds duringa severe haze event in Beijing, China, Sci. Total Environ., 560–561, 62–72, https://doi.org/10.1016/j.scitotenv.2016.04.030,2016.
Xiong, Y. and Du, K.: Source-resolved attribution of ground-level ozone formation potential from VOC emissions inMetropolitan Vancouver, BC, Sci. Total Environ., 721, 137698,https://doi.org/10.1016/j.scitotenv.2020.137698, 2020.
Xu, W., Liu, X., Liu, L., Dore, A. J., Tang, A., Lu, L., Wu, Q.,Zhang, Y., Hao, T., Pan, Y., Chen, J., and Zhang, F.: Impact ofemission controls on air quality in Beijing during APEC 2014:Implications from water-soluble ions and carbonaceous aerosolin PM2.5 and their precursors, Atmos. Environ., 210, 241–252,2019.
Yadav, R., Sahu, L. K., Tripathi, N., Pal, D., Beig, G., and Jaaffrey,S. N. A.: Investigation of emission characteristics of NMVOCsover urban site of western India, Environ. Pollut., 252, 245–255,2019.
Yan, Y., Peng, L., Li, R., Li, Y., Li, L., and Bai, H.: Concentra-tion, ozone formation potential and source analysis of volatileorganic compounds (VOCs) in a thermal power station central-ized area: A study in Shuozhou, China, Environ. Pollut., 223,295–304, 2017.
Yang, W., Zhang, Y., Wang, X., Li, S., Zhu, M., Yu, Q., Li, G.,Huang, Z., Zhang, H., Wu, Z., Song, W., Tan, J., and Shao, M.:Volatile organic compounds at a rural site in Beijing: influenceof temporary emission control and wintertime heating, Atmos.Chem. Phys., 18, 12663–12682, https://doi.org/10.5194/acp-18-12663-2018, 2018.
Yang, Y., Ji, D., Sun, J., Wang, Y., Yao, D., Zhao, S., Yu, X.,Zeng, L., Zhang, R., Zhang, H., Wang, Y., and Wang, Y.: Am-bient volatile organic compounds in a suburban site betweenBeijing and Tianjin: Concentration levels, source apportionmentand health risk assessment, Sci. Total Environ., 695, 133889,https://doi.org/10.1016/j.scitotenv.2019.133889, 2019a.
Yenisoy-Karakas, S., Dorter, M., and Odabasi, M.: Intra-day and interday variations of 69 volatile organic com-pounds (BVOCs and AVOCs) and their source profilesat a semi-urban site, Sci. Total Environ., 723, 138028,https://doi.org/10.1016/j.scitotenv.2020.138028, 2020.
Atmos. Chem. Phys., 21, 15239–15257, 2021 https://doi.org/10.5194/acp-21-15239-2021

S. Yu et al.: VOC characteristics during the control period 15257
Yu, S., Yin, S., Zhang, R., Wang, L., Su, F., Zhang, Y., and Yang,J.: Spatiotemporal characterization and regional contributions ofO3 and NO2: An investigation of two years of monitoring datain Henan, China, J. Environ. Sci.-China, 90, 29–40, 2020.
Zeng, P., Lyu, X. P., Guo, H., Cheng, H. R., Jiang, F., Pan, W. Z.,Wang, Z. W., Liang, S. W., and Hu, Y. Q.: Causes of ozone pollu-tion in summer in Wuhan, Central China, Environ. Pollut., 241,852–861, 2018.
Zhang, H., Chen, G., Hu, J., Chen, S., Wiedinmyer, C., Klee-man, M., and Ying, Q.: Evaluation of a seven-year air qual-ity simulation using the Weather Research and Forecasting(WRF)/Community Multiscale Air Quality (CMAQ) models inthe eastern United States, Sci. Total Environ., 473–474, 275–85,2014.
Zhang, Y., Wang, X., Zhang, Z., Lu, S., Huang, Z., and Li, L.:Sources of C(2)-C(4) alkenes, the most important ozone non-methane hydrocarbon precursors in the Pearl River Delta region,Sci. Total Environ., 502, 236–245, 2015.
Zhang, Y., Li, R., Fu, H., Zhou, D., and Chen, J.: Ob-servation and analysis of atmospheric volatile organiccompounds in a typical petrochemical area in YangtzeRiver Delta, China, J. Environ. Sci.-China, 71, 117312,https://doi.org/10.1016/j.jes.2018.05.027, 2018.
Zhang, Y., Sun, J., Zheng, P., Chen, T., Liu, Y., Han, G., Simpson,I. J., Wang, X., Blake, D. R., Li, Z., Yang, X., Qi, Y., Wang,Q., Wang, W., and Xue, L.: Observations of C1-C5 alkyl nitratesin the Yellow River Delta, northern China: Effects of biomassburning and oil field emissions, Sci. Total Environ., 656, 129–139, 2019.
Zhang, Y., Hong, Z., Chen, J., Xu, L., Hong, Y., Li, M., Hao, H.,Chen, Y., Qiu, Y., Wu, X., Li, J.-R., Tong, L., and Xiao, H.: Im-pact of control measures and typhoon weather on characteristicsand formation of PM2.5 during the 2016 G20 summit in China,Atmos. Environ., 224, 233–248, 2020.
Zheng, H., Kong, S., Xing, X., Mao, Y., Hu, T., Ding, Y., Li,G., Liu, D., Li, S., and Qi, S.: Monitoring of volatile or-ganic compounds (VOCs) from an oil and gas station in north-west China for 1 year, Atmos. Chem. Phys., 18, 4567–4595,https://doi.org/10.5194/acp-18-4567-2018, 2018.
Zheng, H., Kong, S., Yan, Y., Chen, N., Yao, L., Liu, X.,Wu, F., Cheng, Y., Niu, Z., Zheng, S., Zeng, X., Yan, Q.,Wu, J., Zheng, M., Liu, D., Zhao, D., and Qi, S.: Com-positions, sources and health risks of ambient volatile or-ganic compounds (VOCs) at a petrochemical industrial parkalong the Yangtze River, Sci. Total Environ., 703, 135505,https://doi.org/10.1016/j.scitotenv.2019.135505, 2020.
Zou, Y., Deng, X. J., Zhu, D., Gong, D. C., Wang, H., Li, F., Tan,H. B., Deng, T., Mai, B. R., Liu, X. T., and Wang, B. G.: Charac-teristics of 1 year of observational data of VOCs, NOx and O3 ata suburban site in Guangzhou, China, Atmos. Chem. Phys., 15,6625–6636, https://doi.org/10.5194/acp-15-6625-2015, 2015.
Zou, Y., Charlesworth, E., Yin, C. Q., Yan, X. L., Deng, X. J.,and Li, F.: The weekday/weekend ozone differences induced bythe emissions change during summer and autumn in Guangzhou,China, Atmos. Environ., 199, 114–126, 2019.
https://doi.org/10.5194/acp-21-15239-2021 Atmos. Chem. Phys., 21, 15239–15257, 2021