characterization of a world trade center dust sample by f...
TRANSCRIPT

Characterization of a World Trade Center Dust Sample
By F. R. Greening and T. N. Greening
Abstract
This report describes the characterization of a sample of WTC dust recovered from
the outer clothing of Ms. Christine Sakoutis – a WTC first responder. Ms. Sakoutis
was exposed to the cloud of dust and debris that formed immediately after the
collapse of WTC 2 when she was standing near the corner of Fulton St. and
Broadway – a location ~ 300 meters east of WTC 2. Analysis of SEM and optical
images of the WTC 2 sample showed that the average particle size was about 135
µm. The as-received WTC 2 sample was separated into two fractions using a bar
magnet and each fraction – magnetic and non-magnetic – was analyzed for its
elemental composition using the EDX attachment of a Scanning Electron
Microscope. The non-magnetic particles in the WTC 2 sample showed two distinct
morphologies: (i) Amorphous, and (ii) Spherical. From the associated EDX
analyses, it was concluded that the amorphous particles are debris from crushed
concrete and/or gypsum wallboard. In contrast, the non-magnetic spherical
particles appear to be derived mostly from fly ash that was a component of the
aggregate used in the WTC concrete. The alternative hypothesis – that the
spherical particles observed in WTC dust were formed in the WTC fires – has been
ruled out by considering the maximum temperature attained by the WTC concrete
floor slabs, which was certainly less than 900 °C and therefore insufficient to melt,
let alone sphericize, a glassy aluminosilicate slag. The WTC 2 sample also
contained about 0.1 % of spherical magnetic particles. As with their glassy
counterparts, the shape of these particles indicates they were molten at the time of
their formation. EDX analysis of these particles showed iron or iron oxide, albeit
with varying degrees of surface contamination from concrete dust. The Mn/Fe
ratio for these particles is consistent with WTC structural steel. It follows that
these particles were heated to at least 1500 °C at the time of their formation. Fire
tests carried out by NIST on reconstructed WTC workstations and floor assemblies
showed that steel members reached a maximum temperature of only about 800 °C,
which is well below the melting point of steel. It is therefore suggested that the
iron-rich spherical particles in the WTC 2 sample are from on-site cutting and
grinding operations that were carried out during the construction of the Twin
Towers.

1.0 Introduction
As numerous photos and videos of the events at the World Trade Center (WTC) in
New York City on September 11th 2001 dramatically show, copious quantities of
dust were ejected into the air during the collapse of WTC 1 & 2. Subsequent
analyses of samples of this dust have shown that it consists mainly of pulverized
concrete, gypsum and vitreous fibers used in the construction, insulation and
fireproofing of the Twin Towers. Most of the steel that formed the major structural
elements of the Twin Towers was not “pulverized to dust”, as sometimes alleged,
but fell as large, severely damaged sections onto the vast rubble pile that formed
close to the footprint of the Towers now referred to as “Ground Zero”. Chemical
analysis of the WTC dust has confirmed that it contained relatively small amounts
of iron in comparison to chemically combined forms of calcium. The principal
chemical forms of calcium in concrete and gypsum are silicates and sulfates, which
are about 18 wt % and 23 wt % calcium, respectively. This is consistent with the
fact that samples of WTC dust generally contain about 20 % by weight of calcium.
There are many existing studies of the chemical composition of WTC dust. The
most useful sources of such data are those published by research groups associated
with the US Environmental Protection Agency (EPA) and the US Geological
Survey (USGS), as contained in reports authored by P.J. Lioy et al. [1], J. K.
McGee et al. [2], R. N. Clark et al. [3], and G. P. Meeker et al. [4], J. S. Gaffney et
al. [5], as well as reports published by independent researchers [6,7].
While valuable insights into the nature of the material loosely known as “WTC
dust” may be obtained from these and other reports to be discussed later, caution
must be exercised in directly comparing analytical results presented by these
different authors. The reason for this is that the analyses in question depend on
three major factors.
(i) When, after the collapse of the Twin Towers, were the samples
collected?
(ii) Where, in relation to Ground Zero, were the samples collected?
(iii) How were the samples treated after collection; for example, were they
size-fractionated (usually by sieving) before analysis.
Clearly, the ideal WTC dust sample would be one collected immediately after the
collapse of the Twin Towers. This is because periods of rain, (such as those that
occurred in the days following September 11th 2001), could potentially alter the

composition of the deposited dust especially with regard to soluble species such as
Na+, K+, Ca2+, Cl, etc; hence the importance of factor (i), listed above.
Factors (ii) and (iii) are important because a natural size-fractionation of the WTC
dust occurred as it deposited over Lower Manhattan - the coarser particles settling
close to Ground Zero while the smaller particles were transported by the prevailing
winds to Staten Island, Brooklyn, New Jersey, etc - locations many kilometers
from the WTC site. Thus, coarse high-density fragments, such as shards of metal,
would be enriched in samples collected close to Ground Zero while fine, low-
density particles such as carbonaceous materials and man-made vitreous fibers are
likely to be enriched in samples collected at more remote locations.
With the above considerations in mind it is probable that the analytical data in
References [1 – 3] are the most representative of “as-formed” WTC dust because
these analyses were carried out on samples collected within one week of 9/11.
However, it is important to recognize that the data in references [1] and [2] are for
sieved samples and the results for the < 2.5 m fraction were emphasized because
this material represents the respirable particulate of interest in toxicological
assessment of the WTC dust. By comparison, the data in reference [3] was derived
from “as-collected” material and therefore probably constitutes one of the few data
sets that is truly representative of the composition of bulk, “as-formed”, WTC dust.
In this report, we present data from the characterization of a previously unanalyzed
sample of WTC dust that was “collected” literally within seconds of the collapse of
WTC 2 – the first building to fall after aircraft struck the Towers. I received this
sample from Ms. Christine Sakoutis – a 9/11 “First-Responder” – who was
walking near Fulton St. and Broadway on the morning of September 11th, 2001,
which is only ~ 300 meters from the South Tower, when it collapsed. There is
extant video footage showing that this location was engulfed in the South Tower
collapse dust cloud, and Ms. Sakoutis has informed me that within minutes of the
collapse “she was totally covered in dust”. Later that day Ms. Sakoutis returned
home and put her dust-covered outer clothing in a plastic bag which remained,
untouched, until she heard of my interest in analyzing WTC dust samples. Thus, in
late 2016, a small sample of this WTC dust was sent to me in a sealed Ziploc bag.
In view of its known provenance, the sample provided by Ms. Sakoutis is quite
clearly unadulterated WTC dust because it was particulate “fallout” from the
collapse of WTC 2. Furthermore, the sample was transferred by turbulent air
advection directly from the collapsing South Tower (WTC 2), to a first-responder’s
clothing, and thence by shaking this clothing, to a clean plastic Ziploc bag. Thus,

the sample may be considered to be free from contamination by any other sources
of New York City “dust”, and free from any contamination introduced by clean-up
activities at ground-zero in the aftermath of the Twin Tower’s collapse.
2.0 Sample Description
The as-received sample, shown in Figure 1, consisted of about 20 mg of a fine tan-
colored granular powder in a Ziploc bag, (N.B. Photo includes centimeter scale)
Figure 1: As-Received WTC Dust Sample in Ziploc Bag
(Showing a Centimeter Ruler for Scale)
2.1 Analytical Procedures
Sub-samples of WTC dust were prepared from the as-received sample as follows:
1. A few mg of material was transferred to a 1cm2 piece of transparent double-
sided adhesive tape and mounted on a glass slide for optical microscopy.
2. A few mg of material was transferred to a 1 cm2 piece of carbon tape and
mounted on an aluminum stub for scanning electron microscopy (SEM) and
energy dispersive X-ray (EDX) analysis.

3. Magnetic particles were separated from the bulk sample by drawing a 1̎ × 3 ̎
bar magnet across the outside of the Ziploc sample bag shown in Figure 1.
The separated magnetic material was processed as described in step 2,
above.
Optical microscopy was carried out at magnifications of approximately 10×, 60×,
and 200×. Particle size analysis was carried out manually using printed images of
particle fields, approximately 2 mm × 3 mm, containing at least 100 particles per
analyzed image.
SEM was carried out at the McMaster University Microscopy Center using a JEOL
JSM-6610LV with an Oxford Instruments X-max 20 mm2 Energy Dispersive X-
ray attachment.
3.0 Results
A total of 40 optical and 10 SEM micrographs of the as-received WTC dust, and
20 optical and 10 SEM micrographs of the magnetically separated material, were
recorded. Of these images, three as-received samples were used for particle size
analysis and the measured particle sizes were very consistent between these sub-
samples; typical examples of these images are presented in Section 3.1. The
associated EDS spectra are presented and discussed in Section 3.2. Finally, the
magnetically separated particles are considered in Section 3.3.
3.1 Particle Size and Morphology
Figures 2 and 3 are optical and SEM micrographs of the same sub-sample of WTC
dust particles. The SEM image shown in Figure 3 also identifies individual
particles that were subjected to Energy Dispersive X-Ray analysis, the results of
which are discussed in Section 3.2 of this report.
The optical and complementary SEM images show particles of four main types:
(i) White, amorphous “chunks” of material (~ 50%)
(ii) Ellipsoidal, “tear drop”, or spherical glassy particles (~ 30%)
(iii) Fibrous material (~15%)
(iv) Sharp-edged, approximately triangular, fragments (~ 5%)
Figure 2: Optical Micrograph (60×) of a Collection of WTC 2 Particles
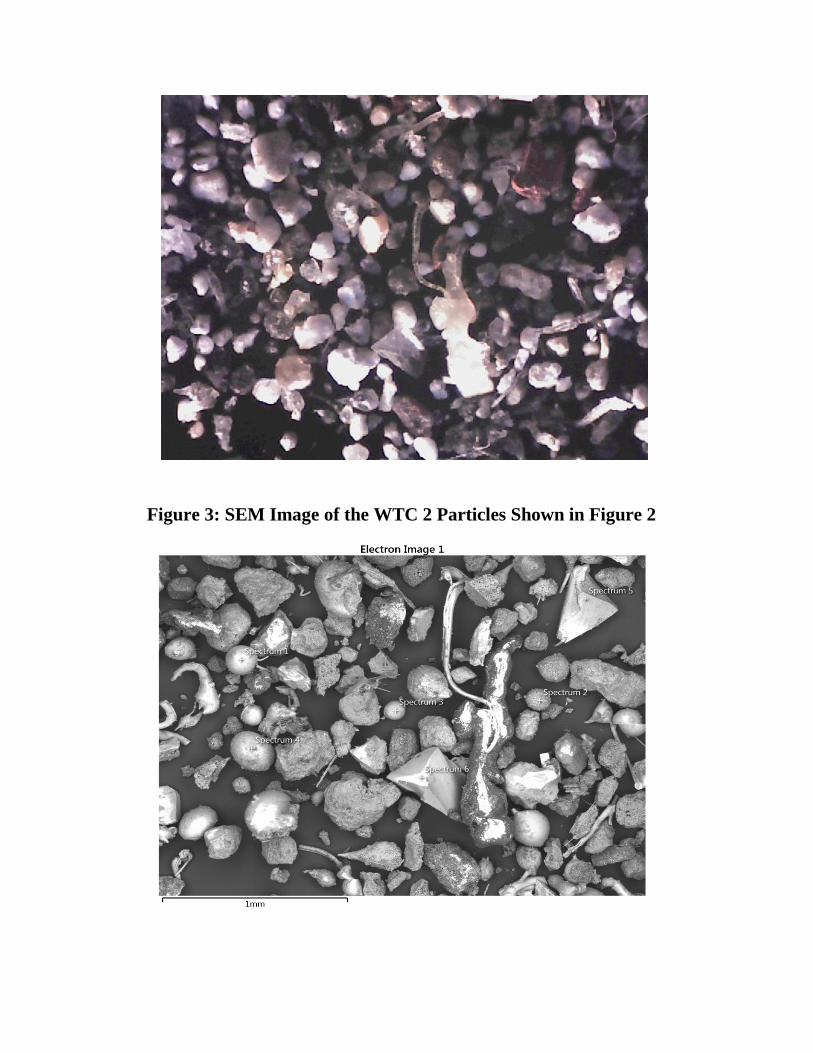
Figure 3: SEM Image of the WTC 2 Particles Shown in Figure 2
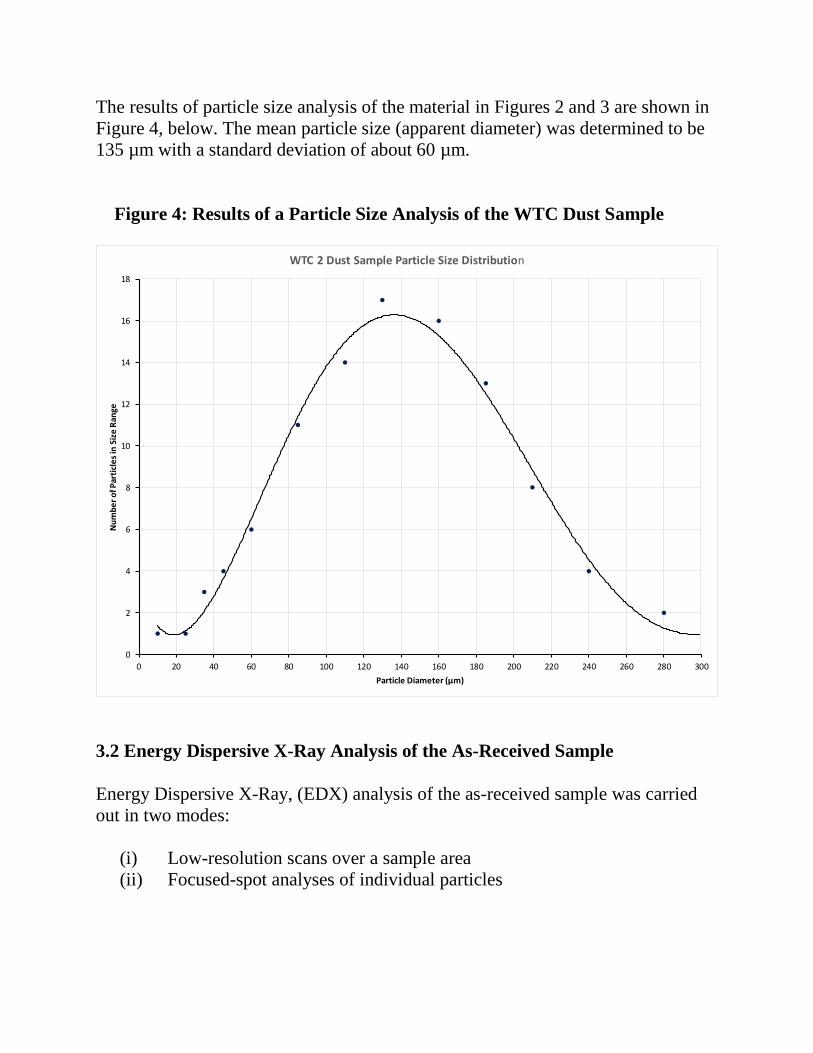
The results of particle size analysis of the material in Figures 2 and 3 are shown in
Figure 4, below. The mean particle size (apparent diameter) was determined to be
135 µm with a standard deviation of about 60 µm.
Figure 4: Results of a Particle Size Analysis of the WTC Dust Sample
3.2 Energy Dispersive X-Ray Analysis of the As-Received Sample
Energy Dispersive X-Ray, (EDX) analysis of the as-received sample was carried
out in two modes:
(i) Low-resolution scans over a sample area
(ii) Focused-spot analyses of individual particles
0
2
4
6
8
10
12
14
16
18
0 20 40 60 80 100 120 140 160 180 200 220 240 260 280 300
Nu
mb
er
of P
arti
cle
s in
Siz
e R
ange
Particle Diameter (µm)
WTC 2 Dust Sample Particle Size Distribution

3.2.1 Low-resolution Scans
Four randomly selected areas of the ~ 1 cm2 carbon tape substrate prepared for the
WTC sample characterization were scanned by the EDX analyzer and the resulting
elemental data averaged. Because the carbon signal is enhanced by this method of
analysis, the carbon contribution to the EDX signal was removed from the
elemental total. Oxygen, typically ~ 50%, was also excluded from the data and the
remaining elements adjusted to 100 %. The resulting percent concentrations are
given in Table 1 and are compared to data from Reference [3].
Table 1: EDX Analysis of WTC 2 Sample Compared to USGS WTC Data
Element
EDX Analysis Result (Wt %)
WTC 2 USGS (min) USGS (max)
Na 0.6 0.1 1.2
Mg 1.8 1.8 6.9
Al 1.9 2.3 4.1
Si 8.0 11.4 26.3
S 5.3 0.9 5.8
Cl 0.1 - -
K 0.4 0.3 0.7
Ca 17.6 9.6 26.0
Ti 0.2 0.2 0.4
Fe 1.1 0.6 4.1
The principal elements in the WTC 2 sample are calcium, silicon and sulphur,
which is consistent with the expected high abundance of concrete and gypsum
wallboard particles in the Twin Towers. With a couple of exceptions such as Si and
Al, the elemental concentrations found in the WTC 2 sample fall within the range
of the USGS data for their WTC dust samples.

3.2.2 Focused-Spot Analyses
EDX spectra were collected in focused-spot mode for a number of the particles
shown in Figure 3. The resulting spectra for five of these particles are shown in
Figures 5a – 5e. Table 2 provides the associated elemental concentrations,
including oxygen data, but with carbon data removed and the data normalized to
100%.
Analytical data for an additional particle – particle 6, shown in Figure 5f – was
also collected. This particle was selected because of its unusual appearance which
shows a circular impression left by a 50 µm spherical particle. The EDX spectrum
recorded inside this impression is shown in Figure 5g, and the associated analytical
data are included in Table 2.
Figure 5a: EDX Spectrum of Particle 1
Figure 5b: EDX Spectrum of Particle 2

Figure 5c: EDX Spectrum of Particle 3
Figure 5d: EDX Spectrum of Particle 4
Figure 5e: EDX Spectrum of Particle 5

Figure 5f: SEM Image of the WTC 2 Sample Showing a Circular
Impression left in a Concrete Matrix by a Spherical Particle
Figure 5g: EDX Spectrum Collected in the Circular Impression
Shown in Figure 6a (Referred to as Particle 6 in Table 2)
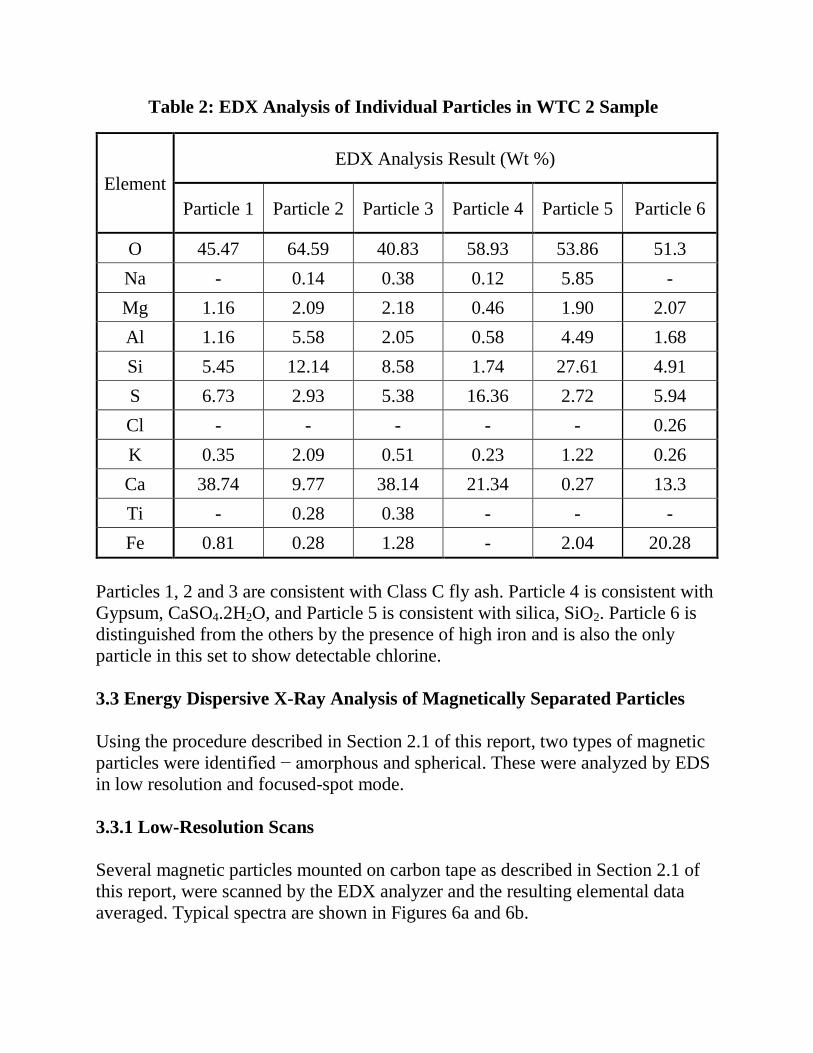
Table 2: EDX Analysis of Individual Particles in WTC 2 Sample
Element
EDX Analysis Result (Wt %)
Particle 1 Particle 2 Particle 3 Particle 4 Particle 5 Particle 6
O 45.47 64.59 40.83 58.93 53.86 51.3
Na - 0.14 0.38 0.12 5.85 -
Mg 1.16 2.09 2.18 0.46 1.90 2.07
Al 1.16 5.58 2.05 0.58 4.49 1.68
Si 5.45 12.14 8.58 1.74 27.61 4.91
S 6.73 2.93 5.38 16.36 2.72 5.94
Cl - - - - - 0.26
K 0.35 2.09 0.51 0.23 1.22 0.26
Ca 38.74 9.77 38.14 21.34 0.27 13.3
Ti - 0.28 0.38 - - -
Fe 0.81 0.28 1.28 - 2.04 20.28
Particles 1, 2 and 3 are consistent with Class C fly ash. Particle 4 is consistent with
Gypsum, CaSO4.2H2O, and Particle 5 is consistent with silica, SiO2. Particle 6 is
distinguished from the others by the presence of high iron and is also the only
particle in this set to show detectable chlorine.
3.3 Energy Dispersive X-Ray Analysis of Magnetically Separated Particles
Using the procedure described in Section 2.1 of this report, two types of magnetic
particles were identified − amorphous and spherical. These were analyzed by EDS
in low resolution and focused-spot mode.
3.3.1 Low-Resolution Scans
Several magnetic particles mounted on carbon tape as described in Section 2.1 of
this report, were scanned by the EDX analyzer and the resulting elemental data
averaged. Typical spectra are shown in Figures 6a and 6b.

Figure 6a: Low-Resolution EDX Spectrum of Magnetic Particles: Group I
Figure 6b: Low-Resolution EDX Spectrum of Magnetic Particles: Group II
Because the carbon signal is enhanced by scanning the carbon mounting tape, the
carbon contribution to the EDX signal was removed from the elemental total.
Oxygen, typically ~ 40 %, was also excluded from the data and the remaining
elements adjusted to 100 %. The resulting percent concentrations are given in
Table 3 below

Table 3: EDX Analysis of Two Groups of WTC 2 Magnetic Particles
Element
EDX Analysis Result (wt %)
Group I Group II
Na - 1.34
Mg 2.22 16.51
Al 0.96 14.36
Si 3.00 33.27
S 0.80 -
Cl 0.42 0.27
K 0.36 11.69
Ca 2.58 -
Ti 8.26 2.43
Cr - 0.67
Mn 5.62 0.19
Fe 75.76 19.29
Mn/Fe 0.74 0.01
The data in Table 3 show significant differences between Group I and Group II
magnetic particles. The former Group is truly iron-rich with small amounts of Si,
Ca and Al contamination. The high levels of Mn in Group I particles is noteworthy
and will be discussed in Section 4.3 of this report. By comparison, the second
Group of particles is relatively iron-poor and appears to be dominated by ferro-
aluminosilicates.
3.3.2 Analysis of Individual Amorphous Magnetic Particles
Examples of amorphous magnetic particles are shown in Figure 7, and some of the
associated EDS spectra are shown in Figures 8a and 8b. Table 4 provides a
summary of the associated elemental concentrations, including oxygen data, but
with the carbon data removed and the data normalized to 100%.

Figure 7: SEM Image of Amorphous Magnetic Particles
Figure 8a: EDX Spectrum of Magnetic Particle 1A (on left of Fig 7)
Figure 8b: EDX Spectrum of Magnetic Particle 2A (on right of Fig 7)

Table 4: EDX Analysis of Amorphous Magnetic Particles
Element
EDX Analysis Result (Wt %)
Particle 1A (Left in Fig 7) Particle 2A (Right in Fig 7)
O 20.57 28.03
Na 0.96 -
Al 0.18 -
Si 3.14 0.29
S 0.30 0.44
Cl 0.19 -
K 1.14 -
Ca 0.81 -
Ti 0.83 -
Mn 6.92 0.53
Fe 64.99 70.71
Ratio Fe/O 3.16 2.52
Ratio Mn/Fe 0.106 0.0075
The Fe/O ratios exhibited by both particle 1A and 2A, (See Table 4), indicate that
the iron in these particles is present in the form of an iron oxide, (presumably close
to pure magnetite, Fe3O4, for particle 2A for which the Fe/O ratio should be 2.62).
However, particle 1A is clearly contaminated with silicates of sodium, potassium
and calcium which influence the observed Fe/O ratio. The unusual Mn/Fe ratio
shown by particle 1A is discussed in more detail in Section 4.3 of this report.

3.3.3 Analysis of Individual Spherical Magnetic Particles
A significant feature of the present WTC 2 sample, which has also been observed
in many other WTC dust samples, is the presence of magnetic, iron-rich
microspheres. Two spherical magnetic particles observed in the present sample are
shown in Figure 9, and the associated EDS spectra is shown in Figures 10 and 11.
Figure 9: SEM Image of Two Spherical Magnetic Particles
Figure 10: EDX Spectrum of the Larger Spherical Particle in Fig 9

Figure 11: EDX Spectrum of the Smaller Spherical Particle in Fig 9
A third spherical magnetic particles observed in the WTC 2 sample is shown in
Figure 12, and the associated EDS spectrum is shown in Figure 13.
Figure 12: EDX Spectrum of a Third Spherical Particle

Figure 13: EDX Spectrum of the Spherical Particle in Fig. 12
Table 5, below, provides a summary of the elemental concentrations for the three
spherical particles discussed above, including oxygen data, but with carbon data
removed and normalized to 100%.
Table 5: EDX Analysis of Spherical Magnetic Particles
Element
EDX Analysis Result (Wt %)
Particle 1S
Larger Particle (Fig 8)
Particle 2S
Smaller Particle (Fig 8)
Particle 3S
Large Particle (Fig 11)
O 27.56 12.61 29.40
Al - 0.18 -
Si 0.16 0.23 -
S - 0.93 -
Ca - 0.49 0.23
Mn 0.89 1.20 1.12
Fe 71.40 84.35 69.24
Fe/O
Ratio 2.59 6.69 2.36
Mn/Fe
Ratio 0.0125 0.0143 0.0162

The Fe/O ratios exhibited by both particle 1S and 3S, (See Table 5), indicate that
the iron in these particles is present in the form of an iron oxide, presumably
magnetite, Fe3O4, for particle 1S, for which the Fe/O ratio should be 2.62, and
maghemite, γ-Fe2O3, for particle 3S, for which the Fe/O ratio should be 2.33.
Particle 2S, with a Fe/O ratio of 6.69, appears to be metallic iron contaminated
with traces of gypsum and aluminosilicates. The Mn/Fe ratios shown in Table 5 for
particles 1S – 3S are discussed in more detail in Section 4.3 of this report.
4.0 Discussion
In this report, we document the characterization of a sample of the airborne dust
that formed over Lower Manhattan immediately after the collapse of WTC 2.
However, in order to fully understand the nature of this dust, we also need to
consider how the dust was formed and how it was dispersed and transported before
settling. This is described in Section 4.1, below, while Sections 4.2 and 4.3
consider the physical and chemical properties of the dust, respectively.
4.1 The Collapse of WTC 2: Debris Ejection and Dispersal
A. Observations made on September 11th, 2001
The collapse of WTC 2 was captured on many videos recorded at the time;
complete collapse videos showing that the building fell to the ground in about 11
seconds. This event was immediately followed by the formation of a rapidly
growing debris cloud, as depicted in Figure 13a which was taken at the intersection
of Fulton and Broadway in Lower Manhattan. (Figure 13b shows how this location
looks today (2017), and how close it is to ground zero). This is also the location of
the collection of the WTC2 dust sample discussed in this report.
The dust cloud shown in Figure 14a was recorded about 30 seconds after the
collapse of WTC 2 and allows one to estimate that the cloud was advancing at a
horizontal velocity in the range 5 – 10 m/s. About 15 seconds after the image in
Figure 14a was recorded, the Fulton and Broadway location was totally engulfed in
WTC2 dust. Images recorded within the dust cloud reveal a dense swirling fog,
with deposited particles evident on the camera lens.
A photo taken across the Hudson River, near the Morris Canal Basin, shortly after
the collapse of WTC 2, (See Figure 15), shows that the debris cloud formed by the
collapse expanded to cover most of Lower Manhattan.

Figure 14a: The WTC 2 Dust Cloud Photographed at the Intersection
of Fulton and Broadway about 20 seconds after the Collapse
Figure 14b: Photograph of the Intersection of Fulton and Broadway
Taken in 2017, Showing its Proximity to the World Trade Center

Figure 15: Photograph of Lower Manhattan taken from across the Hudson
River after the Collapse of WTC 2, showing the Expanding Debris Cloud
B. Theoretical Studies of Debris Formation and Motion from
Impact Fragmentation and/or Volcanic Eruptions
A good understanding of the generation and dispersion of the dust cloud that
formed in the aftermath of the collapse of WTC 2 may be gained by considering
data from surrogate systems:
(i) The impact fragmentation of materials such as glass, rock, and
concrete: The energetic ejection of fragments from these brittle
materials has been studied in many laboratory scale experiments on
the disruption or complete breakup of targets undergoing hard
impacts. Useful examples of studies on the particle size distribution
and ejection velocities of debris from hard impacts on brittle
materials may be found in references [8, 9, 10, 11, 12].

These studies show that the ejection of debris by impact
fragmentation of brittle materials may be attributed to the release of
strain energy from rapid compressive loading. Experimental data
also show that only a fraction, fke, of the total elastic strain energy
stored in a material up to the point of the initiation of fragmentation
appears as fragment kinetic energy. In Reference [12] the kinetic
energy of fragments released during rock fracturing by a Split
Hopkinson Pressure Bar system was measured as a function of the
incident impact energy. The measurements showed that the ratio of
fragment kinetic energy to impact energy increases in proportion to
the speed of the striker bar according to the equation:
Kinetic Energy/Incident Energy = (0.69.Vo + 0.22)/100 ……..(1)
Where Vo is the impact velocity in m/s. Equation (1) may be applied
to the collapse of WTC 2 using the upper limit of its effective
collapse velocity. This was estimated in reference [13] to be about
51 m/s for the upper block of WTC 2 at the end of the first stage of
collapse. Then using equation 1, we conclude that about 35% of the
impact energy available near the end of the collapse of WTC 2 was
converted into kinetic energy of the ejected fragments.
As discussed in reference [13], the upper section above floor 81 of
WTC 2 fell on the floors below, so we assume that 29/110 × 100%
or 26% of the mass of WTC 2 fell on these floors. For a total
building mass of 350,000 tonnes, and assuming there was complete
mass shedding by the lower impacted floors, we have a mass of 9.1
× 107 kg reaching the ground at 51 m/s. This implies a final impact
energy of ½ × (9.1 × 107) × (51)2 or 1.18 × 10¹¹ joules. Then from
Equation (1) we estimate that the kinetic energy imparted to the
fragments formed by the final impact and destruction of the upper
section of WTC 2 was 35% of 1.18 × 10¹¹ joules, or 4.13 × 10¹⁰
joules. Now the mass of concrete in the 29 upper floors of WTC 2
was ~ 1.82 × 10⁷ kg, (See reference [14]), so, the average ejection
velocity, Veject, of fragments from the collapse of WTC 2 is given
by:
1.18 × 10¹¹ joules = ½ × (1.82 × 10⁷).(Veject)2
This predicts an average fragment ejection velocity of 114 m/s.

Nevertheless, videos of the collapse of WTC 2 show this velocity
was not sustained for very long – probably for less than 1 second.
The heights of buildings near the World Trade Center, such as WFC
3 (222 m), WFC 2 (194 m), and WFC 1 (173 m), in Figure 14, show
that the plume rise from the collapse of WTC 2 was in fact only
about 150 meters.
(ii) Experimental studies and theoretical analyses of the ejection of
volcanic ash, or “tephra”: These may be used to simulate the
behavior of debris clouds formed by the collapse of the Twin
Towers. Studies of the dispersion and atmospheric settling of dust
particles injected into the atmosphere by small volcanic eruptions
are especially useful in this regard - see references [15, 16] - and
show that the settling time of an airborne particle depends on the
drag force acting on the particle. This, in turn, depends on the
particle’s cross-sectional area, modified by a drag coefficient, Cd, to
allow for the particle’s shape and the type of airflow experienced by
the particle, e.g. laminar, turbulent, etc. The drag coefficient Cd is
inversely proportional to the particle’s Reynolds number, Re.
Reference [16] provides an equation for the terminal velocity, Vt, of
particles in the size range 50 µm to 5 mm − the range of interest for
the WTC 2 dust sample:
Vt = d(4ρp2g2/225µρa)
1/3 (0.4 < Re , 500) ……….(2)
Where,
d is the particle diameter
ρp is the density of the particle
g is the acceleration due to gravity
µ is the dynamic viscosity of air
ρa is the density of air
This equation predicts a settling velocity of 1.2 m/s for 135 µm
particles of density 3000 kg/m3.
As we have seen, in the first few seconds after the main mass of WTC
2 debris struck the ground, a 150-meter tall cloud of dust was formed
and spread over Lower Manhattan. During the initial phase of the
collapse of the Tower, the rapid succession of hard impacts meant
that floor after floor of materials such as concrete, glass, wallboard

and insulation were pulverized. This massively destructive event,
which lasted less than 15 seconds was a violent and chaotic sieving
process that brought thousands of tons of course rubble to rest at
ground zero, while ejecting vast quantities of dust-sized particles
away from the rubble pile and into the surrounding environment.
It is the fate of this dust cloud that is of interest in the present
discussion and it may be shown that the airborne concentration C(x)
of a specified size of particle, falls-off with horizontal distance, x,
according to the formula:
C(x) = Co exp [- Vt x / U.H ]
Where,
Vt is the particle’s terminal settling velocity
U is the average speed of horizontal airflow
H is the initial height of the dust cloud
We shall consider the case of a fall-off in the airborne dust
concentration to 1 % of the initial value so that C(x)/Co = 0.01. The
distance from Ground Zero at which this reduced concentration
occurs is found by taking the natural logarithm of 0.01 so that:
x(1%) = 4.6 [ U.H / Vt]
Videos of the dust dispersion pattern over Lower Manhattan after the
collapse of WTC 2 show that the dust cloud which formed after the
main collapse, rose to a maximum height of about 150 meters and
subsequently expanded horizontally at a speed of about 5 m/s; thus,
we take the average height term, H, to be 75 m and the airflow speed
U to be 5 m/s. It follows that:
x(1%) = 1725 / Vt (m/s)
Using Equation (2), with the particle density assumed to be 3000
kg/m3, we find for the WTC 2 dust:
x(1%) = 1938 meters for 100 µm particles
x(1%) = 969 meters for 200 µm particles
x(1%) = 389 meters for 500 µm particles

In addition, for these three particle sizes, the predicted trends in the
relative concentrations of WTC 2 airborne dust as a function of
distance from ground zero are shown in the Figure 16 below.
Figure 16: Relative Airborne Concentration of WTC 2 Dust as a
Function of Distance from Ground Zero
Figure 16 shows that nearly all of the particle with diameters > 500 µm would
have settled within 300 meters of ground zero – a fact which explains the
paucity of large particle in the WTC 2 dust sample investigated in this report.
However, to be in a position to predict the particle size distribution observed
for the WTC 2 dust – see Figure 4 – would require knowledge of the size
distribution of the as-ejected dust.
4.2 On the Occurrence of Spherical Particles in the WTC 2 Sample
One of the most intriguing results of the characterization of the WTC 2 sample
discussed in this report is the occurrence of a significant number of spherical
particles. These particles are of two distinct types: iron-poor and iron-rich. In this
report, the term “iron-poor” is applied to particles containing less than 5 wt% iron;
the term “iron-rich” applies to particles containing greater than 50 wt% iron.
0
10
20
30
40
50
60
70
80
90
0 100 200 300 400 500 600 700 800 900 1000 1100 1200
Perc
en
t o
f M
axim
um
C
on
cen
trati
on
( %
)
Distance from Ground Zero (meters)
Fall-off in the Concentration of WTC 2 Airborne Dust with Distance from Ground Zero:Calculated trends for three different particle sizes
500 microns
200 microns
100 microns

4.2.1 Iron-Poor Spherical Particles
As discussed in Section 3.1, and clearly visible in Figures 2 and 3 of this report, the
WTC 2 sample contains a significant number, (~ 30%), of ellipsoidal, “tear drop”,
or spherical particles. Analysis of these particles shows they are glassy in nature
and consist mainly of calcium-aluminosilicates with small amounts, (< 5%), of
sodium, magnesium, potassium and iron. The fact that these particles are spherical,
or approximately spherical, indicates that they were formed by rapid cooling of
molten droplets of a glassy mineral. This is typical of the morphology of coal fly
ash particles referred to as cenospheres [17]. Figure 17 compares an optical and a
SEM micrograph of cenospheres in a fly ash sample, taken from reference [17].
Figure 17: Optical and SEM Micrographs of Cenospheres in Fly Ash

As noted in Section 1.0 of this report, World Trade Center dust has been analyzed
many times since 2001 and the most abundant elements detected are invariably
oxygen, calcium and silicon, which is consistent with the presence of calcium
silicate - the major chemical species found in concrete. However, there are other
ingredients in concrete, mostly stemming from aggregate, that account for up to
40% of the mass of the final product.
The most common chemical species added to normal weight concrete are alumina,
Al2O3, iron oxide, Fe2O3, and the minerals found in aggregate − typically crushed
rock, sand or sediment − and consists of aluminosilicates with variable amounts of
Ca, Fe, Na, K, and Mg impurities. However, for the concrete used in the WTC, fly
ash could have been added at up to 30 wt%.
The American Concrete Institute Report ACI 232.2R-96, [18] describes the use of
fly ash in concrete as required by ASTM C-618: Standard Specification for Coal
Fly Ash and Raw or Calcined Natural Pozzolan for Use in Concrete. This
specification divides fly ash into two classes based on their Si, Al, and Fe content:
Class C Fly Ash: SiO2 + Al2O3 + Fe2O3 ≥ 50%
Class F Fly Ash: SiO2 + Al2O3 + Fe2O3 ≥ 70%
Although not specified by ASTM C-618, Class C fly ash generally has about twice
the calcium content of Class F fly ash. Nevertheless, as the analytical data for
many types of fly ash show, fly ash can exhibit a wide range of compositions and
still satisfy ASTM C-618 for use as an additive to concrete. Table 6 compares the
chemical analysis of three particles in the WTC 2 sample with the extreme ranges
of compositions reported for North American fly ash in reference [19].
Clearly the agreement between the WTC 2 particle compositions and the
compositions observed for fly ash is by no means “perfect”. However, it is highly
probable that the surfaces of the WTC 2 particles are contaminated with gypsum
“fines” which would account for the elevated levels of calcium and sulphur
reported for these particles in Table 6. Correcting for the presence of contaminants,
the similarity between WTC 2 particles 1 – 3 and fly ash particles is notable and
supports the contention that these spherical, iron-poor particles are derived from
fly ash used in the WTC concrete. ACI Guide 302.1R for Concrete Floor and Slab
Construction was in effect at the time of the construction of the Twin Towers and
recommends that fine aggregate for floor concrete should be in the size range 150
µm to 500 µm.

Table 6: A Comparison of the Chemical Composition of Selected WTC 2
Particles with the Chemical Composition of Typical North American Fly Ash
Element
Chemical Composition (Wt %)
Particle 1 Particle 2 Particle 3 Fly Ash (Low) Fly Ash (High)
Na - 0.14 0.38 0.17 1.7
Mg 1.16 2.09 2.18 0.39 2.3
Al 1.16 5.58 2.05 7.0 14.0
Si 5.45 12.14 8.58 16.0 27.0
S 6.73 2.93 5.38 0.19 3.4
K 0.35 2.09 0.51 0.62 2.1
Ca 38.74 9.77 38.14 0.57 15.0
Fe 0.81 0.28 1.28 3.4 13.0
4.2.2 Other Potential Sources of Iron-Poor Spherical Particles in WTC 2 Dust
As we have seen, most of the iron-poor spherical particles in the WTC 2 sample
are glassy aluminosilicates, and it is known that such spherical particles are formed
when a molten glassy slag is rapidly cooled. This implies that all spherical
particles in the WTC 2 dust sample were molten at one time – but the question is
when? We have proposed that fly ash was a major component of the aggregate
used in the WTC concrete, and fly ash contains an abundance of spherical glassy
particles. Nevertheless, we need to consider the possibility of additional sources of
spherical particles in the WTC 2 sample, and in particular if spherical particles
could have been produced in situ by the fires.
Aluminosilicate glasses do not have a precise melting point. However, typical
viscosity-temperature curves for these materials show they soften above about 700
°C, and flow above 1000 °C. Thus, we first need to consider if the fires started by
the aircraft impacts on the Twin Towers were hot enough to melt the construction
materials used in these buildings, and in particular the concrete aggregate in the
fire affected zones of WTC 2.

Obviously, there are no direct measurements of the temperatures in the WTC fires.
However, NIST did carry out so-called “fire dynamic simulations”, or FDS, using
data collected from hydrocarbon-fueled fire tests on reconstructed WTC offices.
Most floors of the Twin Towers were populated by up to 200 cubicles, or
“workstations”, each approximately 10 m2 in area. NIST estimate that the average
workstation contained approximately 200 kg of combustible mass, and more than
60 % of this mass was made up of cellulose-based product, while the remainder
was largely plastic. Using this, and tenant occupancy data, NIST estimate that the
total combustible mass of material on the average WTC floor was about 40,000 kg,
corresponding to a combustible live load of about 20 kg/m2 per floor.
The results of NIST’s fire dynamic simulations are reported in sections NCSTAR
1-5C and 1-5E of their report: “Federal Building and Fire Safety Investigation of
the World Trade Center Disaster”, and show:
(i) Each WTC workstation burned with a relatively constant heat
release rate of about 2.4 MW for about 1500 seconds (25 minutes)
(ii) The maximum sustained upper layer, (ceiling), gas temperature
in the workstation test fires was about 900 °C
(iii) Unprotected steel reaches about 800 °C, or 100 °C short of the
gas temperature, after a 25-minute exposure to a 20 kg/m2 fire
(iv) 2.5 cm of sprayed-on fire resistant material (SFRM) protected
steel reaches only about 300 °C after the same exposure
NIST also carried out fire resistance tests of the floor systems used in the WTC,
(See NIST Technical Note 1771, issued Oct, 2012). In these tests, a WTC floor
assembly consisting of a 4-inch concrete floor slab on a galvanized steel deck,
attached to 35 ft. span floor trusses, was heated in a furnace held at about 1000 °C,
(in accordance with the ASTM E-119 Standard). Remarkably, in these tests the
upper surface of the concrete slab reached an average temperature of only 100 °C
after 2 hours of heating. However, it is generally recognized that the heating effects
experienced by concrete in hydrocarbon fires, as opposed to the conditions in an
ASTM E-119 test, are far more severe and detrimental to the concrete. (See, for
example, the report by F. Ali et al. in the Proceedings of the 9th Fire Safety Science
Symposium, 2008)). These detrimental effects are especially evident in the data
provided in the NIST Report NCSTAR 1-5G.
NCSTAR 1-5G estimates that some regions of the WTC 2 concrete slabs exposed
to the intense fires on floors 80 to 83 reached peak temperatures ~ 900 °C. The
earliest this would have occurred was approximately 40 minutes after the aircraft

impact; nevertheless, in most instances, concrete temperatures dropped
significantly thereafter as the fires started to subside. And it is important to note
that intense heating of WTC 2 concrete was always confined to localized areas, so
that the average maximum temperature of concrete floor slabs on the fire-affected
floors of WTC 2 would have been less than 400 °C.
NCSTAR 1-5G also provides temperature profiles through the 10-cm wall
thickness of concrete slabs on fire-affected floors in the Twin Towers. These
profiles show that the middle of these slabs would typically be at least 100 °C
cooler than their outer exposed surfaces. Thus, continuously changing temperature
gradients were present in the concrete slabs on the upper floors of WTC 2
throughout the 1-hour period from aircraft impact to building collapse – a
condition conducive to spalling of the outer layers, and damage to the internal
structure of the affected slabs.
In the present context, it is important to note that heating concrete to above 100 °C
leads to the loss of chemically bound water within the concrete matrix and the
creation of high vapor pressures in the concrete pore microstructure. This in turn
causes a progressive deterioration of cement paste-aggregate bonding, Thus,
heating concrete to the highest temperatures observed in the WTC 2 fires, (namely
~ 900 °C), would cause internal cracking of the calcium-silicate-hydrate (C-S-H)
microstructure. This would allow an aggregate particle to easily separate from its
concrete matrix in the event of a hard impact such as those caused by the collapse
of WTC 2. On the other hand, the temperatures attained by the fire-exposed floors
in WTC 2 show that aggregate melting as a precursor to the formation of spherical
particles in WTC 2 dust is simply not credible.
4.2.3 Iron-Rich Spherical Particles
As described in Section 2.1 of this report, iron-rich particles were separated from
the WTC 2 dust sample by drawing a bar magnet across the outside of the Ziploc
sample bag. It has proved to be difficult to determine the relative abundance of the
magnetic particles collected by this technique, but it is certainly less than 1 %.
Indeed, the average iron content of the WTC 2 sample is only 1.1% – See Table 1
– and many of the particles that contain iron are associated with other elements
such as aluminum and silicon and are probably ferri- or ferro-aluminosilicate
particles, some of which would not be extracted by a magnet.
However, there are spherical iron-rich fly ash particles, sometimes called
ferrospheres, that have magnetic properties – see references [20 – 22]. Many of

these particles are reported to be iron oxides formed by the oxidation of iron
bearing minerals in the combusted coal and contain ~ 70% iron. It is therefore
significant that two of the iron-rich spherical particles found in the WTC 2 dust
sample, (particles 1S and 3S), exhibit Fe/O ratios of 2.4 and 2.6, corresponding to
69% and 71% iron, respectively. – See Table 5. On the other hand, particle 2S in
Figure 9, which is about 35 µm in diameter, appears to be one of the few spherical
metallic iron particles found in the WTC 2 sample in this study, albeit with some
surface contamination from concrete and gypsum fines. These particles are
discussed in more detail in Section 4.3 of this report.
4.3 Manganese in the WTC 2 Dust Sample
The EDS data for the magnetically separated particles in the WTC 2 dust sample
reveal the presence of small amounts of manganese in every particle analyzed. As
we shall see, manganese often accompanies iron in environmental particulate
material so it is useful to consider the Mn/Fe ratio, or % manganese relative to iron
in a sample. However, before examining the manganese content of particles in the
WTC 2 sample it is useful to also consider published data on manganese in other
WTC dust samples as well as in samples of New York City “background” dust:
• The current value of the Mn/Fe ratio for airborne dust in New York
City is 1.8 0.3 %, (See ref [23]), which is close to the value of 1.7 %
reported for NYC airborne particulate in the early 1970s, (See ref [24])
• The average Mn/Fe ratio reported for 35 samples of WTC dust
analyzed by the USGS is 0.11/1.63 = 0.06748 or 6.75 %, (See ref [3])
• J. K. McGee et al. (See ref [2]), report iron and manganese
concentrations for a number of WTC dust samples that have been size
fractionated to less than 2.5 m – the so-called PM2.5 fraction. Six out
of the seven samples exhibit a Mn/Fe ratio of 4.4 0.4 %.
• T. A. Cahill et al. have reported results for the analysis of aerosol
samples collected at the WTC site between Oct 2nd and Oct 30th, 2001,
(See ref [25]). This study focused on particulate in the size range less
than 0.26 m, at or near Ground Zero. The data for all but one of the
samples analyzed show Mn/Fe ratios of 3.2 0.1 %.

• R. Beusse et al. have reported data for a bulk sample of WTC dust
collected on Greenwich St. on September 26th, 2001, (See Ref [26]).
The Mn/Fe ratio was found to be 10.2 %.
Thus, we see that the Mn/Fe ratio in WTC dust is generally at least two times
higher than the value of this ratio found in non-WTC New York City dust samples,
and we therefore need to consider possible sources of manganese at the WTC site.
Three such sources are: (i) The WTC structural steel, itself, (ii) Fumes and/or
debris from welding operations during the construction of the Twin Towers, (iii)
Fly ash added to the WTC concrete aggregate.
(i) Manganese is found in all mild steels because it is added during steel
manufacture to improve the product’s metallurgical properties by
neutralizing the adverse effects of sulfur. The structural steels used in
the Twin Towers, such as A 36, A 240, A 241 and A 242, have ASTM
specifications for their manganese content in the range 1.2 to 1.6%, [27].
The cutting and grinding of steels is known to produce debris that
includes semi-spherical, or spherical particles up to 100 µm in diameter.
It has also been reported that these particles have essentially the same
chemical composition as the source material, [28, 29].
(ii) It was reported in reference [27] that: (i) During the peak construction
phase of the Twin Towers the main fillet-weld gantry laid down 1,300
kg of weld metal per day; and (ii) More than 22,000 kg of welding
electrodes were used during the construction of each of the Twin
Towers. Manganese is more volatile than iron and escapes when a steel
is being heated and becomes enriched in welding fume. In addition, to
restore the manganese lost by volatilization during welding, manganese,
at up to 15% by weight, is used in the coatings of welding electrodes,
[30]. Reference [31] states that manganese is generally from 0.2% to
10% by weight of fume from the welding of mild steel. However,
specifically for shielded metal arc and gas metal arc welding, (as used
for on-site assembly of components at the WTC), references [32, 33]
indicate that Mn/Fe ratios can be as high as 30%.
(iii) Fly ash, which is assumed to have been added to the WTC concrete,
contains variable amounts of iron and manganese. However, published
data for North American fly ash shows a fairly consistent Mn/Fe ratio
of 0.5 ± 0.3 %, [19, 34, 35].

Returning now to the WTC 2 sample under investigation in this report, Mn/Fe
ratios were measured for five magnetically separated particles, (See Tables 4 and 5
in Section 3.3). These ratios have been compared to the Mn/Fe ratios reported for
the materials listed in items (i) – (iii), above – namely WTC structural steel,
welding fume and fly ash. The results of this comparison are presented in Table 7,
below which includes a new category of iron-rich spherical particle: steel cutting
and grinding debris, [36].
During the construction of the Twin Towers, Karl Koch Erecting Co. used a
combination of bolting and welding to join components. Every one of the
thousands of welds in the finished buildings would have required initial surface
preparation because the surfaces of the as-received hot rolled sections or fabricated
plates would have been covered with adhering mill scale and/or some degree of
rust. All structural steel that was not specified to receive a shop coat of primer
paint would have been prepared in accordance with a specification such as SSPC-
SP 3, “Power Tool Cleaning”, by which steel surfaces to be welded together would
have been subjected to grinding by a hand-held rotary grinder.
It is quite normal for such tools to generate sparks when used to grind steel and it
has been reported that the shower of sparks from a section of steel in contact with a
grinding wheel contains many burning metal particles > 100 µm in diameter [37].
Reference [37] also reports that carbon steel sparks in air exhibit temperatures ~
1850 °C, which is about 300 °C above the melting point of steel. However, it has
also been reported that sparks produced by grinding often reach higher
temperatures than the process by which they were created because of exothermic
oxidation reactions occurring in the particles making up the shower of sparks [38].
In the case of cutting and grinding operations in WTC 2 during its construction it is
highly probable that steel particles up to 500 µm were ejected by this operation and
burned as they fell to the ground forming a coating of iron oxide on the underlying
metal particle. This ejection and settling process would have happened very rapidly
– say in a few seconds – leaving the manganese in the particle no time to evaporate
thereby maintaining the Mn/Fe ratio of the source WTC steel, namely 1.3 ± 0.2 %.
Table 7 was prepared taking these potential sources of iron-rich particles into
account and led to the conclusion that construction materials and debris present in
WTC 2 before it collapsed, can account for the chemical composition of iron-rich
particles found in the WTC 2 dust sample.
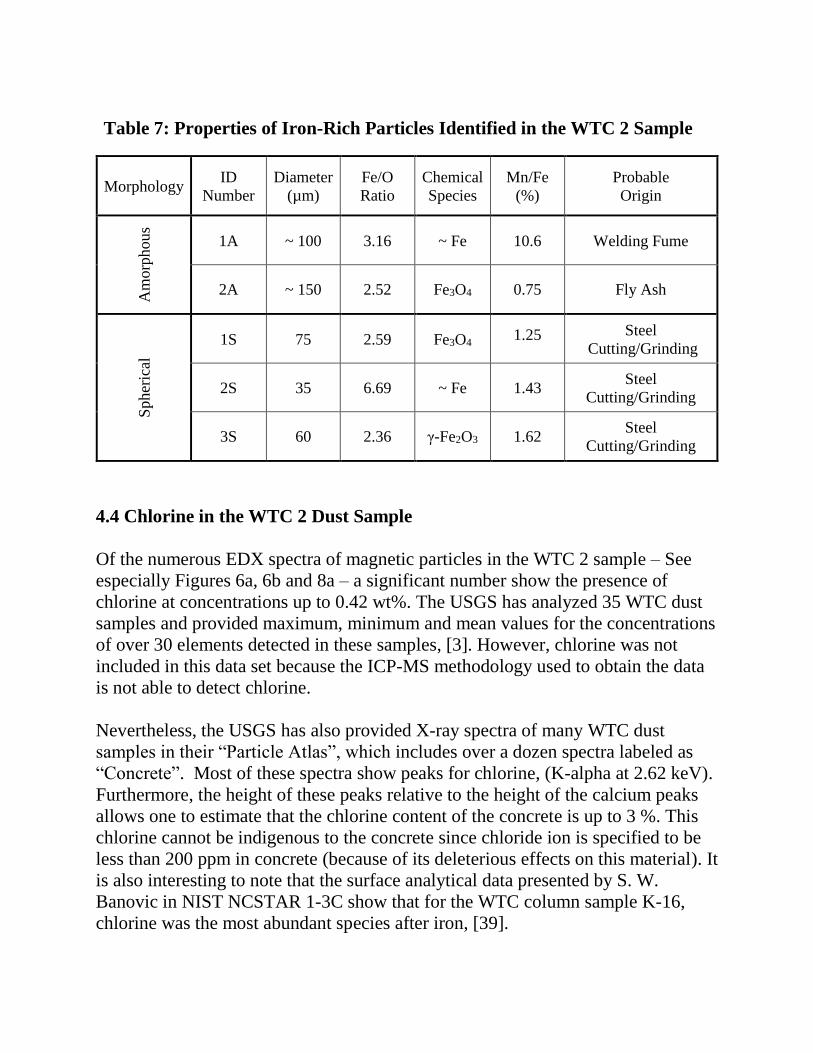
Table 7: Properties of Iron-Rich Particles Identified in the WTC 2 Sample
Morphology ID
Number
Diameter
(µm)
Fe/O
Ratio
Chemical
Species
Mn/Fe
(%)
Probable
Origin
Am
orp
hous
1A ~ 100 3.16 ~ Fe 10.6 Welding Fume
2A ~ 150 2.52 Fe3O4 0.75 Fly Ash
Spher
ical
1S 75 2.59 Fe3O4 1.25 Steel
Cutting/Grinding
2S 35 6.69 ~ Fe 1.43 Steel
Cutting/Grinding
3S 60 2.36 γ-Fe2O3 1.62 Steel
Cutting/Grinding
4.4 Chlorine in the WTC 2 Dust Sample
Of the numerous EDX spectra of magnetic particles in the WTC 2 sample – See
especially Figures 6a, 6b and 8a – a significant number show the presence of
chlorine at concentrations up to 0.42 wt%. The USGS has analyzed 35 WTC dust
samples and provided maximum, minimum and mean values for the concentrations
of over 30 elements detected in these samples, [3]. However, chlorine was not
included in this data set because the ICP-MS methodology used to obtain the data
is not able to detect chlorine.
Nevertheless, the USGS has also provided X-ray spectra of many WTC dust
samples in their “Particle Atlas”, which includes over a dozen spectra labeled as
“Concrete”. Most of these spectra show peaks for chlorine, (K-alpha at 2.62 keV).
Furthermore, the height of these peaks relative to the height of the calcium peaks
allows one to estimate that the chlorine content of the concrete is up to 3 %. This
chlorine cannot be indigenous to the concrete since chloride ion is specified to be
less than 200 ppm in concrete (because of its deleterious effects on this material). It
is also interesting to note that the surface analytical data presented by S. W.
Banovic in NIST NCSTAR 1-3C show that for the WTC column sample K-16,
chlorine was the most abundant species after iron, [39].

We have considered possible sources of chlorine in WTC dust and the major
source appears to be the chlorinated plastic polyvinyl chloride or PVC that was
used throughout the Twin Towers. Furthermore, NIST Report NCSTAR 1-5
provides data for plastic materials in a typical WTC workstation and this data
indicates that there was about 1.5 tonnes of PVC-derived chlorine per floor. And
this does not include the contribution from PVC in the vinyl asbestos tiles used in
the WTC flooring which amounts to an additional 0.3 tonnes per floor.
The thermal degradation of pure PVC and PVC blended with plasticizer and other
additives has been extensively studied for a wide range of formulations heated in
air, inert gases or under vacuum. Dehydrochlorination at ~ 300 C is the dominant
decomposition reaction for all formulations although the initiation temperature
depends on the particular additives and may be as low as 250 C. Nevertheless, the
loss of HCl from PVC is invariably close to the theoretical maximum of 56.7 % of
the sample weight for all formulations heated above 400 C.
[CHCl – CH2]n + Heat = [CH = CH]n + n HCl
For the case of the fires in WTC 2, HCl would have been released from PVC-based
plastic materials in the workstations on the fire-affected floors; this would include
materials such as electrical insulation, flooring tile, window blinds, TV monitors,
etc. The NIST Report NCSTAR 1-5C states that plastics accounted for ~ 20 % of
the combustibles in a typical workstation. Given that PVC was the most widely
used plastics in the WTC, there must have been ~ 3 tonnes of PVC on every floor.
Assuming there was complete decomposition of exposed PVC, up to 2 tonnes of
HCl was available to react with exposed surfaces on the fire-affected floors in
WTC2. And it is important to note that even well-ventilated PVC fires burn with
the production of a thick black smoke stemming from the partial combustion of the
vinyl hydrocarbon chain.
HCl released from the fire-affected floors of WTC 2 – namely, floors 79 to 83 –
was carried upwards by a buoyant smoke-laden plume, as shown schematically in
Figure 18, and visually in Figure 19, which is an example of the copious quantities
of black smoke released by a PVC fire – in this case, one that occurred at a waste-
PVC storage facility in the U.K., in July 2016. This image of a PVC fire should be
compared to a photo of WTC 2 shown in Figure 20, (a photo taken from NIST
Report, NCSTAR 1-5A). This photo shows intense billows of black smoke
emanating from the 80th and 81st floors of WTC 2 ~ 30 minutes before it collapsed.

Most importantly, however, is the fact that materials such as structural steel and
concrete above the 80th floor of WTC 2 would have been subject to attack from
HCl fumes and would have formed compounds such as calcium chloride and iron
chloride. Hence, the presence of elevated levels of chlorine in the WTC 2 dust
sample, signifies that at least some of this sample came from material that was
located above the aircraft impact floors at the time of the collapse.
Figure 18: Schematic Representation of the Production and Dispersal of HCl
Fumes in the Fire-Affected Zone of WTC 2

Figure 19: Photo of a Fire at a PVC Storage Facility in the U.K., July 2016
Figure 20: Photo of the East Face of WTC 2 taken at 9:26 am Sept 11th, 2001

6.0 Summary and Conclusions
This report describes the characterization of a sample of WTC dust recovered from
the outer clothing of Ms. Christine Sakoutis – a WTC first responder – after being
exposed to the cloud of dust and debris that formed immediately after the collapse
of WTC 2 and spread over Lower Manhattan on the morning of September 11th,
2001. The dust cloud engulfed first responder Sakoutis shortly after 10:00 a.m. as
she was standing near the corner of Fulton St. and Broadway – a location ~ 300
meters east of WTC 2; and the dust cloud continued to settle at this location for
many minutes thereafter. Thus, the WTC 2 sample characterized in this report is
pristine debris that was ejected from the WTC 2 collapse and settled to the east of
ground zero; however, without additional information, it is not possible to identify
which floor, or floors, of WTC 2 the sample came from.
Debris material from the collapse of WTC 2 was originally collected by first
responder Sakoutis on the afternoon of September 11th, 2001 when she placed her
outer clothing in a large plastic bag. The particulate material subsequently
recovered from this plastic bag is referred to in this report as sample WTC 2. As
shown in Figure 1, the collected material was brownish-tan in color – with
occasional black specks – and had the overall appearance of fine sand.
Analysis of SEM and optical images of the WTC 2 sample at magnifications in the
range 50 × to 200 × showed that the average particle size was about 135 µm. This
is significantly larger than the particulate material analyzed in references [1 – 5],
but is consistent with the expectation that coarser debris settled closer to ground
zero than finer debris, a proposition that has been verified in this report.
The as-received WTC 2 sample was separated into two fractions using a bar
magnet and each fraction – magnetic and non-magnetic – was analyzed for its
elemental composition using the EDX attachment of a Scanning Electron
Microscope. For the non-magnetic portion of the WTC 2 sample, the principal
elements, (ignoring the ubiquitous and highly variable elements carbon and
oxygen), were found to be calcium, silicon and sulphur, which is consistent with
the expected high abundance of concrete, (calcium silicate), and gypsum
wallboard, (calcium sulphate), in the Twin Towers.
These findings are also consistent with data obtained by Lioy, [1], and McGee, [2],
which showed that the composition of the WTC dust varied with the distance of
the sampling site from ground zero. In particular, samples collected within a few
city blocks of the WTC site – such as our WTC 2 sample – contained much more

pulverized concrete and gypsum than samples collected at locations over 0.5 km
from the site, which contained more low-density material such as man-made
vitreous fibers, MMVF.
The non-magnetic particles in the WTC 2 sample showed two distinct
morphologies: (i) Amorphous, and (ii) Spherical. From the associated EDX
analyses, it was concluded that the amorphous particles are debris from crushed
concrete and/or gypsum wallboard. In contrast, the non-magnetic spherical
particles appear to be derived mostly from fly ash that was a component of the
aggregate used in the WTC concrete. The alternative hypothesis – that the
spherical particles observed in WTC dust were formed in the WTC fires – has been
ruled out by considering the maximum temperature attained by the WTC concrete
floor slabs, which was certainly less than 900 °C and therefore insufficient to melt,
let alone sphericize, a glassy aluminosilicate slag.
Undoubtedly the most intriguing particles found in the WTC 2 sample were the
spherical magnetic particles. As with their glassy counterparts, the shape of these
particles indicates they were molten at the time of their formation. EDX analysis of
these particles shows they are iron or iron oxide, albeit with varying degrees of
surface contamination from concrete dust. Furthermore, the Mn/Fe ratio for these
particles is consistent with WTC structural steel. It follows that these particles were
heated to at least 1500 °C at the time of their formation.
Fire tests carried out by NIST on reconstructed WTC workstations and floor
assemblies, (see NIST NCSTAR 1-5B), showed that steel members reached a
maximum temperature of only about 800 °C, which is well below the melting point
of steel. It is therefore suggested that the iron-rich spherical particles in the WTC 2
sample are from on-site cutting and grinding operations that were carried out
during the construction of the Twin Towers.
Finally, it is worth noting that the particle types found in the WTC 2 sample reflect
the particle structure of fly ash concrete, especially after the calcium silicate paste
has been reduced to dust. And this is evidently why so much fine aggregate, that
looked like sand, was found in the rubble pile at ground zero.
August 1st 2017
Conflicts of Interest: The authors declare no conflict of interest.

References
1 P. J. Lioy et al. “Characterization of the Dust/Smoke Aerosol that Settled East
of the World Trade Center (WTC) in Lower Manhattan after the Collapse of the
WTC 11 September 2001.” Environmental Health Perspectives 110, 703,
(2002).
2 J. K. McGee et al. “Chemical Analysis of World Trade Center Fine Particulate
Matter for use in Toxicological Assessment.” Environmental Health
Perspectives 111, 972, (2003).
3 R. N. Clark et al. “USGS Spectroscopy Lab World Trade Center Sample
Collection and Analysis Table.” USGS ORF 01-1492, (2002).
4 G. P. Meeker et al. “Determination of a Diagnostic Signature for World Trade
Center Dust using Scanning Electron Microscopy Point Counting Techniques.”
USGS Open File Report 2005 – 1031, (2005).
5 J. S. Gaffney, Ed. “Urban Aerosols and their Impacts: Lessons Learned from
the World Trade Center Tragedy”, American Chemical Society, ACS
Symposium Series, Vol. 919, (2005).
6 R. J. Lee et al. “Damage Assessment 130 Liberty Street Property: WTC Dust
Signature Report on Composition and Morphology.” Issued December 2003.
7 S. R. Badger et al. “World Trade Center Particulate Contamination Signature
Based on Dust Composition and Morphology.” Microscopy and Microanalysis
10 (Supplement 2), 948, (2004).
8 A. Fujiwara et al. “Experimental Study on the Velocity of Fragments in
Collisional Breakup.” Icarus 44, 142 (1980).
9 T. Waza et al. in “Laboratory Simulation of Planetesimal Collision 2. Ejecta
Velocity Distribution” Journal of Geophysical Research 90(B2), 1995 (1985).
10 D. R. Davis et al. “On Collisional Disruption: Experimental Results and
Scaling Laws.” Icarus 83, 156 (1990).
11 A. Nakamura el al. “Velocity Distribution of Fragments Formed in a Simulated
Collisional Disruption.” Icarus 92, 132 (1991).
12 Z. Zhang. “Effects of Loading Rate on Rock Fracture: Fracture Characteristics
and Energy Partitioning”, International Journal of Rock Mechanics and Mining
Sciences 37, 745, (2000).
13 F. R. Greening. “Energy Transfer in the WTC Collapse” Report issued March
2005, available from the author.
14 F.R. Greening. “The Pulverization of Concrete in WTC 1 During the Collapse
Events of 9-11” Report issued November 2006, available from the author.
15 T. Suzuki. “A Theoretical Model for Dispersion of Tephra.” Arc Volcanism:
Physics and Tectonics, 95 – 113, Tokyo, (1983).

16 C. Bonadonna et al. “Thickness Variations and Volume Estimates of Tephra
Fall Deposits: The Importance of Particle Reynolds Number.” Journal of
Volcanology and Geothermal Research, 81, 173, (1998).
17 M. J. Zyrkowski. “Characterization of Fly Ash Cenospheres from Coal-Fired
Power Plant Unit” M.Sc. degree thesis, IST Institute, Lisbon, Portugal, (2014).
18 ACI Committee 232. “Use of Fly Ash in Concrete” ACI Report No. ACI
232.R2R-96, (2002).
19 EPRI Technical Update. “Coal Ash: Characteristics, Management and
Environmental Issues”. EPRI Publication, (2009).
20 Y. Zhao et al. “Mineralogy, Chemical Composition, and Microstructure of
Ferrosphers in Fly Ashes from Coal Combustion”, Energy Fuels 20(4), 1490,
(2006).
21 A. G. Anshits et al. “Ferrospheres from Fly Ashes: Composition and Catalytic
Properties in High-Temperature Oxidation of Methane”. World of Coal Ash
(WOCA) Conference, Denver Colorado, May 2011.
22 H. Liu et al. “Morphology and Composition of Microspheres in Fly Ash from
the Luohuang Power Plant, Chongqing, Southwestern China”, Minerals, 6, 30,
(2016).
23 S. N. Chillrud et al. “Elevated Airborne Exposures of Teenagers to Manganese,
Chromium, and Iron from Steel Dust and New York City’s Subway System.”
Environmental Science and Technology 38(3), 732, (2004).
24 T. J. Kneip and P. J. Lioy “Aerosols: Anthropogenic and Natural Sources and
Transport.” Annals of the New York Academy of Sciences, Vol. 338, (1980).
25 T. A. Cahill et al. “Analysis of Aerosols from the World Trade Center Collapse
Site, New York, October 2 to October 30, 2001.” Aerosol Science and
Technology 38, 165, (2004).
26 R. Beusse et al. “EPA’s Response to the World Trade Center Collapse:
Challenges, Successes and Areas for Improvement.” U.S. EPA Report No.
23003-P-00012, (2003).
27 W. E. Luecke et al. “Federal Building and Fire Safety Investigation of the
World Trade Center Disaster: Contemporaneous Structural Steel
Specifications.” NIST Report NIST NCSTAR 1-3A, (2005).
28 I. Kleis et al. “Solid Particle Erosion: Occurrence, Prediction and Control.”
(2008).
29 W. Kaplonek et al. “Morphology of Near- and Semispherical Melted Chips
after the Grinding Processes Using Sol-Gel Abrasives Based on SEM-Imaging
Analysis”, Advances in Materials Science and Engineering, pp 1- 12, (2016).

30 International Agency for Research on Cancer (IARC). “IARC Monograph:
Chromium, Nickel and Welding”, IARC Monograph Volume 49, (1990).
31 F. Taube. “Manganese in Occupational Arc Welding Fumes – Aspects on
Physiochemical Properties, with Focus on Solubility”, Annals of Occupational
Hygiene, 57, 6, (2013).
32 N. T. Jenkins et al. “Chemical Analysis of Welding Fume Particles.” Welding
Research: Supplement to the Welding Journal, 87-s, (June 2005).
33 M. J. Keane et al. “Profiling Mild Steel Welding Processes to Reduce Fume
Emissions and Cost in the Workplace.” Annals of Occupational Hygiene, 58(4),
403, (2014).
34 S. C. Openshaw. “Utilization of Coal Fly Ash.” Master’s Degree Thesis,
University of Florida, (1992).
35 J. C. Hower. “Characterization of Fly Ash from Kentucky Power Plants.” Fuel
75, 403, (1996).
36 P. Marchal et al. “Characterization of Incandescent Particles Emitted by a Cut-
Off Grinder During Decommissioning Operations for Evaluating Filter
Degradation.”, Journal of Nuclear Engineering and Radiation Science, 1,
021005-1, (2015).
37 G. Lunn. “Frictional Ignition of Powders: A Review.” Special Report by the
Health and Safety Laboratory, Buxton, Derbyshire, U.K., (2002).
38 K. Mikkelson. “An Experimental Investigation of Ignition Propensity of Hot
Work Processes in the Nuclear Industry."
39 S. W. Banovic et al. “Federal Building and Fire Safety Investigation of the
World Trade Center Disaster: Contemporaneous Structural Steel
Specifications.” NIST Report NIST NCSTAR 1-3C, (2005).