characterization and corneal tissue engineering ... · characterization and corneal tissue...
TRANSCRIPT
CHARACTERIZATION AND CORNEAL TISSUE
ENGINEERING APPLICATION OF PEPTIDE AMPHIPHILES
A THESIS
SUBMITTED TO THE MATERIALS SCIENCE AND NANOTECHNOLOGY
PROGRAM OF THE GRADUATE SCHOOL OF ENGINEERING AND
SCIENCE OF BILKENT UNIVERSITY
IN PARTIAL FULFILLMENT OF THE REQUIREMENTS
FOR THE DEGREE OF
MASTER OF SCIENCE
By
YAVUZ SELİM DAĞDAŞ
August, 2012
I certify that I have read this thesis and that in my opinion it is fully adequate, in
scope and in quality, as a thesis of the degree of Master of Science.
…………………………………
Assist. Prof. Dr. Ayşe Begüm Tekinay (Advisor)
I certify that I have read this thesis and that in my opinion it is fully adequate, in
scope and in quality, as a thesis of the degree of Master of Science.
………………………………….
Assoc. Prof. Dr. Mustafa Özgür Güler (Co-Advisor)
I certify that I have read this thesis and that in my opinion it is fully adequate, in
scope and in quality, as a thesis of the degree of Master of Science.
………………………………….
Assist. Prof. Dr. Fatih Büyükserin
I certify that I have read this thesis and that in my opinion it is fully adequate, in
scope and in quality, as a thesis of the degree of Master of Science.
………………………………….
Assist. Prof. Dr. Turgay Tekinay
Approved for the Graduate School of Engineering and Science:
………………………………….
Prof. Dr. Levent Onural
Director of the Graduate School of Engineering and Science
I
ABSTRACT
CHARACTERIZATION AND CORNEAL TISSUE
ENGINEERING APPLICATION OF PEPTIDE AMPHIPHILES
Yavuz Selim Dağdaş
M.S. in Materials Science and Nanotechnology
August, 2012
Molecular self-assembly is a powerful technique for developing novel
nanostructures by using non-covalent interactions such as hydrogen
bonding, hydrophobic, electrostatic, metal-ligand, π-π and van der Waals
interactions. Hydrogen bonding, hydrophobic and electrostatic interactions
promote self-assembly of peptide amphiphile molecules into nanofibers.
Bundles of nanofibers form a three-dimensional network resulting in gel
formation. Concentration and temperature dependent measurements of gel
stiffness suggest that the mechanical properties of the gels are determined
by a number of factors including the interfiber interactions and mechanical
properties of individual nanofibers. Peptide amphiphile molecules provide
a convenient model as extracellular matrix mimetic systems for regenerative
medicine studies. Since the substrate stiffness is crucial for cellular
II
behaviours such as proliferation, adhesion and differentiation,
understanding the mechanisms behind the viscoelastic properties of the gels
formed by self-assembling molecules can lead to development of new
materials with controlled stiffness.
In this study, regeneration of the corneal stroma was used as a model system
for utilization of peptide amphiphile molecules in regenerative medicine
studies. Corneal stroma is constituted by collagen fiber arrays that are
closely packed forming a stiff environment for corneal fibroblasts. The
tunability of mechanical properties of self-assembled peptide amphiphile
nanostructures was aimed to be utilized in corneal stroma regeneration.
Thinning of the corneal stroma is a debilitating problem that can be caused
by diseases like keratoconus, infections or accidents. Since corneal stroma
has a restricted regenerative capacity, thinning of stroma is usually treated
with cornea transplantation, which is limited by the number of donors.
In this thesis, I studied mechanical properties of self-assembled peptide
amphiphile nanostructures in nanometer and micrometer scale. I found that
the divergence in gel stiffness may arise from the difference of strength of
interfiber bonds. An injectable, biocompatible, biodegradable and bioactive
system that can be used for thickening the corneal stroma was developed.
This system that is composed of nanofibers was observed to enhance
viability and proliferation of keratocytes in vitro.
Keywords: Peptide amphiphile, self-assembly, nanofibers, cross-link, corneal
stroma, regeneration, rheology, AFM, biocompatibility, proliferation, adhesion
III
ÖZET
PEPTİT AMFİFİLLERİN KARAKTERİZASYONU VE KORNEA DOKU
MÜHENDİSLİĞİ UYGULAMASI
Yavuz Selim Dağdaş
Malzeme Bilimi ve Nanoteknoloji Programı, Yüksek Lisans
Tez Yöneticisi: Yard. Doç. Dr. Ayşe B. Tekinay
Ağustos, 2012
Kendiliğinden düzenlenme, hidrojen bağı, hidrofobik, elektrostatik etkileşimler,
metal bağı, π-π ve van der Waals bağı gibi bağları kullanarak yeni nano
yapıların geliştirilmesinde faydalı bir yöntem olarak uygulanmaktadır. Hidrojen
bağı ve hidrofobik ve elektrostatik etkileşimler peptit amfifil moleküllerinin
kendiliğinden düzenlenme yoluyla nano fiberler yapmalarını tetiklemektedir.
Nano fiberler birbirleri ile etkileşimleri sonucunda üç boyutlu bir ağ oluşturarak
jel yapabilmektedirler. Peptit amfifil jellerinin konsantrasyona ve sıcaklığa bağlı
mekanik ve yapısal ölçümleri, jel sertliğinin fiberler arası etkileşimlere ve
fiberlerin kendi mekanik özelliklerine bağlı olduğunu göstermektedir.
Peptit amfifil molekülleri doğal hücrelerarası matrisi taklit ederek rejeneratif tıp
çalışmaları için kullanışlı bir model sunmaktadır. Hücrelerarası ortamın mekanik
özellikleri hücrelerin çoğalmasında, yüzeye yapışmasında ve farklılaşmasında
IV
önem arz etmektedir. Kendiliğinden düzenlenme metodu ile oluşturulan jellerin
viskoelastik özelliklerinin sebeplerinin bilinmesi gerekli sertlikte yeni
malzemelerin geliştirilmesinde fayda sağlayacaktır.
Bu çalışmada peptit amfifil moleküllerinin rejeneratif tıp çalışmalarında
kullanımı için model olarak kornea stromasının rejenerasyonu çalışılmıştır.
Kornea stroması kollajen fiber dizilerinin sıkı bir şekilde düzenlenmesi ile
oluşmuş olup kornea fibroblastları için sert bir ortam oluşturmaktadırlar.
Kendiliğinden düzenlenen peptit amfifil molekülleri tarafından oluşturulan nano
yapıların mekanik özelliklerinin ayarlanabilir olmaları kornea stroma doku
yenilenmesi gibi doku mühendisliği ve rejeneratif tıp çalışmaları için önem arz
etmektedir. Keratokonus, enfeksiyonlar veya travmalar sebebiyle korneal
stromanın incelmesi korneanın mercek görevini yapmasına engel
olabilmektedir. Stromanın kısıtlı miktarda kendini yenileme özelliği sebebiyle,
kornea stromasının incelmesi kornea nakli ile çözülmektedir. Hâlbuki
enfeksiyon riski ve lazer ile yapılan kornea ameliyatları zaten yetersiz
miktardaki nakil için kullanıma uygun kornea sayısını ciddi anlamda
azaltmaktadır.
Bu tezde, kendiliğinden düzenlenme ile peptit amfifil moleküllerince oluşturulan
nano yapıların mekanik özellikleri nano ve mikro düzeyde incelenmiştir. Sonuç
olarak peptit amfifil molekülleri tarafından oluşturulan jellerin sertliklerinde
görülen değişikliklerin fiberler arası etkileşimlerin farklı olmasından
kaynaklandığı bulunmuştur. Bunun yanında, kornea stroma dokusunun kendini
yenilemesi ve kalınlaşması için enjekte edilebilen, biyoaktif, biyouyumlu ve
V
biyobozunur bir malzeme geliştirilmiştir. Geliştirilen malzemenin kornea
fibroblastlarının canlılıklarını ve çoğalma miktarlarını arttırdığı gözlemlenmiştir.
Anahtar Kelimeler: Peptit amfifil, kendiliğinden düzenlenme, nano fiber,
çaprazlama, reoloji, AFM, kornea stroması, biyouyumluluk, hücre çoğalması,
hücre bağlanması
VI
ACKNOWLEDGEMENT
I would like to express my gratitude to my supervisors Assist. Prof. Dr. Ayşe
Begüm Tekinay and Assist. Prof. Dr. Mustafa Özgür Güler for their guidance,
moral support, and assistance during this research.
I would like to thank my brother Yasin Fatih Dağdaş for all his support that has
been invaluable for me.
I would like to thank to Ayşegül Tombuloğlu, Zeliha Soran, Hilal Ünal and
Turan Selman Erkal for their partnership in this research.
I would like to express my special thanks to Assoc. Prof. Dr. Aykutlu Dana, Dr.
Bahri Aydın and Dr. Ahmet Hondur for their support and sharing their
knowledge.
I want to thank all current and former members of the Nanobiotechnology and
Biomimetic Materials group for providing a high standard scientific
environment. It was wonderful to work with them.
I would like to thank Rashad Mammadov, Ruslan Garifullin and Turan Selman
Erkal for their friendship and support that helped to keep my spirits high all the
time which I appreciate very much.
I would like to thank UNAM (National Nanotechnology Research Center) and
TÜBİTAK (The Scientific and Technological Research Council of Turkey)
grant number 110M355 for financial support.
VII
LIST OF ABBREVIATIONS
PA: Peptide Amphiphile
ECM: Extracellular Matrix
FMOC: 9-Fluorenylmethoxycarbonyl
HBTU: 2-(1H-Benzotriazol-1-yl)-1,1,3,3-tetramethyluronium
hexafluorophosphate
DIEA: N, N-Diisopropylethylamine
DMF: Dimethylformamide
TFA: Trifluoroacetic Acid
LC-MS: Liquid Chromatography-Mass Spectrometry
AFM: Atomic Force Microscopy
TEM: Transmission Electron Microscopy
FT-IR: Fourier Transform Infrared Spectroscopy
SEM: Scanning Electron Microscopy
CD: Circular Dichroism
ITC: Isothermal Titration Calorimetry
SPSS: Solid Phase Peptide Synthesis
VIII
TABLE OF CONTENTS
ABSTRACT .................................................................................................. I
ACKNOWLEDGEMENT ........................................................................ VI
LIST OF ABBREVIATIONS ................................................................. VII
TABLE OF CONTENTS ....................................................................... VIII
LIST OF FIGURES ................................................................................... X
LIST OF TABLES ................................................................................. XIII
CHAPTER 1 ................................................................................................ 1
Introduction .................................................................................................. 2
1.1 Solid Phase Peptide Synthesis ........................................................................... 3
1.2 Effect of Substrate Stiffness on Cell Behaviour ................................................ 6
Materials and Methods ................................................................................ 8
2.1 General Methods ................................................................................................ 8
2.2 Materials ............................................................................................................ 8
2.3 Synthesis of Peptides ......................................................................................... 8
2.4 Characterization of Peptide Amphiphiles ........................................................ 10
Results and Discussions.............................................................................. 18
3.1 Design and Synthesis of Peptide Amphiphiles ................................................ 18
3.2 Morphology of Peptide Amphiphile Nanofibers ............................................. 21
3.3 Circular Dichroism Spectra of Peptide Amphiphiles at Room Temperature ... 23
3.4 Fourier Transform Infrared Spectroscopy of Peptide Amphiphiles ................. 28
3.5 Circular Dichroism Spectra of Peptide Amphiphiles at Variable Temperatures
............................................................................................................................... 30
3.6 The mechanical Properties of Peptide Amphiphile Gels ................................. 33
Conclusion ................................................................................................... 47
IX
CHAPTER 2 .............................................................................................. 48
Introduction ................................................................................................ 49
1.1 Cornea Structure .............................................................................................. 49
1.2 Fully Synthetic Replacements .......................................................................... 53
1.3 Corneal Tissue Engineering Applications........................................................ 54
1.4 Corneal Tissue Engineering with Peptide Amphiphiles .................................. 56
Materials and Methods .............................................................................. 58
2.1 General Methods .............................................................................................. 58
2.2 Materials .......................................................................................................... 58
2.3 Synthesis and Purification of Peptide Amphiphile Molecules ......................... 59
2.4 Oscillatory Rheology ....................................................................................... 60
2.5 Circular Dichroism (CD) ................................................................................. 61
2.6 Scanning Electron Microscopy (SEM) ............................................................ 61
2.7 Atomic Force Microscopy (AFM) ................................................................... 62
2.8 Cell Culture and Maintenance ......................................................................... 62
2.9 In vitro Application of Peptide Amphiphile Molecules ................................... 63
2.10 Biocompatibility Assesment by Using Viability Assays ............................... 63
2.11 Cell Adhesion Assays for Cell-material Interaction Analysis ....................... 64
2.12 Cell Proliferation Assays ............................................................................... 65
Results and Discussion ............................................................................... 66
3.1 Experimental Conditions ................................................................................. 66
3.2 Design, Synthesis and Purification of Peptide Amphiphiles ........................... 66
3.3 Nanoscale Morphology of Peptide Amphiphile Molecules ............................. 75
3.4 Circular Dichroism Spectra of Peptide Amphiphile Molecules ....................... 77
3.5 Analysis of Mechanical Properties of PA Gels with Oscilatory Rheology ..... 77
3.6 Cell Culture Applications of Peptide Amphiphile Molecules.......................... 80
Conclusion ................................................................................................... 86
REFERENCES .......................................................................................... 87
X
LIST OF FIGURES
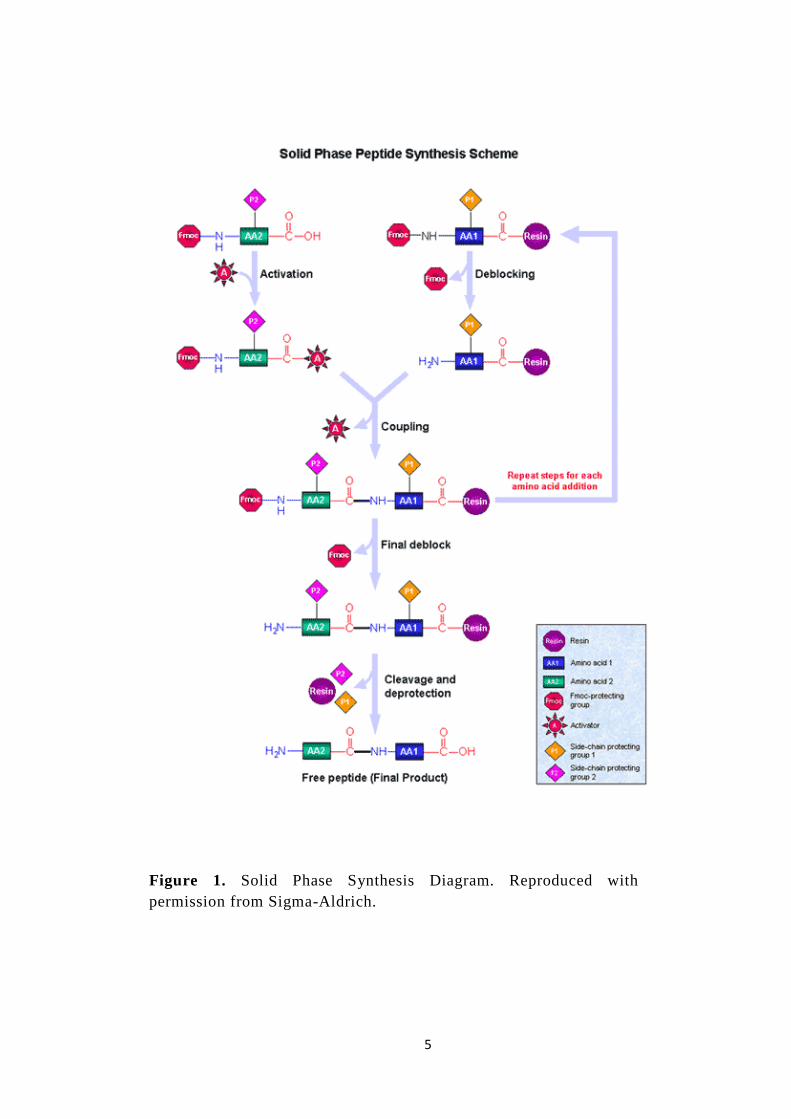
Figure 1.Solid Phase Synthesis Diagram. Reproduced with permission from
Sigma-Aldrich. .............................................................................................. 5
Figure 2. Chemical structure of the investigated peptide amphiphile molecule.
..................................................................................................................... 18
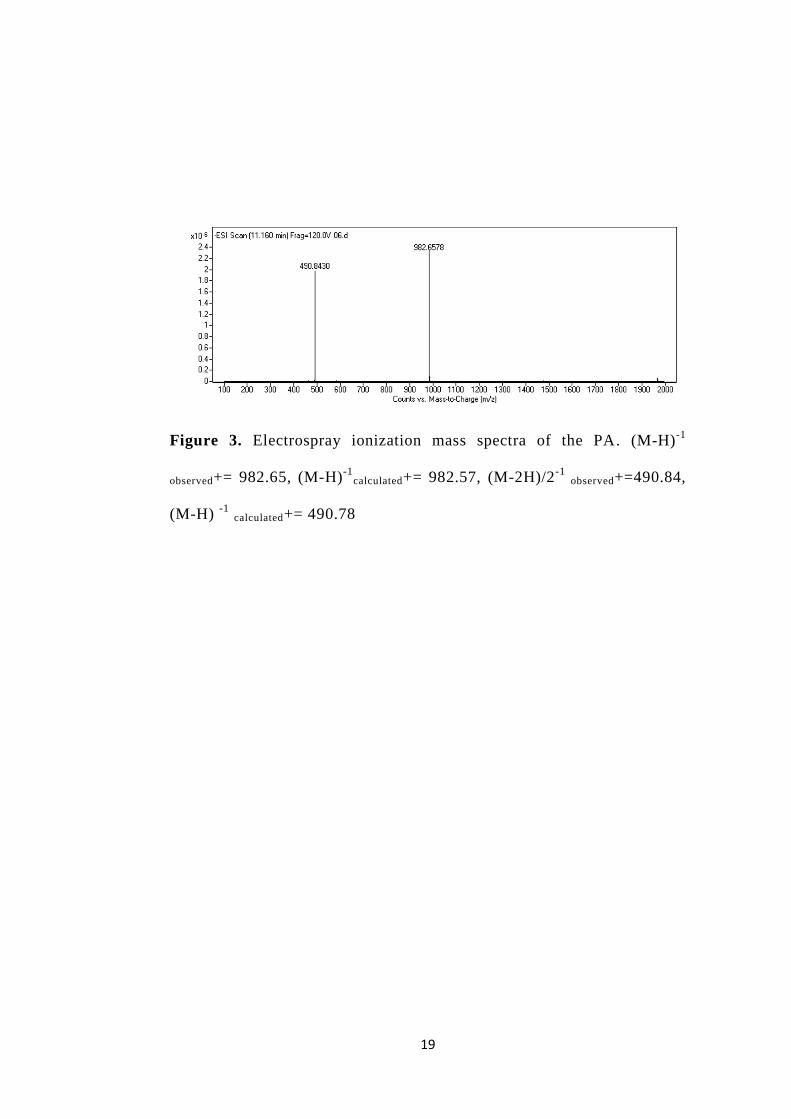
Figure 3. Electrospray ionization mass spectra of the PA. (M-H)-1
observed+=
982.65, (M-H)-1
calculated+= 982.57, (M-2H)/2-1
observed+=490.84, (M-H) -1
calculated+= 490.78 ......................................................................................... 19
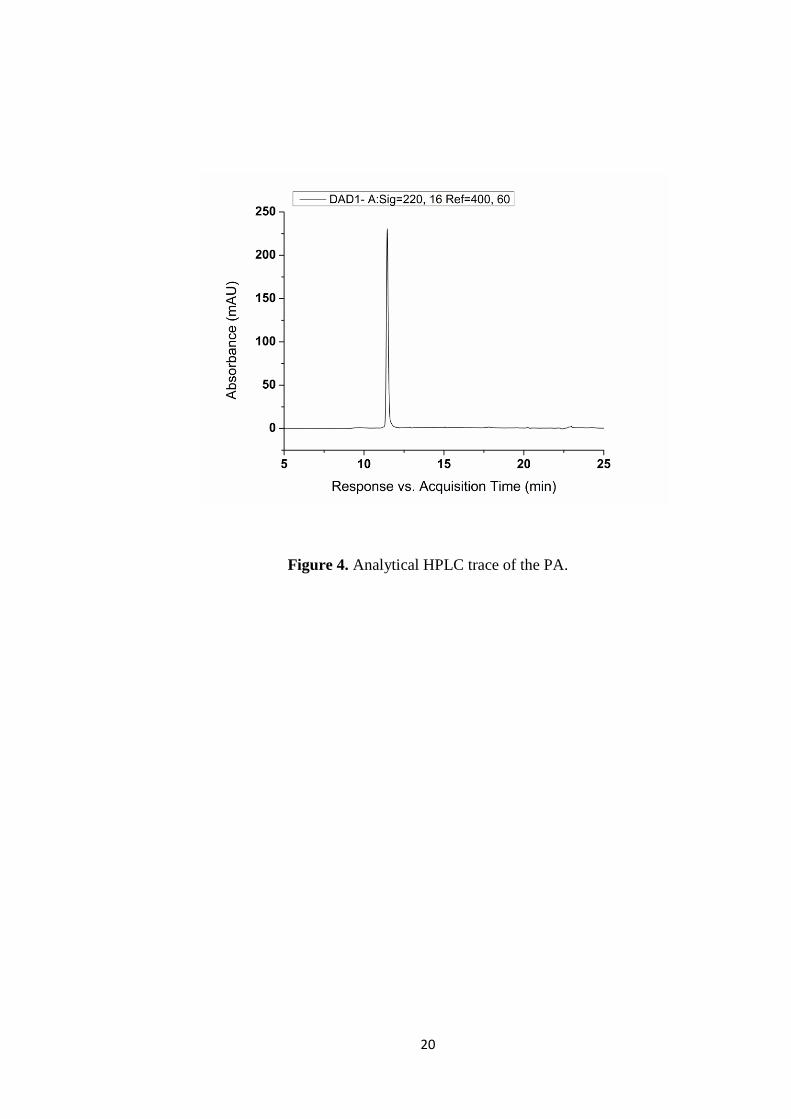
Figure 4. Analytical HPLC trace of the PA. ...................................................... 20
Figure 5. Scanning electron micrographs of the PA nanostructures
demonstrating entangled fiber bundles. (a) PA with CaCl2 gel formed with
10 mM PA and 100 mM CaCl2 (b) PA with HCl gel formed with 10 mM
PA and 100 mM HCl (scale bar1µm). Transmission electron micrographs
of (c) PA with CaCl2 gel and (d) PA with HCl gel. AFM topography
micrographs of (e) PA with CaCl2 gel and (f) PA with HCl gel. ................ 22
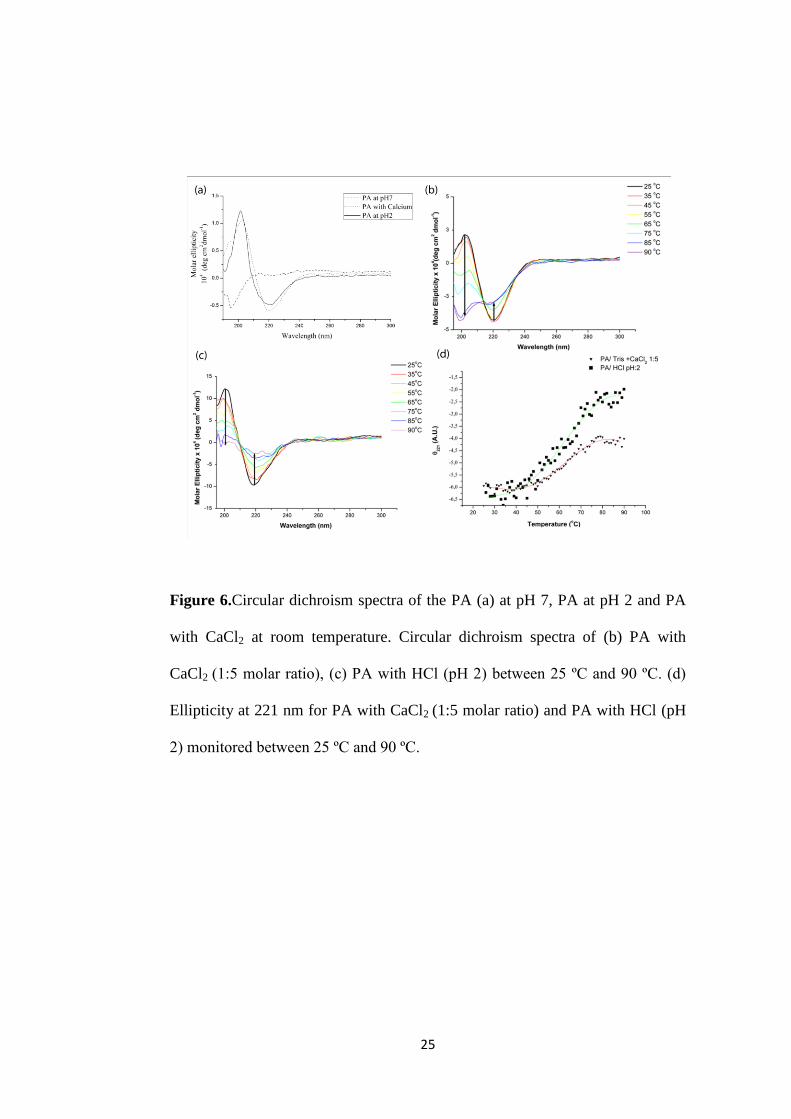
Figure 6.Circular dichroism spectra of the PA (a) at pH 7, PA at pH 2 and PA
with CaCl2 at room temperature. Circular dichroism spectra of (b) PA with
CaCl2 (1:5 molar ratio), (c) PA with HCl (pH 2) between 25 ºC and 90 ºC.
(d) Ellipticity at 221 nm for PA with CaCl2 (1:5 molar ratio) and PA with
HCl (pH 2) monitored between 25 ºC and 90 ºC. ....................................... 25
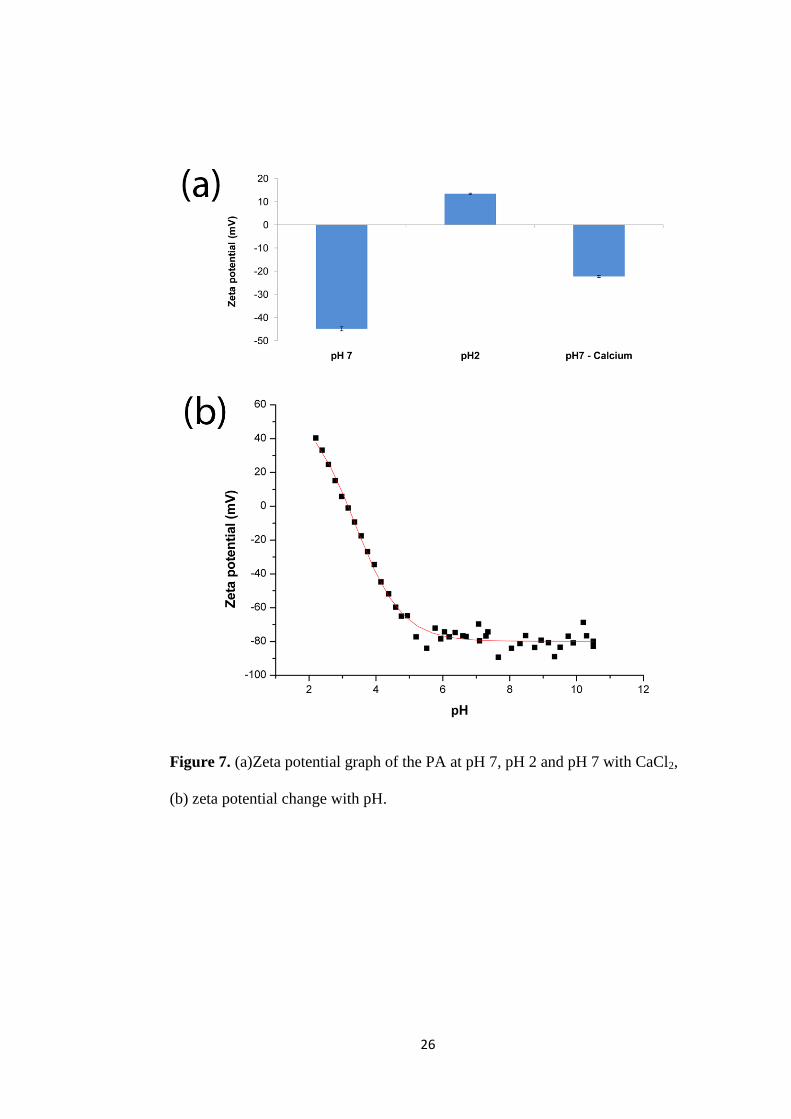
Figure 7. (a)Zeta potential graph of the PA at pH 7, pH 2 and pH 7 with CaCl2,
(b) zeta potential change with pH. .............................................................. 26
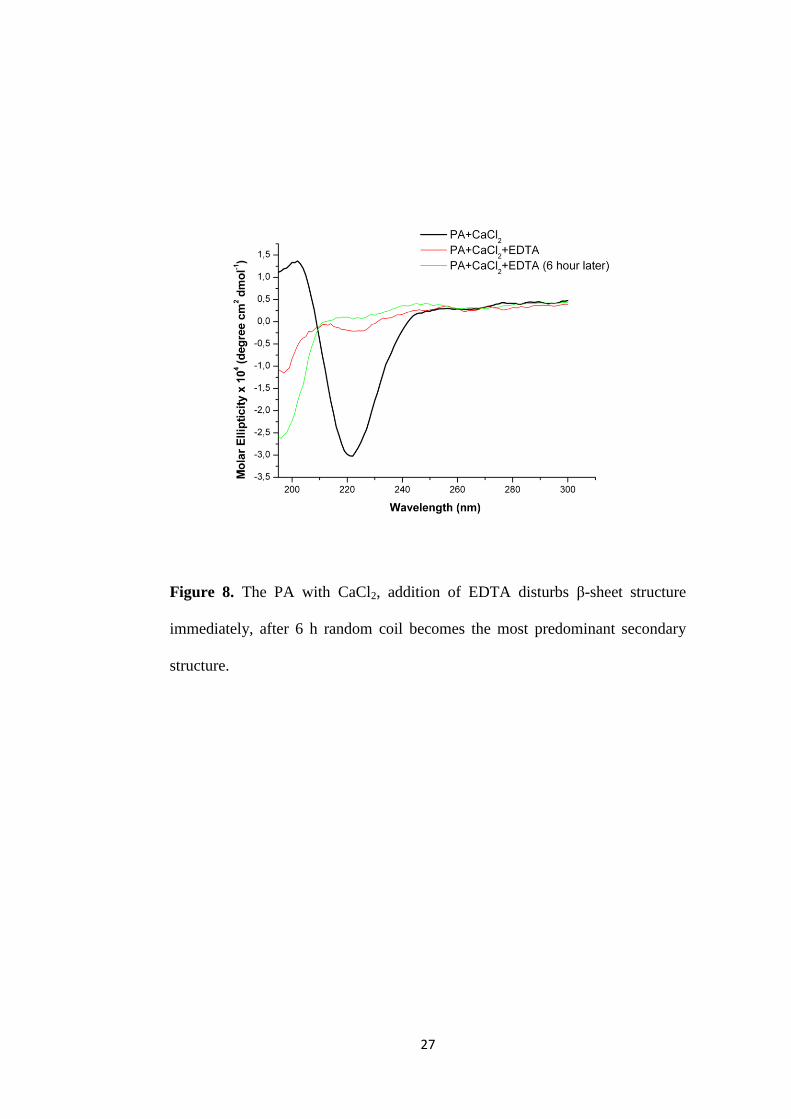
Figure 8. The PA with CaCl2, addition of EDTA disturbs β-sheet structure
immediately, after 6 h random coil becomes the most predominant
secondary structure. .................................................................................... 27
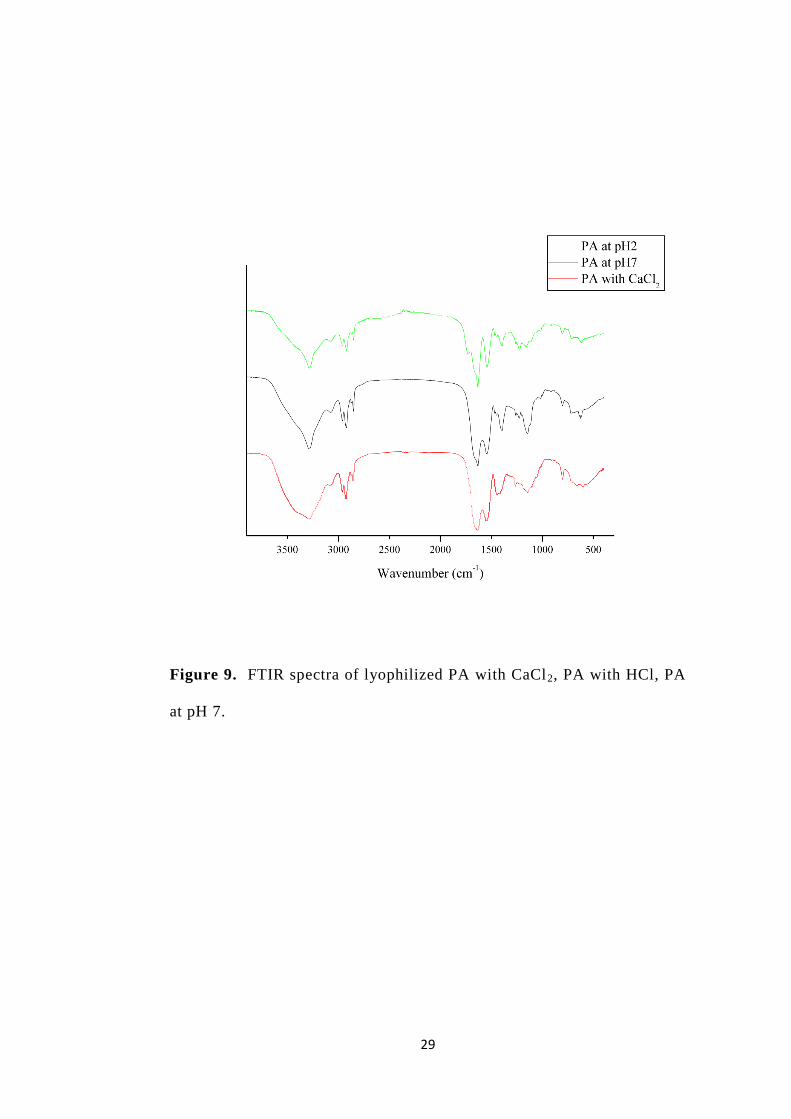
Figure 9. FTIR spectra of lyophilized PA with CaCl2, PA with HCl, PA at pH
7. .................................................................................................................. 29
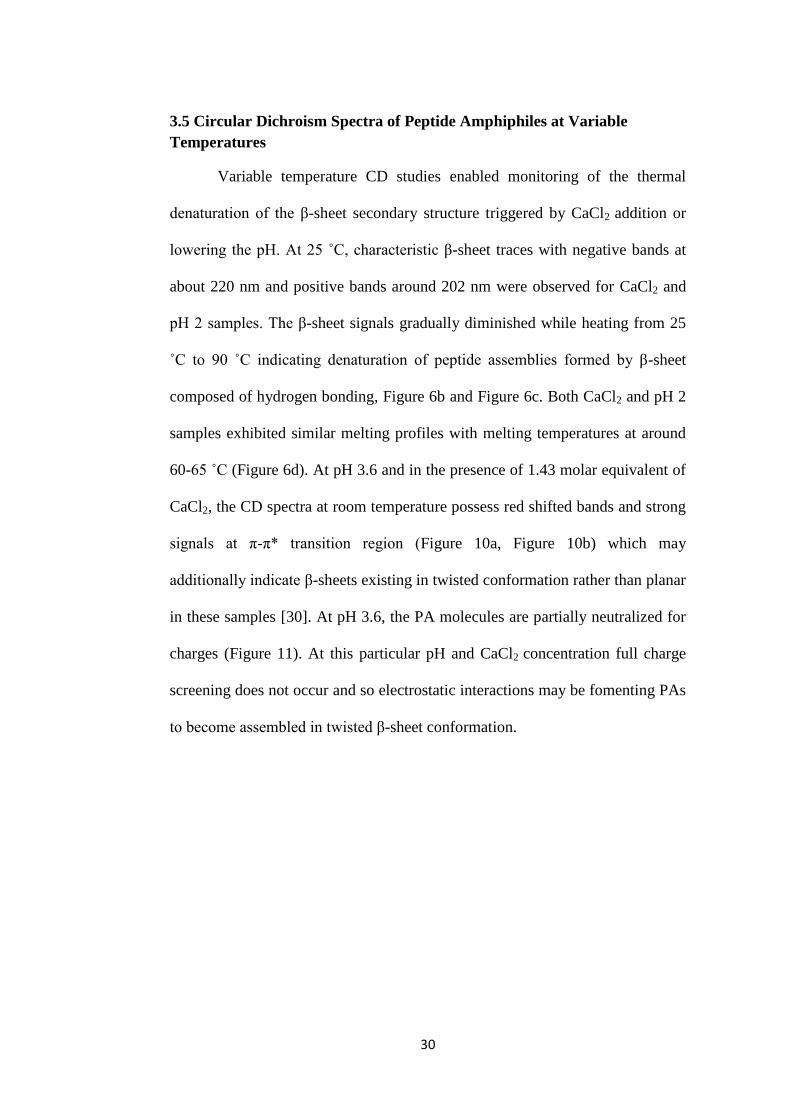
Figure 10. Circular Dichroism spectra of (a) PA with CaCl2 (1:1.43 molar ratio),
(b) PA with acetate buffer (pH 3.6) between 25 ºC and 90 ºC. (c) Ellipticity
at 221 nm for PA with CaCl2 (1:1.43 molar ratio) and PA with acetate
buffer (pH 3.6) monitored between 25 ºC and 90 ºC. ................................. 31
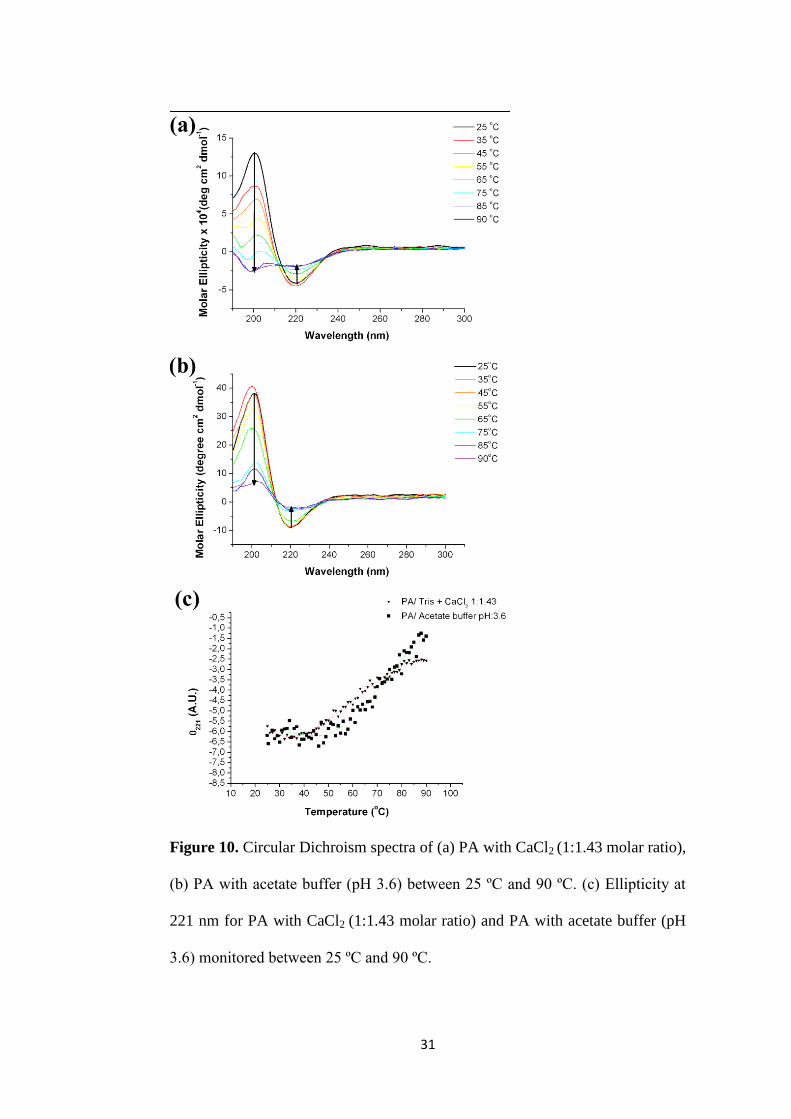
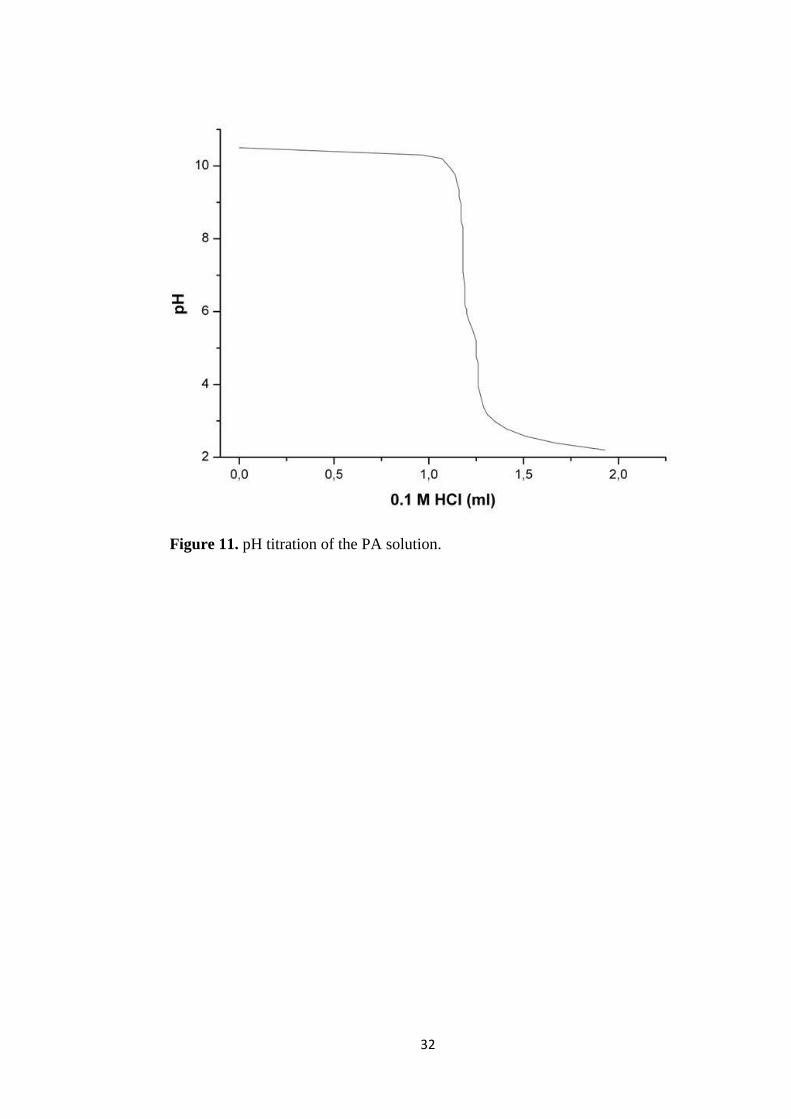
Figure 11. pH titration of the PA solution. ........................................................ 32
Figure 12.Time sweep oscillatory rheology measurements (t: 60 min) of PA
with CaCl2 and PA with HCl gels (a) 16.9 mM PA and 1.6 M HCl or CaCl2,
(b) 8.5 mM PA and 0.833 M HCl or CaCl2, (c) 4.2 mM PA and 416.7 mM
HCl or CaCl2 and (d) 2.1 mM PA and 208.3 mM HCl or CaCl2 ................ 34
Figure 13. Time sweep oscillatory rheology measurements (t: 0-60 min) of PA
with CaCl2 gels. (16.9 mM PA and 1.6 M CaCl2) ...................................... 35
XI
Figure 14. Time sweep oscillatory rheology measurements (t: 0-60 min) of PA
with HCl gels. (16.9 mM PA and 1.6 M HCl) ............................................ 36
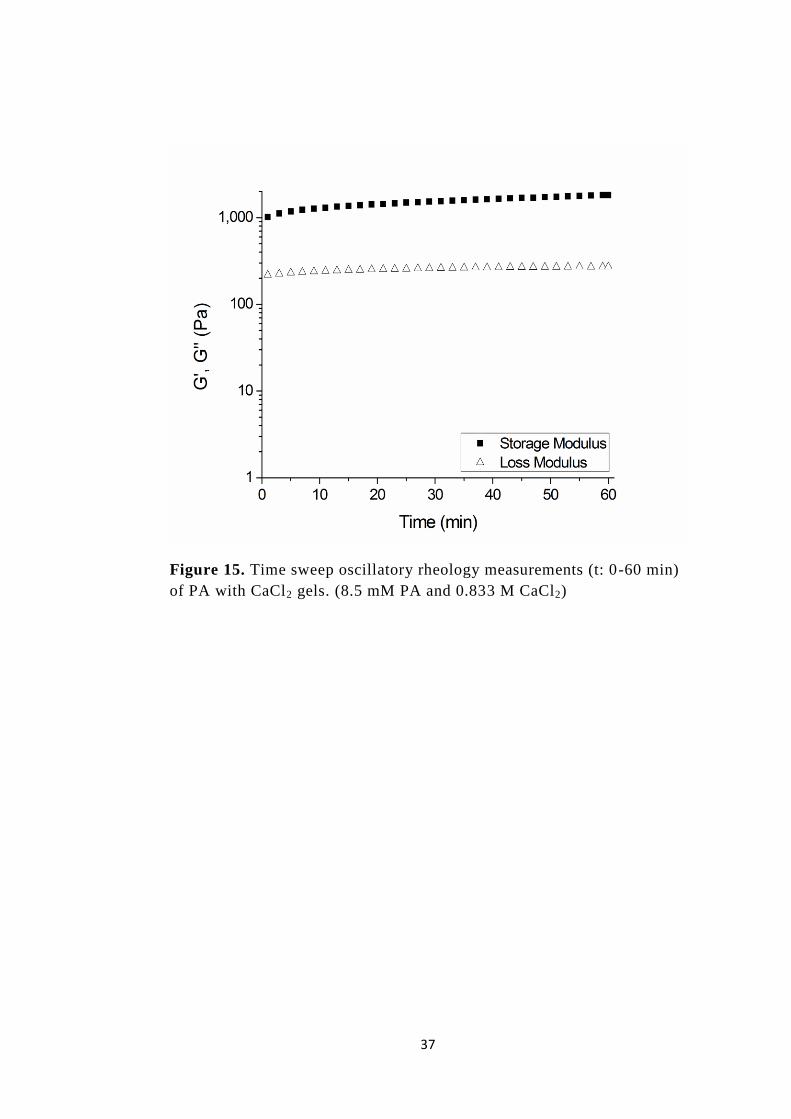
Figure 15. Time sweep oscillatory rheology measurements (t: 0-60 min) of PA
with CaCl2 gels. (8.5 mM PA and 0.833 M CaCl2) .................................... 37
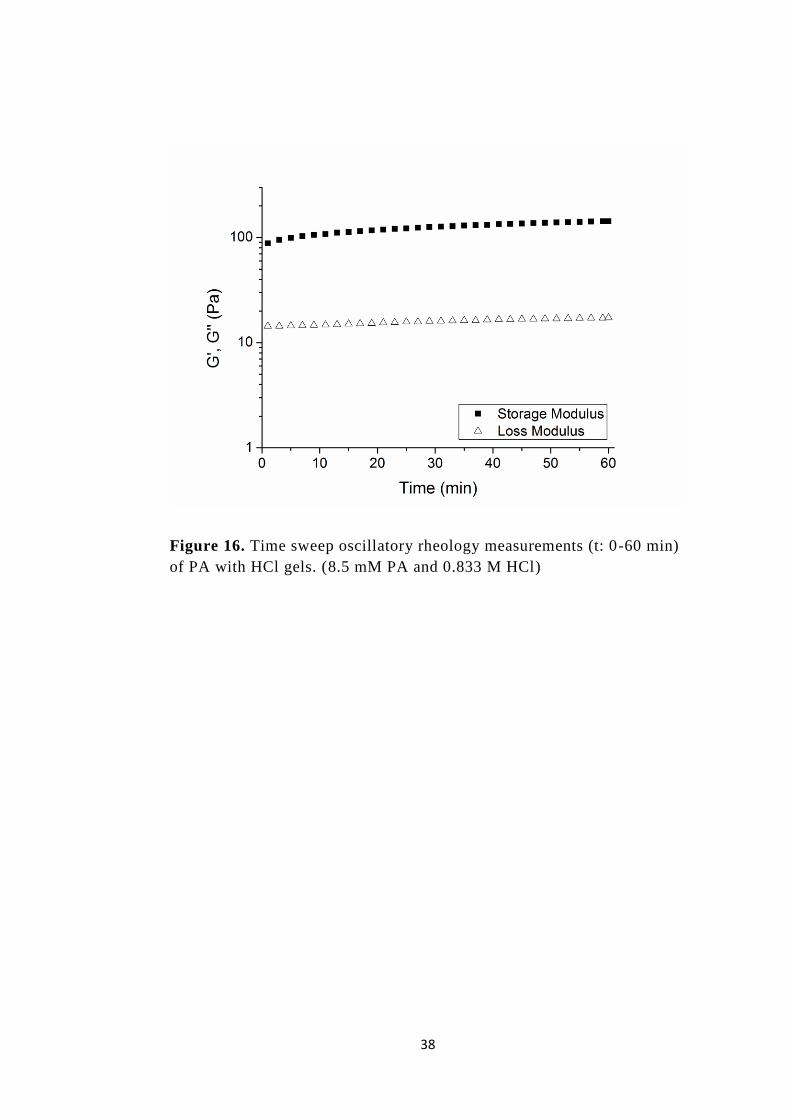
Figure 16. Time sweep oscillatory rheology measurements (t: 0-60 min) of PA
with HCl gels. (8.5 mM PA and 0.833 M HCl) .......................................... 38
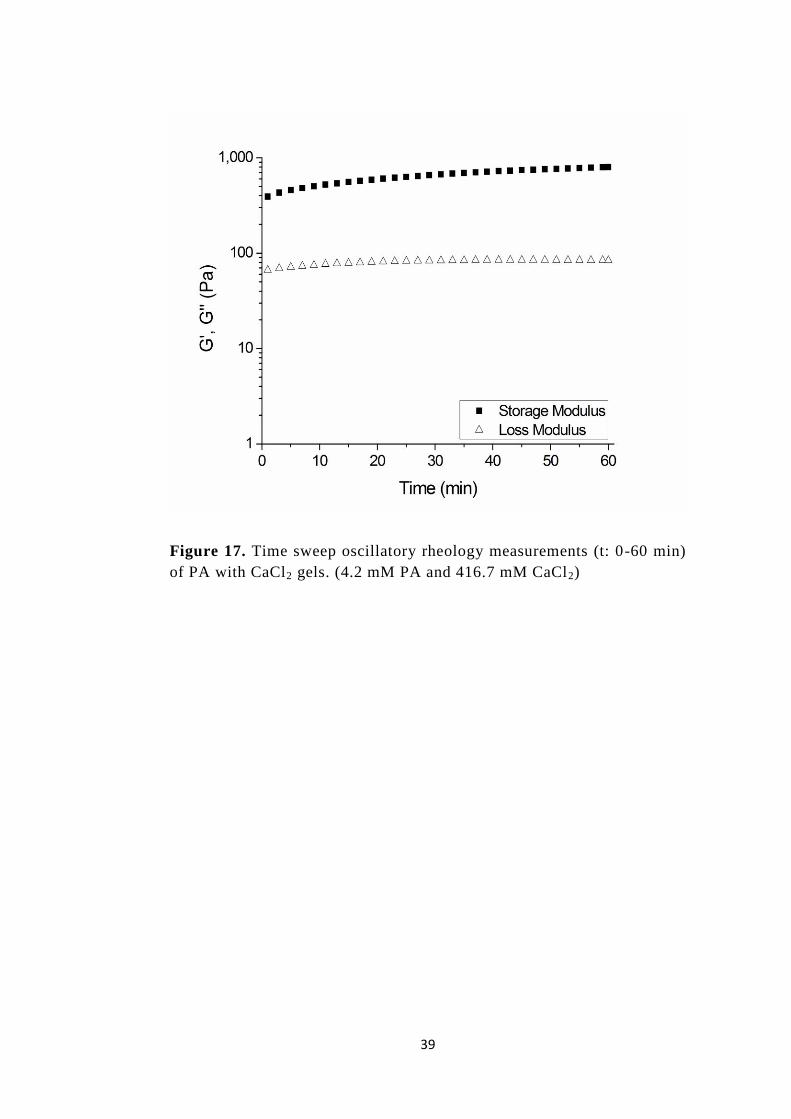
Figure 17. Time sweep oscillatory rheology measurements (t: 0-60 min) of PA
with CaCl2 gels. (4.2 mM PA and 416.7 mM CaCl2) ................................. 39
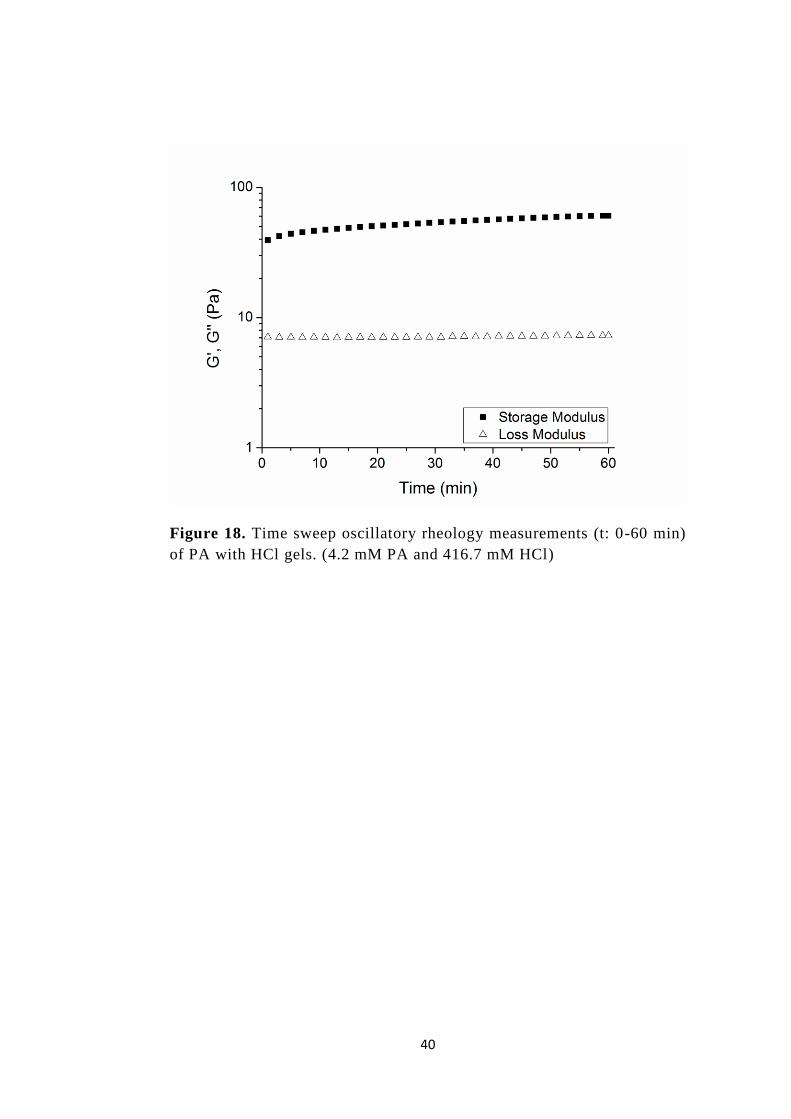
Figure 18. Time sweep oscillatory rheology measurements (t: 0-60 min) of PA
with HCl gels. (4.2 mM PA and 416.7 mM HCl) ....................................... 40
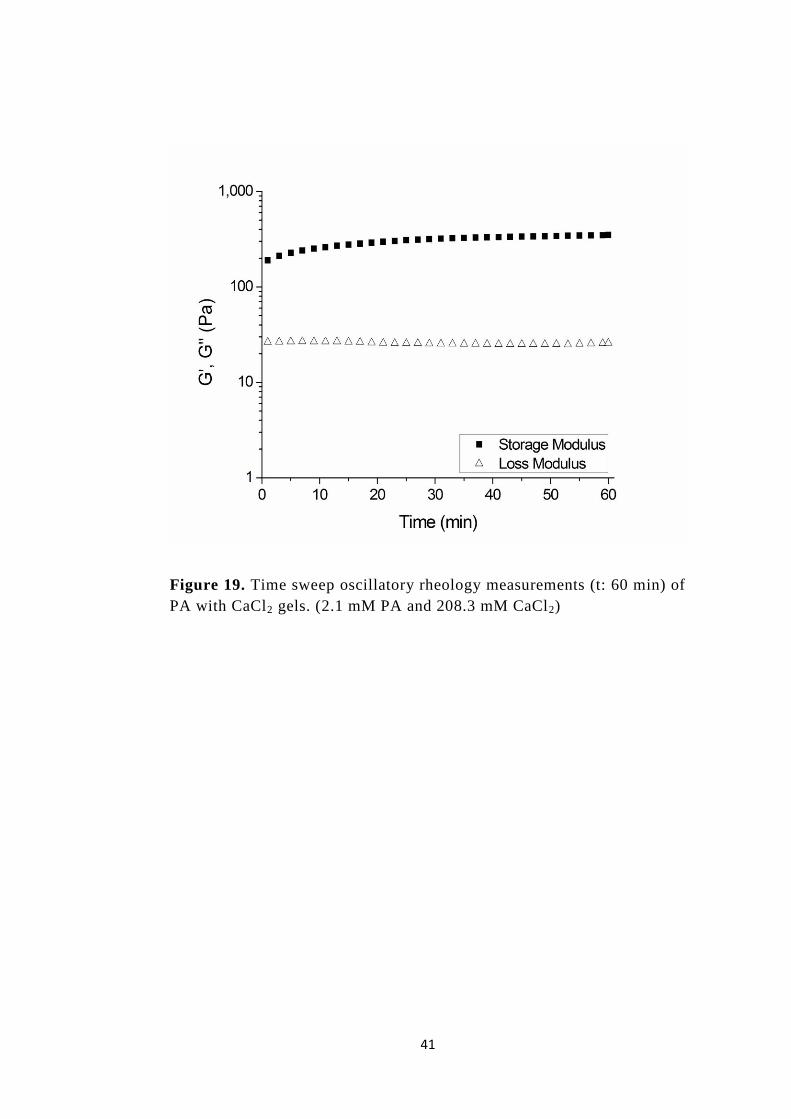
Figure 19. Time sweep oscillatory rheology measurements (t: 60 min) of PA
with CaCl2 gels. (2.1 mM PA and 208.3 mM CaCl2) ................................. 41
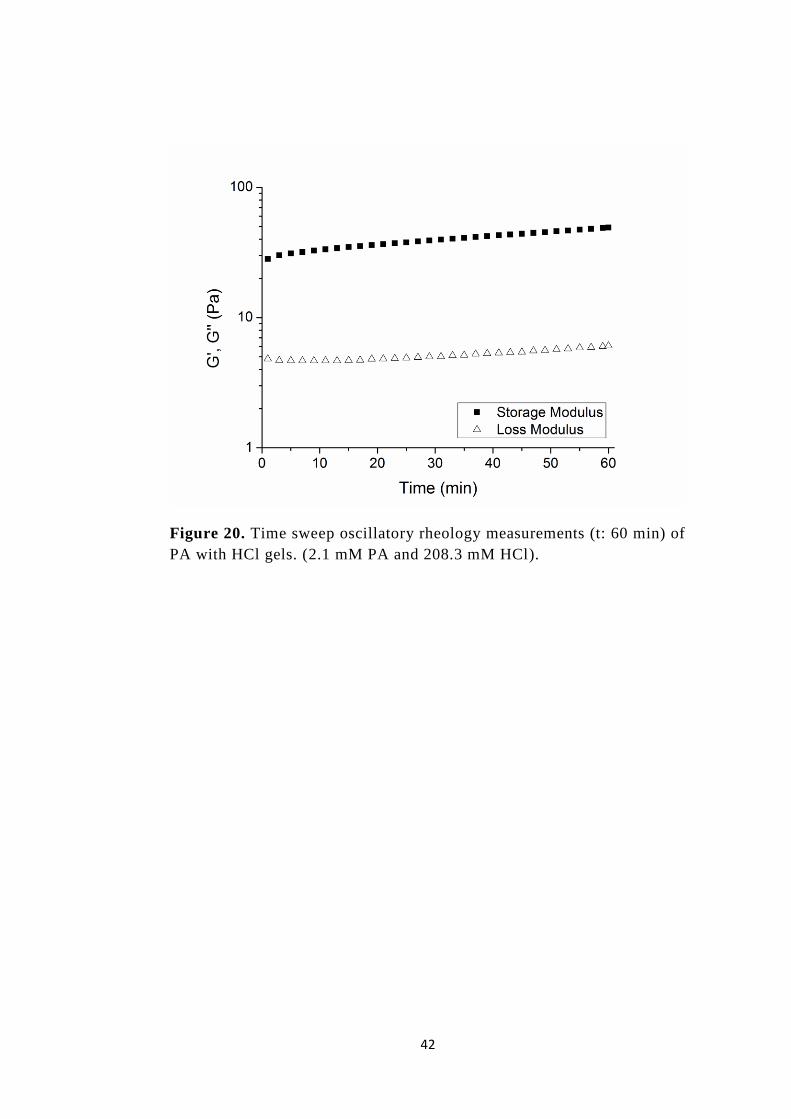
Figure 20. Time sweep oscillatory rheology measurements (t: 60 min) of PA
with HCl gels. (2.1 mM PA and 208.3 mM HCl). ...................................... 42
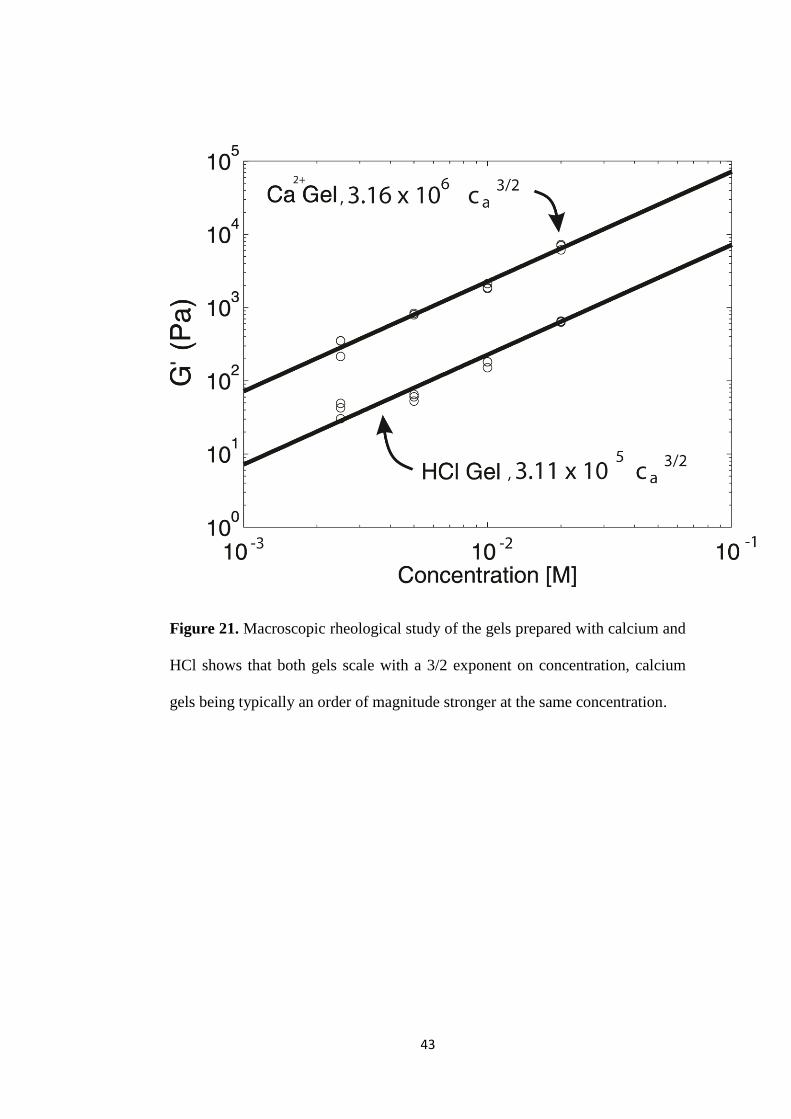
Figure 21. Macroscopic rheological study of the gels prepared with calcium and
HCl shows that both gels scale with a 3/2 exponent on concentration,
calcium gels being typically an order of magnitude stronger at the same
concentration. .............................................................................................. 43
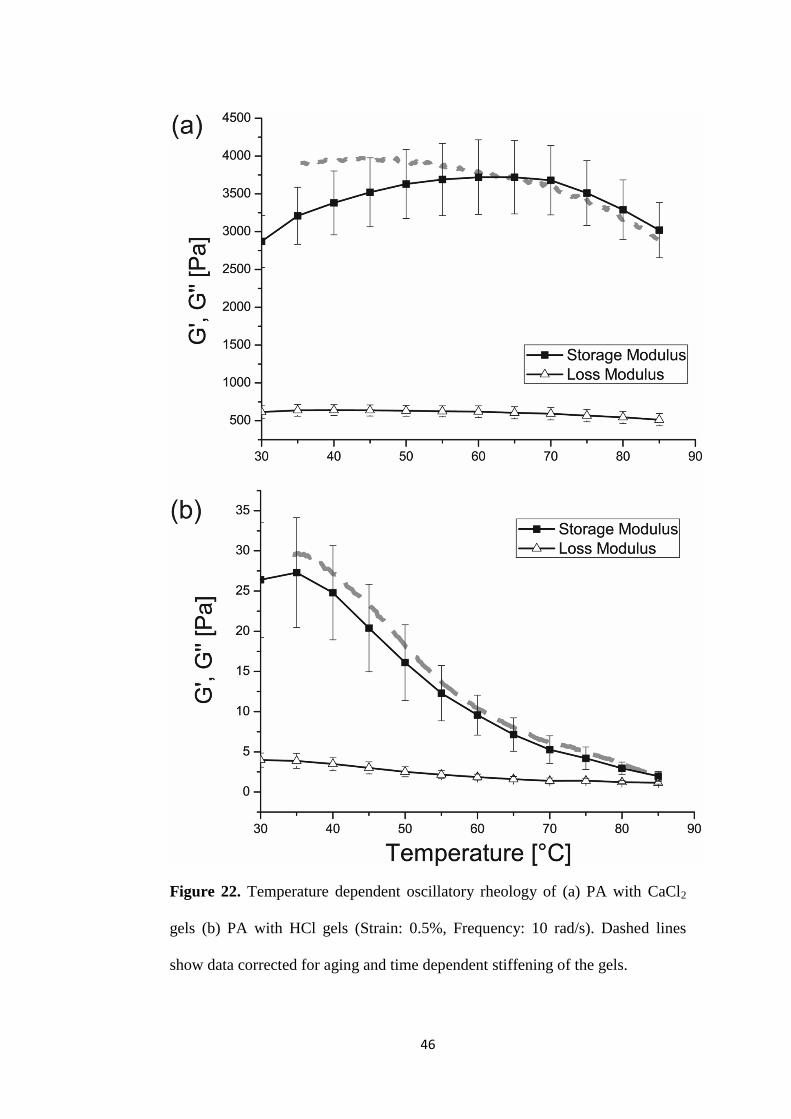
Figure 22. Temperature dependent oscillatory rheology of (a) PA with CaCl2
gels (b) PA with HCl gels (Strain: 0.5%, Frequency: 10 rad/s). Dashed lines
show data corrected for aging and time dependent stiffening of the gels. .. 46
Figure 23. Chemical structure of the (a) YIGSR-PA, (b) Lys-PA and (c) Glu-
PA. ............................................................................................................... 68
Figure 24. RP-HPLC chromatogram of the YIGSR-PA. Absorbance at 220 nm
vs retention time graph. ............................................................................... 69
Figure 25. Electrospray ionization mass spectra of the YIGSR-PA.
(M+H)observed+=1230.81, (M+H)calculated+=1230.81, (M+2H)+2/2observed+=
615.92 , (M+2H)+2/2calculated+= 615.92. ....................................................... 70
Figure 26. RP-HPLC chromatogram of the Glu-PA. Absorbance at 220 nm vs
retention time graph. ................................................................................... 71
Figure 27. Electrospray ionization mass spectra of the Glu-PA. (M-H) -1
observed+=654.41, (M-H) -1
calculated+= 654.41, (M-2H)/2 -2
observed+= 326.69,
(M-2H)/2 -2
calculated+= 326.69, (2M-H) -1
observed+= 1309.80, (2M-H) -1
calculated+= 1309.80. ...................................................................................... 72
Figure 28. RP-HPLC chromatogram of the Lys-PA. Absorbance at 220 nm vs
retention time graph. ................................................................................... 73
Figure 29. Electrospray ionization mass spectra of the Lys-PA.
(M+H)observed+=654.49, (M+H)calculated+=654.49,(2M+H)observed+= 1307,97 ,
(2M+H)calculated+= 1307,97. .......................................................................... 74
Figure 30. Scanning electron micrographs of (a) Lys-PA gel formed with Glu-
PA, (b) YIGSR-PA gel formed with Glu-PA and (c)YIGSR-PA gel formed
XII
with chondroitin sulfate (scale bars are 5 µm for a and b, 10 µm for c).
AFM topography images of (d) Lys-PA gel formed with Glu-PA, (e) Lys-
PA gel formed with Glu-PA and (f) YIGSR-PA gel formed with
chondroitin sulfate. ...................................................................................... 76
Figure 31. Circular dichroism spectra of the YIGSR-PA and Glu-PA at different
conditions. ................................................................................................... 78
Figure 32. Time sweep oscillatory rheology measurements (t: 60 min) of
YIGSR-PA with Glu-PA, YIGSR-PA with chondroitin sulfate and Lys-PA
with Glu-PA gels. ........................................................................................ 79
Figure 33. (a) The ratio of live cells to total number of cells representing the
viability of corneal fibroblasts on TCP, YIGSR-PA coated and collagen
coated surfaces. Cells were stained with Calcein AM and Ethidium
Homodimer-1. Representative fluorescent images of corneal fibroblasts
cultured into (b) uncoated wells, (c) YIGSR-PA coated wells and (d)
collagen coated wells at 72 hours. (**** p<0.0001, n.s.: No Significance).
..................................................................................................................... 81
Figure 34. Spreading and cellular morphology of corneal fibroblasts acquired
by staining with TRITC-conjugated phalloidin and TO-PRO®-3 iodide on
(a) uncoated glass surface (63 X), (b) YIGSR-PA coated surface (63 X) and
(c) collagen coated surface (63 X). SEM images of corneal fibroblasts
cultured on (d) uncoated glass surface, (e) YIGSR-PA coated surface and
(f) collagen coated surface. ......................................................................... 83
Figure 35. Evaluation of cell proliferation using 5-bromodeoxyuridine (BrdU).
2 × 10⁴ cells/well of corneal fibroblasts were seeded on each surface placed
in the 24-well plates, and were cultured for 3 days. (** p<0.003) .............. 85

XIII
LIST OF TABLES
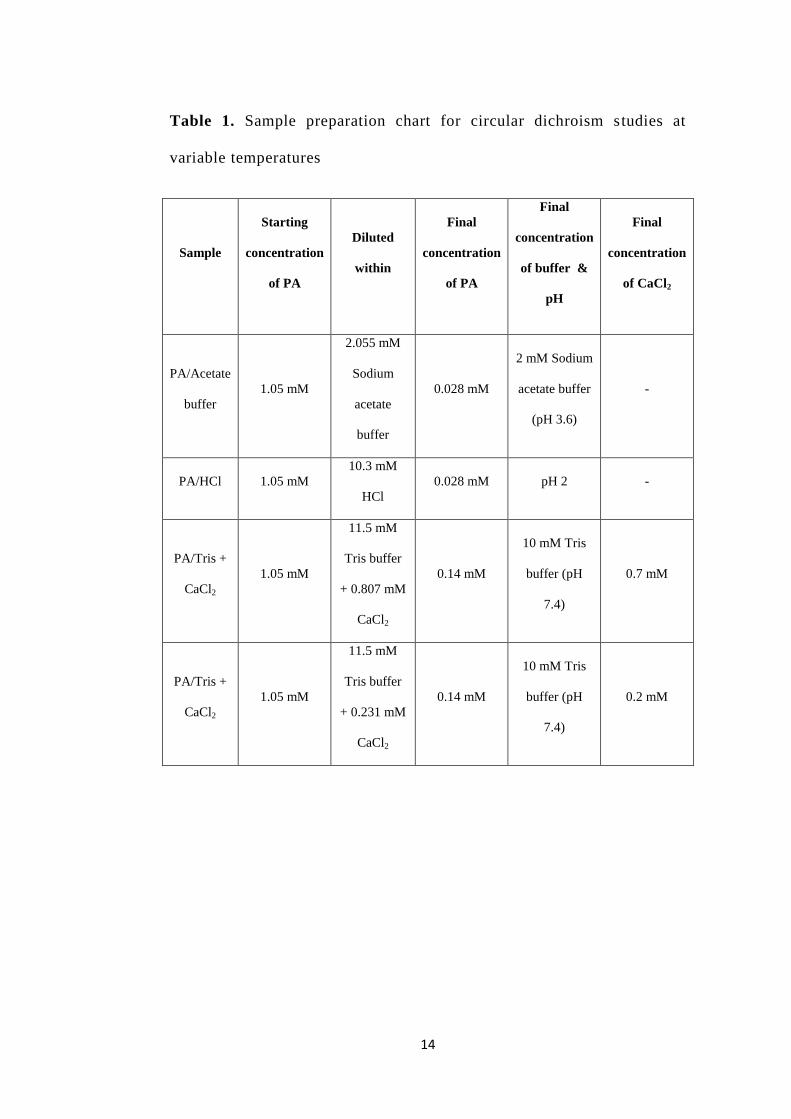
Table 1. Sample preparation chart for circular dichroism studies at variable
temperatures ................................................................................................ 14
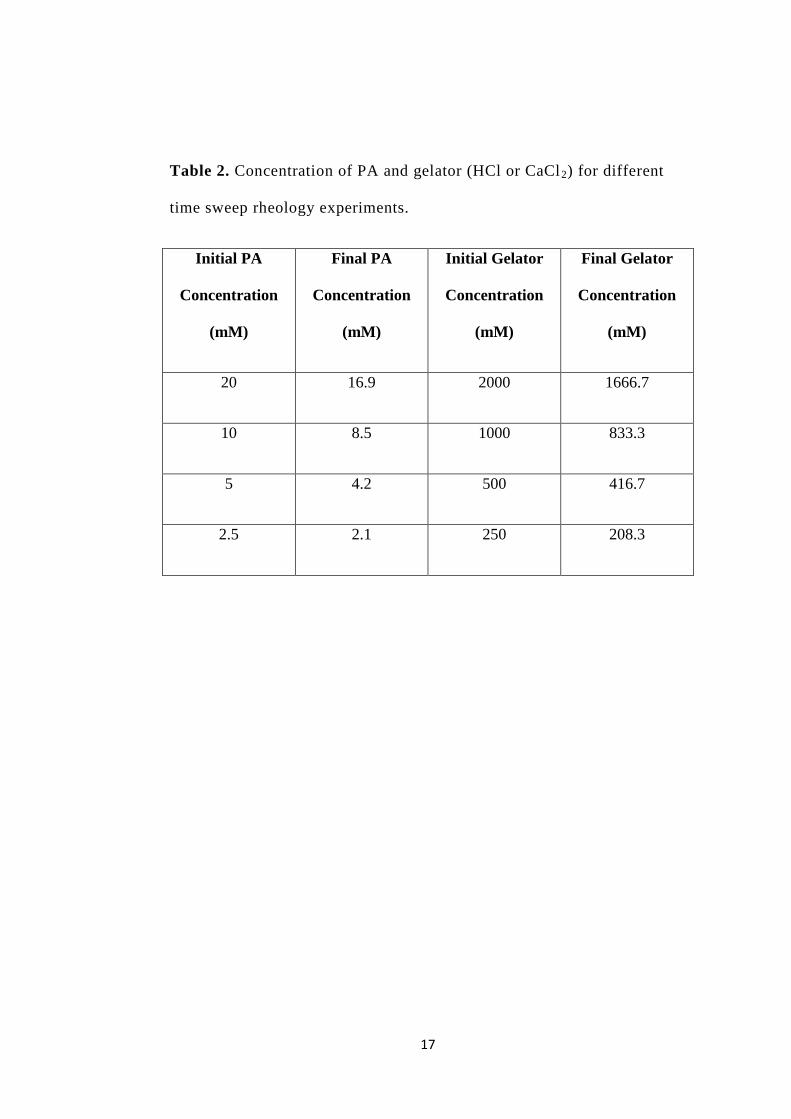
Table 2. Concentration of PA and gelator (HCl or CaCl2) for different time
sweep rheology experiments. ...................................................................... 17
1
CHAPTER 1
Interfiber interactions alter stiffness of gels formed by
supramolecular self-assembled nanofibers
This work was partly published in “Interfiber Interactions Alter Stiffness of
Gels Formed by Supramolecular Self-Assembled Nanofibers” Yavuz S.
Dagdas, Aysegul Tombuloglu, Ayse B. Tekinay, Aykutlu Dana and Mustafa
O. Guler Soft Matter, 2011, 7, 3524-3532 ” Reproduced (or 'Reproduced in
part') with permission from Royal Society of Chemistry. Copyright 2011
Royal Society of Chemistry.
2
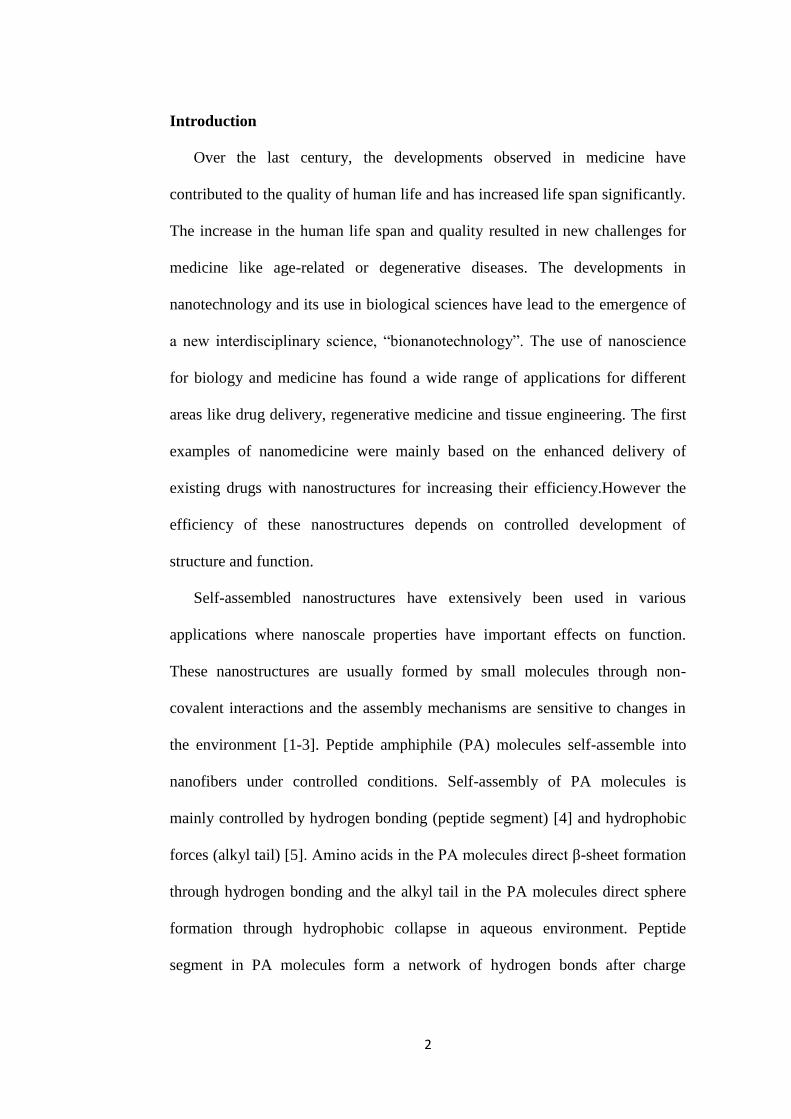
Introduction
Over the last century, the developments observed in medicine have
contributed to the quality of human life and has increased life span significantly.
The increase in the human life span and quality resulted in new challenges for
medicine like age-related or degenerative diseases. The developments in
nanotechnology and its use in biological sciences have lead to the emergence of
a new interdisciplinary science, “bionanotechnology”. The use of nanoscience
for biology and medicine has found a wide range of applications for different
areas like drug delivery, regenerative medicine and tissue engineering. The first
examples of nanomedicine were mainly based on the enhanced delivery of
existing drugs with nanostructures for increasing their efficiency.However the
efficiency of these nanostructures depends on controlled development of
structure and function.
Self-assembled nanostructures have extensively been used in various
applications where nanoscale properties have important effects on function.
These nanostructures are usually formed by small molecules through non-
covalent interactions and the assembly mechanisms are sensitive to changes in
the environment [1-3]. Peptide amphiphile (PA) molecules self-assemble into
nanofibers under controlled conditions. Self-assembly of PA molecules is
mainly controlled by hydrogen bonding (peptide segment) [4] and hydrophobic
forces (alkyl tail) [5]. Amino acids in the PA molecules direct β-sheet formation
through hydrogen bonding and the alkyl tail in the PA molecules direct sphere
formation through hydrophobic collapse in aqueous environment. Peptide
segment in PA molecules form a network of hydrogen bonds after charge
3
neutralization through either electrolyte addition or pH change, and directs
formation of nanofiber-like cylindrical micelles instead of spherical micelles [2,
4, 6-9]. The PA nanofibers form a 3-D network resulting in gel formation in
aqueous conditions [3-4, 10-13].
The nanofiber networks formed by PA molecules are utilized as scaffolds for
tissue engineering due to their ability to mimic native extracellular matrix
(ECM) [8, 13-16]. ECM supports attachment, proliferation and migration of
cells and provides mechanical support to tissue. The mechanical properties of
surroundings of cells can result in alterations in cellular responses through
cytoskeletal structure, thus affecting the cell behavior and direct stem cell
differentiation [17-19]. Therefore, for tissue engineering applications, it is
essential to control mechanical features of the scaffolds as well as their
bioactivity. In the current study, solid phase peptide synthesis method was
utilized for the synthesis of peptide amphiphile molecules.
1.1 Solid Phase Peptide Synthesis
Solid phase peptide synthesis (SPSS) was first developed by Bruce
Merrifield for the synthesis of polypeptides and received Nobel Prize in 1984.
This method has advantages in terms of efficiency and purity of products over
the conventional synthesis methods. It is not as labor intensive as liquid phase
synthesis method especially for longer sequences. Dr. Merrifield used
benzyloxycarbonyl and t-butoxycarbonyl protected amino acids for the synthesis
of polypeptides. Number of different protecting groups, solvents and reagents
have been developed and used for this method and 9-fluorenylmethoxycarbonyl
(Fmoc) group protected amino acids were used within this study.
4
The synthesis of peptides by SPSS method starts with loading of protected
amino acids on polymeric supports named as resin. There are commercially
available resins already loaded with amino acids with protecting groups. The
principle of SPPS is based on repetitive cycles of deprotection and coupling.
The protected N-terminal amine of resin attached peptide is deprotected
resulting in free N-terminal amine which is coupled with another amino acid
later on. After completion of amino acid addition, peptide is cleaved from the
resin with all side chain protecting groups leaving a free crude peptide. Peptides
are purified after the cleavage usually with reverse phase HPLC.
In this study, SPSS method was utilized in order to synthesize peptide
amphiphile molecules with an aim to use them for regenerative medicine studies
as extracellular matrix mimetic materials. The mechanical properties of these
nanofiber systems are of importance, since they are crucial for mediating
cellular responses.
5
Figure 1. Solid Phase Synthesis Diagram. Reproduced with
permission from Sigma-Aldrich.
6
1.2 Effect of Substrate Stiffness on Cell Behaviour
Tissues are made up of cells and extracellular space that is filled with a
complex network of macromolecules forming the extracellular matrix (ECM).
There is a dynamic interaction between cells and ECM that direct tissue
morphogenesis. The direct interaction between cell and ECM by means of
receptor signaling and the indirect role of ECM on the controlled mobilization
of growth or differentiation factors are known to affect cellular functions, cell
proliferation and phenotype [20-22]. In addition to the roles of ECM on
chemical signaling, its physical properties also affect cellular behaviours such as
motility [23], phagocytosis [24] and differentiation [17].
Mechanical features of PA gels can be tuned for various tissue engineering
approaches depending on tissue type. The PA molecules form a dynamic
assembly which is affected by pH change, electrolyte addition and electrostatic
interactions. Thus, a better understanding of gelation mechanisms of PA
molecules will help us design appropriate substrates for tissue engineering
studies. The self-assembled PA nanostructures differ from traditional polymeric
materials in terms of 3-D interactions. The mechanical properties of the
networks formed by polymeric nanostructures are directly related to material
concentration [25-26]. Increase in the concentration results in extension of the
nanostructures and the interaction between the nanostructures results in
enhanced stiffness in microscale. Due to their dynamic nature, the microscale
mechanical properties of the PA based networks are not affected by interactions
among the nanostructures in a similar fashion to polymeric systems. Therefore,

7
it is important to understand the relationship between the nano and micro scale
mechanical properties of self-assembled PA materials.
8
Materials and Methods
2.1 General Methods
The identity of the peptide amphiphiles were assessed by Agilent 6530-
1200 Q-TOF LC/MS equipped with ESI-MS and a Zorbax Extend C18 column
(Agilent 4.6 x 100 mm, 3.5 µm). The purification of the PA molecules were
performed with reverse-phase HPLC system with Zorbax Extend-C18 21.2 x
150 mm column for basic conditions. A: 0.1 % ammonium hydroxide in water
and B: 0.1% ammonium hydroxide in acetonitrile gradient was used for
analytical and preparative HPLC. Amide bond was observed at 220 nm.
2.2 Materials
9-Fluorenylmethoxycarbonyl (Fmoc) protected amino acids, Fmoc-
Asp-(OtBu)-Wang resin and 2-(1H-Benzotriazol-1-yl)-1,1,3,3-
tetramethyluronium hexafluorophosphate (HBTU) were purchased from
NovaBiochem and ABCR. The other chemicals were purchased from Fisher,
Merck, Alfa Aesar or Aldrich and used as received, without any purification.
2.3 Synthesis of Peptides
Peptide amphiphile (PA) molecules were synthesized by using
fluorenylmethoxycarbonyl (Fmoc) chemistry. Synthesis was performed
manually on a 0.25 mmole scale using a 50 ml peptide synthesis vessel on a
wrist action shaker. PA molecules were synthesized by using Fmoc-Asp-
(OtBu)-Wang resin. After each reaction, resin was washed three times with
DMF, DCM and DMF respectively. All amino acids were activated by adding 2
molar equivalents of amino acid to 1.95 equivalents of O-Benzotriazole-
9
N,N,N’,N’-tetramethyl-uronium-hexafluoro-phosphate (HBTU) and dissolved in
10 ml of DMF. After complete dissolution of amino acid and HBTU in DMF, 3
molar equivalents of N-ethyl-diisopropylamine (DIEA) were added into the
solution. The solution was mixed thoroughly and kept for 3 minutes before
adding to resin. Each coupling reaction was performed for 2.5 h. For each
coupling reaction, Fmoc groups were removed by shaking resin in 20%
piperidine in N,Ndimethylformamide (DMF) for 20 min. The alkylation reaction
was performed by coupling with lauric acid. Lauric acid coupling was
performed same as amino acid coupling using lauric acid instead of amino acid.
A ninhydrin test was performed after the addition of each amino acid and after
the addition of the fatty acid. When the ninhydrin test yielded positive results,
the coupling reaction was repeated; otherwise 10 ml of 10% acetic anhydride in
DMF was added and resin was shaken for 30 min. Peptide cleavage from resin
and deprotection were performed with 95:2.5:2.5 trifluoroacetic acid (TFA):
triisopropylsilane (TIS): water for 2.5 h at room temperature. After the cleavage
reaction, PA molecules were collected in a clean round bottom flask and washed
several times with DCM. The collected solution was rotary-evaporated. After
evaporation, ice-cold diethyl ether was added and was left at -20 °C overnight.
The PA-diethyl ether mixture was collected in 50 ml falcon tubes and
centrifuged at 8000 rpm for 25 min. Supernatant was decanted and the
remaining diethyl ether was evaporated. The pellet was dissolved in deionized
H2O at a resistance of 18.2 Ω and was freeze-dried.
10
2.4 Characterization of Peptide Amphiphiles
2.4.1 Scanning Electron Microscopy (SEM)
The nanofiber networks formed by the PA molecules were observed with
scanning electron microscopy (SEM). SEM samples of the PA-HCl gels and the
PA-CaCl2 gels were prepared at final PA and gelator concentrations of 8.3 mM
and 41.7 mM respectively. The PA-HCl samples had a final pH of 2 and the PA-
CaCl2 gels were mixed at 1:5 molar ratios. The formed gels were then placed
onto a metal mesh and dehydrated with increasing concentrations of ethanol up
to 100%. The ethanol was then removed by critical point drying (Tourismis,
Autosamdri-815B). Samples were sputter-coated twice with 2.5 nm of Pt to
ensure complete coating. Visualization of the nanofiber networks were carried
out with a FEI, Nova NanoSEM 430 at 18 kV with an average working distance
of 5 milimeters.
2.4.2 Transmission Electron Microscopy (TEM)
Two different sample formulations were prepared for TEM; the mixture
of PA molecules with CaCl2 or with HCl. 10 µl of 2 mM PA solution at pH 7
was mixed with 2 µl of 250 mM CaCl2 solution and 10 µl of 2 mM PA solution
at pH 7 was mixed with 2 µl of 250 mM HCl solution. PA with CaCl2 and PA
with HCl solutions were cast on TEM grids and incubated for 3 minutes.
Samples were stained with 2% aqueous uranyl acetate solution and air dried
overnight. TEM images were acquired with a FEI Tecnai G2 F30 TEM at 100
kV.
11
2.4.3 Atomic Force Microscopy (AFM)
AFM samples were prepared on 1 cm2 silicon wafers (with low residual
roughness (<1 nm/µm2)) using 25 µl of 0.5 mM PA solutions. PA–CaCl2
samples were prepared by mixing 100 µl of 0.5 mM PA solution at pH 7 with 3
µl of 50 mM CaCl2 solution (1:3 molar ratio). PA with HCl samples were
prepared by adjusting the final pH to 2. After addition of CaCl2 and HCl to pH 7
PA solution, eppendorfs were vortexed thoroughly and sonicated for 5 min. 1
min after casting the solution onto a silicon wafer, excess water was removed
with a tissue and the sample was air dried. Dynamic mode imaging was used to
image the topography of the resulting samples, using appropriate cantilevers
(cantilever stiffness of k=3-40 N/m, resonance frequency of f0=70-350 kHz for
the dynamic mode).
2.4.4 Circular Dichroism (CD) at room temperature
CD spectra of the PA solutions were obtained using a J-815 Jasco
spectrophotometer in the far UV region (190 – 300 nm) using quartz cuvettes of
1 mm path length. Room temperature CD studies involved samples that are
prepared from same batch and pH was adjusted to 7 before use. Spectra were
acquired for three formulations; PA at pH 7, PA mixed with CaCl2 and PA
mixed with HCl. The PA with HCl sample was prepared by adjusting the pH to
2 by addition of HCl and the PA with CaCl2 sample was prepared by adding
CaCl2 at 1:5 molar ratios compared to the PA to ensure complete neutralization
of the charges at pH 7. A solution of 0.1 mM PA was prepared in deionized
water and the pH was adjusted to 7. For the PA-CaCl2 measurements 5 µl of 100
mM CaCl2 was added to 1 ml of PA solution. For the PA-HCl measurements,
12
the pH of a 1 ml sample of the PA was adjusted to pH 2 with HCl. Averages of
three scans of each sample were taken.
In order to study the effect of CaCl2 on secondary structure formation,
CD spectra were monitored after adding EDTA to the PA-CaCl2 sample. 2.6 ml
of 7 mM CaCl2 was added to 400 µl of a 1.05 mM solution of PA and incubated
at room temperature for 6 h before acquiring CD spectra. 10 µl of 0.05 M EDTA
was then added to the solution and further spectra were acquired immediately
and again after a 6 h incubation. CD spectra were obtained from 190 nm to 300
nm at a digital integration time of 1 s, a band width of 1 nm and a data pitch of
0.1 nm.
2.4.5 Circular Dichroism at variable temperatures
Variable temperature CD studies were carried out with Jasco J-815
equipped with PTC-423S/15 peltier unit. Before preparing samples, 1.05 mM
PA was sonicated for an hour. For preparing low pH samples PA was diluted in
sodium acetate buffer or HCl. PA/CaCl2 samples were prepared by diluting PA
in Tris buffer containing CaCl2. Details can be followed from the table given in
Table 1. Samples were mixed well and incubated for 24 h at room temperature
for equilibration. For each measurement, 300 µl of sample was pipetted into a 1
mm quartz cuvette which was inverted gently for mixing without damaging any
assembled structures. CD spectra were obtained from 190 nm to 300 nm at a
digital integration time of 4 s, a band width of 1 nm and a data pitch of 0.1 nm.
Samples were heated at a rate of 0.2 °C/min, and spectra were collected at 1 ˚C
intervals between 25 ˚C and 90 ˚C. After acquisition, spectra were smoothed
13
with means movement with a convolution width of 15, which was included in
Spectra-Manager (Jasco-UK ltd) software.
2.4.6 Fourier Transform Infrared Spectroscopy
Three different sample formulations were prepared for FTIR: PA
solution at pH 7, PA solution mixed with CaCl2 and PA solution mixed with
HCl. PA at pH 7 sample was prepared by using 150 µl of 10 mM PA solution.
PA with CaCl2 sample was prepared by mixing 125 µl of 10 mM PA solution
with 25 µl of 1 M CaCl2. PA with HCl sample was prepared by mixing 125 µl
of 10 mM PA solution with 25 µl of 1 M HCl. In order to obtain complete
diffusion of gelling agents, samples were shaken overnight and then frozen and
lyophilized. 1 mg of each formulation was mixed with 100 mg of KBr and
crushed thoroughly. Transmittance of the pellet was measured by Bruker,
Vertex 70 FT-IR instrument.
14
Table 1. Sample preparation chart for circular dichroism studies at
variable temperatures
Sample
Starting
concentration
of PA
Diluted
within
Final
concentration
of PA
Final
concentration
of buffer &
pH
Final
concentration
of CaCl2
PA/Acetate
buffer
1.05 mM
2.055 mM
Sodium
acetate
buffer
0.028 mM
2 mM Sodium
acetate buffer
(pH 3.6)
-
PA/HCl 1.05 mM
10.3 mM
HCl
0.028 mM pH 2 -
PA/Tris +
CaCl2
1.05 mM
11.5 mM
Tris buffer
+ 0.807 mM
CaCl2
0.14 mM
10 mM Tris
buffer (pH
7.4)
0.7 mM
PA/Tris +
CaCl2
1.05 mM
11.5 mM
Tris buffer
+ 0.231 mM
CaCl2
0.14 mM
10 mM Tris
buffer (pH
7.4)
0.2 mM
15
2.4.7 Zeta Potential and pH Titration
Zeta potential measurements were performed with Malvern Nano-ZS
zetasizer which contains a pH meter and titration system. Three formulations
were used for zeta potential samples. PA at pH 7, PA at pH 2 and PA at pH 7
with CaCl2. PA solutions were prepared at 0.05 wt % and pH was adjusted to 7
before use. PA with CaCl2 was at 1:5 molar ratio respectively and pH was
adjusted with 0.1 M HCl for PA at pH 2 sample. 0.06 wt % PA solution was
prepared for pH titration study and pH was adjusted to 11 before use. pH
titration was done by adding 0.1 M HCl to the PA solutions. Smoluchovski
method was used to determine the zeta potential values.
2.4.8 Oscillatory Rheology
Rheology measurements were performed with an Anton Paar Physica
RM301 Rheometer operating with a 25 mm parallel plate at 0.5 mm gap
distance. Freeze-dried peptide amphiphile molecules were dissolved in
deionized water and pH was adjusted to 7 with 0.1 M NaOH solution. The total
volume of each sample was set to 150 µl and gel formation was achieved by
mixing 125 µl of peptide amphiphile solution (pH 7) with 25 µl of aqueous
gelator solution (HCl or CaCl2). The gel was prepared on the lower plate of the
rheometer and gelling agents were added dropwise in order to prevent any
deformation on gel structure with a mole excess amount to ensure higher
diffusion rate and improved interaction with PA molecules. Four different
concentrations of PA and gelator were investigated using time sweep oscillatory
measurements. Final concentration of PA and gelators are listed in Table 2. The
stage temperature was adjusted to 25 °C and all samples were allowed to
16
equilibrate for 15 min before measurement to achieve stable gel formation. Wet
tissue paper was placed inside the chamber around the edge of the plate to
provide a humid environment preventing solvent evaporation from the sample
during the experiments. Measurements were performed for 60 min at 10 rad/s
and 0.5% strain.
Temperature dependent oscillatory rheology was performed for PA-HCl
and PA-CaCl2 gels with final concentrations of 8.5 mM PA with 833.3 mM
gelator. Measurements were performed from 25 °C to 85 °C at a heating rate of
1 °C/min with a 10 rad/s frequency and 0.5 % strain.
17
Table 2. Concentration of PA and gelator (HCl or CaCl2) for different
time sweep rheology experiments.
Initial PA
Concentration
(mM)
Final PA
Concentration
(mM)
Initial Gelator
Concentration
(mM)
Final Gelator
Concentration
(mM)
20 16.9 2000 1666.7
10 8.5 1000 833.3
5 4.2 500 416.7
2.5 2.1 250 208.3

18
Results and Discussions
3.1 Design and Synthesis of Peptide Amphiphiles
The PA molecule used during the study in this chapter is composed of an
alkyl tail, β-sheet forming (VVAG) peptide sequence followed by a glutamic
acid residue, which is effective in increasing the solubility of the molecule and a
bioactive epitope (RGD), a peptide sequence that enhances cell adhesion (Figure
2) [27]. The PA molecule was synthesized and purified with Agilent 6530-1200
Q-TOF LC/MS equipped with ESI-MS and a Zorbax Extend C18 column.
(Figure 3 and Figure 4).
Figure 2. Chemical structure of the investigated peptide amphiphile
molecule.
19
Figure 3. Electrospray ionization mass spectra of the PA. (M-H)-1
observed+= 982.65, (M-H)-1
calculated+= 982.57, (M-2H)/2-1
observed+=490.84,
(M-H) -1
calculated+= 490.78
20
Figure 4. Analytical HPLC trace of the PA.
21
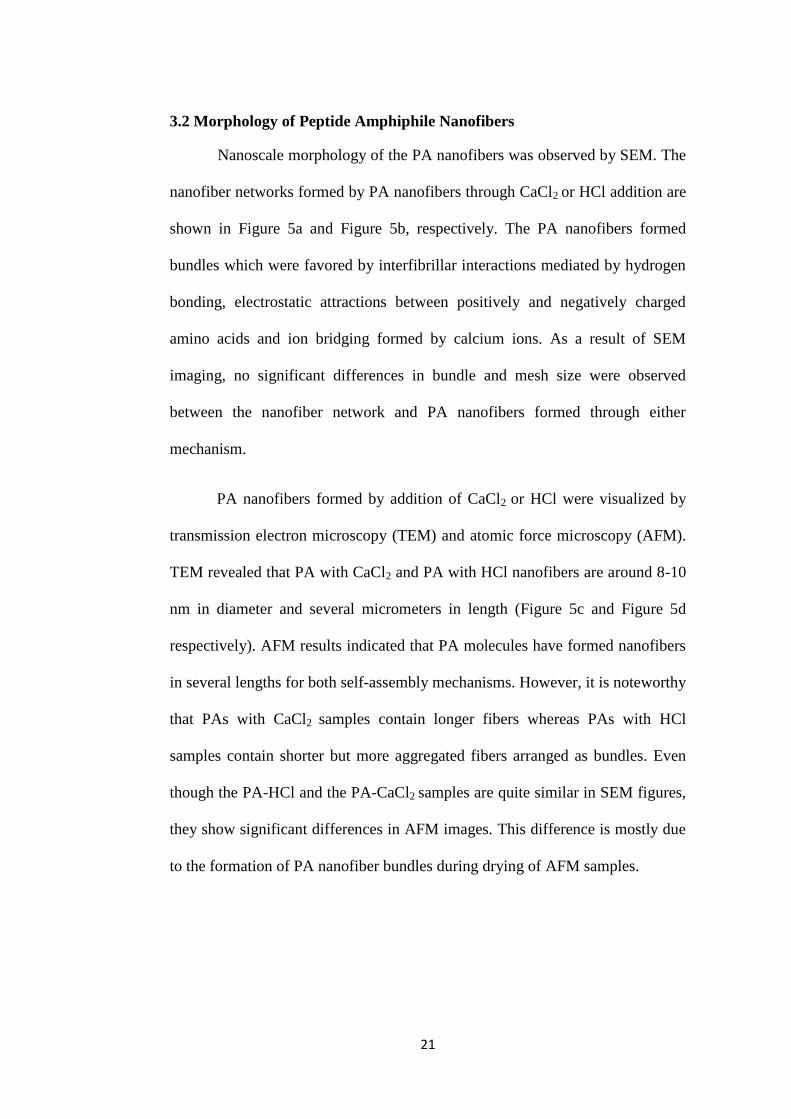
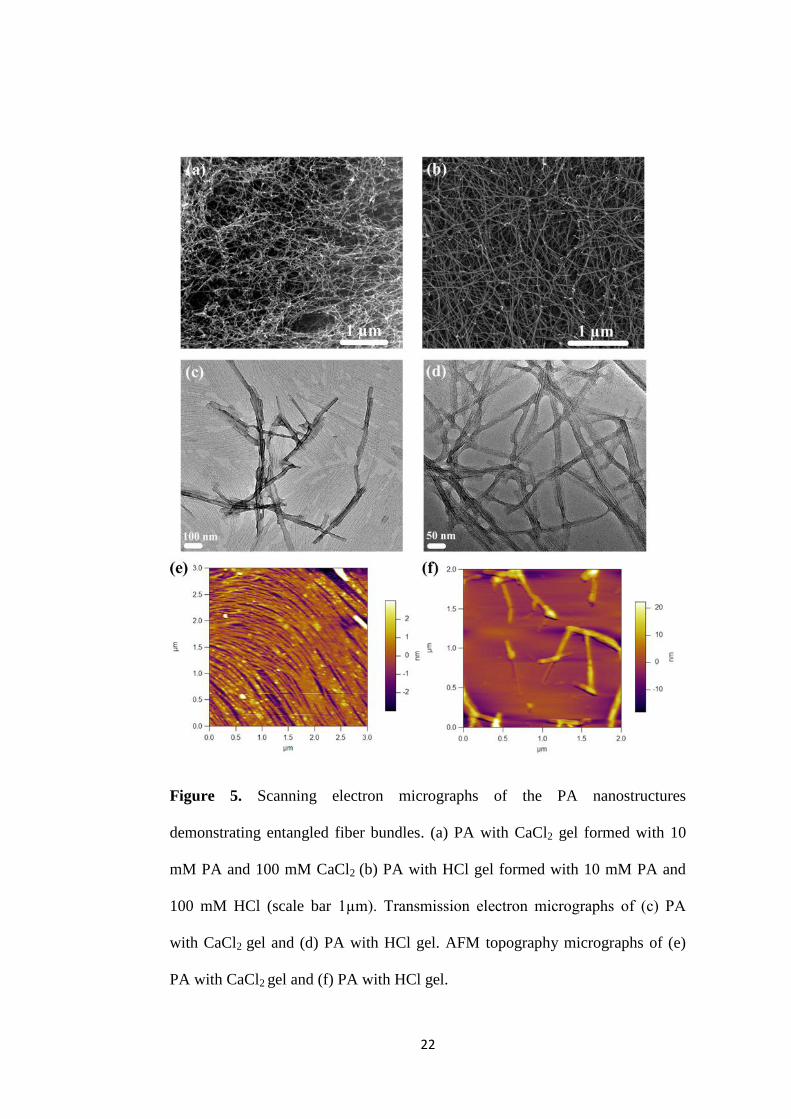
3.2 Morphology of Peptide Amphiphile Nanofibers
Nanoscale morphology of the PA nanofibers was observed by SEM. The
nanofiber networks formed by PA nanofibers through CaCl2 or HCl addition are
shown in Figure 5a and Figure 5b, respectively. The PA nanofibers formed
bundles which were favored by interfibrillar interactions mediated by hydrogen
bonding, electrostatic attractions between positively and negatively charged
amino acids and ion bridging formed by calcium ions. As a result of SEM
imaging, no significant differences in bundle and mesh size were observed
between the nanofiber network and PA nanofibers formed through either
mechanism.
PA nanofibers formed by addition of CaCl2 or HCl were visualized by
transmission electron microscopy (TEM) and atomic force microscopy (AFM).
TEM revealed that PA with CaCl2 and PA with HCl nanofibers are around 8-10
nm in diameter and several micrometers in length (Figure 5c and Figure 5d
respectively). AFM results indicated that PA molecules have formed nanofibers
in several lengths for both self-assembly mechanisms. However, it is noteworthy
that PAs with CaCl2 samples contain longer fibers whereas PAs with HCl
samples contain shorter but more aggregated fibers arranged as bundles. Even
though the PA-HCl and the PA-CaCl2 samples are quite similar in SEM figures,
they show significant differences in AFM images. This difference is mostly due
to the formation of PA nanofiber bundles during drying of AFM samples.
22
Figure 5. Scanning electron micrographs of the PA nanostructures
demonstrating entangled fiber bundles. (a) PA with CaCl2 gel formed with 10
mM PA and 100 mM CaCl2 (b) PA with HCl gel formed with 10 mM PA and
100 mM HCl (scale bar 1µm). Transmission electron micrographs of (c) PA
with CaCl2 gel and (d) PA with HCl gel. AFM topography micrographs of (e)
PA with CaCl2 gel and (f) PA with HCl gel.
23
3.3 Circular Dichroism Spectra of Peptide Amphiphiles at Room
Temperature
The effect of peptide secondary structure on the self-assembly process
was studied by circular dichroism (CD) spectroscopy. Previous studies
demonstrated that the cylindrical micelles formed by PA molecules contain
β-sheets and that amino acids which are closer to the hydrophobic tail are
considered to be critical for β-sheet secondary structure [7]. The effect of the
self-assembly process on the secondary structure was studied with CD
spectroscopy. The CD experiments were carried out at room temperature and
at variable temperatures. Three different formulations were studied; PA at pH
7, PA with CaCl2 and PA with HCl. The PA at pH 7 was analyzed to
determine whether the PA molecules self-assemble into defined secondary
structures without any charge screening. The PA with HCl sample was
studied in order to see the effect of pH change on the secondary structure
formation of the PA nanofibers. The PA with CaCl2 formulation was studied
to observe the effect of electrolyte addition without any pH change on
secondary structure.
In CD spectra, the spectrum for random coil displays a small positive
peak at approximately 230 nm and a large single peak at approximately 195 nm
whereas β-sheet displays a negative band approximately at 220 nm and a
positive band at 195 nm. Figure 6a shows the CD spectra of the PA at pH 7, PA
with CaCl2 and PA with HCl samples. The CD studies revealed that both self-
assembly mechanisms, either through pH change or electrolyte addition, resulted
in predominantly β-sheet signals. However, the PA solution at pH 7 revealed
24
random coil signal. These results show that the PA molecules do not self-
assemble into defined secondary structures at physiological pH without charge
screening (CaCl2) or charge neutralization (HCl). Addition of a divalent cation,
Ca2+
or lowering the pH causes charge screening (Ca2+
) and charge
neutralization (H+) of these molecules. Charge screening and neutralization of
PA molecules eliminate the repulsive forces and enable formation of hydrogen
bonding networks. Formation of hydrogen bonding networks together with
hydrophobic collapse of alkyl tail leads to formation of self-assembled
structures [28]. Charge screening (Ca2+
) and charge neutralization (H+) of the
PA molecules have been studied by measuring the zeta potential of the three
formulations (Figure 7a). The PA molecules at pH 7 were neutralized by
addition of CaCl2 (1:5 molar ratio) or adjusting pH to 2. pH dependent charge
neutralization of PA molecules is shown in Figure 7b. The CD and zeta potential
data suggest that neutralization of the PA molecules leads to aggregation of
these molecules and formation of β-sheet secondary structure. Thus,
neutralization of charges enables PA molecules to self-assemble into defined
nanostructures. Addition of EDTA to the PA with CaCl2 sample destroyed the β-
sheet assembly and resulted in random coil signals in CD spectrum due to the
removal of Ca2+
ions from the solution (Figure 8). Charge screening (Ca2+
) and
charge neutralization (H+) is mainly brought about by dynamic interactions
which can be reversed by isolation of neutralizers from the environment.
25
Figure 6.Circular dichroism spectra of the PA (a) at pH 7, PA at pH 2 and PA
with CaCl2 at room temperature. Circular dichroism spectra of (b) PA with
CaCl2 (1:5 molar ratio), (c) PA with HCl (pH 2) between 25 ºC and 90 ºC. (d)
Ellipticity at 221 nm for PA with CaCl2 (1:5 molar ratio) and PA with HCl (pH
2) monitored between 25 ºC and 90 ºC.
26
Figure 7. (a)Zeta potential graph of the PA at pH 7, pH 2 and pH 7 with CaCl2,
(b) zeta potential change with pH.
27
Figure 8. The PA with CaCl2, addition of EDTA disturbs β-sheet structure
immediately, after 6 h random coil becomes the most predominant secondary
structure.
28
3.4 Fourier Transform Infrared Spectroscopy of Peptide Amphiphiles
FT-IR spectroscopy was also used for the analysis of the three
formulations (pH 7, pH 2 and pH 7 with calcium ions) used in the CD
experiments. FT-IR spectra for all three formulations exhibit an amide I peak at
1633 cm-1
which is typical for β-sheets [29] (Figure 9). Although a β-sheet
signal is expected from samples of pH 2 and pH 7 with calcium ions, the pH 7
sample also exhibited β-sheet. It is likely that β-sheet signal observed in pH 7
sample is due to the stacking and close packing of the PA molecules during
lyophilization process. These results suggest that both FT-IR and CD
experiments reveal consistent results, indicating effect of pH screening and
addition of divalent cations on secondary structure of the PA molecules.
29
Figure 9. FTIR spectra of lyophilized PA with CaCl2, PA with HCl, PA
at pH 7.
30
3.5 Circular Dichroism Spectra of Peptide Amphiphiles at Variable
Temperatures
Variable temperature CD studies enabled monitoring of the thermal
denaturation of the β-sheet secondary structure triggered by CaCl2 addition or
lowering the pH. At 25 ˚C, characteristic β-sheet traces with negative bands at
about 220 nm and positive bands around 202 nm were observed for CaCl2 and
pH 2 samples. The β-sheet signals gradually diminished while heating from 25
˚C to 90 ˚C indicating denaturation of peptide assemblies formed by β-sheet
composed of hydrogen bonding, Figure 6b and Figure 6c. Both CaCl2 and pH 2
samples exhibited similar melting profiles with melting temperatures at around
60-65 ˚C (Figure 6d). At pH 3.6 and in the presence of 1.43 molar equivalent of
CaCl2, the CD spectra at room temperature possess red shifted bands and strong
signals at π-π* transition region (Figure 10a, Figure 10b) which may
additionally indicate β-sheets existing in twisted conformation rather than planar
in these samples [30]. At pH 3.6, the PA molecules are partially neutralized for
charges (Figure 11). At this particular pH and CaCl2 concentration full charge
screening does not occur and so electrostatic interactions may be fomenting PAs
to become assembled in twisted β-sheet conformation.
31
Figure 10. Circular Dichroism spectra of (a) PA with CaCl2 (1:1.43 molar ratio),
(b) PA with acetate buffer (pH 3.6) between 25 ºC and 90 ºC. (c) Ellipticity at
221 nm for PA with CaCl2 (1:1.43 molar ratio) and PA with acetate buffer (pH
3.6) monitored between 25 ºC and 90 ºC.
32
Figure 11. pH titration of the PA solution.
33
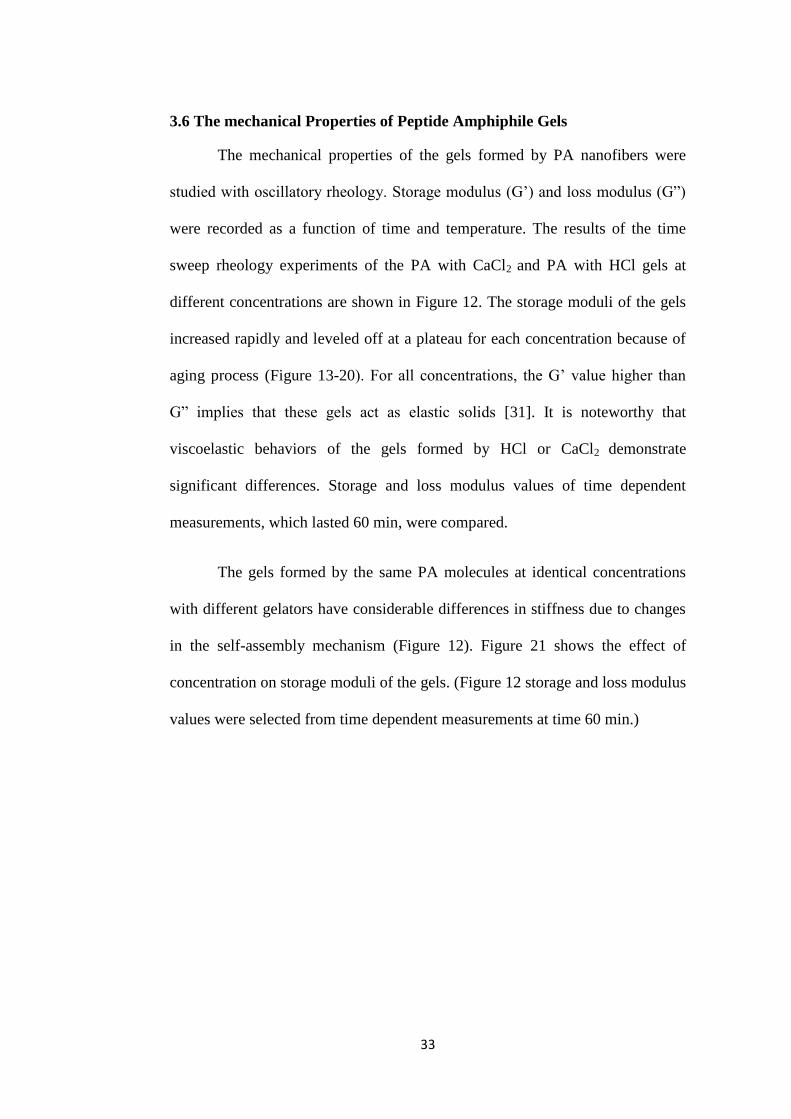
3.6 The mechanical Properties of Peptide Amphiphile Gels
The mechanical properties of the gels formed by PA nanofibers were
studied with oscillatory rheology. Storage modulus (G’) and loss modulus (G”)
were recorded as a function of time and temperature. The results of the time
sweep rheology experiments of the PA with CaCl2 and PA with HCl gels at
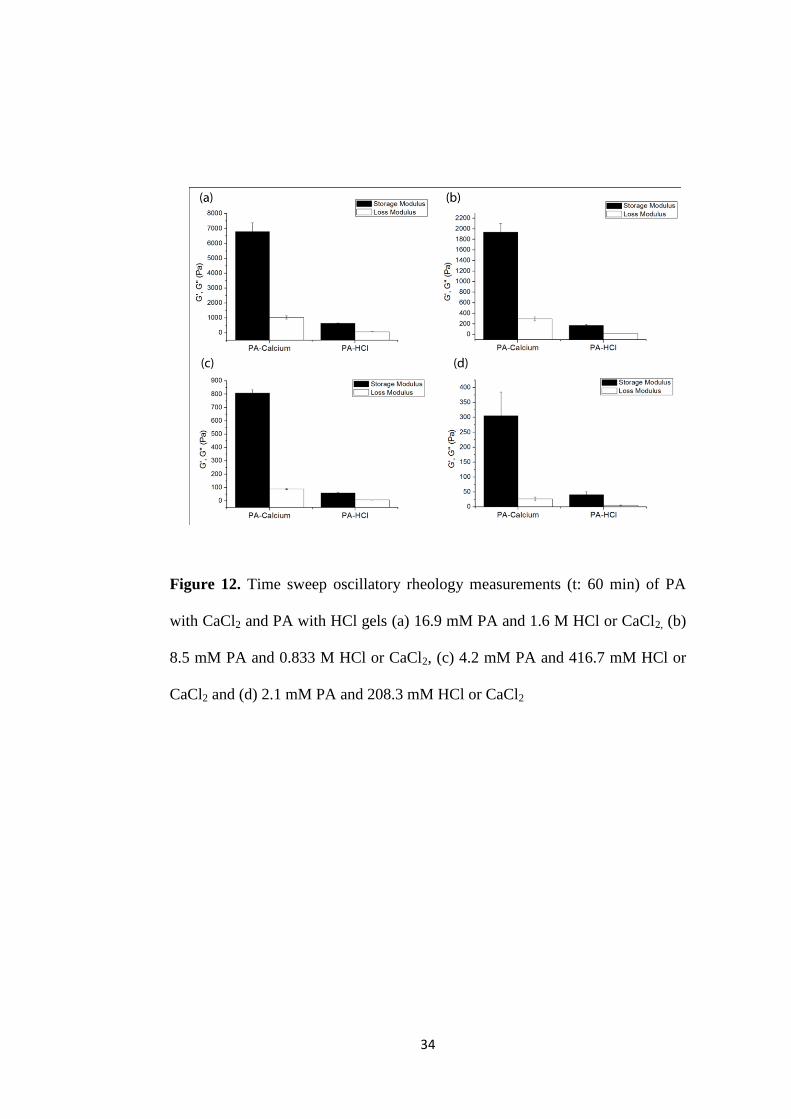
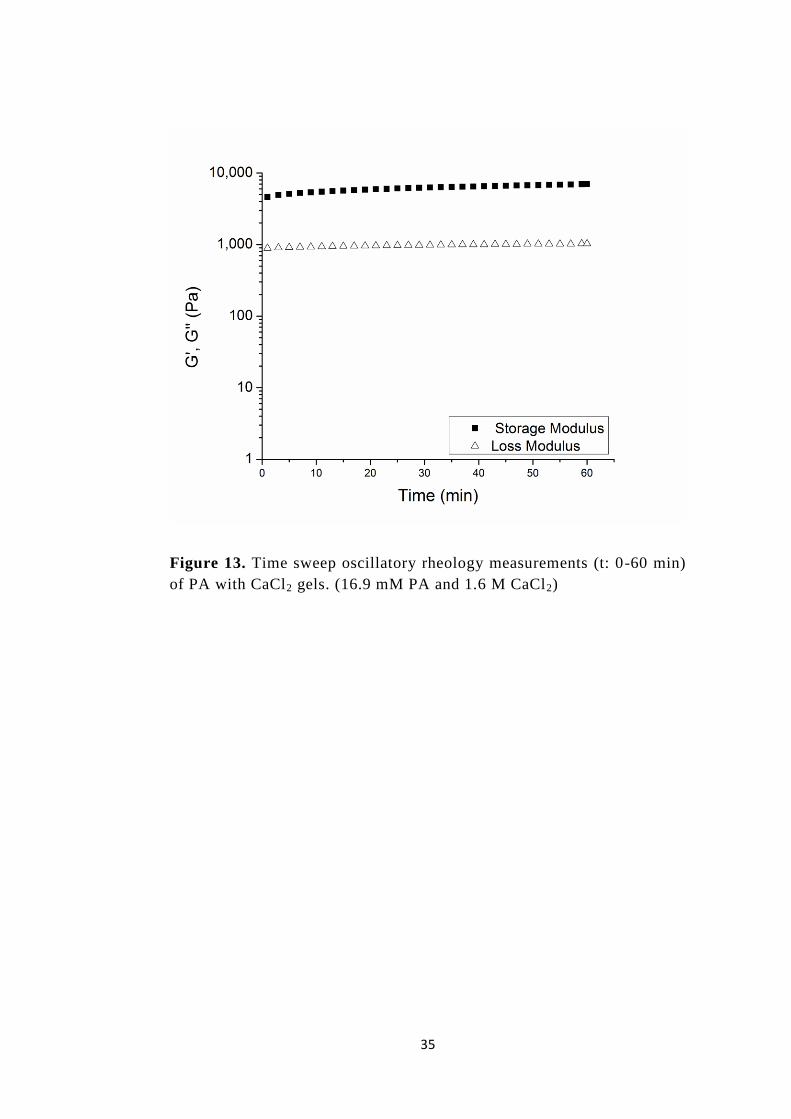
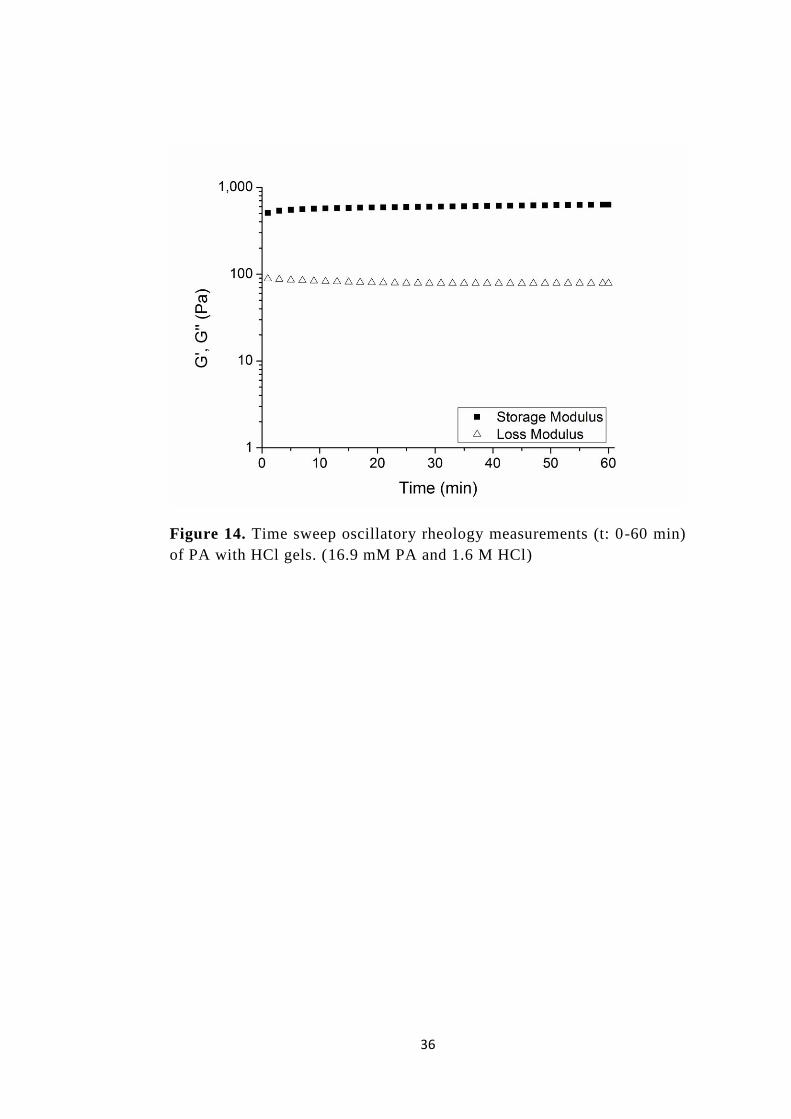
different concentrations are shown in Figure 12. The storage moduli of the gels
increased rapidly and leveled off at a plateau for each concentration because of
aging process (Figure 13-20). For all concentrations, the G’ value higher than
G” implies that these gels act as elastic solids [31]. It is noteworthy that
viscoelastic behaviors of the gels formed by HCl or CaCl2 demonstrate
significant differences. Storage and loss modulus values of time dependent
measurements, which lasted 60 min, were compared.
The gels formed by the same PA molecules at identical concentrations
with different gelators have considerable differences in stiffness due to changes
in the self-assembly mechanism (Figure 12). Figure 21 shows the effect of
concentration on storage moduli of the gels. (Figure 12 storage and loss modulus
values were selected from time dependent measurements at time 60 min.)
34
Figure 12. Time sweep oscillatory rheology measurements (t: 60 min) of PA
with CaCl2 and PA with HCl gels (a) 16.9 mM PA and 1.6 M HCl or CaCl2, (b)
8.5 mM PA and 0.833 M HCl or CaCl2, (c) 4.2 mM PA and 416.7 mM HCl or
CaCl2 and (d) 2.1 mM PA and 208.3 mM HCl or CaCl2
35
Figure 13. Time sweep oscillatory rheology measurements (t: 0-60 min)
of PA with CaCl2 gels. (16.9 mM PA and 1.6 M CaCl2)
36
Figure 14. Time sweep oscillatory rheology measurements (t: 0-60 min)
of PA with HCl gels. (16.9 mM PA and 1.6 M HCl)
37
Figure 15. Time sweep oscillatory rheology measurements (t: 0-60 min)
of PA with CaCl2 gels. (8.5 mM PA and 0.833 M CaCl2)
38
Figure 16. Time sweep oscillatory rheology measurements (t: 0-60 min)
of PA with HCl gels. (8.5 mM PA and 0.833 M HCl)
39
Figure 17. Time sweep oscillatory rheology measurements (t: 0-60 min)
of PA with CaCl2 gels. (4.2 mM PA and 416.7 mM CaCl2)
40
Figure 18. Time sweep oscillatory rheology measurements (t: 0-60 min)
of PA with HCl gels. (4.2 mM PA and 416.7 mM HCl)
41
Figure 19. Time sweep oscillatory rheology measurements (t: 60 min) of
PA with CaCl2 gels. (2.1 mM PA and 208.3 mM CaCl2)
42
Figure 20. Time sweep oscillatory rheology measurements (t: 60 min) of
PA with HCl gels. (2.1 mM PA and 208.3 mM HCl).
43
Figure 21. Macroscopic rheological study of the gels prepared with calcium and
HCl shows that both gels scale with a 3/2 exponent on concentration, calcium
gels being typically an order of magnitude stronger at the same concentration.
44
Temperature dependent oscillatory rheology was performed in order to
investigate the variations in the behavior of PA gels with respect to temperature
change for different gelation mechanisms (Figure 22). These PA gels respond in
significantly different ways to an increase in temperature. The PA with HCl
gels started to lose their mechanical properties at 30-40 °C whereas the PA with
CaCl2 gels started to denature at around 60-70 °C. The stability of the PA with
CaCl2 gels might be due to calcium bridging resulting in interfiber interactions
and covering the PA fibers with calcium ions. It is widely known that
metalloproteins have increased stability against temperature and this effect is
observed in hot spring bacteria, proteins of which are not denatured at high
temperatures [32-33]. However, the PA with HCl gels cannot withstand high
temperatures. There are considerable differences for starting point and ending
point values of both storage and loss moduli between time and temperature
dependent experiments because of the differences in experimental set up and
time interval of data points.
In the CD spectra, the denaturation profiles due to temperature increase
were similar for cation triggered and pH triggered PA assemblies. However,
different thermo-mechanical responses were observed for PAs gelled with CaCl2
or HCl with temperature dependent oscillatory rheology. It should be noted that
the gels used had concentrations at mM scale in the rheology studies whereas at
the scale of 10-150 µM in the CD measurements. Thus, melting curves obtained
with CD are more likely to be a reflection of the breaking of hydrogen bonds
within assemblies, as a result of the nature of intrafibrillar attractions. On the

45
other hand, the responses observed with oscillatory rheology are related to the
three-dimensional network mechanics in which interfibrillar attractions are more
prominent than intrafibrillar bondings.
46
Figure 22. Temperature dependent oscillatory rheology of (a) PA with CaCl2
gels (b) PA with HCl gels (Strain: 0.5%, Frequency: 10 rad/s). Dashed lines
show data corrected for aging and time dependent stiffening of the gels.
47
Conclusion
In this chapter we studied the elasticity of supramolecular peptide
amphiphile nanofiber gels. Macroscopic (rheological) measurements yielded
significantly differing elastic moduli for gels prepared using calcium or HCl as
the gelation agent. Circular dichroism measurements suggest that intrafiber
bonds begin to disintegrate above 60 ºC for both calcium and HCl gels.
However, gel elasticity displays different temperature dependence for the two
different gels. These observations suggest that the model describing gel stiffness
must contain effects other than those affecting single fiber elasticity. Based on
these results, we point out that the discrepancy in gel stiffness for the calcium
and HCl gels may arise from the difference of strength of interfiber bonds.
48
CHAPTER 2
Bioactive Peptide Nanofibers Promote Regeneration of Corneal Stroma
49
Introduction
Corneal opacification due to various reasons (trauma/diseases) resulting
in vision loss, affects 10 million people in the world and it is generally treated
by cornea transplantation [34-35]. However, organ donation is not favored in
many cultures, the preservation of the donated tissue is problematic and the
donated corneas may not be transplanted due to pathogen transmission risk and
laser vision corrective surgery which makes cornea useless for transplantation.
Even though, cornea is one of the easiest and highly successfully transplanted
organs, it results in immunological rejection with 18% failure rate in endothelial
layer breakdown cases [36]. Thus, donor shortage and the incidence of immune
rejection address the need for bioengineered corneas produced with regenerative
medicine approach. Additionally, for the need of cornea transplantation, the
bioengineered corneas can answer the need for toxicology and drug therapy
studies on cornea.
1.1 Cornea Structure
Cornea is a clear, dome shaped, highly innervated, avascular and
immune privileged tissue that shields anterior part of eye from external effects
[37]. Cornea is constituted of three major layers; the outermost epithelium layer,
stroma and innermost endothelium layer [37-39]. Stroma is the thickest part of
the cornea and formed by quiescent corneal fibroblasts -keratocytes-, which are
sandwiched between collagen lamellae [40]. Bowman’s membrane is positioned
between epithelial layer and stroma, and Descemet’s membrane separates
stroma from endothelium. A healthy cornea has three priority tasks; protection
of eye from the outside, being transparent for light transmission and refraction
50
of light for image formation. Each layer of cornea has important roles for
performing these functions, which are explained in more detail below.
1.1.1 Epithelial Layer
Epithelial layer is the outermost layer of cornea that is formed by
stratified, non-keratinizing squamous epithelial cells. The smooth surface of
cornea has prime importance in refractive power. Tear film over epithelial layer
forms a wet surface over cornea that smoothens the surface and nourishes the
epithelial cells [41] . In addition to these, tear film protects the cornea by
including proteolytic enzymes and lysozyme from bacteria, supplies oxygen to
epithelial cells [42] and contains growth factors like EGF and supports re-
epithelization of cornea [43-45]. Epithelium consists of 5-7 layers of cells and
contains mainly three cell types. The surface of the epithelium is formed by
squamous epithelial cells that have tight junctions between them and this layer
acts as a protective barrier against foreign materials. Daughter and wing cells are
positioned in the middle layer of epithelia. Bowman’s membrane is an acellular
layer beneath stratum germinatum and mainly consists of several types of
collagen [46-47], laminin hemidesmosomes and anchoring fibrils.
The epithelial cell population in cornea is supported by stem cells that
are positioned in limbal site in the eye [48]. In addition to acting as a protective
barrier against foreign molecules, epithelial layer also has a role in water
balance maintenance in cornea. The nerve endings in epithelium provide
sensitivity to cornea. Besides these features, epithelial layer forms a smooth
51
surface that enables passage of oxygen and nutrients from tear and distributes to
cells in cornea.
1.1.2 Stroma
Stroma is thickest part of cornea (500 µm thick), which constitutes
mainly type I and V collagen fibers that are organized in parallel bundles called
lamellae [49]. The uniform spacing between collagen fibers and their parallel
organization in stroma are thought to role in corneal transparency and better
light transmission. Each lamella is tangentially stacked to the surface of cornea
and perpendicular -in terms of collagen fibril direction- to each other and
contains mesenchymal-originated, quiescent fibroblast cells, –the keratocytes -,
between them [40].
Keratocytes have slow turnover rate [50]. They stay in G0 phase instead
of terminally differentiating and get into two different paths in case of injury;
they either enter to apoptotic or repair phases [51]. When they enter to repair
phase, they either form a scar tissue in the wound area or they start to proliferate
[49]. In case of cornea injury, epithelial cells secrete IL-1a which leads to cell
death in upper layer of stroma [52] and induces proliferation of other
keratocytes. TGF-β is known to activate myofibroblast transformation of
keratocytes. [53] Secretion of TGFβ2 from epithelial cells due to loss of
basement membrane causes transformation of keratocytes into myofibroblasts
[54]. Myofibroblasts secrete ECM in wound area and when TGFβ2 secretion
halts, they lose their myofibroblast phenotype.
52
ECM and stroma interaction forms the key in cell based regenerative
medicine approach for corneal tissue engineering. Stroma consists of acellular
extracellular matrix environment formed by parallel aligned collagen fibers,
proteoglycan (PG) core proteins [55], glycosaminoglycans (GAGs) like keratin
sulfate and dermatan sulfate [56] and other well known proteins, laminin and
fibronectin. Lumican [57], keratocan [58-59] and mimecan [60] are the main
proteoglycan core proteins and generally have attached keratin sulfate side
chains. It is a known fact that the composition of ECM has a crucial role in
water content [61] and collagen diameter [62-63] and arrangement [64-65] in
cornea. Uniform spacing of collagen fibers have important roles in cornea’s
refractive power. Together with collagen arrangement, cytoplasmic crystallin
proteins have important roles in transmission of light [66] and refractive index
match. In addition to these, stroma is also responsible for the mechanical
properties of cornea [67].
1.1.3 Endothelial Layer
Cornea endothelium is a monolayer formed by ~ 400,000 hexagonal
endothelial cells that have ability of transportation. Endothelial layer has
transporting activity and has an important role in cornea transparency by acting
as a pump [68-69]. A fully functional endothelium pumps out water that imbibes
through into stroma. If endothelium cannot perfom its function, cornea swells,
loses its transparency, becomes hazy and thus loses function. Due this feature of
endothelium, it has a vital position in tissue engineering of cornea.
53
In addition to the “pump” function of endothelium, co-culturing
epithelium and endothelium has demonstrated that it affects epithelium’s
structure and activities [70-71]. In contradistinction to rabbit and pig endothelia,
human endothelium does not proliferate in vivo, and culturing of these cells is
rather difficult with respect to epithelial and stromal cells. Thus, cell loss in
endothelial layer is compensated by spreading of the remaining cells. Although
these cells are quiescent, they have not lost their replicative feature being
arrested in G1 phase of cell cycle [72-73] and can be cultured on human stroma
or other culturing methods [74-76].
1.2 Fully Synthetic Replacements
The synthetic replacements for cornea, known as “keratoprostheses”, are
artificial corneas that contain an optically clear center for functionality which is
surrounded by a porous skirt that enables the attachment of the prostheses to
cornea. They are mostly made of plastics and rather than aiming regeneration of
cornea, they aim improvement in the function of cornea. Keratoprosthesis has
been used for more than a century and there are commercially available
keratoprostheses. However, the most promising keratoprostheses, which has
achieved clinical success [77-78], AlphaCorTM
has been reported to cause
progressive stroma melting and epithelial defects [79]. Although they are
sufficient for visual correction of cornea and enable cornea to regain function,
they are problematic in integration to host tissue and cause necrosis in eye. For
this reason several researchers have tried to produce biocompatible skirts,
utilizing biologically derived materials used for skirts and developed osteo-
odontoprosthesis [80]. The optically clear part of the prostheses was placed
54
inside of a tooth; however, it had several complications like vascularization,
abscess formation and extrusion. Researchers have developed other
keratoprostheses with better features [81-83], however they still have limits and
problems and keratoprostheses are usually suggested for patients with severe
chemical burns, ocular pemphigoid, Stevens-Johnson syndrome or graft
rejections [84]. For all these reasons, efficient corneal tissue engineering studies
are needed for generation of healthy cornea.
1.3 Corneal Tissue Engineering Applications
Until now, many different approaches have been tried on construction of
fully functional corneal equivalents; however, none has succeeded in the proper
sense. These approaches has been classified under four titles as; classical tissue
engineering, developmental tissue engineering, de novo tissue engineering and
hybrid tissue engineering [85]. Classical tissue engineering aproach depends on
the seeding of fibroblast cells into biodegradable matrices followed by
remodelling in vitro or in vivo. Developmental tissue engineering is stimulation
of fibroblast/ic cells to produce corneal stroma like structure in vitro prior to the
implantation. De novo tissue engineering is the design and assembly of the
ultrastructure of corneal stroma in which corneal fibroblasts can be seeded and
hybrid tissue engineering approach is a combination of these methods.
Most of the tissue engineering studies aiming corneal stroma
regeneration are based on the classical approach that uses a biodegradable
scaffold which will enable the adhesion and proliferation of corneal cells. The
main barrier for corneal tissue engineering lies in mimicking or producing the
55
well-organized structure of stroma. The first promising corneal tissue
engineering study in which collagen based scaffolds were used, was done by
Griffith et al in 1999. They have used a collagen-chondrotin sulfate substrate
that is cross-linked with gluteraldehyde. Immortalized human corneal cell lines;
epithelial, stromal and endothelial cells were seeded on top, middle and bottom
layer of the substrate respectively and grown in cell culture media. The cultured
corneal equivalents were evaluated for their transparency, histology and
morphology. Engineered corneas were transparent and have responded similarly
to human corneas to injuries by means of gene expression and optical clarity.
Although the corneal equivalent had similar properties to human cornea, it was
not sufficient for cornea replacement.
The mechanical properties of stroma and stroma analog “scaffolds” are
vital for tissue engineering of cornea. Synthetic polymer-collagen scaffolds have
been used in an effort to increase mechanical strength of scaffolds. The synthetic
material is expected to deal with mechanical requirements that provide
mechanical sufficiency and collagen part provides biocompatibility and
biofunctionality to the scaffold. For this purpose, in 2003, Li et al used a
collagen-copolymer scaffold, in which copolymer enables proteins and peptides
to cross-link. In this study, YIGSR peptide sequence was used for providing
bioactivity. YIGSR is a motif of laminin responsible for adhesion and has been
proven to improve epithelial cell growth [86] and neurite extension [87].
Although these scaffolds were reported to be weaker than human cornea, they
were strong enough for surgical procedures like suturing [88]. The nerve re-
growth and touch sensitivity has been reported to occur in a relatively shorter
56
time in cornea grafts with the composite material than the allografts. This study
demonstrated the importance of utilizing scaffolds that contain different
materials having distinct properties together with co-usage of synthetic polymers
and natural materials like collagen.
1.4 Corneal Tissue Engineering with Peptide Amphiphiles
Peptide amphiphiles (PA) are self-assembling molecules that are
composed of a hydrophobic alkyl tail and a peptide segment. PA molecules tend
to self assemble into nanofibers through intermolecular hydrogen bonding [1].
The interactions between these nanofibers induce formation of a three
dimensional network that encapsulates water in aqueous environment forming
gels, which can mimic extracellular matrix. PA based nanofiber networks are
promising biomaterials for tissue engineering applications due to their flexibility
in terms of physical, chemical and biological features. Bioactive PA gels have
been used for a number of different applications like cartilage [89], bone [90],
neural regeneration [13] and angiogenesis [91] as a synthetic extracellular
matrix mimicking agent.
In this study, we utilized PA molecules in order to increase stroma
thickness through tissue regeneration. The PA molecules were designed to have
a hydrophobic alkyl chain and a β-sheet forming amino acid sequence, both of
which were used to induce nanofiber formation through self-assembly, and a
bioactive peptide sequence that contained laminin derived [86, 92] “YIGSR”
peptide sequence which is known to play a role in cell adhesion [93] and
migration [94]. The chemical and physical characterization of PA gelswere

57
investigated with rheology, circular dichroism, scanning electron microscopy,
transmission electron microscopy and atomic force microscopy. The
biocompatibility and bioactivity of PA hydrogels were tested on human corneal
fibroblast (HTK) cells.
58
Materials and Methods
2.1 General Methods
The identity and purity of the PAs were assessed by LC-MS (Agilent
1200/6530) equipped with either Agilent Zorbax Extend-C18 2.1 x 50 mm
column for basic conditions or Zorbax SB-C8 4.6 mm x 100 mm column for
acidic conditions. Agilent preparative reverse-phase HPLC system equipped
with Zorbax Extend-C18 21.2 x 150 mm column was used for basic conditions
and Zorbax SB-C8 21.2 × 150 mm column was used for acidic conditions for
the purification of peptides. A gradient of (a) water (0.1% formic acid (for acidic
conditions) or 0.1% NH4OH (for basic conditions)) and (b) acetonitrile (0.1%
formic acid (for acidic conditions) or 0.1% NH4OH (for basic conditions)) was
used.
2.2 Materials
9-Fluorenylmethoxycarbonyl (Fmoc) protected amino acids, lauric acid,
[4-[α-(2’,4’-dimethoxyphenyl) Fmoc-amino methyl] phenoxy]
acetomidonorleucyl- MBHA resin (Rink amide MBHA resin), 2-(1H-
Benzotriazol-1-yl)-1,1,3,3-tetramethyluronium hexafluorophosphate (HBTU),
and diisopropylethylamine (DIEA) were purchased from Merck and ABCR.
100-200 mesh Wang resin was purchased from NovaBiochem and valine was
loaded onto it for Fmoc-Val-Wang resin. All other chemicals and materials used
in this study were analytical grade and obtained from Invitrogen, Fisher, Merck,
Alfa Aesar, and Sigma-Aldrich.
59
2.3 Synthesis and Purification of Peptide Amphiphile Molecules
Peptide amphiphile (PA) molecules were synthesized by using
fluorenylmethoxycarbonyl (Fmoc) chemistry. Synthesis was performed
manually on a 1 mmole scale using a 50 ml peptide synthesis vessel on a wrist
action shaker. Either Fmoc-Glu-(OtBu)-Wang resin or Rink amide MBHA resin
was used for peptide synthesis. For each coupling reaction, Fmoc groups were
removed by shaking resins in 20% piperidine in N,N-dimethylformamide
(DMF) for 20 min. After each reaction, resins were washed three times with
DMF, dichloromethane (DCM) and DMF respectively. All amino acids were
activated by adding 2 molar equivalents of amino acid to 1.95 equivalents of O-
Benzotriazole-N,N,N’,N’-tetramethyl-uronium-hexafluoro-phosphate (HBTU)
and dissolved in 10 ml of DMF. After complete dissolution of amino acid and
HBTU in DMF, 3 molar equivalents of N-ethyl-diisopropylamine (DIEA) were
added into the solution. The solution was mixed thoroughly and kept for 3 min
before adding to the resin. Each coupling reaction was performed for 2.5 h.
Lauric acid was coupled to the peptide’s N-terminal. Ninhydrin test was
performed after addition of each amino acid and after addition of the lauric acid.
When ninhydrin test yielded positive results, coupling reaction was repeated;
otherwise 10 ml of 10% acetic anhydride in DMF was added and resins were
shaken for 30 min. Peptide cleavage and removal of the protecting groups were
performed with 95:2.5:2.5 trifluoroacetic acid (TFA): triisopropylsilane (TIS):
water for 2.5 h at room temperature. After cleavage reaction, PA molecules were
collected in a clean round bottom flask and DCM wash was performed for
several times. Collected solution was rotary-evaporated. After evaporation, ice-
60
cold diethyl ether was added and was left at -20 °C overnight. PA-diethyl ether
mixture was collected in 50 ml falcon tubes and centrifuged at 8000 rpm for 25
min. Supernatant was decanted and the remaining diethyl ether was evaporated.
The pellet was dissolved in deionized H2O at a resistance of 18.2 Ω and was
freeze-dried.
2.4 Oscillatory Rheology
Rheology measurements were performed with an Anton Paar Physica
RM301 Rheometer operating with a 25 mm parallel plate at a 0.5 mm gap
distance. Freeze-dried YIGSR-PA molecules and CS were dissolved in 270 mM
isotonic sucrose solution and the pH was adjusted to ~7 with 0.1 M NaOH
solution for the in vivo experiment model. 200 µl of 2.5 (w/v) % YIGSR-PA
was mixed with 50 µl of 3 (w/v) % CS. For the in vitro experiment model,
lyophilized YIGSR-PA, Lys-PA and Glu-PA molecules were dissolved in
deionized water and pH was adjusted to ~7 with 0.1 M NaOH solution. 166 µl
of 2 wt % YIGSR-PA was mixed with 84 µl of 2 wt % Glu-PA. 166 µl of 2 wt
% Lys-PA was mixed with 84 µl of 2 wt % Glu-PA. The gel was prepared on
the lower plate of the rheometer and gelling agents were added dropwise in
order to prevent any deformation of the gel structure. The stage temperature was
adjusted to 25 °C and all samples were allowed to equilibrate for 15 min to
achieve stable gel formation before the measurements were taken. Wet tissue
paper was placed inside the chamber around the edge of the plate to provide a
humid environment and prevent solvent evaporation from the sample during the
experiments. Measurements were taken for 60 min at 10 rad/s and 0.5% strain.
61
2.5 Circular Dichroism (CD)
CD spectra of the PA solutions were obtained using a J-815 Jasco
spectrophotometer in the far UV region using quartz cuvettes with 1 mm path
length. The spectra were acquired for three formulations; YIGSR-PA at pH 7,
YIGSR-PA mixed with CS and YIGSR-PA mixed with Glu-PA. PA molecules
(YIGSR-PA, and Glu-PA) and CS were dissolved in deionized water at 0.01 wt
% and 0.012 wt % respectively. pH of each solution was adjusted to 7 before
use. YIGSR-PA/Glu-PA solution was mixed at 2:1 volume ratio and YIGSR-
PA/CS solutions were mixed at 4:1 volume ratio. Averages of three scans of
each sample were taken. CD spectra were obtained from 190 nm to 300 nm at a
digital integration time of 1 s, a band width of 1 nm and a data pitch of 0.1 nm.
2.6 Scanning Electron Microscopy (SEM)
The nanofiber network formation ability of YIGSR-PA at different
conditions was observed with scanning electron microscopy (SEM). 2.5 wt %
YIGSR-PA solution was prepared in isotonic sucrose solution (270 mM). In
order to form YIGSR-PA/CS gel, 20 µL of PA solution was mixed with 5 µL of
aqueous 3 wt % CS (Sigma- Aldrich C6737) solution. For YIGSR-PA/E-PA
gels, 20 µL of 2.5 wt % YIGSR-PA solution was mixed with 10 µL of 2.5 wt %
E-OH PA. For Lys-PA/E-PA gels, 20 µL of 2.5 wt % Lys-PA solution was
mixed with 10 µL of 2.5 wt % E-OH PA. The mixing ratio was adjusted to
screen the charges on the positively charged YIGSR-PA molecules at
phsiological conditions. Gels were incubated for 10 min for maturation and
dehydrated gradually with increasing concentrations of ethanol. Ethanol was
then removed by critical point drying (Tousimis, Autosamdri-815B). The
62
samples were sputter-coated twice with 3 nm of Au/Pd to ensure complete
coating. Visualization of the nanofiber networks was carried out with an FEI
Quanta 200 FEG scanning electron microscope with ETD detector with high
vacuum between 10-30 kV and an average working distance of 10 mm.
2.7 Atomic Force Microscopy (AFM)
AFM samples were prepared on 1 cm2 silicon wafers (with low residual
roughness (<1 nm/µm2)) using 30 µl of 0.01 wt % PA solutions. 40 µl of 0.01
wt % YIGSR-PA was mixed with 10 µl of 0.012 wt % chondroitin sulfate. 65 µl
of 0.01 wt % YIGSR-PA was mixed with 35 µl of 0.01 wt % Glu-PA. 30 µl of
0.01 wt % Lys-PA was mixed with 15 µl of 0.01 wt % Glu-PA. Samples were
drop casted on silicon wafers and left for air drying in a chemical fume hood.
Dynamic mode imaging was used to image the topography of the resulting
samples, using appropriate cantilevers (cantilever stiffness of k=3-40 N/m,
resonance frequency of f0=70-350 KHz for the dynamic mode).
2.8 Cell Culture and Maintenance
The viability, adhesion and proliferation profiles of cells on YIGSR-PA
nanofibers were studied using human corneal keratocytes (HTKs) previously
developed by Jester et al. [95]. HTKs were cultured in 75 cm2 polystyrene cell
culture flasks with Dulbecco’s modified eagle serum (DMEM) containing 10%
Fetal Bovine Serum (FBS) and 1% Penicillin/Streptomycin. HTKs are known to
express myofibroblast markers in media with 10% FBS and keratocyte markers
in serum free media [95]. In case of corneal wounding, keratocytes differentiate
into myofibroblasts. In order to simulate the environment of the in vivo
63
experiment, where corneas were wounded by opening corneal pockets, HTKs
were cultured at 10% FBS. All of the in vitro experiments and passaging of cells
were performed when cells became ~80% confluent. Cells were diluted 1:3 for
splitting.
2.9 In vitro Application of Peptide Amphiphile Molecules
Three experimental groups have been designed to assess the
biocompatibility and bioactivity of YIGSR-PA on HTK cells; a) collagen, the
main component of ECM was used as a positive control, b) YIGSR-PA was
mixed with Glu-PA (Figure 1) and c) non-coated tissue culture plate was used as
negative control. For each experiment, 0.2 wt % YIGSR-PA and Glu-PA was
mixed with 1.85:1 volume ratio and 0.01 wt % collagen solution was used.
Experiments were performed in 96-well plates containing 100 µl of total PA
solution and 35 µl collagen solution. For 24-well plates, 600 µl of total PA
solution and 210 µl collagen solution were used. Coated plates were incubated
at 37 °C for 45 min and water evaporated within laminar flow hood overnight.
After complete drying of collagen and PA coated wells, plates were UV-
sterilized before culturing HTKs. 2 x 10⁴
and 3 x 10³
HTKs were seeded into
each well of 24-well plates and 96-well plates, respectively. PA and collagen
coatings were performed on glass coverslips placed within wells of 24-well
plates.
2.10 Biocompatibility assesment by using viability assays
Live/Dead Assay was used for determination of the effect of YIGSR-PA
on viability of HTKs. 3 x 10³
cells were seeded in each well (n=5) of 96-well
64
plates and cultured for 3 days. At the end of incubation time, medium was
aspirated and cells were washed with PBS, and stained with 100 µL of 2 µM
Calcein AM and 4 µM ethidium homodimer-1 solution. After 45 min of
incubation at room temperature, the quantification of cytotoxicity was
determined by calculating the ratio of live cells to total cells by using a
flourescence microscope.
2.11 Cell adhesion assays for cell-material interaction analysis
Adhesion of HTKs seeded on PA coated, collagen coated and bare glass was
assessed by staining filamentous actins and nuclei with TRITC-conjugated
phalloidin and TO-PRO®-3 iodide, respectively. After preparation of PA and
collagen coated wells within 24-well plates, 2 x 10⁴ HTKs were seeded in each
well and incubated for 24 h. At the end of incubation time, cells were fixed with
4% paraformaldehyde and permeabilized with 0.1% Triton-X 100. Following
PBS wash, TRITC-conjugated phalloidin staining and TO-PRO®-3 iodide
staining were performed. Cells were kept in PBS for 45-60 min before
observation under Zeiss LSM 510 confocal microscope.
The HTK and surface interaction at micro scale was assessed by electron
microscopy. HTKs cultured on PA or collagen coated and bare glass surfaces
were incubated for 24 h. 2.5% gluteraldehyde fixation was followed by 1%
OsO4 fixation after which water content was removed by incubation in gradual
increases of ethanol. Samples within 100% ethanol were critical point dried with
Tourismis Autosamdri®-815B critical-point-drier. Dried samples were coated
65
with 4 nm Au/Pd and observed under high vacuum mode with FEI Quanta 200
FEG scanning electron microscope equipped with ETD detector.
2.12 Cell proliferation assays
The proliferation capacity of corneal fibroblasts was assessed with 5-
bromodeoxyuridine (BrdU) incorporation. Corneal fibroblasts were cultured in
96-well plates (n=5) on uncoated, YIGSR-PA coated and collagen coated
surfaces for 72 hr. At 54 hr, BrdU labelling solution was added to cells at a final
concentration of 10 µM and incubated for 18 hr. Cell culture medium was
tapped off and 200 µl/well of FixDenat solution was added and cells were
incubated for another 30 min at RT. Fix/Denat solution was tapped off and 100
µl/well of anti-BrdU-POD working solution was added and incubated for 90
min. Supernatant was removed by tapping off and cells were washed with PBS
for three times. Cells were dried with tapping the plate and 100 µl/well substrate
solution was added. Cells were incubated for 30 min at RT with substrate
solution and the absorbance was measured every 5 min at 370 nm with
SpectraMax M5 Microplate Reader, Molecular Devices. Results obtained at 15th
min were used for the analysis.
66
Results and Discussion
3.1 Experimental Conditions
Physical and chemical characterization of YIGSR-PA molecules were
performed for two different conditions. The differences between these
conditions originated due to application conditions of YIGSR-PA molecules for
in vitro and in vivo experiments.
The first condition was to mimic the gels used for in vivo experiments.
During the in vivo experiments, YIGSR-PA was injected into corneal pockets
which were surgically opened within stroma. Although YIGSR-PA was injected
in solution form, the solution transformed into hydrogels at the injection site
since stroma is rich in negatively charged glycosaminoglycans (GAG), which
induce nanofiber formation with these positively charged PA molecules through
charge neutralization. Chondroitin sulfate (CS) was used as a model GAG for
this purpose, since it is a prevalent GAG within corneal stroma.
Second condition was utilized to mimic the environment of in vitro
experiments, where negatively charged Glu-PA was used as a non-bioactive
gelator of positively charged YIGSR-PA through self-assembly of the
nanofibers caused by charge neutralization.
3.2 Design, Synthesis and Purification of Peptide Amphiphiles
Lauryl-VVAGKYIGSR-Am (YIGSR-PA), lauryl-VVAGE (Glu-PA) and
lauryl-VVAGK-Am (Lys-PA) molecules were designed and synthesized to form
nanofibers as artificial ECM material (Figure 23). YIGSR-PA contains
“YIGSR” epitope of laminin and is known for its activity on cell adhesion [93]
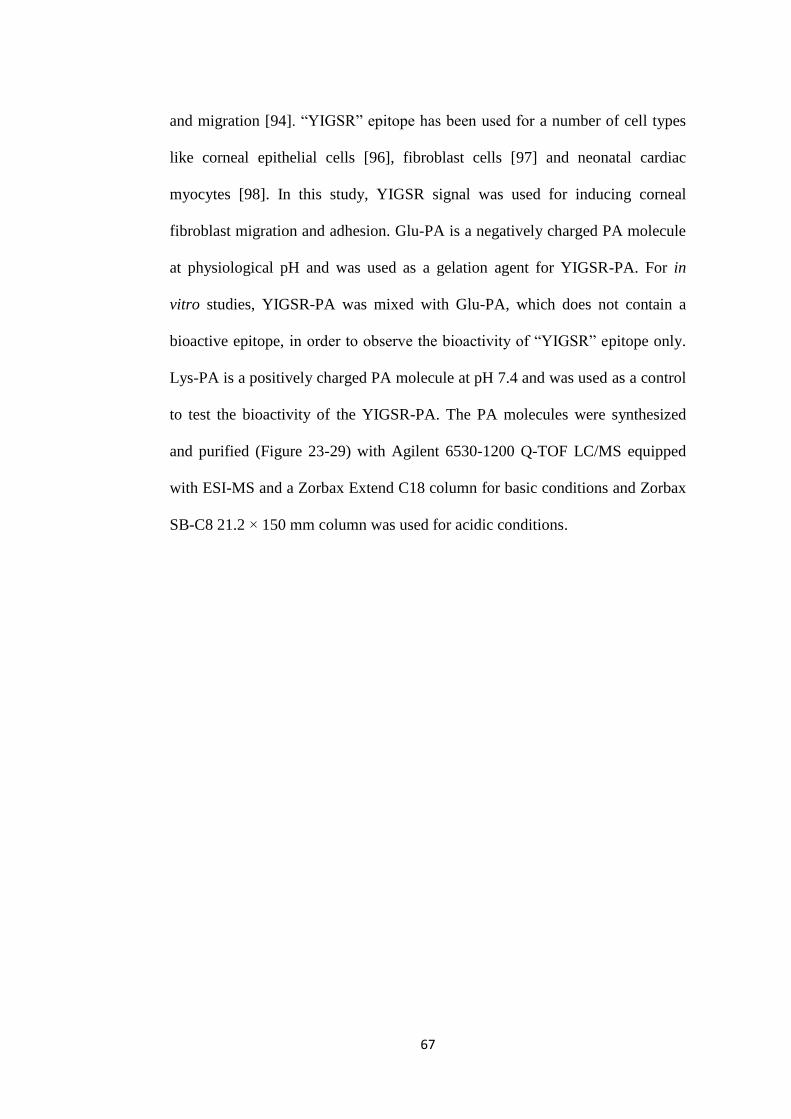
67
and migration [94]. “YIGSR” epitope has been used for a number of cell types
like corneal epithelial cells [96], fibroblast cells [97] and neonatal cardiac
myocytes [98]. In this study, YIGSR signal was used for inducing corneal
fibroblast migration and adhesion. Glu-PA is a negatively charged PA molecule
at physiological pH and was used as a gelation agent for YIGSR-PA. For in
vitro studies, YIGSR-PA was mixed with Glu-PA, which does not contain a
bioactive epitope, in order to observe the bioactivity of “YIGSR” epitope only.
Lys-PA is a positively charged PA molecule at pH 7.4 and was used as a control
to test the bioactivity of the YIGSR-PA. The PA molecules were synthesized
and purified (Figure 23-29) with Agilent 6530-1200 Q-TOF LC/MS equipped
with ESI-MS and a Zorbax Extend C18 column for basic conditions and Zorbax
SB-C8 21.2 × 150 mm column was used for acidic conditions.
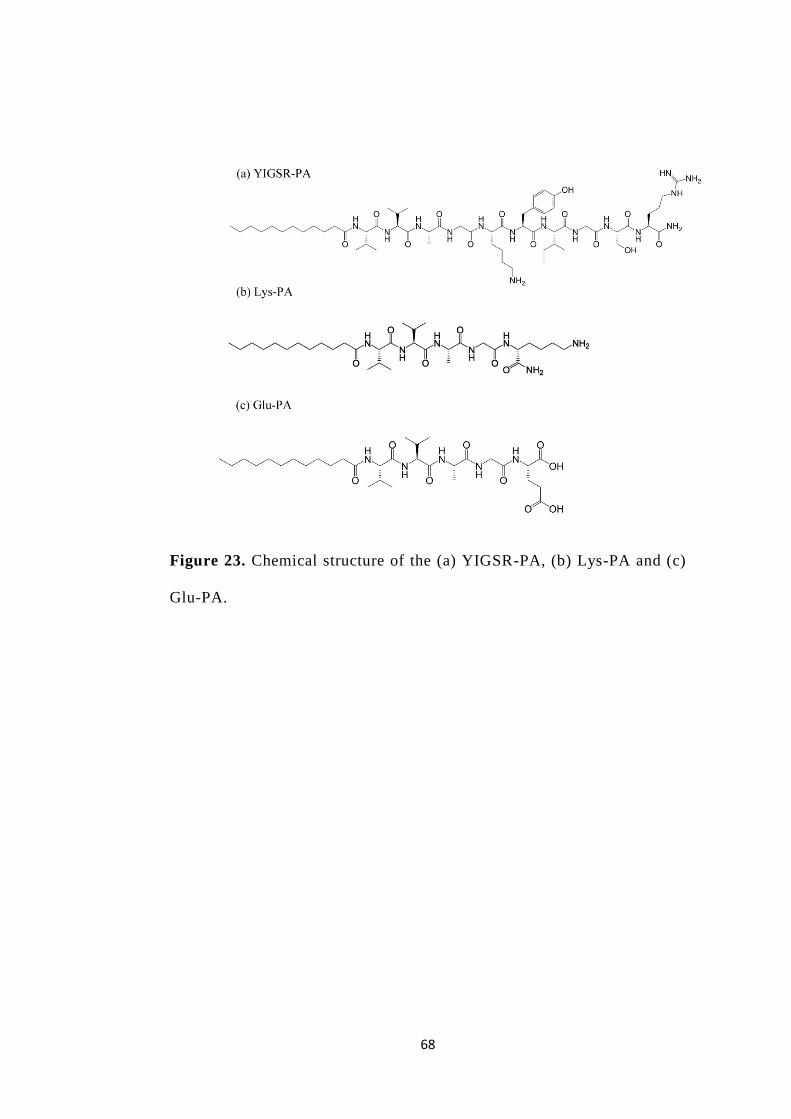
68
Figure 23. Chemical structure of the (a) YIGSR-PA, (b) Lys-PA and (c)
Glu-PA.
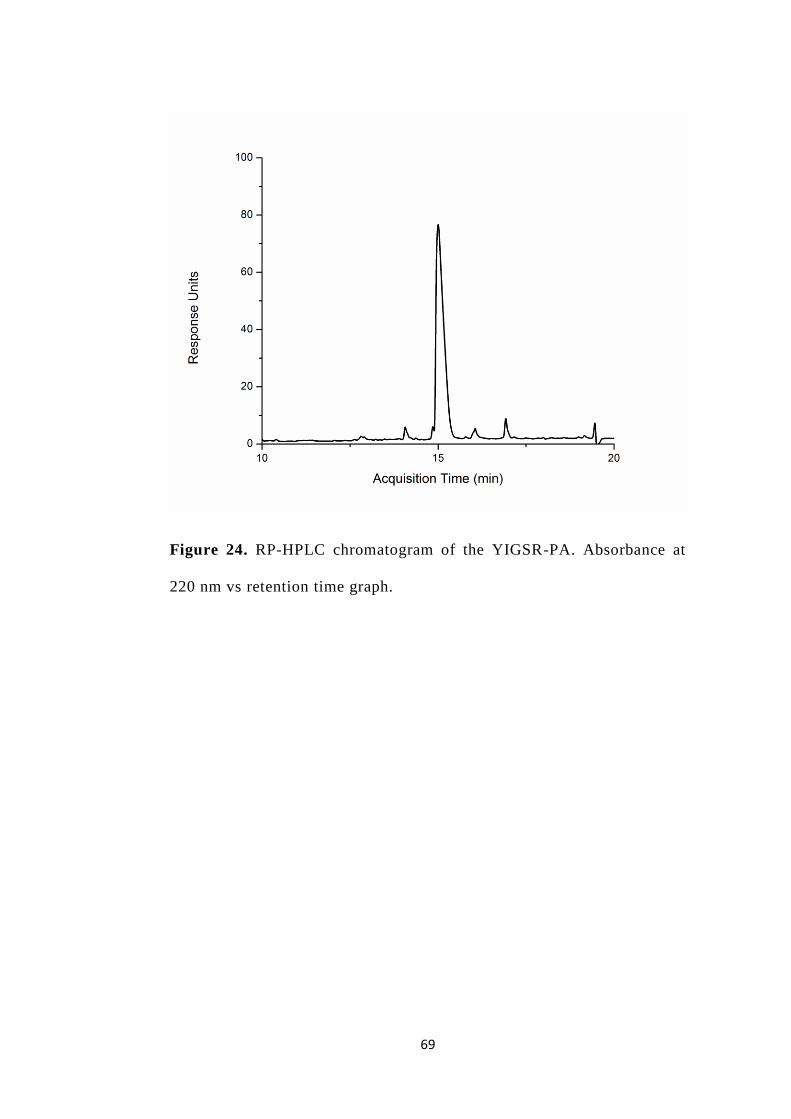
69
Figure 24. RP-HPLC chromatogram of the YIGSR-PA. Absorbance at
220 nm vs retention time graph.
70
Figure 25. Electrospray ionization mass spectra of the YIGSR-PA.
(M+H)observed+=1230.81, (M+H)calculated+=1230.81, (M+2H)+2/2observed+=
615.92 , (M+2H)+2/2calculated+= 615.92.
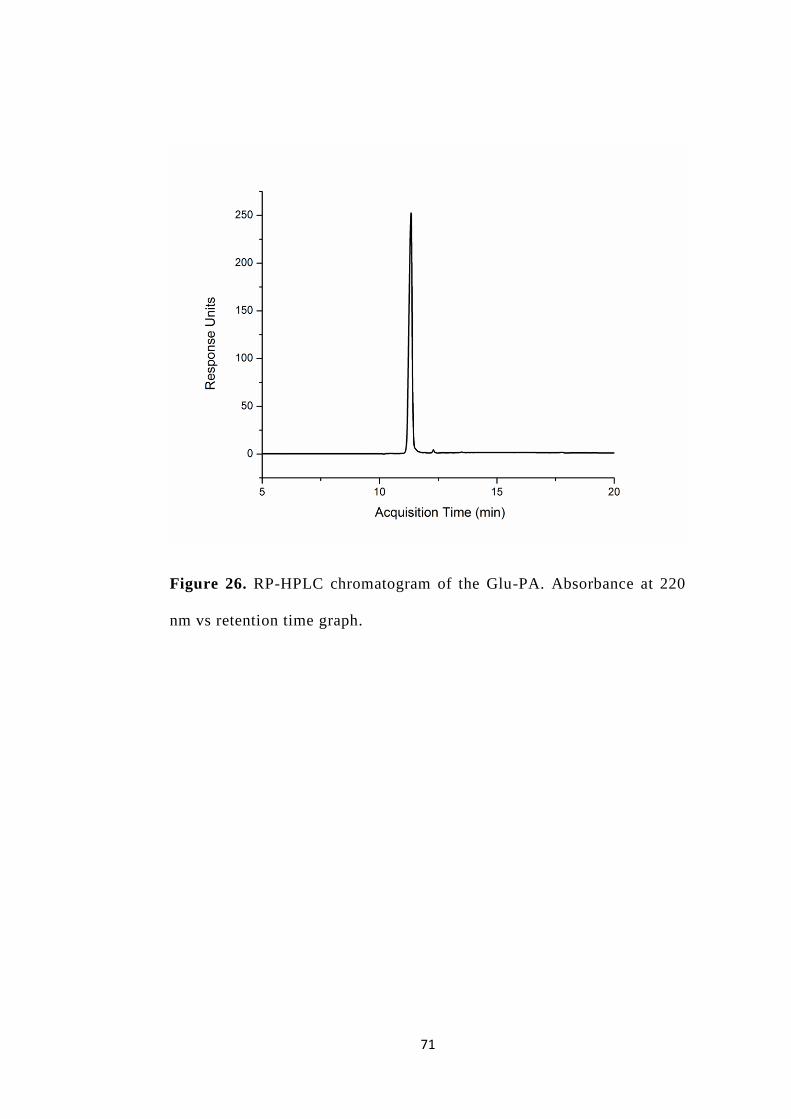
71
Figure 26. RP-HPLC chromatogram of the Glu-PA. Absorbance at 220
nm vs retention time graph.
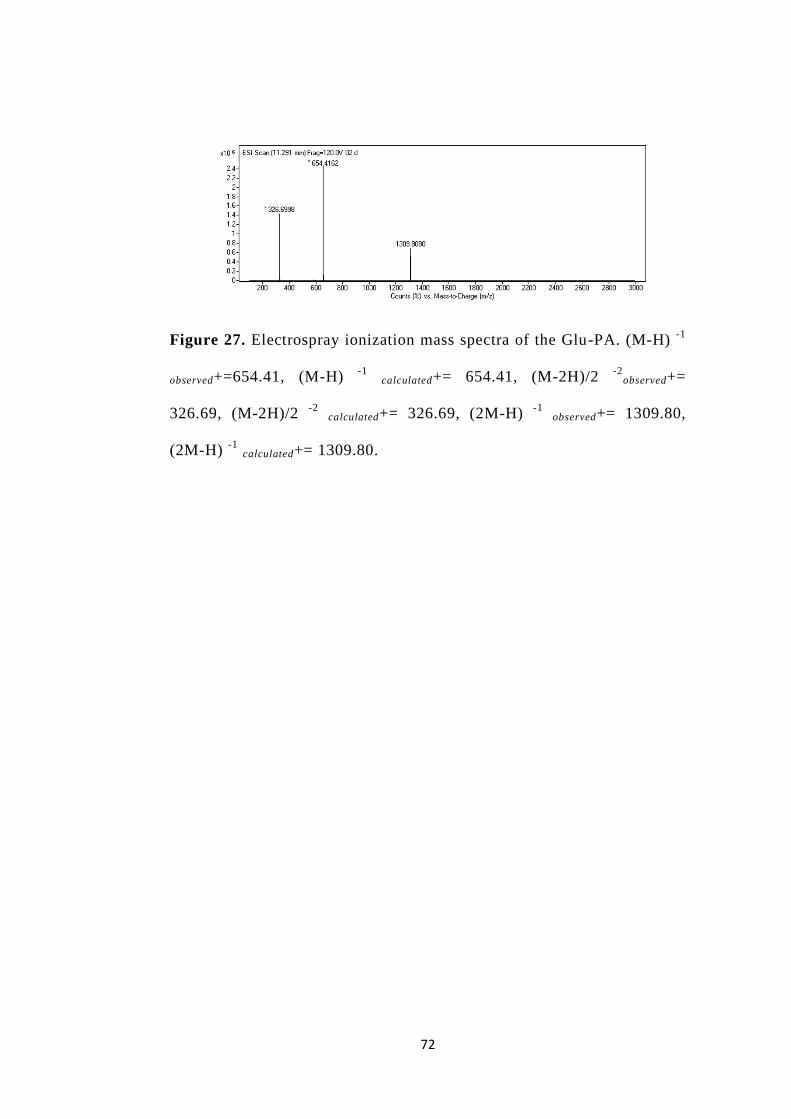
72
Figure 27. Electrospray ionization mass spectra of the Glu-PA. (M-H) -1
observed+=654.41, (M-H) -1
calculated+= 654.41, (M-2H)/2 -2
observed+=
326.69, (M-2H)/2 -2
calculated+= 326.69, (2M-H) -1
observed+= 1309.80,
(2M-H) -1
calculated+= 1309.80.
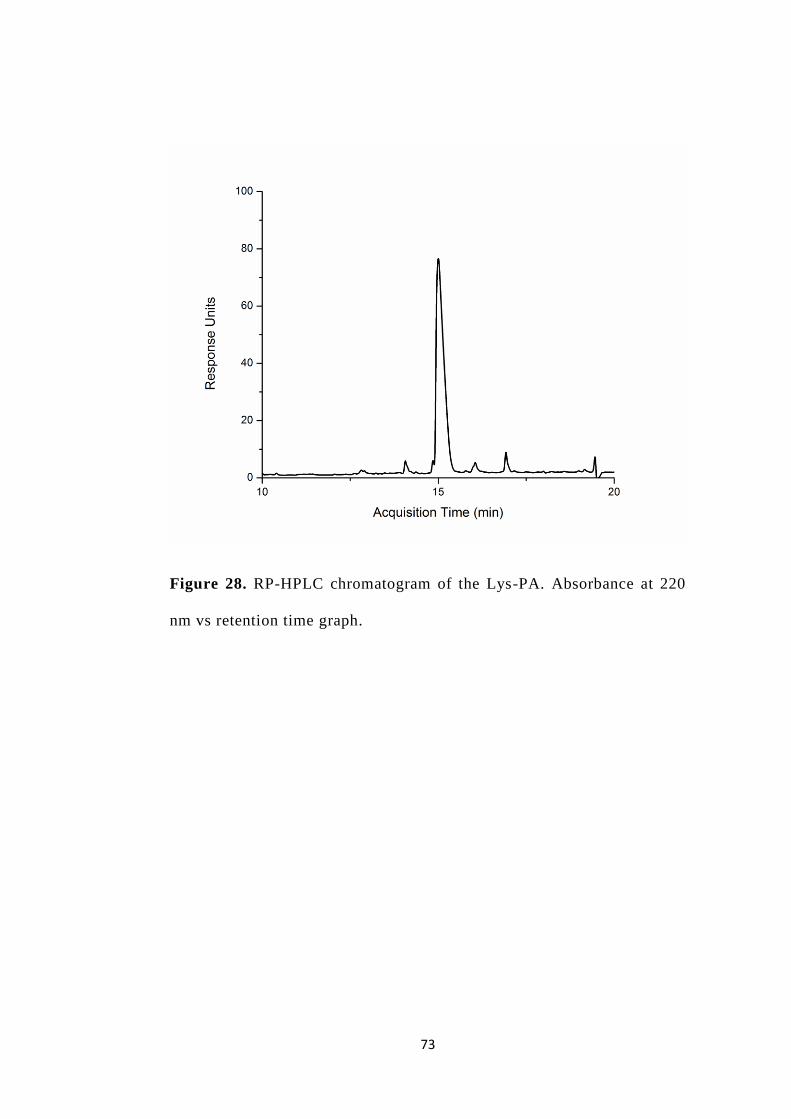
73
Figure 28. RP-HPLC chromatogram of the Lys-PA. Absorbance at 220
nm vs retention time graph.
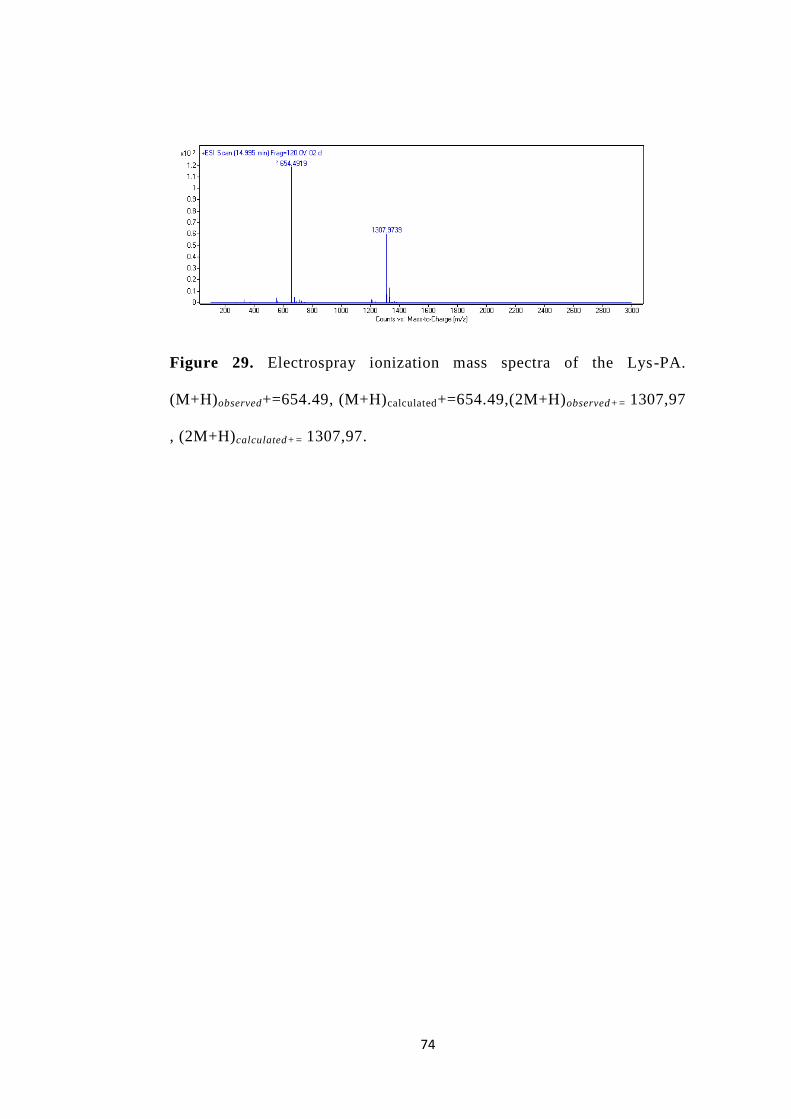
74
Figure 29. Electrospray ionization mass spectra of the Lys-PA.
(M+H)observed+=654.49, (M+H)calculated+=654.49,(2M+H)observed+= 1307,97
, (2M+H)calculated+= 1307,97.
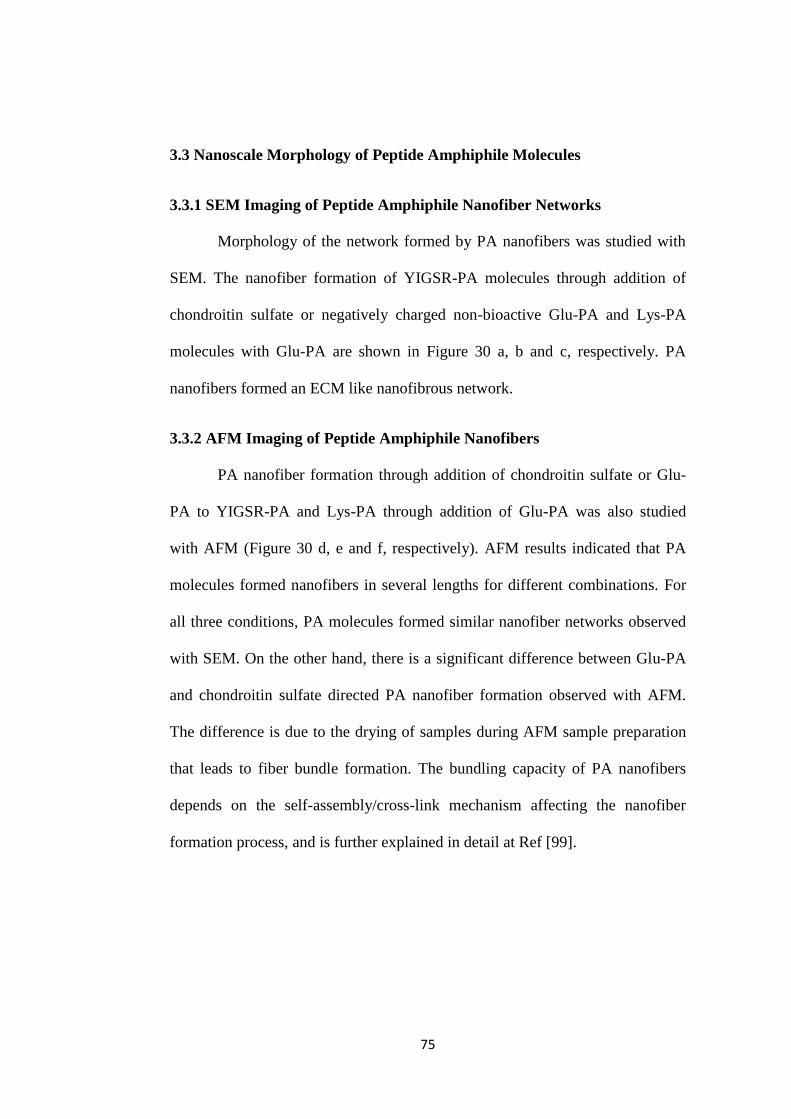
75
3.3 Nanoscale Morphology of Peptide Amphiphile Molecules
3.3.1 SEM Imaging of Peptide Amphiphile Nanofiber Networks
Morphology of the network formed by PA nanofibers was studied with
SEM. The nanofiber formation of YIGSR-PA molecules through addition of
chondroitin sulfate or negatively charged non-bioactive Glu-PA and Lys-PA
molecules with Glu-PA are shown in Figure 30 a, b and c, respectively. PA
nanofibers formed an ECM like nanofibrous network.
3.3.2 AFM Imaging of Peptide Amphiphile Nanofibers
PA nanofiber formation through addition of chondroitin sulfate or Glu-
PA to YIGSR-PA and Lys-PA through addition of Glu-PA was also studied
with AFM (Figure 30 d, e and f, respectively). AFM results indicated that PA
molecules formed nanofibers in several lengths for different combinations. For
all three conditions, PA molecules formed similar nanofiber networks observed
with SEM. On the other hand, there is a significant difference between Glu-PA
and chondroitin sulfate directed PA nanofiber formation observed with AFM.
The difference is due to the drying of samples during AFM sample preparation
that leads to fiber bundle formation. The bundling capacity of PA nanofibers
depends on the self-assembly/cross-link mechanism affecting the nanofiber
formation process, and is further explained in detail at Ref [99].
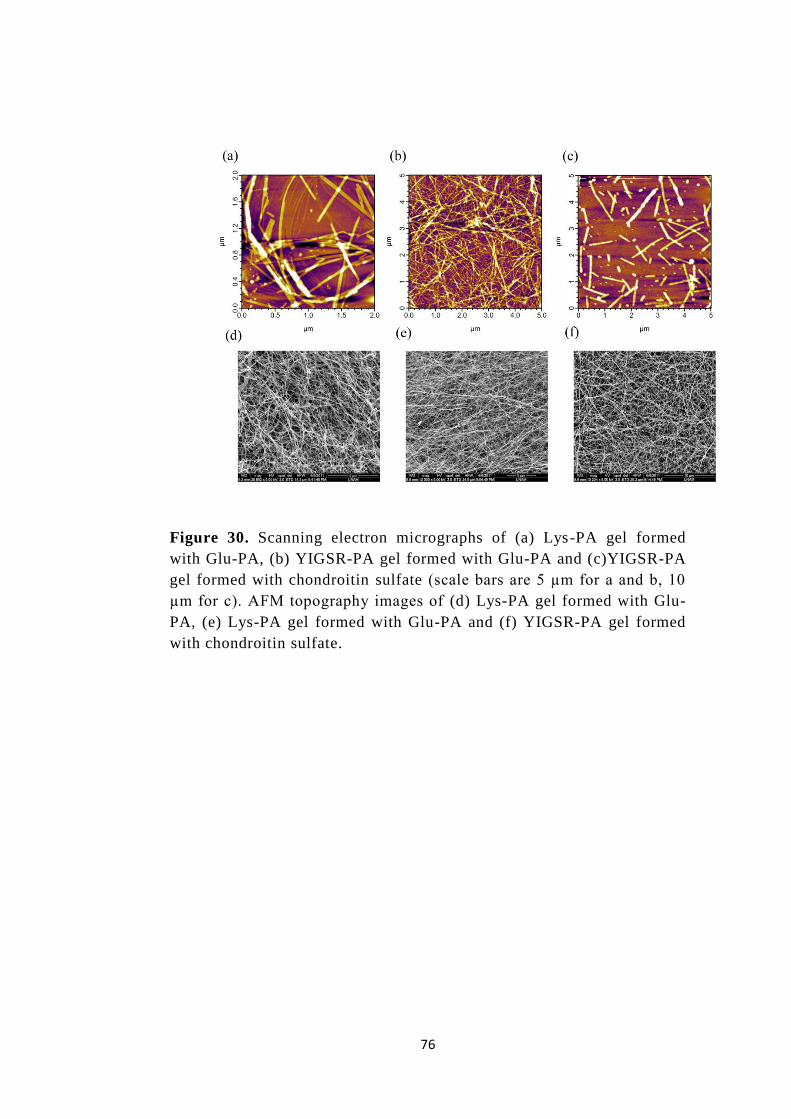
76
Figure 30. Scanning electron micrographs of (a) Lys-PA gel formed
with Glu-PA, (b) YIGSR-PA gel formed with Glu-PA and (c)YIGSR-PA
gel formed with chondroitin sulfate (scale bars are 5 µm for a and b, 10
µm for c). AFM topography images of (d) Lys-PA gel formed with Glu-
PA, (e) Lys-PA gel formed with Glu-PA and (f) YIGSR-PA gel formed
with chondroitin sulfate.
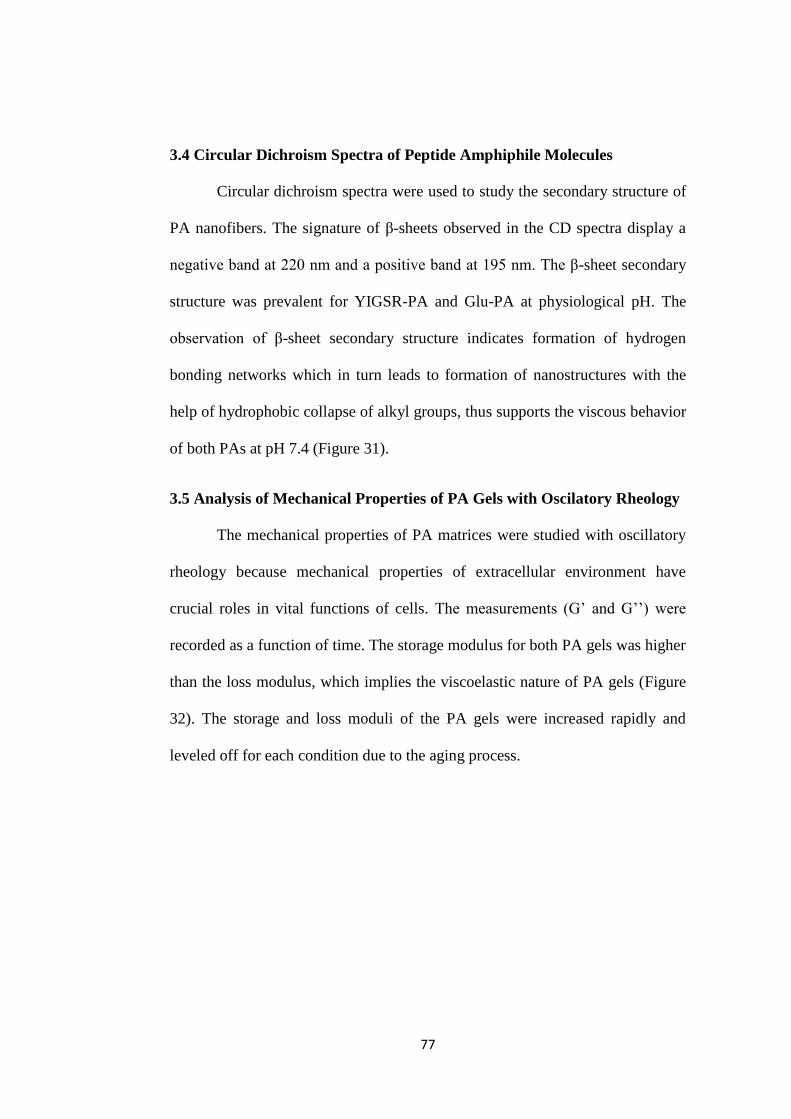
77
3.4 Circular Dichroism Spectra of Peptide Amphiphile Molecules
Circular dichroism spectra were used to study the secondary structure of
PA nanofibers. The signature of β-sheets observed in the CD spectra display a
negative band at 220 nm and a positive band at 195 nm. The β-sheet secondary
structure was prevalent for YIGSR-PA and Glu-PA at physiological pH. The
observation of β-sheet secondary structure indicates formation of hydrogen
bonding networks which in turn leads to formation of nanostructures with the
help of hydrophobic collapse of alkyl groups, thus supports the viscous behavior
of both PAs at pH 7.4 (Figure 31).
3.5 Analysis of Mechanical Properties of PA Gels with Oscilatory Rheology
The mechanical properties of PA matrices were studied with oscillatory
rheology because mechanical properties of extracellular environment have
crucial roles in vital functions of cells. The measurements (G’ and G’’) were
recorded as a function of time. The storage modulus for both PA gels was higher
than the loss modulus, which implies the viscoelastic nature of PA gels (Figure
32). The storage and loss moduli of the PA gels were increased rapidly and
leveled off for each condition due to the aging process.
78
Figure 31. Circular dichroism spectra of the YIGSR-PA and Glu-PA at different
conditions.
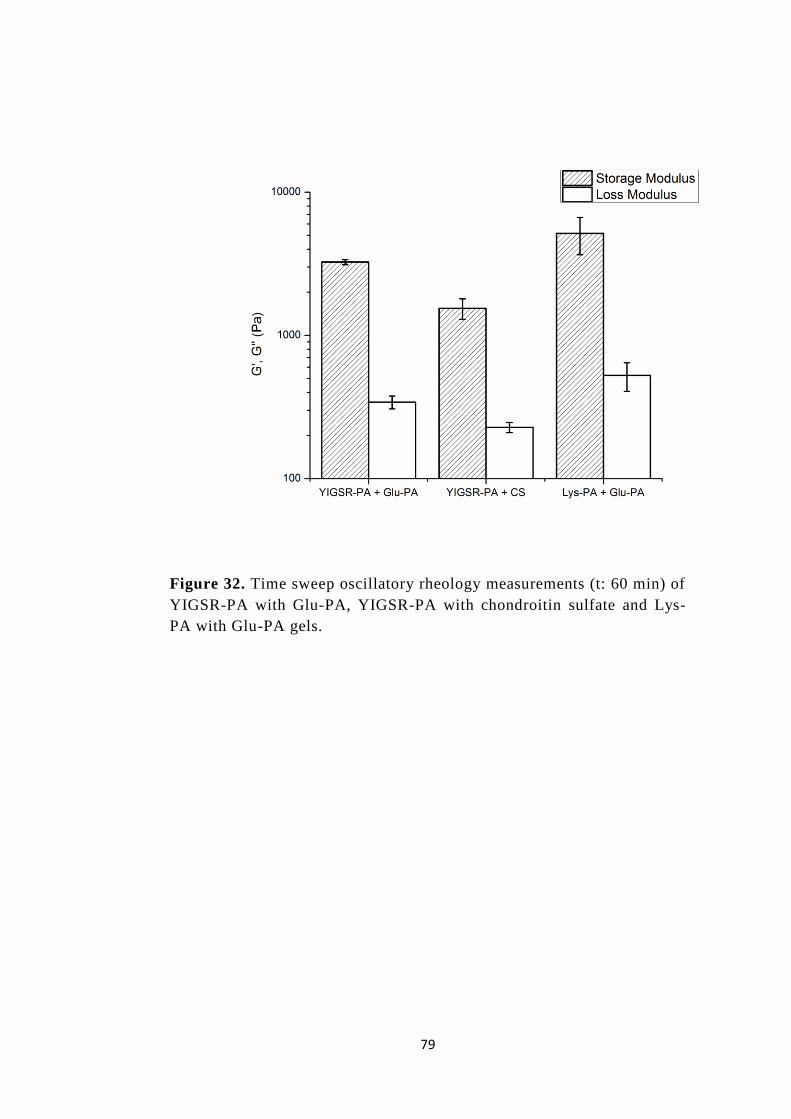
79
Figure 32. Time sweep oscillatory rheology measurements (t: 60 min) of
YIGSR-PA with Glu-PA, YIGSR-PA with chondroitin sulfate and Lys-
PA with Glu-PA gels.
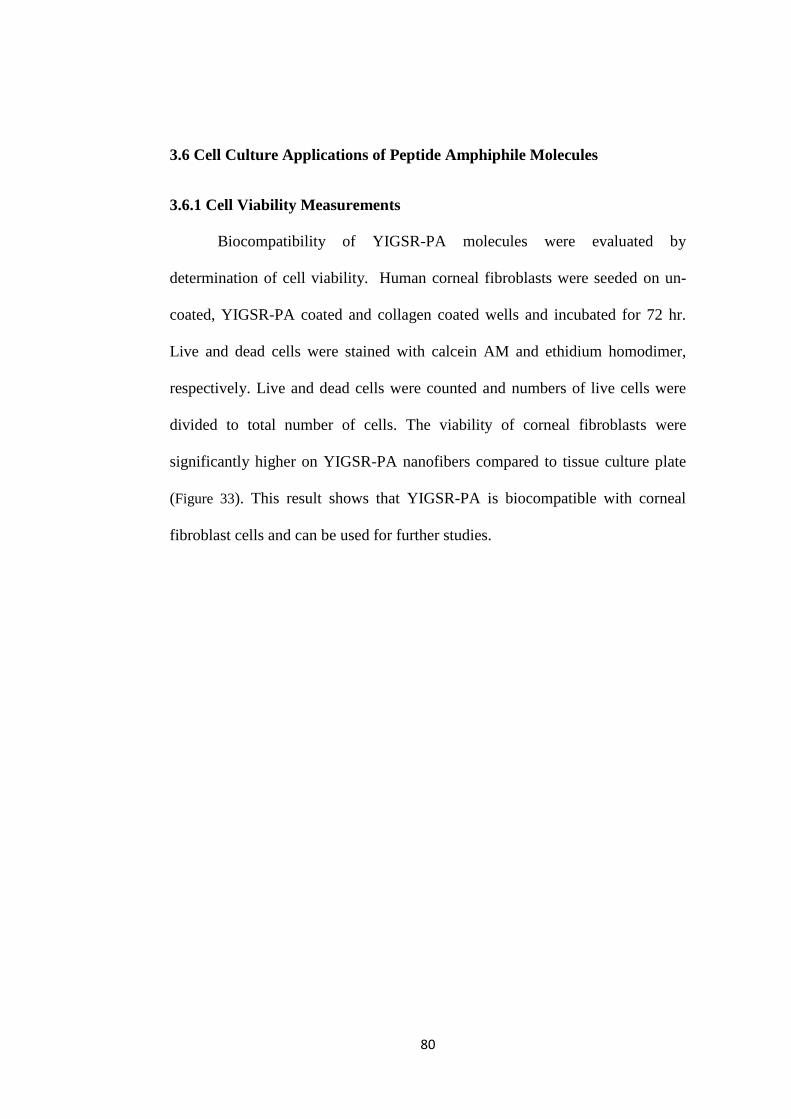
80
3.6 Cell Culture Applications of Peptide Amphiphile Molecules
3.6.1 Cell Viability Measurements
Biocompatibility of YIGSR-PA molecules were evaluated by
determination of cell viability. Human corneal fibroblasts were seeded on un-
coated, YIGSR-PA coated and collagen coated wells and incubated for 72 hr.
Live and dead cells were stained with calcein AM and ethidium homodimer,
respectively. Live and dead cells were counted and numbers of live cells were
divided to total number of cells. The viability of corneal fibroblasts were
significantly higher on YIGSR-PA nanofibers compared to tissue culture plate
(Figure 33). This result shows that YIGSR-PA is biocompatible with corneal
fibroblast cells and can be used for further studies.
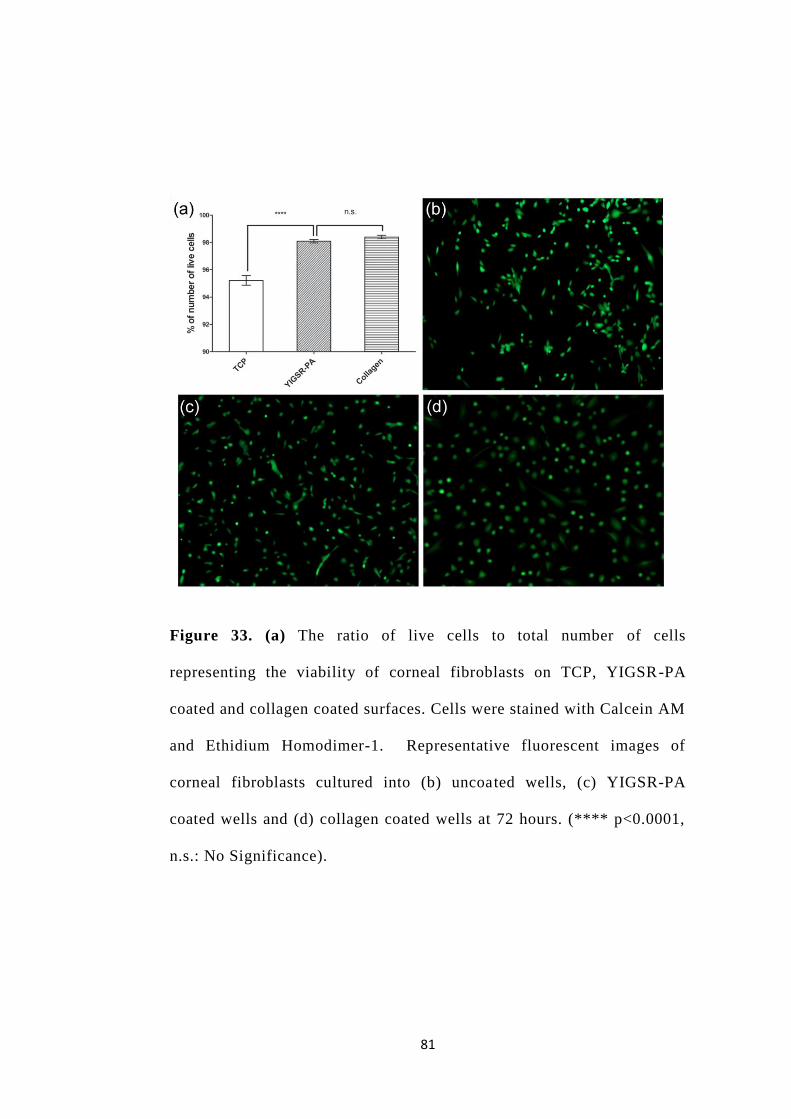
81
Figure 33. (a) The ratio of live cells to total number of cells
representing the viability of corneal fibroblasts on TCP, YIGSR-PA
coated and collagen coated surfaces. Cells were stained with Calcein AM
and Ethidium Homodimer-1. Representative fluorescent images of
corneal fibroblasts cultured into (b) uncoated wells, (c) YIGSR-PA
coated wells and (d) collagen coated wells at 72 hours. (**** p<0.0001,
n.s.: No Significance).
82
3.6.2 Cell Adhesion Assays
Adhesion and migration of corneal fibroblasts should be promoted
within the PA gel injected in the stroma. To assess the adhesion of corneal
fibroblast cells on the YIGSR-PA coated surface, filamentous actins and nuclei
were stained with TRITC-conjugated phalloidin and TO-PRO®-3 iodide,
respectively. The adhesion of cells is important because cells tend to adhere to
their environment and direct their cellular processes like survival or proliferation
according to the mechanical and functional characteristics of the environment
that they interact with. Adhesion and spreading profiles of the corneal
fibroblasts did not demonstrate a significant difference on YIGSR-PA coated
wells compared to collagen coated wells or glass surface (Figure 34). This
profile was also confirmed with SEM imaging of HTKs cultured on these
surfaces. This result is important because adherent cells need to adhere to a
surface in order to retain their viability and function. Collagen is one of the
main members of the native extracellular matrix and the biocompatibility of
YIGSR-PA coated surfaces can be interpreted by the similar adhesion and
spreading profile observed with collagen coated surfaces.
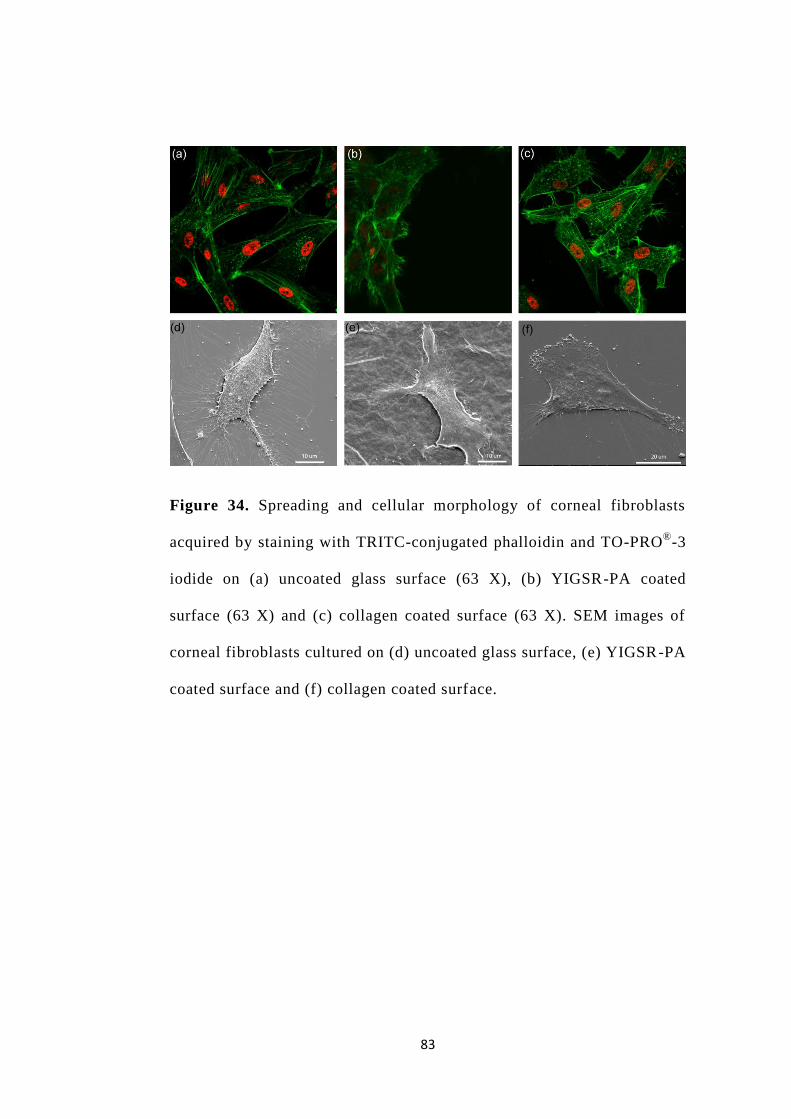
83
Figure 34. Spreading and cellular morphology of corneal fibroblasts
acquired by staining with TRITC-conjugated phalloidin and TO-PRO®
-3
iodide on (a) uncoated glass surface (63 X), (b) YIGSR-PA coated
surface (63 X) and (c) collagen coated surface (63 X). SEM images of
corneal fibroblasts cultured on (d) uncoated glass surface, (e) YIGSR-PA
coated surface and (f) collagen coated surface.
84
3.6.3 Cell Proliferation on PA Gels
Maintaining the proliferation capacity of corneal fibroblasts within PA
gel is crucial. The rate of increase in corneal stroma thickness, new tissue
formation, mainly depends on two events: cell proliferation and synthesis of
new extracellular matrix. The rate of extracellular matrix synthesis is also
dependent on cell number. The proliferation capacity of corneal fibroblasts
cultured on uncoated, YIGSR-PA coated and collagen coated surfaces for 72 hr
was assessed with BrdU cell proliferation assay. The proliferation rate of
corneal fibroblasts on YIGSR-PA coated surfaces is significantly higher than
cells cultured on non-coated surfaces (Figure 35). This result shows that
YIGSR-PA gels can be used further for in vivo studies to ensure higher
proliferative capacity of human corneal fibroblasts which in turn would provide
quicker recovery of corneal stroma.
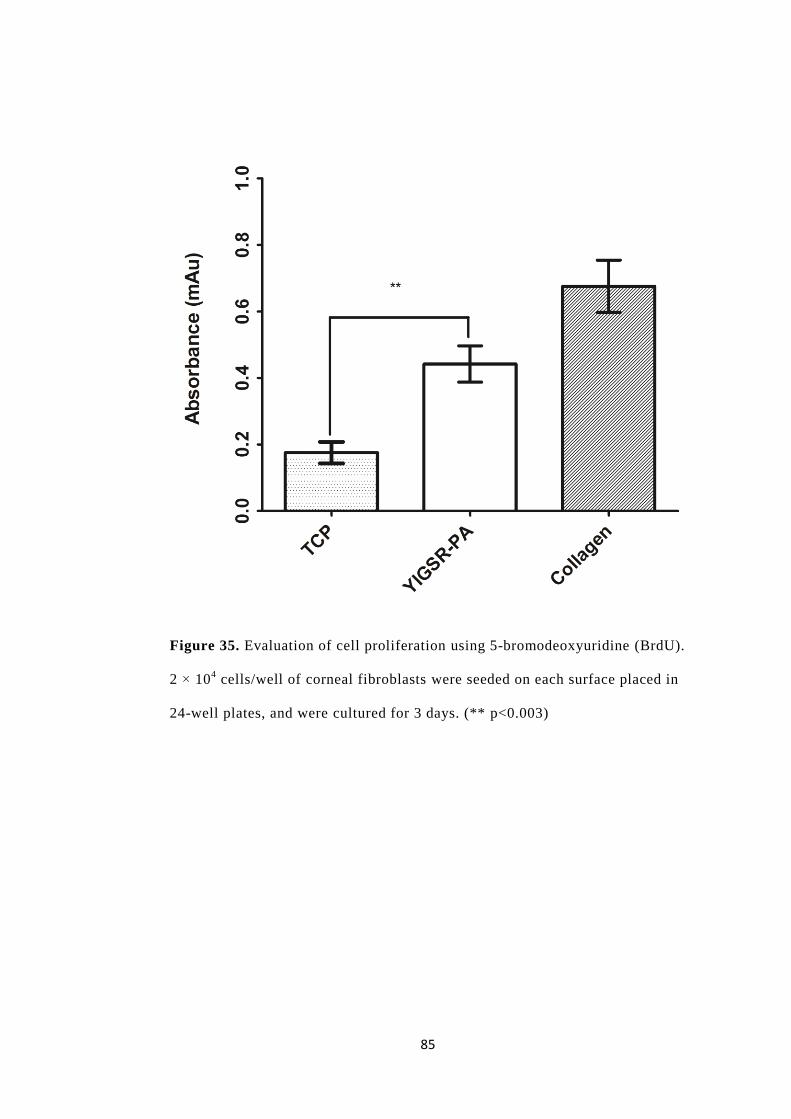
85
Figure 35. Evaluation of cell proliferation using 5-bromodeoxyuridine (BrdU).
2 × 10⁴ cells/well of corneal fibroblasts were seeded on each surface placed in
24-well plates, and were cultured for 3 days. (** p<0.003)
86
Conclusion
In this chapter, we studied the utilization of “YIGSR” bioactive epitope
containing peptide amphiphile molecules for corneal stroma regeneration. The
effects of YIGSR-PA on biocompatibility, adhesion and proliferation of corneal
fibroblast cells was assessed. The biocompatibility test suggests that corneal
fibroblast cells cultured on YIGSR-PA show higher viability ratio than those
cultured on tissue culture plate and there was no significant difference compared
to cells cultured on collagen coating. Human corneal fibroblast cells have shown
similar adhesion profiles in all test conditions. In addition to these results,
corneal fibroblast cells have proliferated significantly more on YIGSR-PA than
tissue culture plates. These observations suggest that YIGSR-PA can be used for
in vivo experiments aiming regeneration of corneal stroma.
87
REFERENCES
1. Cui, H., M.J. Webber, and S.I. Stupp, Self-assembly of peptide amphiphiles:
from molecules to nanostructures to biomaterials. Biopolymers, 2010. 94(1): p. 1-18.
2. Stendahl, J.C., et al., Intermolecular forces in the self-assembly of peptide amphiphile nanofibers. Advanced Functional Materials, 2006. 16(4): p. 499-508.
3. Hartgerink, J.D., E. Beniash, and S.I. Stupp, Peptide-amphiphile nanofibers: a versatile scaffold for the preparation of self-assembling materials. Proc Natl Acad Sci U S A, 2002. 99(8): p. 5133-8.
4. Behanna, H.A., et al., Coassembly of amphiphiles with opposite peptide polarities into nanofibers. J Am Chem Soc, 2005. 127(4): p. 1193-200.
5. Velichko, Y.S., S.I. Stupp, and M.O. de la Cruz, Molecular simulation study of peptide amphiphile self-assembly. J Phys Chem B, 2008. 112(8): p. 2326-34.
6. Ganesh, S., S. Prakash, and R. Jayakumar, Spectroscopic investigation on gel-forming beta-sheet assemblage of peptide derivatives. Biopolymers, 2003. 70(3): p. 346-54.
7. Paramonov, S.E., H.W. Jun, and J.D. Hartgerink, Self-assembly of peptide-amphiphile nanofibers: the roles of hydrogen bonding and amphiphilic packing. J Am Chem Soc, 2006. 128(22): p. 7291-8.
8. Beniash, E., et al., Self-assembling peptide amphiphile nanofiber matrices for cell entrapment. Acta Biomater, 2005. 1(4): p. 387-97.
9. Zhang, S., et al., Spontaneous assembly of a self-complementary oligopeptide to form a stable macroscopic membrane. Proc Natl Acad Sci U S A, 1993. 90(8): p. 3334-8.
10. Guler, M.O., et al., Presentation of RGDS epitopes on self-assembled nanofibers of branched peptide amphiphiles. Biomacromolecules, 2006. 7(6): p. 1855-1863.
11. Bull, S.R., et al., Magnetic resonance imaging of self-assembled biomaterial scaffolds. Bioconjug Chem, 2005. 16(6): p. 1343-8.
12. Niece, K.L., et al., Self-assembly combining two bioactive peptide-amphiphile molecules into nanofibers by electrostatic attraction. J Am Chem Soc, 2003. 125(24): p. 7146-7.
13. Silva, G.A., et al., Selective differentiation of neural progenitor cells by high-epitope density nanofibers. Science, 2004. 303(5662): p. 1352-5.
14. Hartgerink, J.D., E. Beniash, and S.I. Stupp, Self-assembly and mineralization of peptide-amphiphile nanofibers. Science, 2001. 294(5547): p. 1684-8.
15. Sargeant, T.D., et al., Hybrid bone implants: Self-assembly of peptide amphiphile nanofibers within porous titanium. Biomaterials, 2008. 29(2): p. 161-171.
16. Tysseling-Mattiace, V.M., et al., Self-assembling nanofibers inhibit glial scar formation and promote axon elongation after spinal cord injury. J Neurosci, 2008. 28(14): p. 3814-23.
17. Engler, A.J., et al., Matrix elasticity directs stem cell lineage specification. Cell, 2006. 126(4): p. 677-89.
88
18. Ingber, D.E., Tensegrity II. How structural networks influence cellular information processing networks. J Cell Sci, 2003. 116(Pt 8): p. 1397-408.
19. Ingber, D.E., Tensegrity I. Cell structure and hierarchical systems biology. J Cell Sci, 2003. 116(Pt 7): p. 1157-73.
20. Schwartz, M.A. and V. Baron, Interactions between mitogenic stimuli, or, a thousand and one connections. Curr Opin Cell Biol, 1999. 11(2): p. 197-202.
21. Taipale, J. and J. Keski-Oja, Growth factors in the extracellular matrix. FASEB J, 1997. 11(1): p. 51-9.
22. Rosso, F., et al., From cell-ECM interactions to tissue engineering. J Cell Physiol, 2004. 199(2): p. 174-80.
23. Lo, C.M., et al., Cell movement is guided by the rigidity of the substrate. Biophys J, 2000. 79(1): p. 144-52.
24. Beningo, K.A. and Y.L. Wang, Fc-receptor-mediated phagocytosis is regulated by mechanical properties of the target. J Cell Sci, 2002. 115(Pt 4): p. 849-56.
25. MacKintosh, F.C., J. Kas, and P.A. Janmey, Elasticity of semiflexible biopolymer networks. Phys Rev Lett, 1995. 75(24): p. 4425-4428.
26. Tharmann, R., M.M. Claessens, and A.R. Bausch, Micro- and macrorheological properties of actin networks effectively cross-linked by depletion forces. Biophys J, 2006. 90(7): p. 2622-7.
27. Pierschbacher, M.D. and E. Ruoslahti, Cell attachment activity of fibronectin can be duplicated by small synthetic fragments of the molecule. Nature, 1984. 309(5963): p. 30-3.
28. Tsonchev, S., et al., Phase diagram for assembly of biologically-active peptide amphiphiles. J Phys Chem B, 2008. 112(2): p. 441-7.
29. Krimm, S. and J. Bandekar, Vibrational spectroscopy and conformation of peptides, polypeptides, and proteins. Adv Protein Chem, 1986. 38: p. 181-364.
30. Manning, M.C., M. Illangasekare, and R.W. Woody, Circular dichroism studies of distorted alpha-helices, twisted beta-sheets, and beta turns. Biophys Chem, 1988. 31(1-2): p. 77-86.
31. Greenfield, M.A., et al., Tunable mechanics of peptide nanofiber gels. Langmuir, 2010. 26(5): p. 3641-7.
32. Bernal, V. and P. Jelen, Effect of Calcium Binding on Thermal Denaturation of Bovine α-Lactalbumin. Journal of dairy science, 1984. 67(10): p. 2452-2454.
33. Spungin, A. and S. Blumberg, Streptomyces griseus aminopeptidase is a calcium-activated zinc metalloprotein. European Journal of Biochemistry, 1989. 183(2): p. 471-477.
34. Whitcher, J.P., M. Srinivasan, and M.P. Upadhyay, Prevention of corneal ulceration in the developing world. Int Ophthalmol Clin, 2002. 42(1): p. 71-7.
35. Whitcher, J.P., M. Srinivasan, and M.P. Upadhyay, Corneal blindness: a global perspective. Bull World Health Organ, 2001. 79(3): p. 214-21.
36. Thompson, R.W., Jr., et al., Long-term graft survival after penetrating keratoplasty. Ophthalmology, 2003. 110(7): p. 1396-402.
37. Griffith, M., et al., Functional human corneal equivalents constructed from cell lines. Science, 1999. 286(5447): p. 2169-72.
38. Morishige, N., et al., Noninvasive corneal stromal collagen imaging using two-photon-generated second-harmonic signals. J Cataract Refract Surg, 2006. 32(11): p. 1784-91.
39. Torbet, J., et al., Orthogonal scaffold of magnetically aligned collagen lamellae for corneal stroma reconstruction. Biomaterials, 2007. 28(29): p. 4268-76.
89
40. Hay, E.D., Development of the vertebrate cornea. Int Rev Cytol, 1979. 63: p. 263-322.
41. Hogan, M.J., J.A. Alvarado, and J.E. Weddell, Histology of the human eye; an atlas and textbook. 1971, Philadelphia,: Saunders. xiii, 687 p.
42. Reinach, P.S. and K.S. Pokorny, The corneal epithelium: clinical relevance of cytokine-mediated responses to maintenance of corneal health. Arq Bras Oftalmol, 2008. 71(6 Suppl): p. 80-6.
43. Tao, W., et al., ETB and epidermal growth factor receptor stimulation of wound closure in bovine corneal epithelial cells. Invest Ophthalmol Vis Sci, 1995. 36(13): p. 2614-22.
44. Ohashi, Y., et al., Presence of epidermal growth factor in human tears. Invest Ophthalmol Vis Sci, 1989. 30(8): p. 1879-82.
45. Wilson, S.E., S.A. Lloyd, and R.H. Kennedy, Epidermal growth factor messenger RNA production in human lacrimal gland. Cornea, 1991. 10(6): p. 519-24.
46. Marshall, G.E., A.G. Konstas, and W.R. Lee, Immunogold fine structural localization of extracellular matrix components in aged human cornea. I. Types I-IV collagen and laminin. Graefes Arch Clin Exp Ophthalmol, 1991. 229(2): p. 157-63.
47. Nakayasu, K., et al., Distribution of types I, II, III, IV and V collagen in normal and keratoconus corneas. Ophthalmic Res, 1986. 18(1): p. 1-10.
48. Schermer, A., S. Galvin, and T.T. Sun, Differentiation-related expression of a major 64K corneal keratin in vivo and in culture suggests limbal location of corneal epithelial stem cells. J Cell Biol, 1986. 103(1): p. 49-62.
49. Fini, M.E. and B.M. Stramer, How the cornea heals: cornea-specific repair mechanisms affecting surgical outcomes. Cornea, 2005. 24(8 Suppl): p. S2-S11.
50. Muller, L.J., L. Pels, and G.F. Vrensen, Novel aspects of the ultrastructural organization of human corneal keratocytes. Invest Ophthalmol Vis Sci, 1995. 36(13): p. 2557-67.
51. Zieske, J.D., Corneal development associated with eyelid opening. Int J Dev Biol, 2004. 48(8-9): p. 903-11.
52. Wilson, S.E., M. Netto, and R. Ambrosio, Jr., Corneal cells: chatty in development, homeostasis, wound healing, and disease. Am J Ophthalmol, 2003. 136(3): p. 530-6.
53. Jester, J.V., W.M. Petroll, and H.D. Cavanagh, Corneal stromal wound healing in refractive surgery: the role of myofibroblasts. Prog Retin Eye Res, 1999. 18(3): p. 311-56.
54. Stramer, B.M., et al., Molecular mechanisms controlling the fibrotic repair phenotype in cornea: implications for surgical outcomes. Invest Ophthalmol Vis Sci, 2003. 44(10): p. 4237-46.
55. Axelsson, I. and D. Heinegard, Fractionation of proteoglycans from bovine corneal stroma. Biochem J, 1975. 145(3): p. 491-500.
56. Anseth, A., Studies on corneal polysaccharides. III. Topographic and comparative biochemistry. Exp Eye Res, 1961. 1: p. 106-15.
57. Blochberger, T.C., et al., cDNA to chick lumican (corneal keratan sulfate proteoglycan) reveals homology to the small interstitial proteoglycan gene family and expression in muscle and intestine. J Biol Chem, 1992. 267(1): p. 347-52.
90
58. Corpuz, L.M., et al., Molecular cloning and tissue distribution of keratocan. Bovine corneal keratan sulfate proteoglycan 37A. J Biol Chem, 1996. 271(16): p. 9759-63.
59. Liu, C.Y., et al., The cloning of mouse keratocan cDNA and genomic DNA and the characterization of its expression during eye development. J Biol Chem, 1998. 273(35): p. 22584-8.
60. Funderburgh, J.L., et al., Mimecan, the 25-kDa corneal keratan sulfate proteoglycan, is a product of the gene producing osteoglycin. J Biol Chem, 1997. 272(44): p. 28089-95.
61. Bettelheim, F.A. and B. Plessy, The hydration of proteoglycans of bovine cornea. Biochim Biophys Acta, 1975. 381(1): p. 203-14.
62. Chakravarti, S., et al., Collagen fibril assembly during postnatal development and dysfunctional regulation in the lumican-deficient murine cornea. Dev Dyn, 2006. 235(9): p. 2493-506.
63. Rada, J.A., P.K. Cornuet, and J.R. Hassell, Regulation of corneal collagen fibrillogenesis in vitro by corneal proteoglycan (lumican and decorin) core proteins. Exp Eye Res, 1993. 56(6): p. 635-48.
64. Borcherding, M.S., et al., Proteoglycans and collagen fibre organization in human corneoscleral tissue. Exp Eye Res, 1975. 21(1): p. 59-70.
65. Scott, J.E., Proteoglycan: collagen interactions and corneal ultrastructure. Biochem Soc Trans, 1991. 19(4): p. 877-81.
66. Karring, H., et al., Proteomic analysis of the soluble fraction from human corneal fibroblasts with reference to ocular transparency. Mol Cell Proteomics, 2004. 3(7): p. 660-74.
67. Ethier, C.R., M. Johnson, and J. Ruberti, Ocular biomechanics and biotransport. Annu Rev Biomed Eng, 2004. 6: p. 249-73.
68. Maurice, D.M., The location of the fluid pump in the cornea. J Physiol, 1972. 221(1): p. 43-54.
69. Ruberti, J.W. and S.D. Klyce, NaCl osmotic perturbation can modulate hydration control in rabbit cornea. Exp Eye Res, 2003. 76(3): p. 349-59.
70. Zieske, J.D., et al., Basement membrane assembly and differentiation of cultured corneal cells: importance of culture environment and endothelial cell interaction. Exp Cell Res, 1994. 214(2): p. 621-33.
71. Orwin, E.J. and A. Hubel, In vitro culture characteristics of corneal epithelial, endothelial, and keratocyte cells in a native collagen matrix. Tissue Eng, 2000. 6(4): p. 307-19.
72. Joyce, N.C., et al., Cell cycle protein expression and proliferative status in human corneal cells. Invest Ophthalmol Vis Sci, 1996. 37(4): p. 645-55.
73. Joyce, N.C., et al., Expression of cell cycle-associated proteins in human and rabbit corneal endothelium in situ. Invest Ophthalmol Vis Sci, 1996. 37(8): p. 1566-75.
74. Bohnke, M., P. Eggli, and K. Engelmann, Transplantation of cultured adult human or porcine corneal endothelial cells onto human recipients in vitro. Part II: Evaluation in the scanning electron microscope. Cornea, 1999. 18(2): p. 207-13.
75. Engelmann, K., D. Drexler, and M. Bohnke, Transplantation of adult human or porcine corneal endothelial cells onto human recipients in vitro. Part I: Cell culturing and transplantation procedure. Cornea, 1999. 18(2): p. 199-206.
91
76. Chen, K.H., D. Azar, and N.C. Joyce, Transplantation of adult human corneal endothelium ex vivo: a morphologic study. Cornea, 2001. 20(7): p. 731-7.
77. Hicks, C.R., et al., Corneal replacement using a synthetic hydrogel cornea, AlphaCor: device, preliminary outcomes and complications. Eye (Lond), 2003. 17(3): p. 385-92.
78. Bleckmann, H. and S. Holak, Preliminary results after implantation of four AlphaCor artificial corneas. Graefes Arch Clin Exp Ophthalmol, 2006. 244(4): p. 502-6.
79. Chow, C.C., et al., Clinicopathologic correlation of explanted AlphaCor artificial cornea after exposure of implant. Cornea, 2007. 26(8): p. 1004-7.
80. Strampelli, B. and V. Marchi, [Osteo-odonto-keratoprosthesis]. Ann Ottalmol Clin Ocul, 1970. 96(1): p. 1-57.
81. White, J.H. and O. Gona, "Proplast" for keratoprosthesis. Ophthalmic Surg, 1988. 19(5): p. 331-3.
82. Blencke, B.A., et al., [Study on the use of glass ceramics in osteo-odonto-keratoplasty]. Ophthalmologica, 1978. 176(2): p. 105-12.
83. Caiazza, S., G. Falcinelli, and S. Pintucci, Exceptional case of bone resorption in an osteo-odonto-keratoprosthesis. A scanning electron microscopy and X-ray microanalysis study. Cornea, 1990. 9(1): p. 23-7.
84. Lanza, R.P., R.S. Langer, and J. Vacanti, Principles of tissue engineering. 3rd ed. 2007, Amsterdam ; Boston: Elsevier / Academic Press. xxvii, 1307 p.
85. Ruberti, J.W. and J.D. Zieske, Prelude to corneal tissue engineering - Gaining control of collagen organization. Progress in Retinal and Eye Research, 2008. 27(5): p. 549-577.
86. Graf, J., et al., A pentapeptide from the laminin B1 chain mediates cell adhesion and binds the 67,000 laminin receptor. Biochemistry, 1987. 26(22): p. 6896-900.
87. Bellamkonda, R., J.P. Ranieri, and P. Aebischer, Laminin oligopeptide derivatized agarose gels allow three-dimensional neurite extension in vitro. J Neurosci Res, 1995. 41(4): p. 501-9.
88. Li, F., et al., Cellular and nerve regeneration within a biosynthetic extracellular matrix for corneal transplantation. Proc Natl Acad Sci U S A, 2003. 100(26): p. 15346-51.
89. Shah, R.N., et al., Supramolecular design of self-assembling nanofibers for cartilage regeneration. Proc Natl Acad Sci U S A, 2010. 107(8): p. 3293-8.
90. Mata, A., et al., Bone regeneration mediated by biomimetic mineralization of a nanofiber matrix. Biomaterials, 2010. 31(23): p. 6004-12.
91. Chow, L.W., et al., A bioactive self-assembled membrane to promote angiogenesis. Biomaterials, 2011. 32(6): p. 1574-82.
92. Ruoslahti, E., RGD and other recognition sequences for integrins. Annu Rev Cell Dev Biol, 1996. 12: p. 697-715.
93. Massia, S.P., S.S. Rao, and J.A. Hubbell, Covalently immobilized laminin peptide Tyr-Ile-Gly-Ser-Arg (YIGSR) supports cell spreading and co-localization of the 67-kilodalton laminin receptor with alpha-actinin and vinculin. J Biol Chem, 1993. 268(11): p. 8053-9.
94. Iwamoto, Y., et al., Synthetic pentapeptide from the B1 chain of laminin promotes B16F10 melanoma cell migration. J Cell Physiol, 1988. 134(2): p. 287-91.
92
95. Jester, J.V., et al., Myofibroblast differentiation of normal human keratocytes and hTERT, extended-life human corneal fibroblasts. Invest Ophthalmol Vis Sci, 2003. 44(5): p. 1850-8.
96. Duan, X., et al., Biofunctionalization of collagen for improved biological response: scaffolds for corneal tissue engineering. Biomaterials, 2007. 28(1): p. 78-88.
97. Hara, M., et al., Production of interferon-beta by NB1-RGB cells cultured on peptide-lipid membranes. Cytotechnology, 2003. 42(1): p. 13-20.
98. Boateng, S.Y., et al., RGD and YIGSR synthetic peptides facilitate cellular adhesion identical to that of laminin and fibronectin but alter the physiology of neonatal cardiac myocytes. Am J Physiol Cell Physiol, 2005. 288(1): p. C30-8.
99. Dana, A., et al., Interfiber interactions alter the stiffness of gels formed by supramolecular self-assembled nanofibers. Soft Matter, 2011. 7(7): p. 3524-3532.