characterization and comparison of the functionality of
TRANSCRIPT

FACULTY OF BIOSCIENCE ENGINEERING
INTERUNIVERSITY PROGRAMME (IUPFOOD)
MASTER OF SCIENCE IN FOOD TECHNOLOGY
Major Food Science and Technology
Academic year 2014-2015
Characterization and comparison of the functionality of
fractionated lecithin from different sources
by Yessica Reckziegel
Promoter: Prof. Dr. Ir. Paul Van der Meeren
Tutor: Ir. Mathieu Balcaen
Department of Applied Analytical and Physical Chemistry
Master dissertation submitted in partial fulfilment of the requirements for the degree of
Master of Science in Food Technology

…the author and promoters give the permission to consult and copy parts of this work
for personal use only. Any other use is under the limitations of copyrights laws, more
specifically it is obligatory to specify the source when using results from this thesis.
Gent, June 2015
The promoter the author
Prof. Dr. Ir. Paul Van der Meeren Yessica Reckziegel
III
Preface
ecithin is defined as a complex mixture of acetone-insoluble phosphatides
such as phosphatidylcholine, phosphatidylethanolamine, and
phosphatidylinositol, combined with other substances such as triglycerides,
fatty acids, carbohydrates and other minor compounds. There are two major sources of
lecithin: animal and vegetal. Lecithin coming from the latter source was evaluated in this
work.
Lecithin can be used in its native form or it can be modified. Modification is a process of
which the aim is to improve the emulsifying properties of the lecithin. The idea behind
modification is to separate specific compounds from the lecithin matrix to obtain tailor-
made products. In this work, a physical modification technique was used.
To be able to follow the influence of this physical modification process, different
characterization techniques were evaluated. The composition of the lecithin was
determined using both simple, total phosphorous and nitrogen content, and very precise
techniques namely 31P-NMR. Both approaches were used in order to show that simple
and well known methods might be a good alternative for industries and small laboratories
(especially in developing countries) in getting an idea of the phospholipid content and
composition of lecithin. To assess the oil-in-water emulsion stabilizing functionality of the
obtained lecithin both the emulsion droplet size distribution and the cream layer profile
were followed over storage time.
Finally also the effect of mono and multi-valent cations on water-in-oil emulsions which
are stabilized using lecithin was examined.
In the following lines, the reader will find four major chapters. The first chapter compiles
the most important literature about the topic. The second chapter goes through the
materials and methods which were used throughout the work. The third chapter goes
over the results which were obtained and also gives some interpretation and comments
about the results. Finally, the fourth chapter gives an overview of the research and some
conclusions in addition to some further recommended research.
L
IV
TABLE OF CONTENTS
TABLE OF CONTENTS ............................................................................................................... IV
LIST OF FIGURES ..................................................................................................................... VIII
LIST OF TABLES .......................................................................................................................... X
LIST OF ABBREVIATIONS .......................................................................................................... XI
Acknowledgements ..................................................................................................................... 12
Chapter I. Literature review ......................................................................................................... 13
1. Introduction .............................................................................................................................. 14
2. Composition and Sources ....................................................................................................... 14
2.1 Occurrence of phospholipids ............................................................................................. 16
2.1.1 Animal based lecithin ................................................................................................. 17
2.1.1.1 Eggs .................................................................................................................... 17
2.1.1.2 Milk ...................................................................................................................... 17
2.1.1.3 Brain .................................................................................................................... 17
2.1.2 Plant based lecithin .................................................................................................... 17
2.1.2.1 Soybean .............................................................................................................. 17
2.1.2.2 Corn ..................................................................................................................... 18
2.1.2.3 Cottonseed .......................................................................................................... 18
2.1.2.4 Rapeseed ............................................................................................................ 19
2.1.2.5 Sunflower............................................................................................................. 19
2.1.2.6 Other plants ......................................................................................................... 19
2.1.3 Microorganisms .......................................................................................................... 19
3. Manufacture, purification and modification .............................................................................. 19
3.1 Modifications of lecithins ................................................................................................... 20
3.1.1 Physical modification .................................................................................................. 21
3.1.1.1 Separation of neutral and polar lipids .................................................................. 21
3.1.1.2 Supercritical carbon dioxide extraction ............................................................... 21
3.1.1.3 Fractionation of de-oiled lecithin with alcohols .................................................... 22
3.1.1.4 Membrane technology ......................................................................................... 22
V
3.1.2 Chemical modification ................................................................................................ 23
3.1.2.1 Hydroxylation ....................................................................................................... 23
3.1.2.2 Acylation .............................................................................................................. 23
3.1.2.3 Hydrogenation ..................................................................................................... 23
3.1.3 Enzymatic modification ............................................................................................... 23
4. Applications and uses .............................................................................................................. 24
5. Genetically modified foods ...................................................................................................... 25
CHAPTER II. Materials and methods .......................................................................................... 27
1. Lecithin samples ...................................................................................................................... 28
2. Fractionation ............................................................................................................................ 28
3. Lecithin characterization .......................................................................................................... 28
3.1 Quantification of phospholipid phosphorus ....................................................................... 28
3.1.1 Acid digestion with subsequent colorimetric determination ....................................... 28
3.1.1.1 Sample preparation ............................................................................................. 28
3.1.1.2 Colouring solution ................................................................................................ 29
3.1.1.3 Procedure ............................................................................................................ 29
3.1.1.3.1 Digestion of phospholipids ........................................................................... 29
3.1.1.3.2 Neutralization ............................................................................................... 29
3.1.1.3.3 Colorimetric determination ........................................................................... 29
3.1.1.4 Inorganic phosphorus determination ................................................................... 30
3.1.1.4.1 Procedure ..................................................................................................... 30
3.1.2 Phosphorus determination using TNT Reagent Set, Low Range (HACH®) .............. 31
3.1.2.1 Sample preparation ............................................................................................. 31
3.1.2.1.1 Native sample ............................................................................................... 31
3.1.2.1.2 Fractionated sample ..................................................................................... 32
3.1.2.2 Procedure ............................................................................................................ 32
3.2 Phosphorus nuclear magnetic resonance measurement (31P-NMR Spectroscopy) ......... 32
3.2.1 Materials ..................................................................................................................... 32
3.2.2 Sample preparation .................................................................................................... 33
3.2.2.1 Method I ............................................................................................................... 33
VI
3.2.2.2 Method II .............................................................................................................. 33
3.2.3 Procedure ................................................................................................................... 33
3.3 Determination of the nitrogen content using the Kjeldahl method .................................... 33
3.3.1 Materials ..................................................................................................................... 34
3.3.1.1 Reagents ............................................................................................................. 34
3.3.1.2 Apparatus ............................................................................................................ 34
3.3.2 Sample preparation .................................................................................................... 34
3.3.3 Procedure ................................................................................................................... 34
3.3.3.1 Destruction .......................................................................................................... 34
3.3.3.2 Distillation ............................................................................................................ 34
3.3.3.3 Calculation ........................................................................................................... 35
3.3.4 Determination of Nitrates and Ammonia .................................................................... 35
3.3.4.1 Sample preparation ............................................................................................. 35
3.3.4.2 Procedure ............................................................................................................ 35
3.4 Moisture content of corn lecithin samples ......................................................................... 36
3.4.1 Materials ..................................................................................................................... 36
3.4.2 Procedure ................................................................................................................... 36
4. Functionality ............................................................................................................................ 36
4.1 Oil-in-Water emulsion preparation .................................................................................... 36
4.2 Droplet size distribution measurement .............................................................................. 37
4.3 1D pfg NMR profilometry of Oil-in-Water emulsions ......................................................... 37
4.3.1 Sample preparation .................................................................................................... 38
4.4 Effect of mono- and multi-valent ions on lecithin-stabilized Water-in-Oil emulsions ......... 39
4.4.1 Emulsion preparation ................................................................................................. 39
4.4.1.1 Oil phase ............................................................................................................. 39
4.4.1.2 Water phase ........................................................................................................ 39
4.4.1.3 Preparation .......................................................................................................... 40
4.4.2 Centrifugation ............................................................................................................. 40
4.4.3 Light Microscopy ........................................................................................................ 40
4.5 Electrophoretic mobility ..................................................................................................... 40
VII
4.5.1 Sample preparation .................................................................................................... 41
5. Statistical analysis ................................................................................................................... 41
CHAPTER III. Results and discussion ........................................................................................ 42
1. Fractionation ............................................................................................................................ 43
2. Lecithin characterization .......................................................................................................... 44
2.1 Moisture content of corn lecithin sludge ............................................................................ 44
2.2 Quantification of phospholipid phosphorus ....................................................................... 44
2.2.1 Acid digestion with subsequent colorimetric determination ....................................... 44
2.2.2 Phosphorus determination by TNT Reagent Set, Low Range (HACH®) ................... 48
2.3 Phosphorus nuclear magnetic resonance measurement (31P-NMR Spectroscopy) ........ 50
2.4 Quantification of nitrogen-containing phospholipid ........................................................... 52
3. Functionality............................................................................................................................. 54
3.1 Droplet size measurement ................................................................................................ 54
3.2 1D pfg NMR profilometry of O/W emulsions ..................................................................... 59
3.3 Effect of mono- and multi-valent ions on lecithin-stabilized W/O emulsions ..................... 64
3.4 Electrophoretic mobility ..................................................................................................... 72
CHAPTER IV. Conclusions ......................................................................................................... 74
CHAPTER V. Appendices ........................................................................................................... 78
Appendix I .................................................................................................................................... 79
I.1 31P-NMR spectra for native and fractionated lecithin ......................................................... 79
Appendix II ................................................................................................................................... 82
II.1 Paired t-test comparing soybean and sunflower PL content ............................................. 82
II.2 ANOVA of droplet size results obtained with laser diffraction measures .......................... 82
II.2.1 Soybean lecithin ......................................................................................................... 82
II.2.2 Sunflower lecithin ....................................................................................................... 83
II.2.3 Differences between different native lecithins droplet size distribution ...................... 84
II.3 Nitrogen-containing phospholipids .................................................................................... 85
II.3.1 Soybean ..................................................................................................................... 85
II.3.2 Sunflower .................................................................................................................... 85
REFERENCES ............................................................................................................................ 86
VIII
LIST OF FIGURES
Figure 1: Structure and major classes of phospholipids (AOCS, 2011) ..................................... 15
Figure 2: Flow chart of oilseed lecithin manufacture (van Nieuwenhuyzen, 2014). *By-products
are obtained as well .................................................................................................................... 20
Figure 3: Positional specificity of phospholipases (Guo, et al., 2005) ......................................... 24
Figure 4: Simulated relative response of oil and water as a function of twice the inversion time
(tau-value) ................................................................................................................................... 38
Figure 5: Calibration curve for colorimetric P-determination at 820 nm ...................................... 44
Figure 6: Amount (%) of PL in soybean lecithin samples. Analyses of same samples were carried
out on different days (shows the variability of the method) ......................................................... 45
Figure 7: Amount (%) of phospholipids (native soybean lecithin) as a function of the digestion time
..................................................................................................................................................... 46
Figure 8: P-concentration as a function of digestion time when no triglycerides were added .... 47
Figure 9: P-concentration as a function of digestion time when triglycerides were added ......... 48
Figure 10: Calibration curve at 890 nm for P-determination (PO43-) by the TNT method (Hach®)
..................................................................................................................................................... 49
Figure 11: Amount (%) of phospholipids in lecithin samples (soybean, sunflower and dry corn)
..................................................................................................................................................... 49
Figure 12: Amount (%) of nitrogen-containing PL in lecithin samples (soybean, sunflower and dry
corn). Corn lecithin is dissected in nitrogen-containing phospholipids and ammonia content. Bars
represent standard deviation ....................................................................................................... 52
Figure 13: Volume-weighted average diameter of 5% O/W emulsion prepared with soybean
lecithin, as a function of time, measured by laser diffraction. Bars represent standard deviation
..................................................................................................................................................... 54
Figure 14: Volume-weighted average diameter of 5% O/W emulsion prepared with sunflower
lecithin, as a function of time, measured by laser diffraction. Bars represent standard deviation
..................................................................................................................................................... 55
Figure 15: Volume-weighted average diameter of 5% O/W emulsion prepared with native
soybean, native sunflower and corn lecithin, as a function of time, measured by laser diffraction
..................................................................................................................................................... 56
IX
Figure 16: Z-average diameter of 5% O/W emulsion stabilized by soybean lecithin, determined
by PCS. Bars represent standard deviation ................................................................................ 57
Figure 17: Z-average diameter of 5% O/W emulsion stabilized by sunflower lecithin, determined
by PCS. Bars represent standard deviation ................................................................................ 57
Figure 18: Z-average diameter of 5% O/W emulsion stabilized by native soybean, native
sunflower and corn lecithin, determined by PCS ........................................................................ 59
Figure 19: Profilometry curves of 5% O/W emulsions measured over time. A) Fractionated
soybean lecithin 0 mL water added. B) Fractionated soybean lecithin 0.8 mL water added. C)
Fractionated soybean lecithin 1.6 mL water added. D) Fractionated sunflower lecithin 0 mL water
added. E) Fractionated sunflower lecithin 0.8 mL water added. F) Fractionated sunflower lecithin
1.6 mL water added. G) Corn lecithin ......................................................................................... 61
Figure 20: Signal intensity of the sample containing 30 mm water and 10 mm oil as a function of
applied inversion time .................................................................................................................. 62
Figure 21: Rescaled signal intensity of O/W-emulsions stabilized using (fractionated) soybean
lecithin after 50 days of storage .................................................................................................. 63
Figure 22: Rescaled signal intensity of O/W-emulsions stabilized using (fractionated) sunflower
lecithin after 50 days of storage .................................................................................................. 63
Figure 23: Rescaled signal intensity of O/W-emulsions stabilized using different lecithin sources
after 50 days of storage ............................................................................................................... 64
Figure 24: W/O emulsions (30/70, m/m) containing Ca2+ right after preparation ........................ 66
Figure 25: W/O emulsions (30/70, m/m) containing Ca2+ 5 days after preparation. Water layers
are indicated with an arrow. ........................................................................................................ 66
Figure 26: W/O emulsions (30/70, m/m) containing Na+, A) right after preparation, B) after
centrifugation (water layer is circled) ........................................................................................... 67
Figure 27: W/O emulsions (30/70, m/m) containing Ce3+ right after preparation ........................ 68
Figure 28: Droplet size of W/O emulsions containing Ce3+ at different concentrations stabilized by
soybean lecithin. The pictures were taken right after the emulsion preparation. Magnification
100x. Bar = 50 µm ....................................................................................................................... 69
Figure 29: W/O emulsions (30/70, m/m) containing different lecithin concentrations and A) 32 mM
NaCl, B) 16 mM CaCl2, C) 7.05 mM CeCl3, right after preparation ............................................ 70
Figure 30: W/O emulsions containing 7.05 mM CeCl3 and different lecithin concentrations, right
after preparation. ......................................................................................................................... 71
Figure 31: Electrophoretic mobility as function of Ce3+:soybean lecithin ratio. Bars represent the
standard deviation ....................................................................................................................... 73
X
LIST OF TABLES
Table 1: Average composition of plant and animal oil-free phospholipid extracts (Bueschelberger,
2004; Szuhaj, 2005). ................................................................................................................... 16
Table 2: Amount (%) of PL in the soybean lecithin samples plus standard deviation (SD). Analyses
of the same samples were carried out on different days ............................................................ 45
Table 3: Amount of inorganic phosphorus measured using colorimetry without heating step, where
100% equals 5 µg P per 10ml ..................................................................................................... 47
Table 4: Relative peak areas* derived from 31P-NMR spectra from native and fractionated lecithin
samples ....................................................................................................................................... 51
Table 5: Mean droplet size and standard deviation based on volume-weighted average diameter
(µm) of 5% O/W emulsion prepared with lecithin, as a function of time, measured by laser
diffraction ..................................................................................................................................... 58
Table 6: Mean and standard deviation based on Z-average diameter (nm) of 5% O/W emulsion
stabilized by lecithin, determined by PCS ................................................................................... 58
Table 7: Macroscopic properties of emulsions prepared with an oil phase with different lecithin
concentrations (1, 2, 4, and 8%), and with 32, 16 or 7.05 mM of mono-, di-, and tri-valent cations,
resp. ............................................................................................................................................. 70

XI
LIST OF ABBREVIATIONS
GM = genetically modified
GMO = genetically modified organism
N = nitrogen
N-PL = nitrogen-containing phospholipids
O/W = oil-in-water
P = phosphorus
PL = phospholipid
PA = phosphatidic acid
PC = phosphatidylcholine
PE = phosphatidylethanolamine
PI = phosphatidylinositol
PS = phosphatidylserine
W/O = water-in-oil

12
Acknowledgements
To Babel Project of the Erasmus Mundus programme. My sincere gratitude for giving me
the opportunity to follow this master and for being my sponsor these 22 months. My
thanks to Univesidad Nacional de Itapua and Ghent University, for being part of this kind
of projects that give students, especially me, the opportunity to study abroad, in such a
renowned university. My appreciation to Ghent University and to KU Leuven to host me
during this master.
To Prof. Dr. Ir. Paul Van der Meeren. For giving me the opportunity to work on this topic,
for caring about what I was doing, for guiding me, for all the patience and time whenever
I needed. Thank you.
To Mathieu Balcaen. For your guidelines, supervision, caring, willingness and supporting
throughout this year. Thank you for your patience, time and understanding.
To all the colleagues and technicians of the laboratory of Applied Analytical and Physical
Chemistry of Ghent University. My gratitude for their help and support, for the excellent
atmosphere which made research easier and rewarding. Special thanks to Servah,
Arima, Zarah, Arnout, Lorenz and Ella.
To my professors. My deep gratitude for sharing all your expertise and knowledge during
lectures throughout these years.
To my classmates. For your support and friendship. Thank you for making these two
years easier to stand.
To my friends. My deep thanks for being there. Without you I would not have made it.
Special gratitude to my latin friend Andrea, for your supporting and cheering during these
two years. To Osvaldo, for sharing terere every weekend. To Flor, thank you for being
that sister I never got. To Cristina, Evelin, Ruth, Susana, Oscar, LuisFer, Sarah, Stanley,
Isaac, Ijeoma, for your support and cheering me up whenever I needed.
To my parents. My pillars, my strength, my motivation. Thank you for always supporting
me and advise me to make the best decisions. (A mis padres. Mis pilares, mi fortaleza,
mi motivación. Gracias por apoyarme siempre y aconsejarme a tomar las mejores
decisiones).
Yessica Reckziegel

13
Chapter I
Literature review
CHAPTER I. LITERATURE REVIEW
14
1. Introduction
In general as well as in scientific literature, the term lecithin is used with a variety of
different meanings.
In food technology, lecithin is defined as an additive, used as an emulsifier, instantiser,
antioxidant and flavour protector (ELMA). It was originally discovered (in 1846) by the
French chemist Maurice Gobley, described as a viscous matter containing fatty acids.
He named it with the Greek word for egg yolk, “lekithos”, based on his principal
experiments on hen´s egg yolks (Sourkes, 2004).
The Food Chemical Codex (2003) defines lecithin as a complex mixture of acetone-
insoluble phosphatides that consists of phosphatidylcholine, phosphatidylethanolamine,
and phosphatidylinositol, combined with other substances such as triglycerides, fatty
acids, carbohydrates and other minor compounds. Lecithin is only partially soluble in
water, but it readily hydrates to form emulsions. This definition is the one used along this
text.
It should be noted that there are also other uses of the term “Lecithin”. According to
Szuhaj (2005), the term phosphatide was assigned by Thudichum (1930) to “lipids
containing phosphorus”, whereby lecithin is chemically the phosphatide fraction
(phospholipid) of egg yolk and of several oilseeds. Moreover, the term “lecithin” is
sometimes used as a synonym for phosphatidylcholine, which is the major component
of the phosphatide fraction isolated from either egg yolk or soybean oil (Wabel, 1998).
Chemically, phosphatidylcholine is a mixture of differently substituted sn-glycerol-3-
phosphatidylcholine backbones (Rossi, 2007).
2. Composition and Sources
Lecithin has been in commercial use for more than a century, but since the extraction
process from egg yolk proved costly, lecithin is today not only extracted from eggs but
also from soybeans and other sources (ELMA).
However, there are two major differences between plant-based-lecithin and animal-
based-lecithin. Firstly, the phospholipid composition is different and secondly, the plant-
based-lecithin has a higher unsaturated fatty acid content and no cholesterol as
compared to egg yolk lecithin (Szuhaj, 2005).
As mentioned previously, lecithin is mainly composed of phospholipids, which are a class
of lipids that are formed of a phosphate-containing polar head-group attached to non-
polar hydrocarbon chains. The nature of the head-group is diverse, with different

CHAPTER I. LITERATURE REVIEW
15
functional groups attached to the phosphate groups (phosphatidic acid,
phosphatidylcholine, phosphatidylethanolamine, phosphatidylserine,
phosphatidylinositol). The structure of these head-groups is shown in Figure 1. The type
of fatty acid chains also varies and depends on the chain length and the carbon
saturation.
Phospholipids are amphiphilic compounds: the phosphate-containing polar head-group
composes the hydrophilic part, while the glycerol-backbones, as well as the fatty acids
compose the hydrophobic part. This amphipathic property provides the basis for the
compartmentalization of cells (phospholipids are the main constituents of biological
membranes) and is the reason why phospholipids are considered as surfactants (Pichot
et al., 2013).
The name ‘surfactant’ is a contraction of the term surface-active agent. Surfactants are
compounds that lower the surface tension of a liquid, because of their amphiphilic
properties, allowing easier spreading. It also lowers the interfacial tension between two
liquids or between a liquid and a solid (Rosen & Kunjappu, 2012).
Figure 1: Structure and major classes of phospholipids (AOCS, 2011)
The solubility of phospholipids in water depends on the head-group type and the
hydrocarbon chain length. Four classes of phospholipids (PLs) can be distinguished as
a function of PL solubility (Pichot et al., 2013). Class I includes Phospholipids which are

CHAPTER I. LITERATURE REVIEW
16
insoluble in water (do not absorb water at all). Class II consists of Phospholipids with
very low solubility in water, which swell in water. Examples are long-chain
phosphatidylcholine, phosphatidylethanolamine or sphingomyelin (SM). Class III A
includes Phospholipids, such as lysolecithins, which are soluble in water forming
lyotropic liquid crystals at low water content. Finally, Class III B is relatively rare, and
contains Phospholipids which are soluble in water forming micelles above the critical
micelle concentration (CMC), but no crystalline structure. Examples of this class are
saponins.
2.1 Occurrence of phospholipids
The exact composition of lecithin depends on the source as well as on the method of
extraction and purification. Although lecithin can be found in all kinds of living matter, it
is predominantly manufactured from plant seeds. The main plant seeds that are used
are soybeans and to a lesser degree peanut, and cotton-, sunflower- and rape-seeds.
As animal sources, egg yolk and brain tissues (bovine brain) are primarily used
(Bueschelberger, 2004).
Essentially, however, the only raw materials suitable for commercial use are oilseeds
and egg yolk. Plant raw materials have a low phospholipid content, which (as a
percentage of dry matter) does not exceed 3%. By contrast, raw materials of animal
origin have a much higher phospholipid content. In dried whole milk, for example, it is
around 2% and in dried egg yolk around 17% (Bueschelberger, 2004).
The phospholipid composition generally gives a clear indication of the origin of the
product, which is seen in table1.
Table 1: Average composition of plant and animal oil-free phospholipid extracts (Bueschelberger, 2004; Szuhaj, 2005).
*Glandless cottonseed (values based on total phosphorus)
Percentage of total phospholipids
Phospholipid Soybean Rapeseed Sunflower Corn Egg yolk
Milk Cottonseed*
Phosphatidylcholine 24 25 25 30 74 27 Phosphatidylethanolamine 22 22 11 3 19 36 13 Phosphatidylinositol 15 15 19 16 1 13 Phosphatidic acid 7 3 9 9 Sphingomyelin 2 29 Lyso-phospholipids 3 5 5 3 3 Other phospholipids 5 19 1 8 8
CHAPTER I. LITERATURE REVIEW
17
2.1.1 Animal based lecithin
Almost all body cells contain phospholipids. The common animal phospholipids are
sphingomyelin, phosphatidylcholine, phosphatidylethanolamine, phosphatidylserine,
phosphatidylinositol, and other glycerol phospholipids of complex fatty acid composition.
Besides egg yolk, also milk and brains have served as animal sources of lecithin. In
some instances, isolated and purified lecithins have been developed for clinical
nutritional uses (Szuhaj, 2005).
The following lines give some additional information on animal sources of lecithin.
2.1.1.1 Eggs
The phospholipids in eggs are mainly found in the yolk. Phospholipids represent
approximately 10% of the wet weight of the egg yolk. The main components of egg-
lecithin are phosphatidylcholine and phosphatidylethanolamine (Szuhaj, 2005). Egg yolk
lecithin also contains lysophosphatidylcholine, sphingomyelin, and neutral lipids in minor
quantities (Palacios & Wang, 2005). Egg yolk lecithin as a commercial-industrial
ingredient is too expensive, but it is used in some cases, such as medical feeding
programs and infant formulas (Szuhaj, 2005).
2.1.1.2 Milk
Milk has a phospholipid content of about 1% of the total lipid content (Bitman & Wood,
1990). Phospholipids are fundamental in milk for the emulsification of fat in water.
Glycerophospholipids (70%) and sphingolipids (29%) are the two main groups belonging
to the class of phospholipids in milk (Fagan & Wijesundera, 2004).
2.1.1.3 Brain
The brain is a rich source of phospholipids, and together with the spinal cord, it probably
possesses the highest phospholipid content of any of the organs. There are many
different types of phospholipids in the central nervous system (Kuksis, 1985) and in other
animal organs (Szuhaj, 2005).
2.1.2 Plant based lecithin
2.1.2.1 Soybean
The major commercial source of lecithin is soybean. Soybean lecithin contains ca. 65-
75% phospholipids (Scholfield, 1981). It is mainly used because of its availability and
excellent emulsifying behaviour, colour and taste (Cherry & Kramer, 1989).
CHAPTER I. LITERATURE REVIEW
18
Cherry & Kramer (1989) stated that variability in the composition of phospholipids in
soybean lecithin exists due to different manufacture conditions. For instance, purification
steps used to produce quality oil may affect the lecithin components. Also, soybeans
exposed to frost damage, or subjected to prolonged storage, have reduced lecithin
yields. Phospholipases, which produce phosphatidic acid, are active during storage and
may reduce the yield of lecithin. During the maturation process, the major phospholipids
(PC, PE, and PI) increase, and others decrease or remain constant.
2.1.2.2 Corn
Depending on the variety of maize, the amount of phospholipids varies from 2% to 5%
(Szuhaj, 2005). The amount of phospholipids found in corn lecithin is about 61% (on dry
basis) according to Weber (1981).
Similar chemical compositions were noted for corn and soy phosphatidylcholine and
phosphatidylinositol. Phosphatidic acid and glycolipids represent a higher proportion of
phospholipids in corn than in soybean lecithin. The percentage of minor components in
corn, such as steryl-glycoside esters and other glycolipids, are more than twice that
found in soybean lecithin, which explains why the physical properties (emulsifying
properties) of corn lecithin differ from those of soybean lecithin (Cherry & Kramer, 1989).
Corn glycolipids and phospholipids have lower percentages of linolenic acid (18:3) and
are more saturated than those in the soybean. In general, crude corn and soybean
lecithins are equal in linoleic acid (18:2) content, but linoleic acid in corn varies from 42%
to 70% depending on the variety of maize (Cherry & Kramer, 1989).
Another compound, phytic acid, of which 88% can be found in the germ of the corn, is
extracted as part of the lecithin fraction. Its elimination is desirable because it binds zinc,
magnesium, and calcium. This binding decreases the nutritional availability of these
minerals (Szuhaj, 2005).
2.1.2.3 Cottonseed
The phospholipids in cottonseed are similar in many respects to those of soybeans, with
the exception of their lower level of linolenic acid and higher level of saturated fatty acids.
Because of their low amount of linolenic acid, they are more stable to oxidation and
rancidity than soybean lecithin (Szuhaj, 2005).
In glanded cottonseed, gossypol binds to lecithin during oil extraction. Gossypol is a
phenolic compound, which is toxic, and is produced by cotton plants to protect them
against insects (Adams, et al., 1960). This economically negates its use as a commercial
CHAPTER I. LITERATURE REVIEW
19
source. Cultivars of glandless or gossypol-free cottonseed may have some potential for
providing commercial edible lecithins (Szuhaj, 2005).
2.1.2.4 Rapeseed
The major phospholipids present in commercial rapeseed lecithin are enumerate in table
1. Among the minor fractions, lysophosphatidyl ethanolamine accounts for about 2%.
Solvent-extracted rapeseed oil contains more phosphorus than other oils obtained with
other extraction methods (Szuhaj, 2005). Although a percentage of erucic acid is present,
the major fatty acids are palmitic, oleic and linoleic acids (Persmark, 1968). Since canola
is out on the market, the applications of rapeseed lecithin have developed positively
(Szuhaj, 2005).
2.1.2.5 Sunflower
Sunflower lecithin has a mild taste and similar emulsifying properties as soybean lecithin.
Its use in the manufacture of foods and cosmetics can be increased by refining and
fractionation and/or modifications. This makes sunflower lecithin interesting for food
manufacturers, particularly in Europe, the biggest sunflower seed producing/processing
continent (Szuhaj, 2005).
Sunflower lecithin contains 43% phospholipids, which composition is mentioned in table
1, as well as 33% oil and 23% of other compounds (glycolipids, complex carbohydrates)
(Cabezas et al., 2011).
2.1.2.6 Other plants
Other sources of lecithin that have been tested are rice bran, barley-, palash-, carrot- ,
coriander-, and papaya-seeds, as well as avocado, olive fruit and others (Szuhaj, 2005).
2.1.3 Microorganisms
Microorganisms, especially those that are acid-fast (resistant to decolourization by acids
during staining procedures), also contain large amounts of lipids, including
phospholipids. These entities are of interest for clinical research (Szuhaj, 2005). A survey
of microbiological sources of phospholipids has been published by Ratledge (1989).
3. Manufacture, purification and modification
The industrial process to obtain lecithin depends on the raw material.
Vegetable lecithins are manufactured exclusively as by-products of the vegetable oil
refining process, shown in figure 2 (van Nieuwenhuyzen, 2014). For animal lecithins,
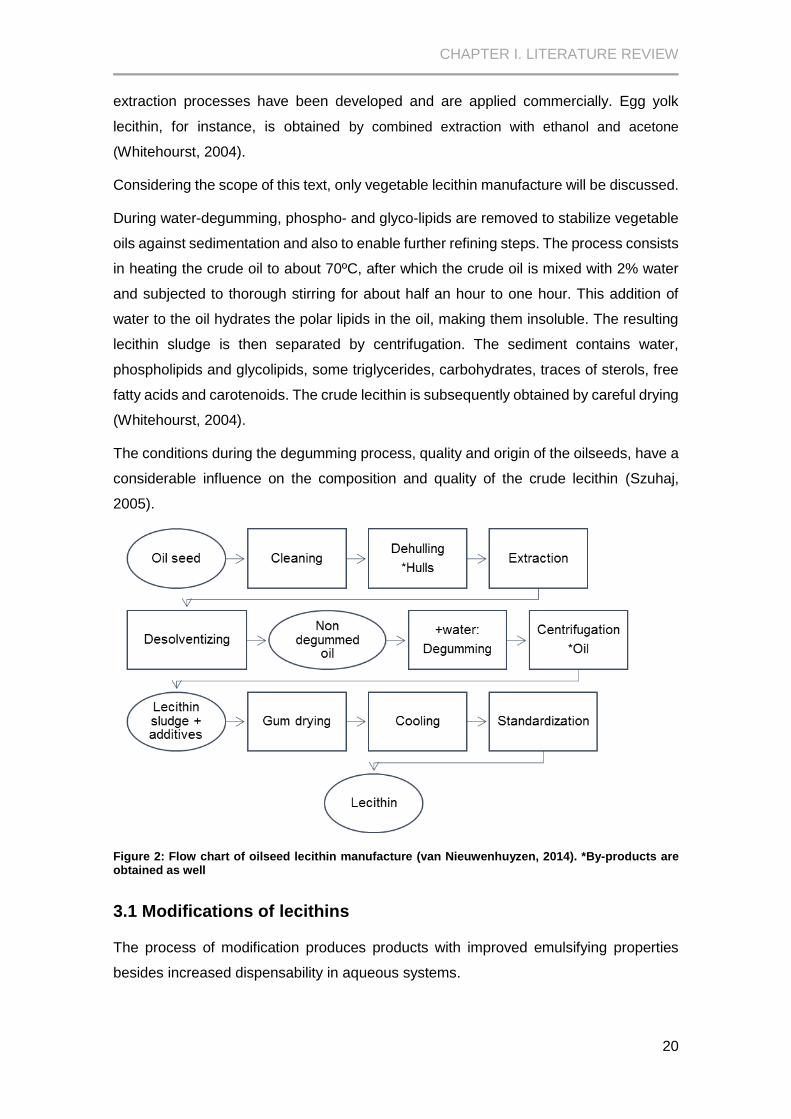
CHAPTER I. LITERATURE REVIEW
20
extraction processes have been developed and are applied commercially. Egg yolk
lecithin, for instance, is obtained by combined extraction with ethanol and acetone
(Whitehourst, 2004).
Considering the scope of this text, only vegetable lecithin manufacture will be discussed.
During water-degumming, phospho- and glyco-lipids are removed to stabilize vegetable
oils against sedimentation and also to enable further refining steps. The process consists
in heating the crude oil to about 70ºC, after which the crude oil is mixed with 2% water
and subjected to thorough stirring for about half an hour to one hour. This addition of
water to the oil hydrates the polar lipids in the oil, making them insoluble. The resulting
lecithin sludge is then separated by centrifugation. The sediment contains water,
phospholipids and glycolipids, some triglycerides, carbohydrates, traces of sterols, free
fatty acids and carotenoids. The crude lecithin is subsequently obtained by careful drying
(Whitehourst, 2004).
The conditions during the degumming process, quality and origin of the oilseeds, have a
considerable influence on the composition and quality of the crude lecithin (Szuhaj,
2005).
Figure 2: Flow chart of oilseed lecithin manufacture (van Nieuwenhuyzen, 2014). *By-products are obtained as well
3.1 Modifications of lecithins
The process of modification produces products with improved emulsifying properties
besides increased dispensability in aqueous systems.
CHAPTER I. LITERATURE REVIEW
21
The basic idea behind modification of lecithin revolves around recognition of the crude
lecithin starting material as a mixed emulsifier. Therefore, lecithin can be used for both,
water-in-oil and oil-in-water type emulsions, but each type of phospholipid has other
emulsification properties.
Phosphatidylcholine has oil-in-water emulsification-promoting characteristics.
Phosphatidylethanolamine and, to a lesser extent, phosphatidylinositol have water-in-oil
emulsifying properties (Joshi et al., 2006).
There are three important steps during modification of the complex mixture of crude
lecithin (Joshi et al., 2006). Standardization of the raw materials, in order to guarantee a
consistent composition, and thereby its functionality is the first step. This involves
selection and blending of crude lecithins of different origins according to the phospholipid
composition, adjustment of the viscosity and bleaching (e.g. using hydrogen peroxide).
Modification of the crude lecithin (by physical, chemical and enzymatic methods) is a
second step. A third step includes the production of enriched phospholipid fractions
(Whitehourst, 2004).
3.1.1 Physical modification
The principle behind physical modification consists in the separation of individual
components or component groups from the matrix to obtain materials with widely
different functionalities. It also involves carrying out modifications in the polar head group
distribution of the native phospholipids (Joshi et al., 2006).
3.1.1.1 Separation of neutral and polar lipids
The separation of neutral and polar lipids (de-oiling) is the most important fractionation
process. It is based on the fact that polar lipids (glycolipids and phospholipids) are
insoluble in acetone whereas neutral lipids are soluble in acetone (Joshi et al., 2006).
The aim of de-oiling is to concentrate and purify phospholipids that results in significantly
lower dosage requirements and higher functionality. Moreover, de-oiled products have a
more neutral taste than the corresponding liquid products.
3.1.1.2 Supercritical carbon dioxide extraction
CO2 at a temperature of about 40°C and at a pressure of about 300 bar has solubility
characteristics similar to liquid acetone. It dissolves neutral lipids, leaving behind the
polar substances. Furthermore, CO2 and oil are easy to separate, and the recovered gas
is reused in the process (Schneider, 1989). The advantages of this process are the
absence of oxygen and solvent residues. The low oil-dissolving capacity of CO2, the
CHAPTER I. LITERATURE REVIEW
22
subsequent high solvent-to-feed ratios and the low yield need further process
development before a plant-scale de-oiling operation may become economically
interesting (van Nieuwenhuyzen et al., 2008).
3.1.1.3 Fractionation of de-oiled lecithin with alcohols
Hereby, ethanol or ethanol–water mixtures are used, because of the differences in
solubility of the phospholipids in ethanol. Phosphatidylcholine in particular is readily
soluble, whereas phosphatidylinositol and phosphatidic acid are virtually insoluble.
Phosphatidylethanolamine, such as the neutral lipids, is found in both fractions. Alcohol
fractionation is interesting because of the different technological properties of the
fractions obtained: the alcohol-soluble fraction has improved emulsification capabilities
in oil-in-water emulsification properties, whereas the insoluble fraction provides better
water-in-oil emulsion. The fractionation method with alcohol, in principle, can be used on
lecithins of natural composition (used in food industry), on modified lecithins and on de-
oiled lecithins (Bueschelberger, 2004).
Sipos et al. (1996) evaluated the composition of a commercially prepared ethanol-soluble
fractionated de-oiled lecithin, and reported a phosphatidylcholine fraction containing 40–
60% PC, and the ethanol-insoluble phosphatidylinositol fraction containing 40–60% PI.
A more recent study reported an ethanol-soluble phosphatidylcholine fraction containing
37% PC and 6.5% PE, the ethanol-insoluble phosphatidylinositol fraction containing 27%
PI, 15% PE, and 3.3% PC (Wu et al., 2004).
Cabezas et al. (2011) also determined the phospholipid composition from modified
sunflower lecithins, obtained by deoiling, fractionation with absolute ethanol (PC and PI
enriched fractions), and enzymatic hydrolysis with phospholipase A. They reported a
marked difference regarding the phospholipid composition between these samples and
native sunflower lecithin. Phosphatidylcholine and phosphatidylinositol enriched
fractions exhibited the highest concentration of phosphatidylcholine (44.3%) and
phosphatidylinositol (35.2%), respectively.
Values corresponding to fractionated corn lecithin were not found in literature.
3.1.1.4 Membrane technology
Hexane-resistant (ceramic) membranes remove phospholipids from the crude oil
miscella feed. The phospholipids (retentate) are bound in large micelles, which do not
pass the membrane, while the triacylglycerols pass with the hexane through the
membrane in the permeate (van Nieuwenhuyzen et al., 2008).

CHAPTER I. LITERATURE REVIEW
23
3.1.2 Chemical modification
Lecithin properties can be improved by chemical treatment, but for safety reasons
several of them are not allowed in food applications. Nonetheless, hydrogenation,
hydroxylation, acetylation, and others can produce modified lecithin with improved heat
resistance, emulsifying properties, and increased dispensability in aqueous systems
(Szuhaj, 2005).
3.1.2.1 Hydroxylation
This process involves the addition of hydroxyl groups at the points of unsaturation of the
phospholipids’ fatty acid chains, using high concentrations of hydrogen peroxide in
combination with acids (e.g. acetic acid or lactic acid), increasing the hydrophobicity of
the phospholipids, i.e. improving emulsifying properties of lecithins for O/W emulsions
(Sai Prasad et al., 2011, van Nieuwenhuyzen et al., 2008, Whitehourst, 2004).
3.1.2.2 Acylation
In this process, an acyl group is introduced to reduce the amino group of the
phospholipid. The most common acylation is done with acetyl group (acetylation), mainly
because of its availability. A common practice is to treat lecithin with 2–5% acetic
anhydride (Joshi, et al., 2006). Acetylated lecithin mixtures are excellent O/W emulsifiers
and also exhibit good thermal stability, due to the fact that there is no longer a primary
amino-group available for Maillard reactions with the carbohydrate constituents of the
lecithin (Whitehourst, 2004).
3.1.2.3 Hydrogenation
This process is done to convert unsaturated fatty acids to saturated fatty acid. In this
way, oxidation is avoided (Whitehourst, 2004). Hydrogenation is performed by treating
lecithin with catalysts such as nickel, palladium, rhodium or platinum at high temperature
and pressure, until the iodine number (which is a measure of the degree of unsaturation)
drops (Joshi et al., 2006).
3.1.3 Enzymatic modification
The use of enzymes offers possibilities of greater selectivity and can yield products that
cannot be made by other methods. The added value of using enzymes is its substrate
specificity (Joshi et al., 2006). Another advantage of using enzymes is that these type of
reactions (hydrolysis) are often conducted under mild conditions, giving the possibility to
retain the original properties of those heat- or oxygen-sensitive phospholipids (Guo, et
al., 2005). Enzymatic modification is mostly meant to obtain more hydrophilic lecithin with

CHAPTER I. LITERATURE REVIEW
24
better oil-in-water emulsifying properties (van Nieuwenhuyzen & Tomas, 2008). Lipolytic
enzymes are used, mainly phospholipases and lipases.
The source of enzymes is diverse, but mainly they are obtained from microorganisms
(Joshi et al., 2006).
Phospholipases are named according to the ester bond they hydrolyse. Figure 3 shows
schematically how enzymes work (the substrates and the positions where they cleave).
However, enzymatic modification suffers from drawbacks such as the requirement for
the use of purified starting materials, low reaction quantities and a certain degree of
undesired hydrolysis, besides its high cost (Joshi et al., 2006).
Figure 3: Positional specificity of phospholipases (Guo, et al., 2005)
4. Applications and uses
The main functional properties of lecithin are emulsification, anti-spatter, instantizing,
wetting, dispersing, release/parting, and viscosity modification. These functional
characteristics are primarily derived from the chemical structures of lecithin’s major
phospholipids. These functional properties give lecithin a broad range of applications in
food industry, such as chocolate and confectionery products, margarine, bakery goods,
and pasta products. Lecithin is also used in other fields, for instance textiles, insecticides
and paints (Szuhaj, 2005).
As described before, a variety of methods are available for modifying lecithin, which
generates an unlimited potential for improved, tailor-made, functional products. The

CHAPTER I. LITERATURE REVIEW
25
following commercial lecithin modifications were described in a publication from Central
Soya Co., Inc.:
1. The use of oil-free lecithins as emulsifiers, lubricity enhancing agents, and blending
aids.
2. Producing low-viscosity, fluid lecithins as wetting, dispersing, and release agents.
3. Hydroxylated lecithins with enhanced emulsification, dispersing, and wetting
properties.
4. Highly filtered lecithins for use in health food applications.
5. Special heat-resistant lecithins for release applications.
6. Lecithin/distilled monoglyceride blend for bakery applications.
7. Enzyme-hydrolyzed lecithin for bakery, and emulsification applications.
One of the major functions of commercial lecithins is to emulsify fats. Commercial
lecithins are used in both water-in-oil (W/O) and oil-in-water (O/W) emulsions. For W/O
emulsions, like margarine or ready-to-use frostings, oil-loving, lipophilic lecithins are
typically used. For O/W emulsions like sauces or infant formulas, water-dispersible,
hydrophilic lecithins are typically used (Szuhaj, 2005).
5. Genetically modified foods
Genetically modified (GM) foods are foods derived from organisms whose genetic
material (DNA) has been modified in a way that does not occur naturally, e.g. through
the introduction of a gene from a different organism. Most existing genetically modified
crops have been developed to improve the yield, through the introduction of resistance
to plant diseases or of increased tolerance to herbicides (WHO). The most known GMO
crop is soybean, and since soybean is the major source of lecithin, industries are hardly
working to find alternatives to meet market and European Union (EU) regulations.
Worldwide legislation on GMO’s is limited. The European Food Safety Authority (EFSA)
states that genetically modified (GM) foods can only be authorized in the EU if they have
passed a rigorous safety assessment, which is an ongoing process (Szuhaj, 2005).
Currently, EFSA approved around 150 GM crops to be cultivated and/or consumed in
the EU territory. This status can easily be checked on the official European Commission
website1.
1 http://ec.europa.eu/food/dyna/gm_register/index_en.cfm

CHAPTER I. LITERATURE REVIEW
26
Consumers’ perception is the most important issue. The concern of some consumers,
as well as environmental and scientific organizations is focused on the risks of mass
commercialization of GM products for human health, the environment and the socio-
economic impacts that may result (Schaper et. al, 2001; Bawa et. al, 2013). Although
there is no enough prove to say that GMO’s represent a risk for consumers, sometimes
resistance is based on a perceived risk, which can be very far from a rational, science
based assessment of the risk (Valletta, 2010).

27
CHAPTER II
Materials and methods
CHAPTER II. MATERIALS & METHODS
28
1. Lecithin samples
Three sources of lecithin were used:
Soybean (Emulpur IP, Cargill; lot: 133209).
Sunflower (Emulpur SF, Cargill; lot: 133273),
Corn germ (Oilmills Vandamme, Deinze, Belgium)
The first two samples were de-oiled powdered lecithins while the third sample was a wet
and oily lecithin sludge, directly obtained from the corn oil degumming process.
2. Fractionation
A mixture of hexane/iso-propanol/water was used to fractionate de-oiled powdered
lecithin. A mixture of 100 mL hexane and 80 mL iso-propanol (ratio 5/4) was prepared
as base solvent.
500 mg of lecithin was dissolved in 18 mL of base solvent. This was done for each of the
de-oiled lecithin samples. In each of these solutions, a specific amount of water was
added: 0 mL, 0.4 mL, 0.8 mL or 1.6 mL. After water addition, these samples were stirred
for 1 hour. The obtained mixtures were then left to settle overnight.
The resulting supernatant was sampled with a syringe and filtered using a 25 mm VWR®
syringe filter which contained a 0.45 µm nylon membrane. From this supernatant,
samples were taken to determine the phosphorus content, the nitrogen content and to
prepare O/W emulsions.
3. Lecithin characterization
3.1 Quantification of phospholipid phosphorus
3.1.1 Acid digestion with subsequent colorimetric determination (Van der
Meeren et al., 1988)
3.1.1.1 Sample preparation
The native sample was prepared by adding 0.1 g of pure lecithin to 4 mL of water, after
which an ultrasonication bath was used to obtain a homogeneous solution.
For the fractionated lecithin samples, 100 μL of supernatant (prepared in section 2) was
poured into a Kjeldahl flask, after which the solvent was allowed to evaporate.

CHAPTER II. MATERIALS & METHODS
29
3.1.1.2 Colouring solution
A colouring mixture was prepared by adding one volume of 2.5% ammonium molybdate
to 3 volumes of 4N H2SO4. This solution was mixed and one volume of 10% ascorbic
acid was added. The colouring solution was prepared freshly every time it was used.
The used solutions were prepared as follows:
4N H2SO4: 20 mL of H2SO4 (96%) was diluted with 180 mL deionised water.
10% ascorbic acid: 10 g of ascorbic acid was dissolved in 100 mL of deionised water.
It was stored in the refrigerator for stability reasons (prevent oxidation).
2.5% ammonium molybdate: 2.5 g of (NH4)6Mo7O24.H2O was dissolved in 100 mL
deionised water.
3.1.1.3 Procedure
3.1.1.3.1 Digestion of phospholipids
The first step in the procedure consisted in the release of phosphate from the
phospholipids. Therefore, the lecithin sample was mixed in a Kjeldahl flask with 2 mL of
H2SO4 (96%), 2 mL of HClO4 (60%) and 4 mL of deionised water (unless the PL were
already suspended in water, such as in the native samples). A funnel was placed at the
top of the flask to enhance refluxing. The digestion was carried out under a fume hood
and was completed after about 2 hours.
3.1.1.3.2 Neutralization
Prior to the P-determination, the digested samples were neutralized with NaOH (40%),
in two steps: first, about 6 mL of NaOH was added, and after cooling, the neutralization
was completed using phenolphthalein as indicator (the colour of the solution changed
from colourless to pink).
After neutralization, the sample was transferred into a 100 mL volumetric flask to adjust
the volume in order to contain about 5 µg P per 10 mL of solution.
3.1.1.3.3 Colorimetric determination
Ten mL of the solution was sampled for the P-determination and 4 mL of the colouring
mixture was added. After incubation during 20 minutes at 45ºC, the absorbance was
measured at a wavelength of 820 nm and compared to a standard series containing 0 to
8 µg P per 10 ml. Finally, the amount of phospholipids was calculated based on an
average phospholipid molar mass of 750 g/mol (containing 31 g of P per mol). Hence,
CHAPTER II. MATERIALS & METHODS
30
the P-content must be multiplied by about 25 (≈ 750/31) to obtain the PL-content, using
equation 1:
𝜇𝑔𝑃
10𝑚𝐿∗
100𝑚𝐿
0.1𝑚𝐿∗
18𝑚𝐿
0.5𝑔∗
750𝑔
30.97𝑔∗ 100 (1)
Herein:
a) The first term corresponds to the value obtained during colorimetry and
interpolated using a calibration curve.
b) The second term corresponds to the final volume (100 mL) after neutralization,
and to the volume of sample (0.1 mL) taken for the digestion step.
c) The third term corresponds to the sample preparation, as specified in section 2
(18 mL/0.5 g).
d) The fourth term corresponds to the molecular weight of lecithin and phosphorus,
respectively.
Overall, equation (1) indicates that the experimentally determined P-content (in μg
P/10 mL) must be multiplied by a factor of about 9 to obtain the phospholipid content
of the lecithin (expressed in %) provided that 0.1 mL is sampled of a solution of 500
mg per 18 mL of solvent.
3.1.1.4 Inorganic phosphorus determination
In order to assess some hypotheses about the former method, the influence of acids,
triglycerides and lecithin on the detection method described in section 3.1.1.3.3 was
examined.
Tests on samples containing lecithin were run to evaluate the influence of digestion time
on the recovery of phosphorus. Moreover, samples containing inorganic phosphorus
(mono-potassium phosphate) in combination with acids (either including or excluding the
digestion step (heating)), and samples containing inorganic phosphorus in combination
with acids and triglycerides were also evaluated.
3.1.1.4.1 Procedure
An aqueous phosphate solution was prepared: 10.98 mg of KH2PO4 was dissolved in
200 mL of deionised water (sample without acids).
To 4 mL of the previous aqueous phosphate solution, 2 mL of H2SO4 (96%) and 2 mL of
HClO4 (60%) was added. This solution was diluted to 200 mL using deionised water
(sample with acids).

CHAPTER II. MATERIALS & METHODS
31
Once the samples were prepared, the colorimetry step was carried out for both samples,
as described in section 3.1.1.3.3.
To prepare the third sample, 4 mL of the aqueous phosphate solution prepared
previously were mixed with 2 mL of H2SO4 (96%) and 2 mL of HClO4 (60%) in a Kjeldahl
flask (sample without triglycerides). Then, to prepare the fourth sample, 0.5 g of
sunflower oil was dissolved in 18 mL of solvent (hexane). An amount of 100 µL was
mixed with 4 mL of aqueous phosphate solution, 2 mL of H2SO4 (96%) and 2 mL of HClO4
(60%) in a Kjeldahl flask (sample with triglycerides).
The influence of digestion time was examined. Samples were taken after 15, 30, 60 and
120 minutes of heating.
The digested samples were neutralized as explained in section 3.1.1.3.2 and the
colorimetric determination was carried out as in section 3.1.1.3.3
3.1.2 Phosphorus determination using TNT Reagent Set, Low Range
(HACH®)
3.1.2.1 Sample preparation
3.1.2.1.1 Native sample
The de-oiled powdered samples were dissolved in two solvents (water and hexane). For
the water dilution, 0.5 g of powdered lecithin was dispersed in 18 mL of ultrapure water
(Milli-Q), using ultra-sonication. Ultra-sonication is defined as the irradiation of a liquid
sample with ultrasonic (>20 kHz) waves resulting in agitation. Sound waves propagate
into the liquid media and result in alternating high-pressure (compression) and low-
pressure (rarefaction) cycles, creating high local temperatures (Royal Society of
Chemistry).
For the hexane dilution, 0.5 g of powdered lecithin was dissolved in 18 mL of hexane by
magnetic stirring.
Afterwards, the sample was transferred into a volumetric flask and the volume was
adjusted in order to contain a concentration of 0.06-3.5 mg/L of PO43-, as required by the
specifications of the Reagent Set. To that end, 100 µL of the mixture was first
evaporated, and subsequently dispersed in 200 mL of ultrapure water (Milli-Q). If the
lecithin would only contain phospholipids (with a molar mass of 750 g/mol), this
procedure would give rise to a dispersion that contained 1.76 mg/L of phosphate, i.e. half
of the specified maximum.
CHAPTER II. MATERIALS & METHODS
32
For the crude lecithin samples, 1.5 g was dispersed in 18 mL of deionised water. This
amount was calculated taking into account the water content (about 50%) and the oil
content (about 35% of the dry matter) of lecithin sludges (Scholfield, 1981).
3.1.2.1.2 Fractionated sample
100 µL of filtered supernatant (prepared in section 2) was transferred into a 200 mL
volumetric flask. After evaporation of the solvent, deionised water was added up to the
mark in order to stay within the specified range (0.06-3.5 mg/L of phosphate) of the
Reagent Set.
3.1.2.2 Procedure
The procedure followed corresponds to the Total Phosphorus determination by
PhosVer3 Ascorbic Acid Method with acid persulfate digestion (HACH® method 8190).
Hereby, 5 mL of the previously prepared aqueous sample was added to the Total
Phosphorus Test vial, together with the packet of potassium persulfate powder. The vial
was shaken to dissolve the sample and the powder and then was inserted into the reactor
(HACH® slot COD Chemical Oxygen Demand reactor), pre-heated at 150ºC for sample
destruction. After 30 minutes, the vial was taken out and was cooled to room
temperature. Subsequently, 2 mL of 1.54 N NaOH was added to the vial and it was
shaken. Once the HACH® DR/2010 Spectrophotometer was set up with a wavelength of
890 nm, the vial was cleaned (to avoid fingerprints and any other impurities that could
interfere with the UV measurement) and inserted into the 16 mm cell holder and zeroed.
Afterwards the content of one PhosVer3 powder packet (containing ascorbic acid) was
added to the vial, it was shaken and after 2 min reaction time, the vial was cleaned and
inserted into the 16 mm cell holder to read the result.
3.2 Phosphorus nuclear magnetic resonance measurement (31P-NMR
Spectroscopy)
Phosphorus nuclear magnetic resonance (31P-NMR) was used to analyse native and
fractionated lecithin samples.
3.2.1 Materials
NMR tubes (Routine NMR tubes 600 MHz; 5x178 mm (7"), Bruker)
Deuterated water (99.8 atom%; Armar Chemicals)
Sodium deoxycholate (98%, dry matter; Sigma-Aldrich Bioxtra)
Glyphosate Pestanal ® (Sigma-Aldrich)
CHAPTER II. MATERIALS & METHODS
33
3.2.2 Sample preparation
3.2.2.1 Method I
Samples were prepared adding 200 mg (20 mg.mL-1) lecithin to a mixture of 5 mL
deionised water and 5 mL D2O (ratio 1:1), which also contained 1.11 g of sodium
deoxycholate (10% (w/w)), 7.44 mg of Na-EDTA (2 mM; Acros Organics) and 1.69 mg
glyphosate (1 mM) as internal standard for quantification, as described previously by
Kasinos et al. (2014). The samples were then stirred until a homogeneous solution was
obtained, after which the pH was adjusted to 8.0 with NaOH (1M).
3.2.2.2 Method II
Method II is based on a method developed by SynBioc at Ghent University (Stevens et
al., 2014). Samples were prepared weighing an amount of lecithin between 700 mg and
900 mg, to which 5.3 mg triphenyl phosphate (internal standard) was added. To this
mixture, 1 mL of chloroform and 1 mL of Cs-EDTA (0.2 M, pH 8) were added. This
mixture was vortexed until obtaining a homogeneous solution. Then, after addition of 1
mL of methanol and two droplets of D2O, it was stirred (magnetic stirrer) for 1 min and
centrifuged for 4 min at 4000 rpm. The lower phase (organic phase) is sampled and
poured into an NMR tube for analysis.
3.2.3 Procedure
The NMR tubes were filled (over a height of about 4 cm) with the samples.
31P NMR spectra were obtained using a Bruker Ascend 400 (Rheinstetten, Germany)
operating at a 31P frequency of 161.98 MHz, equipped with a BBIFO 5 mm probe. Inverse
gated proton decoupling was used for suppression of the Nuclear Overhauser Effect
(NOE). Measurements were performed at 25ºC and the temperature was controlled to
within ± 0.01ºC. The following instrument settings were used: 131072 data points, 30
excitation pulse, and number of scans = 256 with a 10.00 s. relaxation delay time and a
decay acquisition time of 5.38 s. The solvent for method I was D2O and for method II
chloroform.
3.3 Determination of the nitrogen content using the Kjeldahl method
The Kjeldahl-method is based on the wet combustion of a sample by heating with
concentrated sulphuric acid in the presence of metallic catalysts to effect the reduction
of organic nitrogen in the sample to ammonia, which is retained in a solution as
ammonium sulphate. It is commonly used for protein quantification, but in this case, it is
used to quantify the nitrogen-containing phospholipids.

CHAPTER II. MATERIALS & METHODS
34
3.3.1 Materials
3.3.1.1 Reagents
Concentrated sulphuric acid (density: 1.84 g/ml)
K2SO4
CuSO4
NaOH (50%) + thiosulphate solution (8 w/w %)
Deionised water
Boric acid indicator solution (2 % boric acid (W/V) + 0.75 % Mish indicator
(V/V)
Hydrochloric acid (0.05 N)
3.3.1.2 Apparatus
Kjeldahl tube
Destruction equipment
Steam distillation equipment (Kjeltec)
3.3.2 Sample preparation
For soybean and sunflower lecithin, 15 mL of supernatant (prepared as described in
section 2) was taken for the analysis. Hereby, the solvent was evaporated once the
supernatant was in the Kjeldahl tube.
For corn lecithin, 0.5 g of lecithin was taken for the analysis. The water that was present
in the sludge was evaporated before weighing and adding the reagents.
3.3.3 Procedure
3.3.3.1 Destruction
Samples were transferred in a Kjeldahl tube. A glass pearl was added, as well as 10 mL
H2SO4, 0.5 g CuSO4 and 5 g K2SO4. The destruction was carried out in a destruction
block until a clear solution was obtained, to get complete breakdown of all organic matter
(about 1.5 h). The tubes rested until room temperature was reached.
3.3.3.2 Distillation
The tubes were placed in the distillation equipment. Here, 30 mL of a NaOH/thiosulphate
solution was added, and the ammonia was distilled into a 20 mL boric acid indicator
solution.
CHAPTER II. MATERIALS & METHODS
35
The resulting solution was further titrated with 0.05 N HCl, until a colour change from
brilliant green to purple was observed.
3.3.3.3 Calculation
The amount of nitrogen-containing phospholipids (i.e. PC, PE and PS) was estimated
based on an average molar mass of 750 g/mol phospholipids:
𝑔 𝑁𝑃𝐿
15 𝑚𝑙 𝑠𝑢𝑝𝑒𝑟𝑛𝑎𝑡𝑎𝑛𝑡= N × V × 750 (2)
N = normality of the HCl (N)
V = volume used of HCl (L)
NPL = Nitrogen-containing phospholipids
3.3.4 Determination of Nitrates and Ammonia
Because of the crude nature of the corn lecithin sample, also inorganic nitrogen was
measured separately.
3.3.4.1 Sample preparation
Corn lecithin was diluted in order to obtain a concentration within the detection range
(maximum of 20 mg N/L), in this case 1.5 g of corn lecithin (moisture content of about
50%) was dissolved in 500 mL deionised water, using ultra-sonication.
3.3.4.2 Procedure
Once the sample was prepared, it was delivered to the ISOFYS department at Ghent
University for its analysis. The analyses run were based on Auto-Analyser Multi-test
Methods. The samples were filtered before injection into the Auto-Analyser.
For nitrate determination (G-287-02), the nitrate in the sample is reduced to nitrite by a
copper-cadmium reduction coil at pH of 8.0. The nitrite ion then reacts with sulfanilamide
under acidic conditions to form a diazo compound. This compound then couples with N-
1-naphthylenediamine dihydrochloride to form a reddish-purple azo dye, which is
colorimetrically measured at 520 nm.
For ammonia determination (G-102-93), the sample is reacted with salicylate and
dichloroisocyanuric acid to produce a blue compound, which is measured at 660 nm
(nitroprusside is used as a catalyst).

CHAPTER II. MATERIALS & METHODS
36
3.4 Moisture content of corn lecithin samples
The moisture content was determined using the oven-drying method. The method is
based on measuring the mass of the sample before and after the water is removed by
evaporation at 105°C:
%𝑚𝑜𝑖𝑠𝑡𝑢𝑟𝑒 = 𝑖𝑛𝑖𝑡𝑖𝑎𝑙 𝑚𝑎𝑠𝑠−𝑓𝑖𝑛𝑎𝑙 𝑚𝑎𝑠𝑠
𝑖𝑛𝑖𝑡𝑖𝑎𝑙 𝑚𝑎𝑠𝑠 × 100 (3)
The basic principle of this technique is that water has a lower boiling point than the other
major components (not taking into account volatiles, which are lost during the process
and are not quantified).
3.4.1 Materials
Aluminium petri dish
Forced Convection Oven
Dessicator
Balance
3.4.2 Procedure
About 5 g of lecithin sludge was weighed in an aluminium petri dish (previously weighed).
It was taken into the oven for the drying process to start. The oven was pre-heated at
105ºC. The weight was determined on a daily basis until a constant mass was reached
(3 days). Calculations were done using equation (3).
4. Functionality
4.1 Oil-in-Water emulsion preparation
Five wt-% oil-in-water emulsions were prepared. First, each of the supernatants
(prepared in section 2) were poured in a round-bottom flask, to evaporate the solvent
using a rotary evaporator (rotavapor). 0.12 g of the remaining fractionated lecithin is
added to 18.88 g of a 0.02 wt-% NaN3 solution (0.02 g NaN3 was weighed and deionised
water was added to a total of 100 g).
These samples were put in an ultra-sonication bath until the mixture was homogeneous,
after which 1 g of sunflower oil (100%, Carrefour) was added and a pre-emulsion was
formed by mixing at 24000 rpm for 5 minutes, using an Ultraturrax S25-10G (IKA®-
Werke, Germany). This pre-emulsion was further processed by using a Microfluidizer
(M-110S) at 840 bar for 1 minute of recirculation through a water bath at 25°C.
The resultant emulsions were stored at 5ºC and the droplet size determined directly after
preparation (day 0) and after 1, 4 and 23 days of storage.
CHAPTER II. MATERIALS & METHODS
37
Before each analysis, samples were shaken to homogenize the emulsion.
4.2 Droplet size distribution measurement
The droplet size of each O/W emulsion was measured using two techniques.
For the first technique, a laser diffraction particle size analyser (Mastersizer 3000,
Malvern Instruments Ltd) was used. This technique is applied to measure particles with
a diameter between 0.05 and 900 μm. Data-analysis was performed using the Mie
theory, whereby he refractive index of the material (sunflower oil) was set to 1.465 +
0.01i, whereas the refractive index of the continuous phase was 1.33. Samples were
diluted in deionised water until an obscuration between 2 and 6%, with a shear speed of
1500 rpm.
The values taken into account for the discussions correspond to the volume-weighted
mean diameter (D4,3) of all the particle volumes forming the entire emulsion, which is
calculated according to equation (4):
𝐷4,3 =∑ 𝑛𝑖 ∗ 𝑑𝑖
4
∑ 𝑛𝑖 ∗ 𝑑𝑖3
Where n = number of particles and d = diameter.
Second, an analysis with Photon Correlation Spectroscopy (PCS) was performed, which
is also known as Dynamic Light Scattering. The latter technique can only be used to
evaluate the size of nanoparticles. The equipment consisted of a 15 mW He-Ne laser, a
spectrometer PCS-100 SM (Malvern) and digital correlator K7032CN (Malvern).
Analyses were performed at 25°C and at a scattering angle of 150°.
4.3 1D pfg NMR profilometry of Oil-in-Water emulsions
One dimensional pulsed field gradient NMR profilometry (1D pfg NMR) is used to
characterize the cream layer of the O/W emulsion. The advantages of this method are
that it is fast and non-destructive (Vermeir, 2011).
The application of low-field 1D pfg NMR profilometry is based on the manipulation of the
strength of the applied magnetic field on the precession of the spin, derived from the
Larmor frequency. Hence, the water content at different positions is correlated to the
NMR signal intensity at different frequencies. Due to the exponential decay of transverse
relaxation, the acquired signal intensity (I) is a function of the signal intensity at time zero
(I0), of the time at which the signal is acquired (t), and of the transverse relaxation time
(T2) of the sample (Wuxin, et al., 2011):
(4)
CHAPTER II. MATERIALS & METHODS
38
𝐼
𝐼𝑜= 𝑒𝑥𝑝
−𝑡𝑇2
Profilometric analysis was performed with a Maran Ultra 23 spectrometer, using a script
in the RINMR software, as described by Vermeir (2011). Measurements were performed
at 5°C, with a frequency offset of 46508.22 Hz and an inversion time (τ-value) of 6 ms,
unless stated differently.
As water and oil have different T2-relaxation times, it should be possible to filter out the
oil signal in 1D pfg-NMR profilometry. Theoretically, increasing the inversion time will
lead to a complete annulation of the oil signal, as shown in figure 4, where 𝑡 = 2 ∗ 𝜏. At
a τ-value of at least 100 ms, the oil signal (I/Io) should be nearly completely eliminated,
whereas the water signal is still relatively unaffected. The triangles in figure 4 represent
the ratio of the relative water to oil signal. Whereas this ratio increases with τ, still a too
large τ -value is not desirable as the water signal itself becomes reduced and hence
more susceptible to experimental noise.
Figure 4: Simulated relative response of oil and water as a function of twice the inversion time (tau-value)
To confirm this simulated response, the optimal τ-value was determined.
As the measurement window is located between 22 and 47 mm (Wuxin et al., 2011), the
tubes were filled up to 40 mm with a sample containing 30 mm of deionised water and
10 mm of sunflower oil. Afterwards the optimal settings were applied to characterize the
cream layer of O/W emulsions.
4.3.1 Sample preparation
Emulsions were prepared as indicated in section 4.1, after which they were poured into
NMR tubes until a height of about 40 mm. Tubes were kept at 5°C, to allow them to
cream.
1D pfg NMR profiles were determined at day 4, day 22, day 30 and day 50.
1.00E+00
1.00E+02
1.00E+04
1.00E+06
1.00E+08
0
0.5
1
1.5
0 500 1000 1500 2000 2500
ratio
I/Io
t (ms)
oil water oil/water
(5)

CHAPTER II. MATERIALS & METHODS
39
4.4 Effect of mono- and multi-valent ions on lecithin-stabilized Water-
in-Oil emulsions
Lecithins are widely used as O/W emulsifiers. Previous research indicated that their
emulsifying activity in W/O applications was poor. As multivalent ions are known to bind
strongly to the phosphate headgroup of phospholipids, this might reduce the negative
charge of the headgroup and as such the degree of hydration. According to the oriented
wedge theory, the subsequent increase in surfactant number should be beneficial for the
W/O emulsifying properties of the lecithins.
W/O-emulsions containing different concentrations of mono- and multi-valent ions in the
water phase were prepared in order to qualify the effect of these elements on the
emulsion’s stability.
In addition, different concentrations of lecithin in the oil phase were used to evaluate the
influence of lecithin concentration on the stability of emulsions containing mono- and
multi-valent ions.
4.4.1 Emulsion preparation
The emulsions were prepared by mixing an oil phase (70% w/w) with a water phase
(30% w/w) previously prepared as described below.
4.4.1.1 Oil phase
12 g of soybean lecithin was weighed after which sunflower oil (100%, Carrefour) was
added until a total mass of 150 g (8 wt-%). This mixture is heated until 60°C and stirred
for 10 minutes using a magnetic stirrer. The same procedure was used to obtain 0.01,
0.05, 0.1, 0.5, 2 and 4 wt-% lecithin in oil.
4.4.1.2 Water phase
Different concentrations of salts were prepared:
Sodium chloride (NaCl) was used as mono-valent salt. Hereby, 374.08 mg NaCl was
dissolved in 50 mL of deionised water (128 mM). This solution was further diluted to
obtain concentrations of 8 mM and 32 mM.
Calcium chloride (CaCl2.2H2O) was used to have di-valent counterions: 470.4 mg
CaCl2.2H2O was dissolved in 50 mL of deionised water (64 mM). This water phase was
then diluted to obtain 1 mM, 2 mM, 4 mM, 8 mM and 16 mM.

CHAPTER II. MATERIALS & METHODS
40
As tri-valent salt, cerium chloride (CeCl3.7H2O) was used: 525 mg of CeCl3.7H2O was
dissolved in 50 mL of deionised water (28.18 mM). This water phase was then diluted to
obtain concentrations of 7.05 mM, and 1.76 mM.
4.4.1.3 Preparation
14 gram of oil phase at 60 °C was mixed at 6500 rpm with an Ultra-Turrax S25-10G
(IKA®-Werke, Germany) for 1 minute while adding gradually 6 gram of the water phase.
The emulsion was further homogenized by mixing for five additional minutes at 17500
rpm.
4.4.2 Centrifugation
Centrifugation is one of the most important techniques used in analytical chemistry,
which uses the centrifugal force to separate 2 phases based on their density (Orozco,
1998). In this case, it is used to accelerate the phase separation of W/O emulsions
prepared with soybean lecithin in combination with mono and multivalent ions, with the
purpose to have a descriptive evaluation of the separated phases.
In this sense, W/O emulsions were centrifuged at 4200 rpm for 1 hour (Sigma 3-16P,
rotor 11180, VWR® 50 mL tubes).
4.4.3 Light Microscopy
W/O emulsions were evaluated under the microscope to assess the droplet size in the
different concentrations. Image acquisition was conducted using an optical microscope
(Olympus Cx40) with a 100x magnification coupled with a digital camera (AxioCam ERc
5S).
4.5 Electrophoretic mobility
Electrophoresis is defined as the migration of charged colloidal particles or molecules
through a stationary medium under the influence of an applied electric field. The
electrophoretic mobility (μ) of a charged particle is defined as the ratio between its
stationary velocity (vc) and the applied electric field (E) (Landers, 2007),
𝜇 =𝑣𝑐
𝐸 [
𝜇𝑚∗𝑐𝑚
𝑠∗𝑉]
Different Ce3+ to lecithin ratios were prepared in order to see the influence of tri-valent
ions on the charge of lecithin in dispersion.
(6)
CHAPTER II. MATERIALS & METHODS
41
4.5.1 Sample preparation
A suspension containing 0.2 wt-% lecithin in 30 mL of water containing different CeCl3
concentrations was prepared.
To prepare the CeCl3 stock solutions, 0.993 g CeCl3.7H2O was weighed and dissolved
in 1 L deionised water. Four additional CeCl3 solutions were prepared from this stock
solution by diluting 2, 3, 4 and 5 times.
The electrophoretic mobility of each sample was measured five times at 25°C.
5. Statistical analysis
To evaluate the phospholipids content in soybean lecithin and sunflower lecithin, a paired
test was performed, to assess the difference between both, based on TNT Reagent Set
(HACH®) test results.
To evaluate the influence of fractionation on the stability of the O/W emulsion over time,
a two way Analysis of Variance (ANOVA) was performed, assessing the effect of the
amount of water added and of time on the droplet size. Also interaction between amount
of water added and time was checked. After which a post hoc analysis with 2-sided
Tukey’s HSD with a family-wise error type at the 95% confidence level was performed,
comparing in first place, the droplet size of samples with water added to the droplet size
of native samples and in second place, comparing droplet size over time to droplet size
at day 0.
All tests were run with a 5% level of significance. The software used for the analysis was
Spotfire S+ 8.2.

42
CHAPTER III
Results and discussion
CHAPTER III. RESULTS & DISCUSSION
43
1. Fractionation
Edible oils are degummed after extraction as one of the first steps of the refining process,
with the aim of removing phosphatides and other impurities.
The degumming process consists of adding water to the oil at high temperature. In this
sense, phosphatides will become hydrated and thereby, oil-insoluble. A further
centrifugation step will separate the gum phase from the oil phase.
Münch (2007) mentioned that the hydration of phosphatides depends on the phosphorus
containing-head group, the larger the head group the more hydratable is the
phosphatide, i.e. PC is the largest, hence the most hydratable and PA is the smallest,
hence the least hydratable.
In this work, lecithin was dissolved in a hexane/isopropanol mixture after which different
amounts of water were added. Once the water was added, the samples were stirred for
one hour obtaining a transparent yellow brownish solution, which was kept overnight to
settle, allowing compounds to hydrate, which forced their separation from the solvent
phase (which contained the phospholipids). In this case, the intention was to hydrate
residual impurities and separate them from the solvent phase.
It is clear that the objective was to enhance the lecithin emulsification properties.
Nevertheless, some phospholipids may have migrated to the water phase because of
their amphiphilic behaviour and some of them may be lost since equilibrium needs to be
reached to have a complete phase separation (Dijkstra & Van Opstal, 1989).
After settling, a visual observation revealed that some sediment was formed at the
bottom of the lecithin solutions, as expected. The amount of sediment seemed to
increase with increasing water content. The supernatant was collected and filtered.
In order to give more comprehensible and easy reading results, some abbreviations are
used regarding samples that have been fractionated. In this sense, 0 mL corresponds to
the fractionated sample with 0 mL water added, 0.4 mL corresponds to the fractionated
sample with 0.4 mL water added, and the same principle is applied to 0.8 mL and 1.6
mL. The native sample corresponds to the lecithin sample that has not been fractionated
neither filtrated and that was dispersed in deionised water.
The corn lecithin sample could not be fractionated as this crude lecithin sample already
contained about 50% water. Therefore, only native samples were analysed.
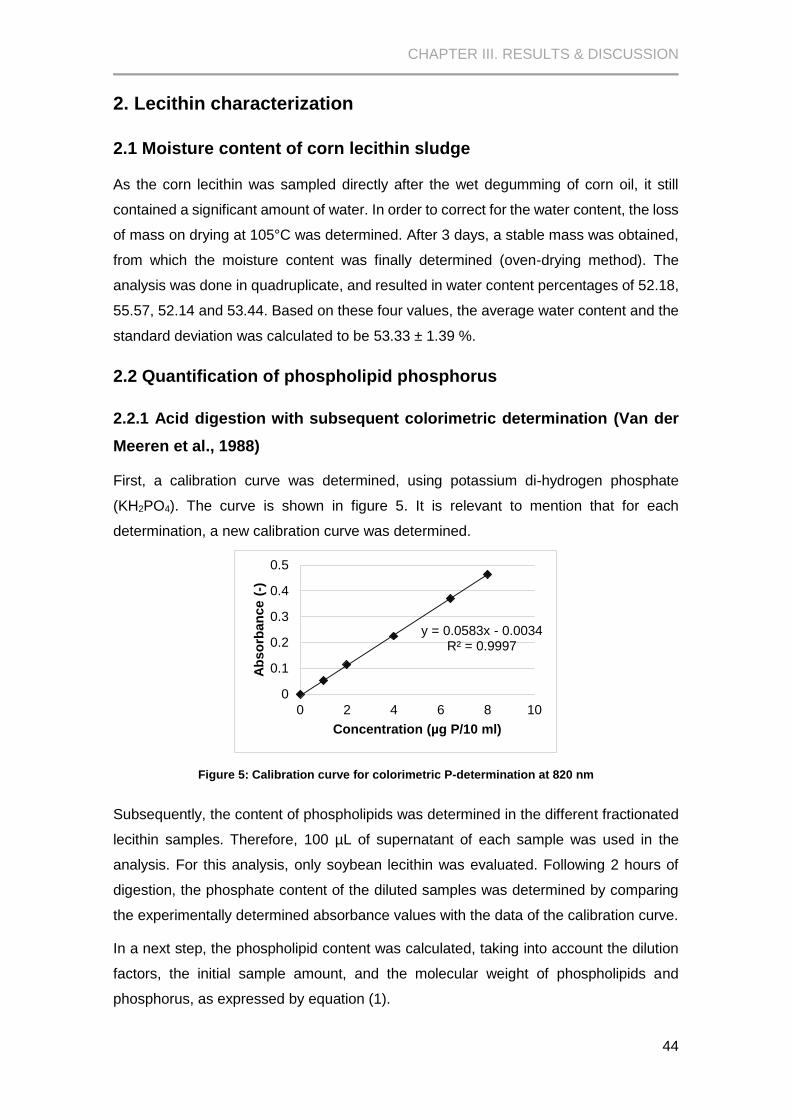
CHAPTER III. RESULTS & DISCUSSION
44
2. Lecithin characterization
2.1 Moisture content of corn lecithin sludge
As the corn lecithin was sampled directly after the wet degumming of corn oil, it still
contained a significant amount of water. In order to correct for the water content, the loss
of mass on drying at 105°C was determined. After 3 days, a stable mass was obtained,
from which the moisture content was finally determined (oven-drying method). The
analysis was done in quadruplicate, and resulted in water content percentages of 52.18,
55.57, 52.14 and 53.44. Based on these four values, the average water content and the
standard deviation was calculated to be 53.33 ± 1.39 %.
2.2 Quantification of phospholipid phosphorus
2.2.1 Acid digestion with subsequent colorimetric determination (Van der
Meeren et al., 1988)
First, a calibration curve was determined, using potassium di-hydrogen phosphate
(KH2PO4). The curve is shown in figure 5. It is relevant to mention that for each
determination, a new calibration curve was determined.
Figure 5: Calibration curve for colorimetric P-determination at 820 nm
Subsequently, the content of phospholipids was determined in the different fractionated
lecithin samples. Therefore, 100 µL of supernatant of each sample was used in the
analysis. For this analysis, only soybean lecithin was evaluated. Following 2 hours of
digestion, the phosphate content of the diluted samples was determined by comparing
the experimentally determined absorbance values with the data of the calibration curve.
In a next step, the phospholipid content was calculated, taking into account the dilution
factors, the initial sample amount, and the molecular weight of phospholipids and
phosphorus, as expressed by equation (1).
y = 0.0583x - 0.0034R² = 0.9997
0
0.1
0.2
0.3
0.4
0.5
0 2 4 6 8 10
Ab
so
rban
ce (
-)
Concentration (µg P/10 ml)
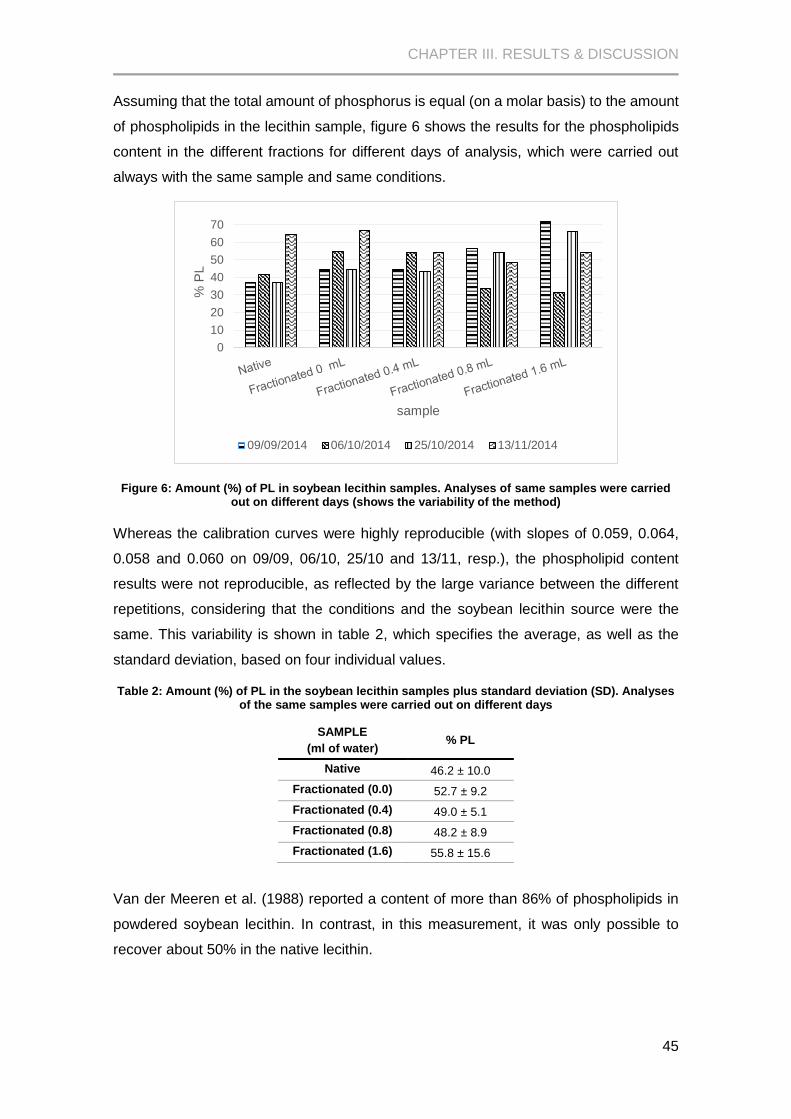
CHAPTER III. RESULTS & DISCUSSION
45
Assuming that the total amount of phosphorus is equal (on a molar basis) to the amount
of phospholipids in the lecithin sample, figure 6 shows the results for the phospholipids
content in the different fractions for different days of analysis, which were carried out
always with the same sample and same conditions.
Figure 6: Amount (%) of PL in soybean lecithin samples. Analyses of same samples were carried out on different days (shows the variability of the method)
Whereas the calibration curves were highly reproducible (with slopes of 0.059, 0.064,
0.058 and 0.060 on 09/09, 06/10, 25/10 and 13/11, resp.), the phospholipid content
results were not reproducible, as reflected by the large variance between the different
repetitions, considering that the conditions and the soybean lecithin source were the
same. This variability is shown in table 2, which specifies the average, as well as the
standard deviation, based on four individual values.
Table 2: Amount (%) of PL in the soybean lecithin samples plus standard deviation (SD). Analyses of the same samples were carried out on different days
SAMPLE
(ml of water) % PL
Native 46.2 ± 10.0
Fractionated (0.0) 52.7 ± 9.2
Fractionated (0.4) 49.0 ± 5.1
Fractionated (0.8) 48.2 ± 8.9
Fractionated (1.6) 55.8 ± 15.6
Van der Meeren et al. (1988) reported a content of more than 86% of phospholipids in
powdered soybean lecithin. In contrast, in this measurement, it was only possible to
recover about 50% in the native lecithin.
0
10
20
30
40
50
60
70
% P
L
sample
09/09/2014 06/10/2014 25/10/2014 13/11/2014
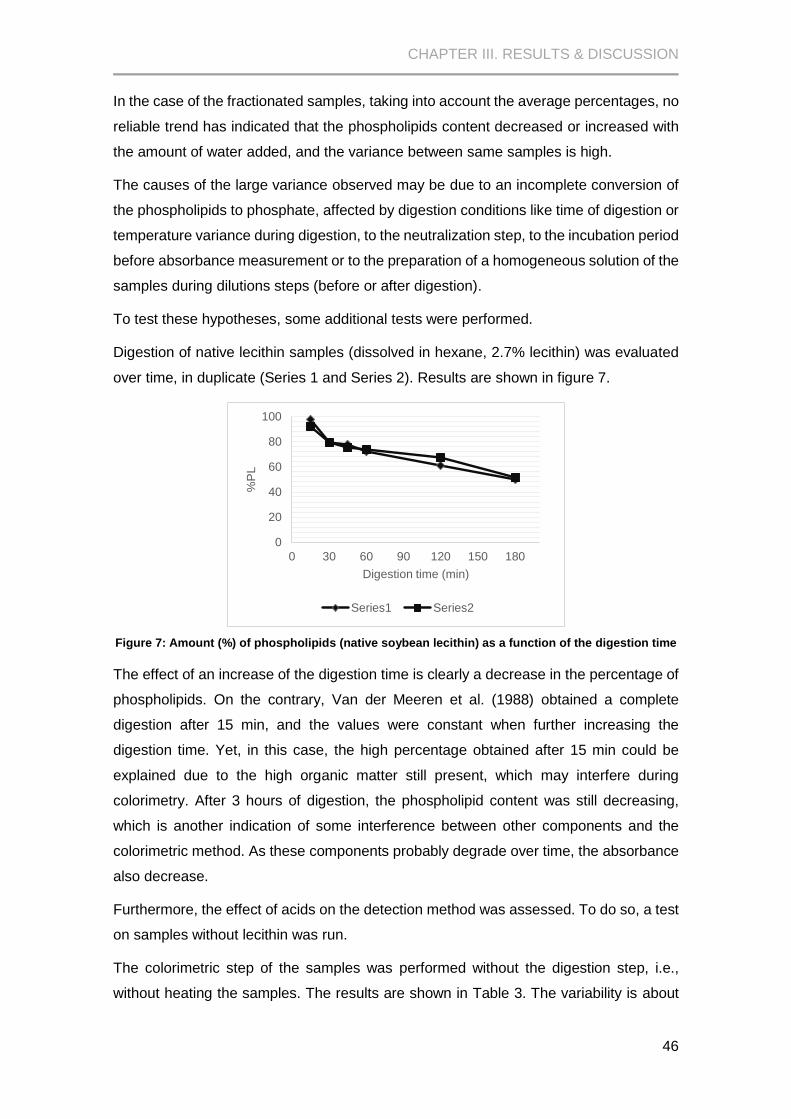
CHAPTER III. RESULTS & DISCUSSION
46
In the case of the fractionated samples, taking into account the average percentages, no
reliable trend has indicated that the phospholipids content decreased or increased with
the amount of water added, and the variance between same samples is high.
The causes of the large variance observed may be due to an incomplete conversion of
the phospholipids to phosphate, affected by digestion conditions like time of digestion or
temperature variance during digestion, to the neutralization step, to the incubation period
before absorbance measurement or to the preparation of a homogeneous solution of the
samples during dilutions steps (before or after digestion).
To test these hypotheses, some additional tests were performed.
Digestion of native lecithin samples (dissolved in hexane, 2.7% lecithin) was evaluated
over time, in duplicate (Series 1 and Series 2). Results are shown in figure 7.
Figure 7: Amount (%) of phospholipids (native soybean lecithin) as a function of the digestion time
The effect of an increase of the digestion time is clearly a decrease in the percentage of
phospholipids. On the contrary, Van der Meeren et al. (1988) obtained a complete
digestion after 15 min, and the values were constant when further increasing the
digestion time. Yet, in this case, the high percentage obtained after 15 min could be
explained due to the high organic matter still present, which may interfere during
colorimetry. After 3 hours of digestion, the phospholipid content was still decreasing,
which is another indication of some interference between other components and the
colorimetric method. As these components probably degrade over time, the absorbance
also decrease.
Furthermore, the effect of acids on the detection method was assessed. To do so, a test
on samples without lecithin was run.
The colorimetric step of the samples was performed without the digestion step, i.e.,
without heating the samples. The results are shown in Table 3. The variability is about
0
20
40
60
80
100
0 30 60 90 120 150 180
%P
L
Digestion time (min)
Series1 Series2

CHAPTER III. RESULTS & DISCUSSION
47
1% (based on absorbance), with a loss of phosphorus (100% corresponds to 5µg per 10
mL), which indicates that acids have no interference on the detection method.
Table 3: Amount of inorganic phosphorus measured using colorimetry without heating step, where 100% equals 5 µg P per 10ml
Sample Absorbance
(-)
Concentration of P
(µg P/10ml)
With acid added 0.270 4.46
0.285 4.71
Without acid added 0.280 4.63
0.300 4.96
Additionally, the influence of digestion time was evaluated on samples without lecithin,
but containing inorganic phosphorus with and without triglycerides.
The phosphorus content of the samples without triglycerides over time is shown in figure
8, from where it is possible to see that the concentration of phosphorus is on average,
12% less than expected (not considering the samples at 15 min), i.e., less than 5 µg per
10 mL. However, after 30 min of digestion, the recovery was almost constant, with an
average and standard deviation of 4.41±0.01 µg P/10mL.
The sample taken after 15 min digestion cannot be considered reliable. At simple visual
inspection, the sample still was yellowish coloured.
Figure 8: P-concentration as a function of digestion time when no triglycerides were added
For the samples with triglycerides, the phosphorus content over time is shown in Figure
9. The graph clearly shows a decrease of phosphorus content over time, which was the
same trend observed with lecithin samples. The expected concentration was 5 µg per
10 mL.
3.95
4.40 4.41 4.40
3.0
3.5
4.0
4.5
0 20 40 60 80 100 120
Con
ce
ntr
atio
n O
f P
(μ
gP
/10
ml)
Digestion time (min)
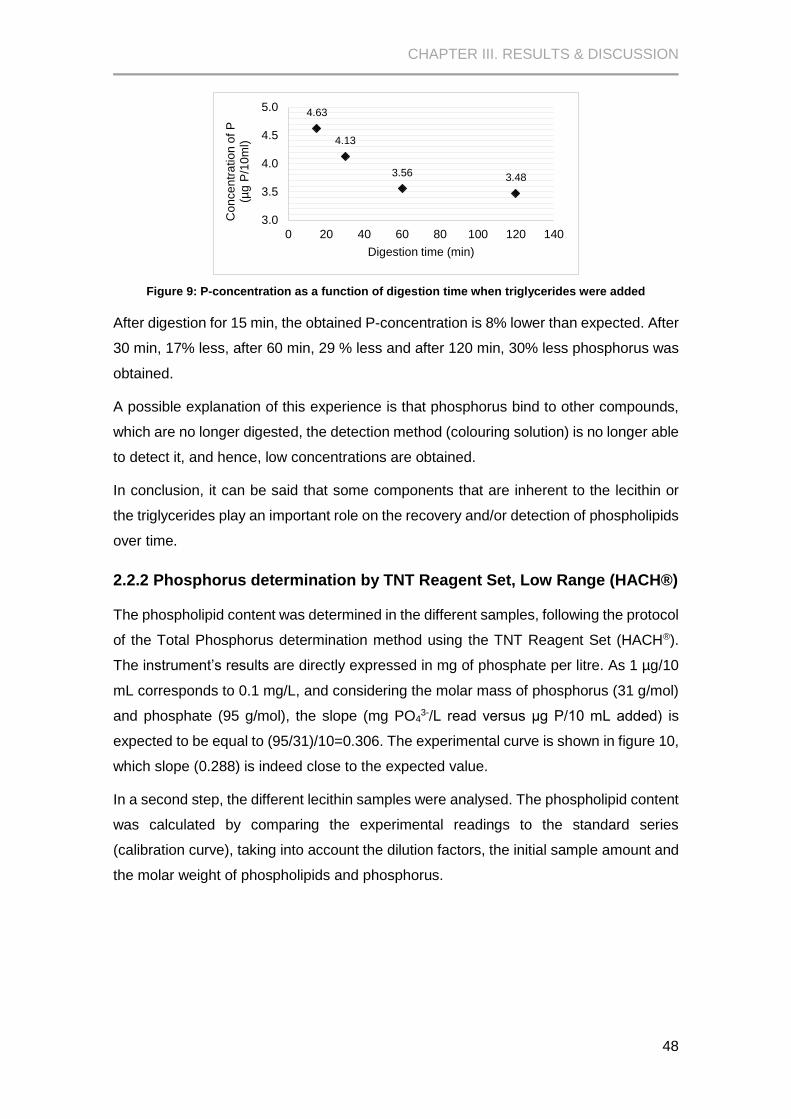
CHAPTER III. RESULTS & DISCUSSION
48
Figure 9: P-concentration as a function of digestion time when triglycerides were added
After digestion for 15 min, the obtained P-concentration is 8% lower than expected. After
30 min, 17% less, after 60 min, 29 % less and after 120 min, 30% less phosphorus was
obtained.
A possible explanation of this experience is that phosphorus bind to other compounds,
which are no longer digested, the detection method (colouring solution) is no longer able
to detect it, and hence, low concentrations are obtained.
In conclusion, it can be said that some components that are inherent to the lecithin or
the triglycerides play an important role on the recovery and/or detection of phospholipids
over time.
2.2.2 Phosphorus determination by TNT Reagent Set, Low Range (HACH®)
The phospholipid content was determined in the different samples, following the protocol
of the Total Phosphorus determination method using the TNT Reagent Set (HACH®).
The instrument’s results are directly expressed in mg of phosphate per litre. As 1 µg/10
mL corresponds to 0.1 mg/L, and considering the molar mass of phosphorus (31 g/mol)
and phosphate (95 g/mol), the slope (mg PO43-/L read versus μg P/10 mL added) is
expected to be equal to (95/31)/10=0.306. The experimental curve is shown in figure 10,
which slope (0.288) is indeed close to the expected value.
In a second step, the different lecithin samples were analysed. The phospholipid content
was calculated by comparing the experimental readings to the standard series
(calibration curve), taking into account the dilution factors, the initial sample amount and
the molar weight of phospholipids and phosphorus.
4.63
4.13
3.56 3.48
3.0
3.5
4.0
4.5
5.0
0 20 40 60 80 100 120 140C
on
ce
ntr
atio
n o
f P
(µ
gP
/10
ml)
Digestion time (min)
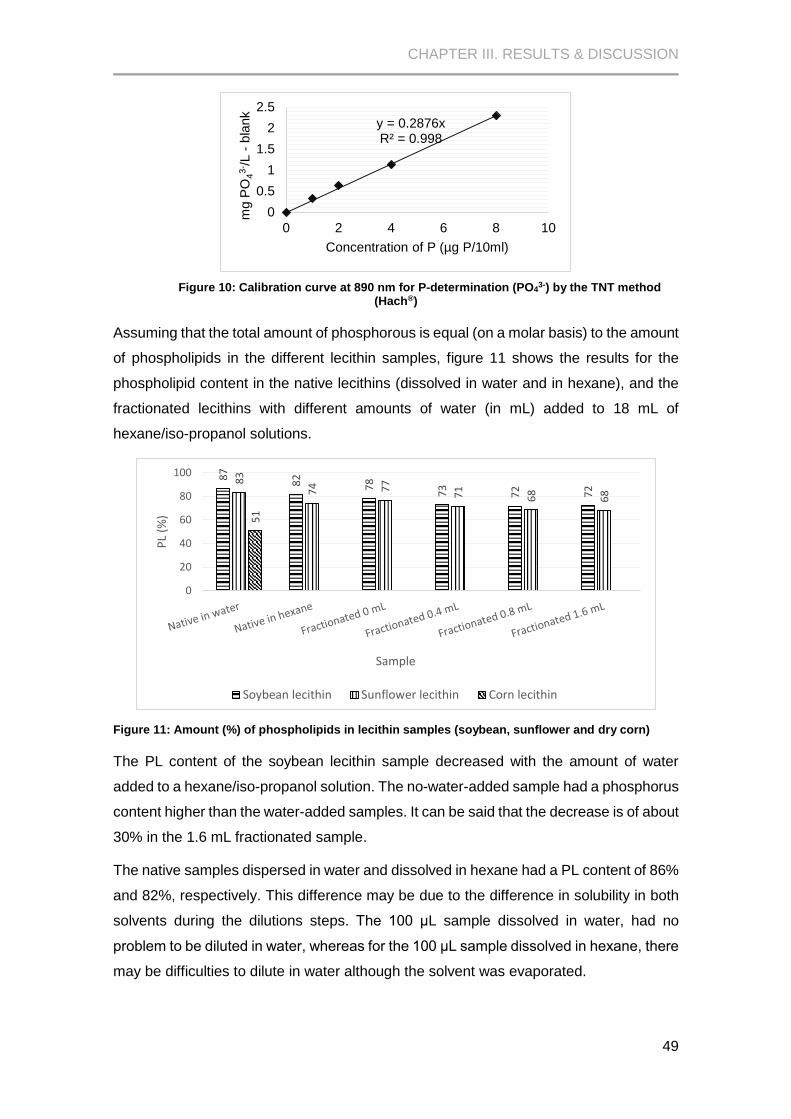
CHAPTER III. RESULTS & DISCUSSION
49
Figure 10: Calibration curve at 890 nm for P-determination (PO43-) by the TNT method
(Hach®)
Assuming that the total amount of phosphorous is equal (on a molar basis) to the amount
of phospholipids in the different lecithin samples, figure 11 shows the results for the
phospholipid content in the native lecithins (dissolved in water and in hexane), and the
fractionated lecithins with different amounts of water (in mL) added to 18 mL of
hexane/iso-propanol solutions.
Figure 11: Amount (%) of phospholipids in lecithin samples (soybean, sunflower and dry corn)
The PL content of the soybean lecithin sample decreased with the amount of water
added to a hexane/iso-propanol solution. The no-water-added sample had a phosphorus
content higher than the water-added samples. It can be said that the decrease is of about
30% in the 1.6 mL fractionated sample.
The native samples dispersed in water and dissolved in hexane had a PL content of 86%
and 82%, respectively. This difference may be due to the difference in solubility in both
solvents during the dilutions steps. The 100 μL sample dissolved in water, had no
problem to be diluted in water, whereas for the 100 μL sample dissolved in hexane, there
may be difficulties to dilute in water although the solvent was evaporated.
y = 0.2876xR² = 0.998
0
0.5
1
1.5
2
2.5
0 2 4 6 8 10m
g P
O4
3- /L -
bla
nk
Concentration of P (µg P/10ml)
87
82
78
73
72 72
83
74 77
71
68
68
51
0
20
40
60
80
100
PL
(%)
Sample
Soybean lecithin Sunflower lecithin Corn lecithin

CHAPTER III. RESULTS & DISCUSSION
50
The PL content of the sunflower lecithin followed the same trend, i.e. it decreased with
the amount of water added during fractionation. In this sense, the decrease is about 25%
in the case of 1.6 mL sample. The native samples dispersed in water and dissolved in
hexane had a PL content of 83% and 74%, respectively.
Furthermore, the PL content of the corn lecithin was lower compared with the other
lecithin. Dispersing the corn lecithin in water, the phospholipid content resulted in about
50% based on dry basis.
Comparing the soybean phospholipid content to the sunflower phospholipid content, the
mean sunflower phospholipids content was significally different from the mean soybean
phospholipids content (p-value=0.0162). In all samples, soybean lecithin had a higher
phospholipid content. In the case of fractionated samples, both lecithins presented a
decreasing trend with the addition of water during fractionation.
These results indicate that to obtain the same phospholipid content as soybean lecithin,
a higher amount of sunflower or corn lecithin is necessary because the phospholipid
content is lower in the latter lecithin samples.
2.3 Phosphorus nuclear magnetic resonance measurement (31P-NMR
Spectroscopy)
31P-NMR Spectroscopy was used for the analysis of the phospholipid composition of
native and fractionated samples of soybean lecithin, and native sunflower and corn
lecithin, to see if there is a difference in phospholipid composition, next to phospholipid
content. Hence, the question is whether the water-induced precipitation (fractionation) is
selective for some phospholipids.
First, a comparison between the two sample preparation methods was performed.
Therefore, soybean lecithin was sampled and samples for 31P-NMR were prepared
following method I and method II. The peaks obtained were similar, the main
phospholipids where identified in both spectra, although some chemical shifts were
identified as well. It is important to mention that the chemical shifts of phospholipids
depend on a series of variables, among which are temperature, pH, solvent, sample
matrix, and the fatty acid chains attached to the phospholipids, which cannot be fully
controlled because it is inherent to the phospholipids (Kaffarnik et al., 2013).
For the fractionated soybean lecithin samples and sunflower and corn native lecithin
samples, method I was used because of its easy preparation procedure. Besides, during
phase separation in method II, there could be some migration of phospholipid to the
methanol phase, which is unwanted.

CHAPTER III. RESULTS & DISCUSSION
51
The spectra obtained from native lecithin samples and fractionated lecithin samples are
shown in appendix I.
Concerning fractionated soybean lecithin samples, the phospholipids peaks were
identified. With a simple visual inspection, there was not a big difference between the
fractionated lecithin samples. Therefore, peak integration was needed. After integration,
a trend could be discerned. The peak areas related to native and fractionated soybean
lecithin showed the same trend that was obtained in section 3.2, a decrease of total
phospholipid content as the amount of water added during fractionation increased.
The relative peak areas of individual phospholipids are shown in table 4. The PC, PI and
PE peak areas of soybean lecithin were decreased as the amount of water added during
fractionation increased compared to native soybean lecithin.
Table 4: Relative peak areas* derived from 31P-NMR spectra from native and fractionated lecithin samples
Phospholipid
Native lecithin Fractionated soybean lecithin
Corn Sunflower Soybean 0 mL 0.8 mL 1.6 mL
PC 17.69 43.56 32.12 32.44 31.04 30.96
PE 26.85 17.88 23.52 25.50 25.06 23.88
PI 17.99 23.50 18.13 16.54 16.25 15.19
PS 15.19 3.13 2.55 6.83 6.05 7.89
PA 6.68 4.73 11.54 9.13 10.45 10.00
GPC 3.12 1.24 2.55 4.71 4.57 4.34
LPI 4.79 1.16 4.20 3.86 4.91 4.95
LPC 6.20 4.80 3.20 - - -
LPA 1.48 - 2.19 1.68 1.86 1.69
* from phosphatidic acid (PA), phosphatidylethanolamine (PE), phosphatidylinositol (PI),
phosphatidylcholine (PC), lysophosphatidylcholine (LPC), lysophosphatidylinositol (LPI), lysophosphatidic
acid (LPA), glycerophosphorylcholine (GPC), phosphatidyl serine (PS).
The high content of phosphatidyserine (PS) found in fractionated soybean lecithin,
compared to the native sample, could be explained due to the fact that peak integration
could include PS and LPC peaks, since no LPC area was possible to obtain (the peak
was too small).
Furthermore, comparing soybean native lecithin with sunflower native and corn lecithin,
there is also a clear difference. The PC content is higher in sunflower lecithin than in
soybean lecithin and in corn lecithin. Therefore, PCsunflower > PCsoybean > PCcorn, whereas
with PE the trend is different, PEcorn > PEsoybean > PEsunflower, and PI the trend is PIsunflower >
PIsoybean > PIcorn.
The references found in literature are diverse. While van Nieuwenhuyzen & Tomás
(2008), reported a PL content (only for soybean and sunflower) that indicates
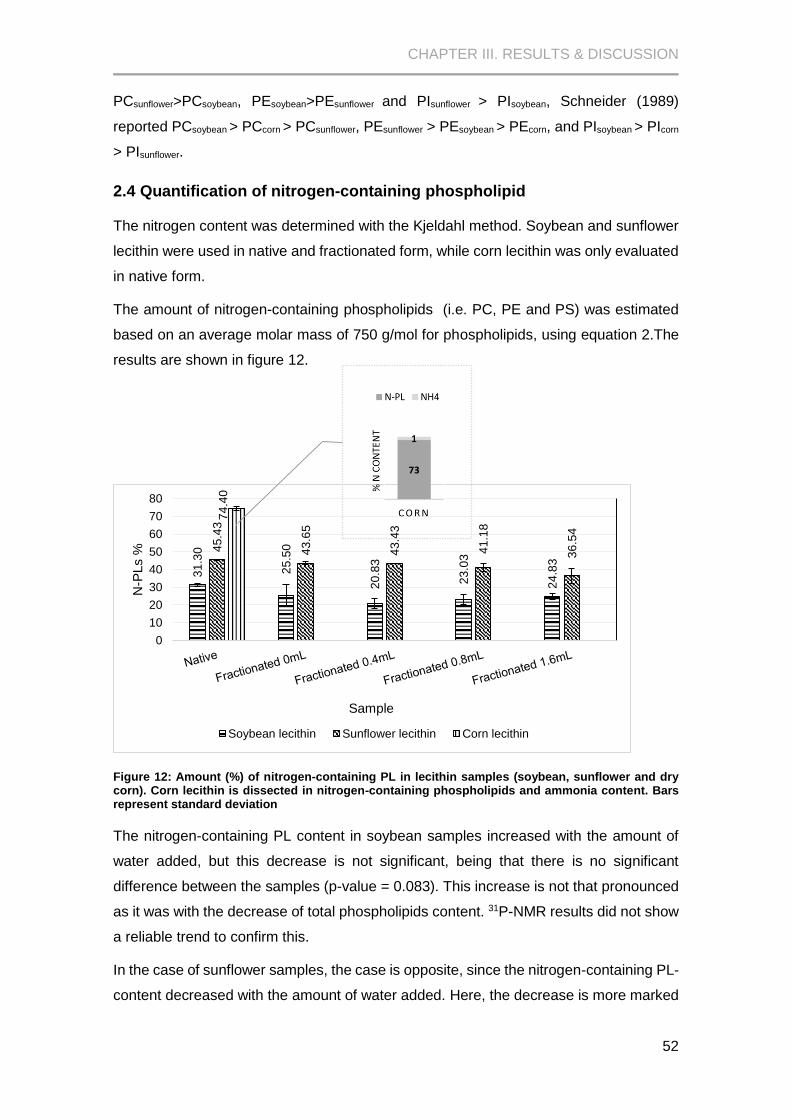
CHAPTER III. RESULTS & DISCUSSION
52
PCsunflower>PCsoybean, PEsoybean>PEsunflower and PIsunflower > PIsoybean, Schneider (1989)
reported PCsoybean > PCcorn > PCsunflower, PEsunflower > PEsoybean > PEcorn, and PIsoybean > PIcorn
> PIsunflower.
2.4 Quantification of nitrogen-containing phospholipid
The nitrogen content was determined with the Kjeldahl method. Soybean and sunflower
lecithin were used in native and fractionated form, while corn lecithin was only evaluated
in native form.
The amount of nitrogen-containing phospholipids (i.e. PC, PE and PS) was estimated
based on an average molar mass of 750 g/mol for phospholipids, using equation 2.The
results are shown in figure 12.
Figure 12: Amount (%) of nitrogen-containing PL in lecithin samples (soybean, sunflower and dry corn). Corn lecithin is dissected in nitrogen-containing phospholipids and ammonia content. Bars represent standard deviation
The nitrogen-containing PL content in soybean samples increased with the amount of
water added, but this decrease is not significant, being that there is no significant
difference between the samples (p-value = 0.083). This increase is not that pronounced
as it was with the decrease of total phospholipids content. 31P-NMR results did not show
a reliable trend to confirm this.
In the case of sunflower samples, the case is opposite, since the nitrogen-containing PL-
content decreased with the amount of water added. Here, the decrease is more marked
31
.30
25
.50
20
.83
23
.03
24
.83
45
.43
43
.65
43
.43
41
.18
36
.54
74
.40
0
10
20
30
40
50
60
70
80
N-P
Ls %
Sample
Soybean lecithin Sunflower lecithin Corn lecithin
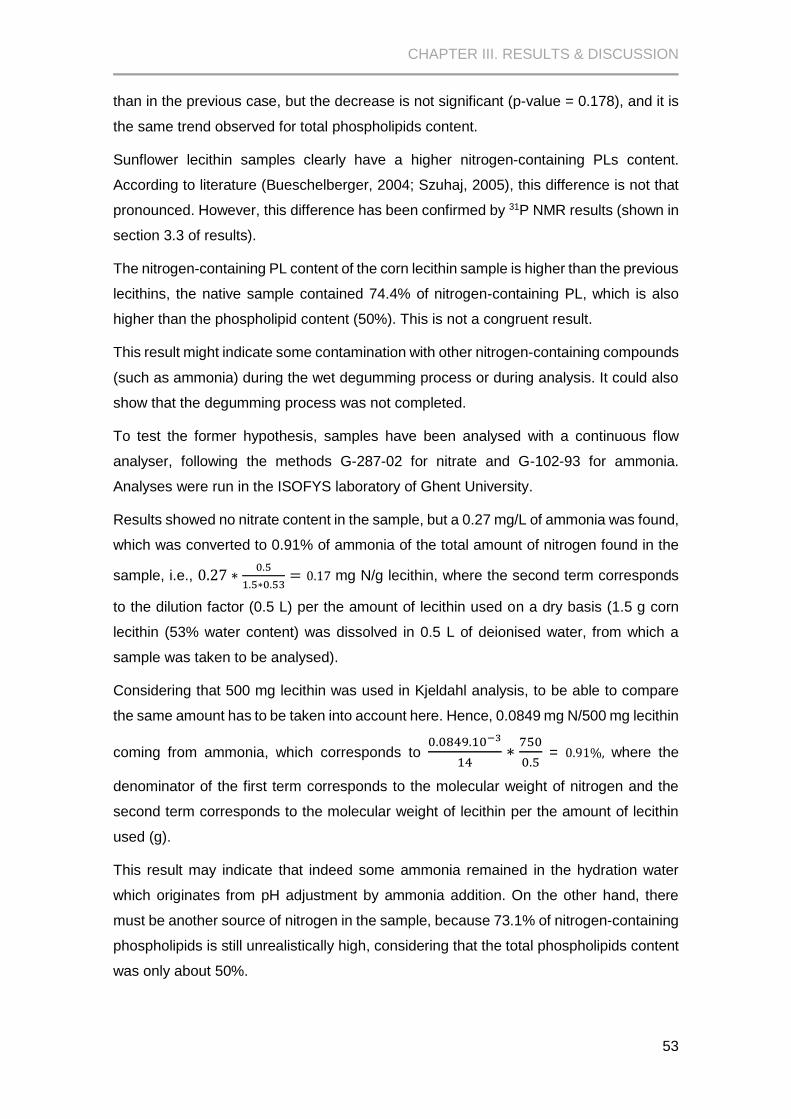
CHAPTER III. RESULTS & DISCUSSION
53
than in the previous case, but the decrease is not significant (p-value = 0.178), and it is
the same trend observed for total phospholipids content.
Sunflower lecithin samples clearly have a higher nitrogen-containing PLs content.
According to literature (Bueschelberger, 2004; Szuhaj, 2005), this difference is not that
pronounced. However, this difference has been confirmed by 31P NMR results (shown in
section 3.3 of results).
The nitrogen-containing PL content of the corn lecithin sample is higher than the previous
lecithins, the native sample contained 74.4% of nitrogen-containing PL, which is also
higher than the phospholipid content (50%). This is not a congruent result.
This result might indicate some contamination with other nitrogen-containing compounds
(such as ammonia) during the wet degumming process or during analysis. It could also
show that the degumming process was not completed.
To test the former hypothesis, samples have been analysed with a continuous flow
analyser, following the methods G-287-02 for nitrate and G-102-93 for ammonia.
Analyses were run in the ISOFYS laboratory of Ghent University.
Results showed no nitrate content in the sample, but a 0.27 mg/L of ammonia was found,
which was converted to 0.91% of ammonia of the total amount of nitrogen found in the
sample, i.e., 0.27 ∗0.5
1.5∗0.53= 0.17 mg N/g lecithin, where the second term corresponds
to the dilution factor (0.5 L) per the amount of lecithin used on a dry basis (1.5 g corn
lecithin (53% water content) was dissolved in 0.5 L of deionised water, from which a
sample was taken to be analysed).
Considering that 500 mg lecithin was used in Kjeldahl analysis, to be able to compare
the same amount has to be taken into account here. Hence, 0.0849 mg N/500 mg lecithin
coming from ammonia, which corresponds to 0.0849.10−3
14∗
750
0.5 = 0.91%, where the
denominator of the first term corresponds to the molecular weight of nitrogen and the
second term corresponds to the molecular weight of lecithin per the amount of lecithin
used (g).
This result may indicate that indeed some ammonia remained in the hydration water
which originates from pH adjustment by ammonia addition. On the other hand, there
must be another source of nitrogen in the sample, because 73.1% of nitrogen-containing
phospholipids is still unrealistically high, considering that the total phospholipids content
was only about 50%.
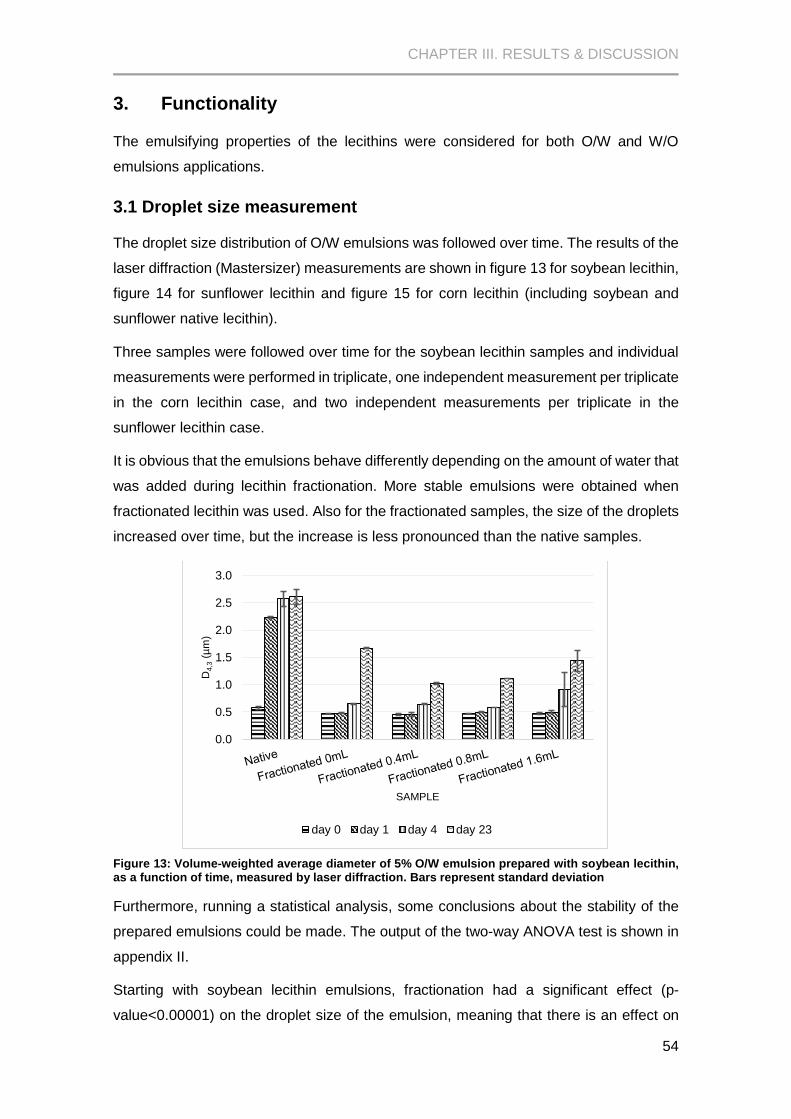
CHAPTER III. RESULTS & DISCUSSION
54
3. Functionality
The emulsifying properties of the lecithins were considered for both O/W and W/O
emulsions applications.
3.1 Droplet size measurement
The droplet size distribution of O/W emulsions was followed over time. The results of the
laser diffraction (Mastersizer) measurements are shown in figure 13 for soybean lecithin,
figure 14 for sunflower lecithin and figure 15 for corn lecithin (including soybean and
sunflower native lecithin).
Three samples were followed over time for the soybean lecithin samples and individual
measurements were performed in triplicate, one independent measurement per triplicate
in the corn lecithin case, and two independent measurements per triplicate in the
sunflower lecithin case.
It is obvious that the emulsions behave differently depending on the amount of water that
was added during lecithin fractionation. More stable emulsions were obtained when
fractionated lecithin was used. Also for the fractionated samples, the size of the droplets
increased over time, but the increase is less pronounced than the native samples.
Figure 13: Volume-weighted average diameter of 5% O/W emulsion prepared with soybean lecithin, as a function of time, measured by laser diffraction. Bars represent standard deviation
Furthermore, running a statistical analysis, some conclusions about the stability of the
prepared emulsions could be made. The output of the two-way ANOVA test is shown in
appendix II.
Starting with soybean lecithin emulsions, fractionation had a significant effect (p-
value<0.00001) on the droplet size of the emulsion, meaning that there is an effect on
0.0
0.5
1.0
1.5
2.0
2.5
3.0
D4,3
(µm
)
SAMPLE
day 0 day 1 day 4 day 23
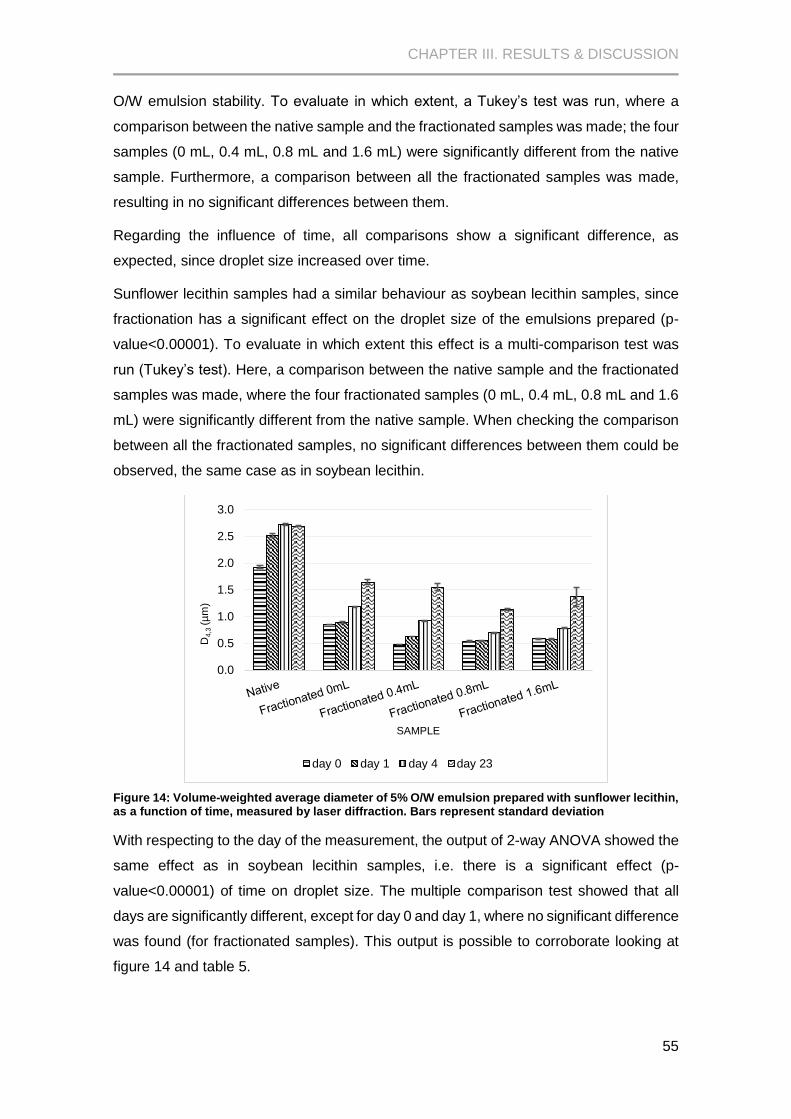
CHAPTER III. RESULTS & DISCUSSION
55
O/W emulsion stability. To evaluate in which extent, a Tukey’s test was run, where a
comparison between the native sample and the fractionated samples was made; the four
samples (0 mL, 0.4 mL, 0.8 mL and 1.6 mL) were significantly different from the native
sample. Furthermore, a comparison between all the fractionated samples was made,
resulting in no significant differences between them.
Regarding the influence of time, all comparisons show a significant difference, as
expected, since droplet size increased over time.
Sunflower lecithin samples had a similar behaviour as soybean lecithin samples, since
fractionation has a significant effect on the droplet size of the emulsions prepared (p-
value<0.00001). To evaluate in which extent this effect is a multi-comparison test was
run (Tukey’s test). Here, a comparison between the native sample and the fractionated
samples was made, where the four fractionated samples (0 mL, 0.4 mL, 0.8 mL and 1.6
mL) were significantly different from the native sample. When checking the comparison
between all the fractionated samples, no significant differences between them could be
observed, the same case as in soybean lecithin.
Figure 14: Volume-weighted average diameter of 5% O/W emulsion prepared with sunflower lecithin, as a function of time, measured by laser diffraction. Bars represent standard deviation
With respecting to the day of the measurement, the output of 2-way ANOVA showed the
same effect as in soybean lecithin samples, i.e. there is a significant effect (p-
value<0.00001) of time on droplet size. The multiple comparison test showed that all
days are significantly different, except for day 0 and day 1, where no significant difference
was found (for fractionated samples). This output is possible to corroborate looking at
figure 14 and table 5.
0.0
0.5
1.0
1.5
2.0
2.5
3.0
D4,3
(µ
m)
SAMPLE
day 0 day 1 day 4 day 23
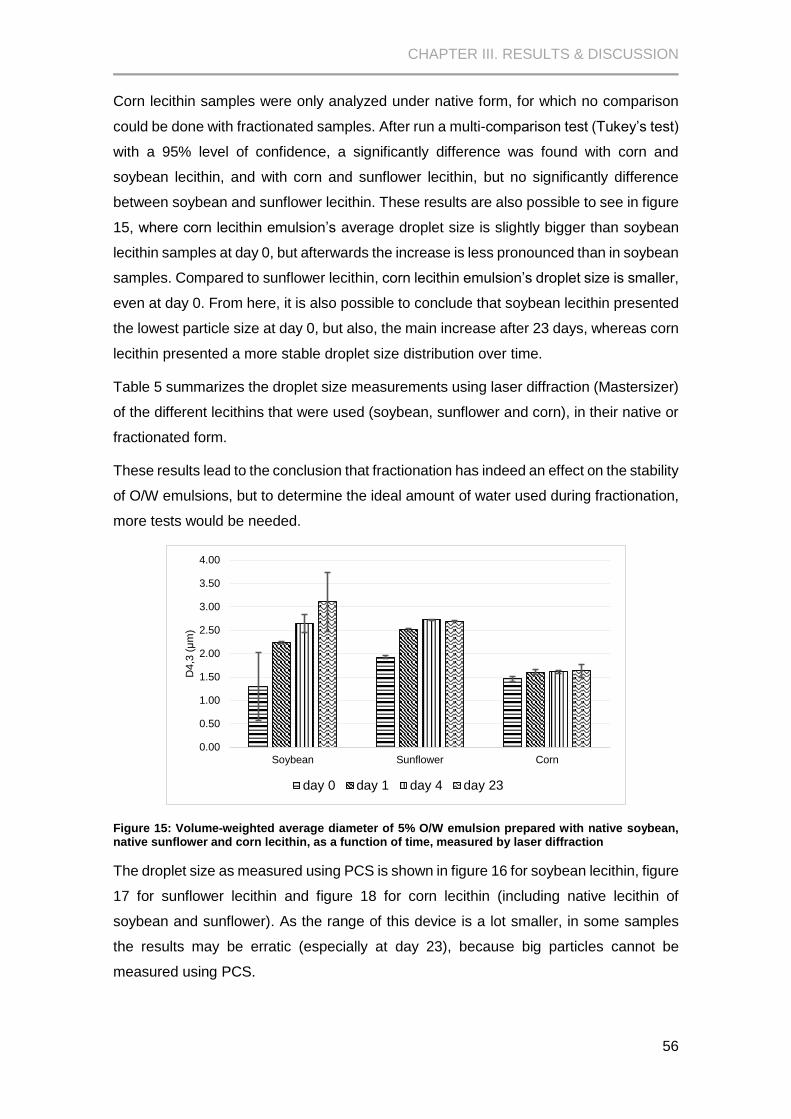
CHAPTER III. RESULTS & DISCUSSION
56
Corn lecithin samples were only analyzed under native form, for which no comparison
could be done with fractionated samples. After run a multi-comparison test (Tukey’s test)
with a 95% level of confidence, a significantly difference was found with corn and
soybean lecithin, and with corn and sunflower lecithin, but no significantly difference
between soybean and sunflower lecithin. These results are also possible to see in figure
15, where corn lecithin emulsion’s average droplet size is slightly bigger than soybean
lecithin samples at day 0, but afterwards the increase is less pronounced than in soybean
samples. Compared to sunflower lecithin, corn lecithin emulsion’s droplet size is smaller,
even at day 0. From here, it is also possible to conclude that soybean lecithin presented
the lowest particle size at day 0, but also, the main increase after 23 days, whereas corn
lecithin presented a more stable droplet size distribution over time.
Table 5 summarizes the droplet size measurements using laser diffraction (Mastersizer)
of the different lecithins that were used (soybean, sunflower and corn), in their native or
fractionated form.
These results lead to the conclusion that fractionation has indeed an effect on the stability
of O/W emulsions, but to determine the ideal amount of water used during fractionation,
more tests would be needed.
Figure 15: Volume-weighted average diameter of 5% O/W emulsion prepared with native soybean, native sunflower and corn lecithin, as a function of time, measured by laser diffraction
The droplet size as measured using PCS is shown in figure 16 for soybean lecithin, figure
17 for sunflower lecithin and figure 18 for corn lecithin (including native lecithin of
soybean and sunflower). As the range of this device is a lot smaller, in some samples
the results may be erratic (especially at day 23), because big particles cannot be
measured using PCS.
0.00
0.50
1.00
1.50
2.00
2.50
3.00
3.50
4.00
Soybean Sunflower Corn
D4,3
(μ
m)
day 0 day 1 day 4 day 23
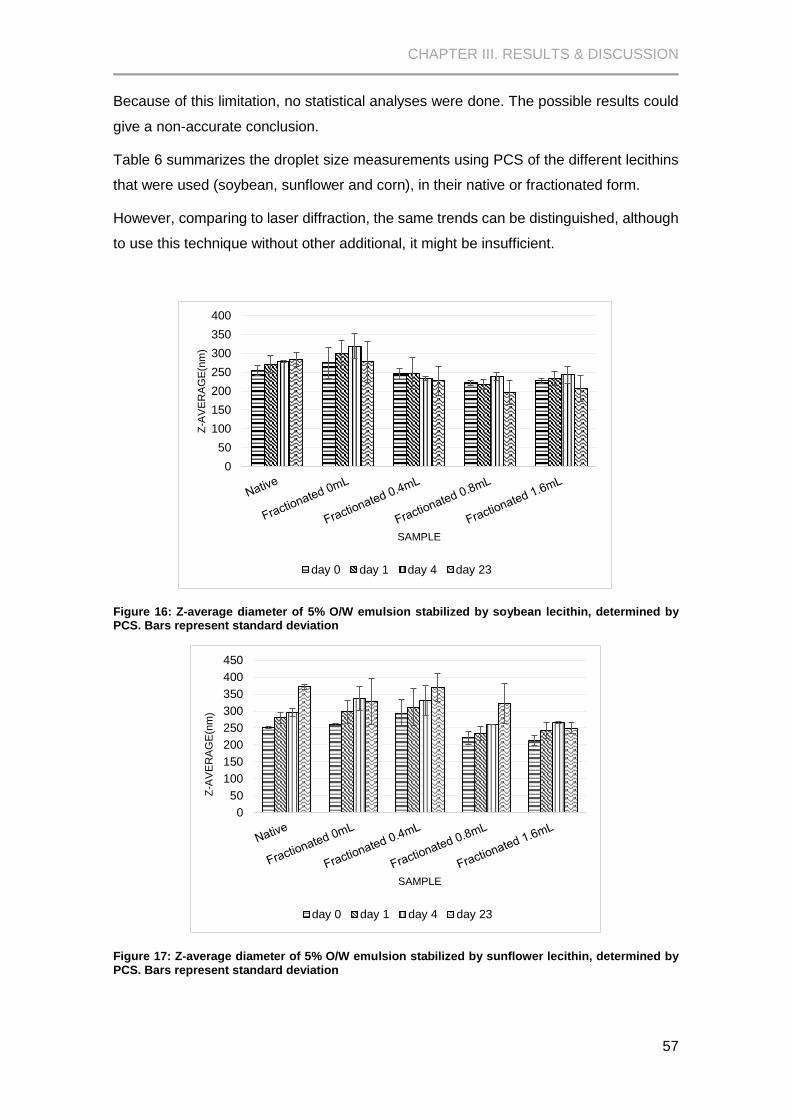
CHAPTER III. RESULTS & DISCUSSION
57
Because of this limitation, no statistical analyses were done. The possible results could
give a non-accurate conclusion.
Table 6 summarizes the droplet size measurements using PCS of the different lecithins
that were used (soybean, sunflower and corn), in their native or fractionated form.
However, comparing to laser diffraction, the same trends can be distinguished, although
to use this technique without other additional, it might be insufficient.
Figure 16: Z-average diameter of 5% O/W emulsion stabilized by soybean lecithin, determined by PCS. Bars represent standard deviation
Figure 17: Z-average diameter of 5% O/W emulsion stabilized by sunflower lecithin, determined by PCS. Bars represent standard deviation
0
50
100
150
200
250
300
350
400
Z-A
VE
RA
GE
(nm
)
SAMPLE
day 0 day 1 day 4 day 23
0
50
100
150
200
250
300
350
400
450
Z-A
VE
RA
GE
(nm
)
SAMPLE
day 0 day 1 day 4 day 23
CHAPTER III. RESULTS & DISCUSSION
58
Table 5: Mean droplet size and standard deviation based on volume-weighted average diameter (µm) of 5% O/W emulsion prepared with lecithin, as a function of time, measured by laser diffraction
Table 6: Mean and standard deviation based on Z-average diameter (nm) of 5% O/W emulsion stabilized by lecithin, determined by PCS
Sample
D4,3 (µm)
day 0 day 1 day 4 day 23
SOYBEAN SUNFLOWER CORN SOYBEAN SUNFLOWER CORN SOYBEAN SUNFLOWER CORN SOYBEAN SUNFLOWER CORN
Native 0.58±0.03 1.92±0.03 1.46±0.06 2.23±0.02 2.72±0.02 1.60±0.06 2.64±0.19 2.51±0.04 1.61±0.04 2.61±0.13 2.69±0.01 1.64±0.14
Fractionated 0mL 0.48±0.01 0.85±0.01 - 0.48±0.01 1.18±0.08 - 0.65±0.01 0.89±0.02 - 1.67±0.01 1.64±0.04 -
Fractionated 0.4mL 0.46±0.02 0.48±0.01 - 0.45±0.03 0.91±0.01 - 0.64±0.01 0.63±0.01 - 1.03±0.02 1.550.07 -
Fractionated 0.8mL 0.47±0.01 0.54±0.01 - 0.50±0.01 0.69±0.06 - 0.59±0.01 0.54±0.01 - 1.12±0.01 1.13±0.01 -
Fractionated 1.6mL 0.48±0.02 0.58±0.09 - 0.50±0.02 0.77±0.01 - 0.91±0.31 0.58±0.02 - 1.44±0.19 1.37±0.18 -
Sample
Z-average (nm)
day 0 day 1 day 4 day 23
SOYBEAN SUNFLOWER CORN SOYBEAN SUNFLOWER CORN SOYBEAN SUNFLOWER CORN SOYBEAN SUNFLOWER CORN
Native 255±13 250±2 188±10 271±23 279±16 189±8 278±2 296±13 192±4 284±18 371±8 225±14
Fractionated 0mL 275±41 257±3 - 300±33 296±32 - 319±33 337±35 - 278±54 328±67 -
Fractionated 0.4mL 246±15 333±40 - 247±41 311±54 - 233±6 331±44 - 227±39 369.65±42 -
Fractionated 0.8mL 221±7 239±18 - 216±13 233±20 - 239±9 260±1 - 197±33 322±59 -
Fractionated 1.6mL 227±7 228±15 - 234.±19 241±22 - 243±2 265±3 - 207±34 249±17 -
CHAPTER III. RESULTS & DISCUSSION
59
Comparing the native samples (figure 18), corn lecithin showed the smallest particle size,
which is similar than laser diffraction results (not considering that soybean lecithin at day
0 had a slightly smaller particle size). The small variation among days in corn lecithin
samples was also observed with laser diffraction. However, what is not observed in laser
diffraction results is the small variation among the soybean samples, this result may be
due to the big size of the particles as well.
Figure 18: Z-average diameter of 5% O/W emulsion stabilized by native soybean, native sunflower and corn lecithin, determined by PCS
3.2 1D pfg NMR profilometry of O/W emulsions
One dimensional pulsed field gradient NMR profilometry (1D pfg NMR) allows to analyse
the extent of creaming of emulsions.
A low profilometry signal intensity is related to a small T2-relaxation time. The T2-
relaxation time is the time it takes for the magnetic resonance signal to decay irreversibly
to 37% of its initial value after its generation by tipping the longitudinal magnetization
towards the magnetic transverse plane. Because molecules have different electron
configuration, different compounds within an emulsion have different T2-relaxation times.
For example, fluids have a much longer T2 than solids and water-based samples have a
higher T2 than oil-based samples (Reich, 2010).
This principle is applied to describe the graphs of figure 19, but first, it is important to
identify the window in which the NMR signal is visible. According to Wuxin et al., (2011),
the range goes from 22 mm to 47 mm. This means that the signal detected by the device
in this case is coming from the top of the filled tube, which contains about 40 mm of
sample. To measure the lower part, it is necessary to elevate the tube. In figure 19, it is
possible to see the different profilometry curves of the different prepared emulsions
containing soybean (A, B, C), sunflower (D, E, F) and corn lecithin (G), respectively. In
0
50
100
150
200
250
300
350
400
Soybean Sunflower Corn
Z-A
VE
RA
GE
(nm
)
day 0 day 1 day 4 day 23

CHAPTER III. RESULTS & DISCUSSION
60
these graphs, the left part (indicating negative frequencies) corresponds to the lower part
of the detection window (i.e. about 22 mm sample height), whereas the right part (with
positive frequencies) corresponds to the upper part of the detection window. The steep
decrease in signal intensity at the right side of the graphs corresponds to the interphase
between the emulsion and air. Hence, creaming should become obvious in this region.
As the water content in the cream layer is smaller than in the bulk emulsion, the cream
layer is expected to give rise to a lower signal intensity.
At simple visual inspection, it is possible to distinguish a cream layer on top of all the
emulsions, but it is more pronounced in native samples and in 0 mL samples. However
it is very hard to see this effect from pictures. Therefore, profilometry was expected to be
a good alternative, and indeed, the visual inspection is corroborated with the graphs
obtained. The cream layer is more pronounced in fractionated samples without added
water, whereas in fractionated samples with added water a decrease in intensity of the
signal is more difficult to identify, which indicates that the phase separation is less
pronounced.
In the case of corn lecithin, at visual inspection, the cream layer is almost invisible,
although the profilometric analysis shows an increase in the cream layer over time, as
shown in figure 19.G. As the droplet size didn’t show a significant increase over time, but
the cream layer was increased, there is a clear indication that coagulation is prone to
occur.
CHAPTER III. RESULTS & DISCUSSION
61
Figure 19: Profilometry curves of 5% O/W emulsions measured over time. A) Fractionated soybean lecithin 0 mL water added. B) Fractionated soybean lecithin 0.8 mL water added. C) Fractionated soybean lecithin 1.6 mL water added. D) Fractionated sunflower lecithin 0 mL water added. E) Fractionated sunflower lecithin 0.8 mL water added. F) Fractionated sunflower lecithin 1.6 mL water added. G) Corn lecithin
0
0.2
0.4
0.6
0.8
1
-0.03 -0.02 -0.01 0
Sig
nal am
plit
ude (
-)
Frecuency (MHz)
0
0.2
0.4
0.6
0.8
1
-0.03 -0.02 -0.01 0
Sig
nal A
mplit
ude
(-)
Frequency (MHz)
0
0.2
0.4
0.6
0.8
1
-0.03 -0.02 -0.01 0
Sig
nal am
plit
ude (
-)
Frequency (MHz)
0
0.2
0.4
0.6
0.8
1
-0.03 -0.02 -0.01 0
Sig
nal am
plit
ude (
-)
Frequency (MHz)
0
0.2
0.4
0.6
0.8
1
-0.03 -0.02 -0.01 0
Sig
nal am
plit
ude (
-)
Frequency (MHz)
0
0.2
0.4
0.6
0.8
1
-0.03 -0.02 -0.01 0
Sig
nal am
plit
ude (
-)
Frequency (MHz)
0
0.2
0.4
0.6
0.8
1
-0.03 -0.02 -0.01 0Sig
nal am
plit
ude (
-)
Frequency (MHz)
DAY 4 DAY 22 DAY 30
B)
C) D)
E) F)
G)
A)
CHAPTER III. RESULTS & DISCUSSION
62
Further efforts were done to try to minimize the oil signal, i.e. the inversion time has been
increased in order to evaluate the effect on the oil signal. The results are shown in figure
20. Here, the sample containing 30 mm of water and 10 mm of oil was measured at
different τ-values. A clear distinction between water and oil layer can be observed. Even
at a τ of 6 ms, the trend is visible (as in figure 19).
Figure 20: Signal intensity of the sample containing 30 mm water and 10 mm oil as a function of applied inversion time
The distribution obtained for the measurement with τ=50 ms has a very low maximum,
therefore this sample was measured three times, obtaining a high signal variability. To
avoid this variability, one can divide the signal by the maximal value, and obtain a relative
signal intensity.
At τ = 100 ms the oil signal is completely eliminated, for which reason this inversion time
was selected and used to measure the lecithin-stabilized O/W-emulsions. It is important
to mention that the emulsions used in this case are the same emulsions used for previous
case (τ = 6 ms), but measured at day 50.
Figure 21 clearly shows the differences between the 0 mL sample, 0.4 mL and 1.6 mL
of soybean lecithin, although no big difference can be seen between 0.4 mL and 1.6 mL.
This effect was also visible with τ = 6 ms.
0
0.2
0.4
0.6
0.8
1
-0.027 -0.017 -0.007 0.003
Sig
nal
inte
nsit
y (
-)
Frequency shift (Hz)
Tau = 6 ms Tau = 25 msTau = 50 ms Tau = 100 ms
Water layer Oil layer
CHAPTER III. RESULTS & DISCUSSION
63
Figure 21: Rescaled signal intensity of O/W-emulsions stabilized using (fractionated) soybean lecithin after 50 days of storage
The same trend is visible for sunflower lecithin, as shown in figure 22, although the
difference is smaller than soybean lecithin and the frequency shift is bigger which hinders
the comparison.
Figure 22: Rescaled signal intensity of O/W-emulsions stabilized using (fractionated) sunflower lecithin after 50 days of storage
Figure 23 show the differences between corn lecithin and 0 mL sample of soybean and
sunflower lecithin. The thickest cream layer is obtained when corn or soybean lecithin
are used, whereas sunflower lecithin showed the thinnest layer.
0
0.2
0.4
0.6
0.8
1
-0.025 -0.02 -0.015 -0.01 -0.005 0
Sig
nal in
tensity
(-)
Frequency shift (Hz)
soybean, 0 mL soybean, 0.8 mLsoybean, 1.6 mL
0
0.2
0.4
0.6
0.8
1
-0.025 -0.02 -0.015 -0.01 -0.005 0
Sig
nal in
tensity
(-)
Frequency shift (Hz)Sunflower, 0 mL Sunflower, 0.8 mLSunflower, 1.6 mL
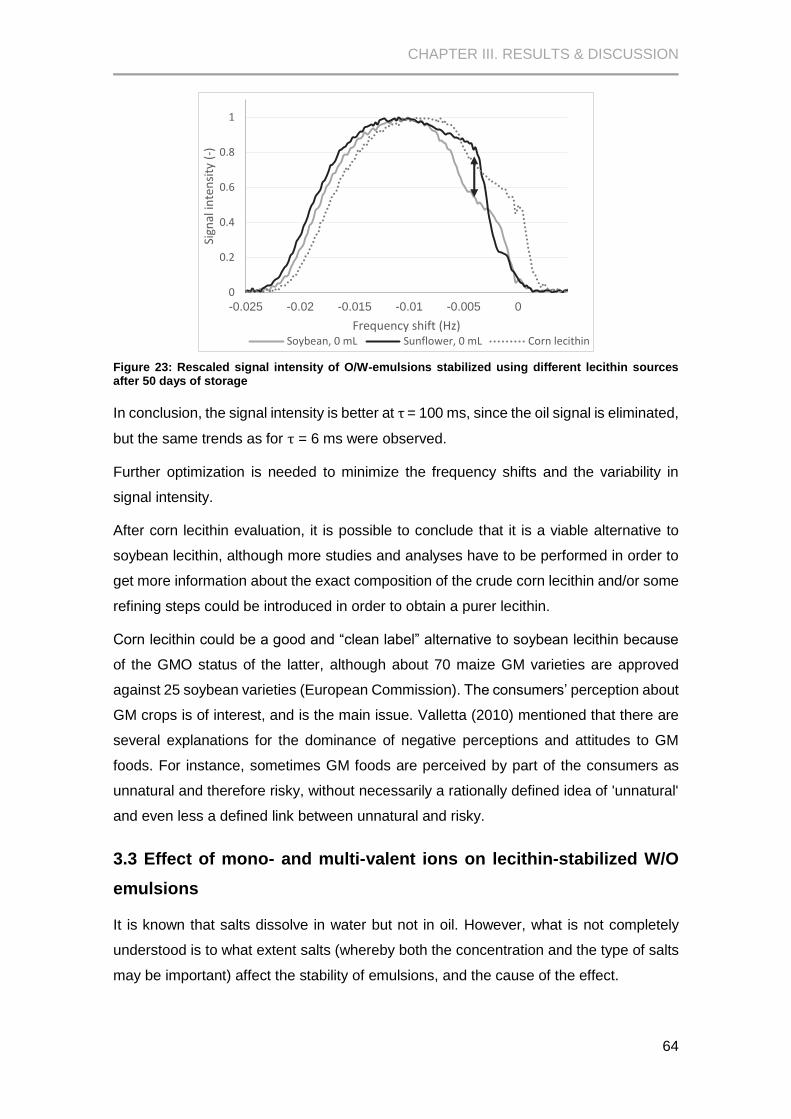
CHAPTER III. RESULTS & DISCUSSION
64
Figure 23: Rescaled signal intensity of O/W-emulsions stabilized using different lecithin sources after 50 days of storage
In conclusion, the signal intensity is better at τ = 100 ms, since the oil signal is eliminated,
but the same trends as for τ = 6 ms were observed.
Further optimization is needed to minimize the frequency shifts and the variability in
signal intensity.
After corn lecithin evaluation, it is possible to conclude that it is a viable alternative to
soybean lecithin, although more studies and analyses have to be performed in order to
get more information about the exact composition of the crude corn lecithin and/or some
refining steps could be introduced in order to obtain a purer lecithin.
Corn lecithin could be a good and “clean label” alternative to soybean lecithin because
of the GMO status of the latter, although about 70 maize GM varieties are approved
against 25 soybean varieties (European Commission). The consumers’ perception about
GM crops is of interest, and is the main issue. Valletta (2010) mentioned that there are
several explanations for the dominance of negative perceptions and attitudes to GM
foods. For instance, sometimes GM foods are perceived by part of the consumers as
unnatural and therefore risky, without necessarily a rationally defined idea of 'unnatural'
and even less a defined link between unnatural and risky.
3.3 Effect of mono- and multi-valent ions on lecithin-stabilized W/O
emulsions
It is known that salts dissolve in water but not in oil. However, what is not completely
understood is to what extent salts (whereby both the concentration and the type of salts
may be important) affect the stability of emulsions, and the cause of the effect.
0
0.2
0.4
0.6
0.8
1
-0.025 -0.02 -0.015 -0.01 -0.005 0
Sign
al in
ten
sity
(-)
Frequency shift (Hz)Soybean, 0 mL Sunflower, 0 mL Corn lecithin
CHAPTER III. RESULTS & DISCUSSION
65
In water, lecithin can self-assemble into characteristic structures such as micelles and
vesicles, driven by hydrophobic and electrostatic interactions. It is known that salts
reduce the CMC (critical micelle concentration) when added to suspensions containing
surfactants, reducing the electrostatic repulsions between the head-groups of the
surfactants, which facilitates micelle formation and assembly into cylindrical structures
(Israelachvili, 1991). But, in oil, the effect of salts is not that well studied. It is known that
reverse self-assembly of amphiphilies can also occur in oil, but compared with water,
lecithin in oil may not have a well-defined CMC (Lee et al., 2010).
In this case, mono- and multi-valent ions were added to the water phase of the W/O
emulsions stabilized with lecithin, and a macroscopic and microscopic examination was
performed. Some theories and hypotheses about the self-assembly of lecithin in the
emulsion are also discussed.
All emulsions obtained corresponded to W/O emulsions, as verified with a simple drop
dilution test. The latter is based on the fact that W/O emulsion droplets will not disperse
in water, based on the solubility of the external phase of the emulsion. All emulsions,
formed a creamy sediment, containing flocculates. These flocculates vary in size and
consistency depending on the type of salt and the salt concentration.
Regarding the effect of bi-valent ions, shown in figure 24, the floc size decreased as the
concentration of CaCl2 increased, but at 32mM CaCl2 the floc size increased again,
which gives an idea of a possible ideal salt concentration (16 mM). At this concentration
the molar ratio of lecithin to Ca2+ was about 15:1, which is based on the concentration
and volume of lecithin solution (in oil) and the concentration and volume of Ca2+- solution
(in water): from a 30/70 (m/m) W/O emulsion, 0.3 ∗ 𝐶𝑖𝑜𝑛 (mol/kg) to 0.7∗𝑤𝑡%𝑙𝑒𝑐𝑖𝑡ℎ𝑖𝑛
100∗0.750
(mol/kg), where Cion corresponds to the ion concentration used, wt% lecithin corresponds
to the lecithin concentration used, and 0.750 is the molecular weight of lecithin in kg/mol.
This same approach is used in the following cases.
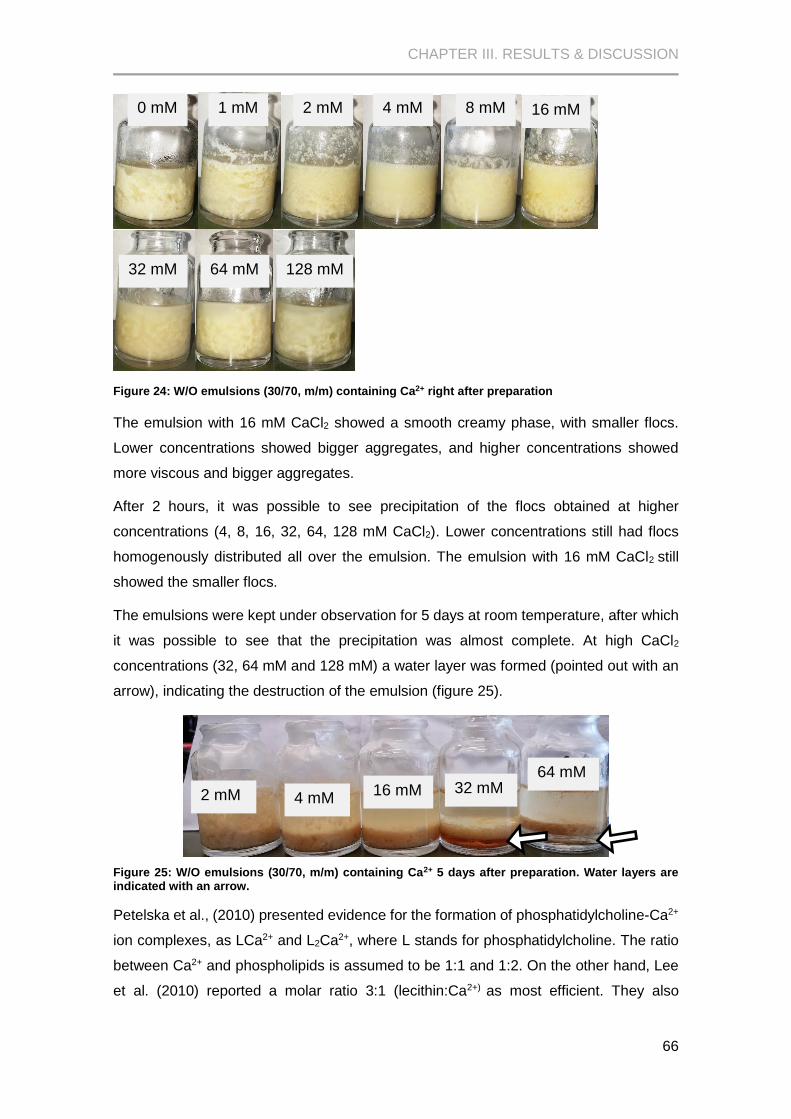
CHAPTER III. RESULTS & DISCUSSION
66
Figure 24: W/O emulsions (30/70, m/m) containing Ca2+ right after preparation
The emulsion with 16 mM CaCl2 showed a smooth creamy phase, with smaller flocs.
Lower concentrations showed bigger aggregates, and higher concentrations showed
more viscous and bigger aggregates.
After 2 hours, it was possible to see precipitation of the flocs obtained at higher
concentrations (4, 8, 16, 32, 64, 128 mM CaCl2). Lower concentrations still had flocs
homogenously distributed all over the emulsion. The emulsion with 16 mM CaCl2 still
showed the smaller flocs.
The emulsions were kept under observation for 5 days at room temperature, after which
it was possible to see that the precipitation was almost complete. At high CaCl2
concentrations (32, 64 mM and 128 mM) a water layer was formed (pointed out with an
arrow), indicating the destruction of the emulsion (figure 25).
Figure 25: W/O emulsions (30/70, m/m) containing Ca2+ 5 days after preparation. Water layers are indicated with an arrow.
Petelska et al., (2010) presented evidence for the formation of phosphatidylcholine-Ca2+
ion complexes, as LCa2+ and L2Ca2+, where L stands for phosphatidylcholine. The ratio
between Ca2+ and phospholipids is assumed to be 1:1 and 1:2. On the other hand, Lee
et al. (2010) reported a molar ratio 3:1 (lecithin:Ca2+) as most efficient. They also
0 mM 1 mM 2 mM 4 mM 8 mM 16 mM
32 mM 64 mM 128 mM
2 mM 4 mM 16 mM 32 mM
64 mM
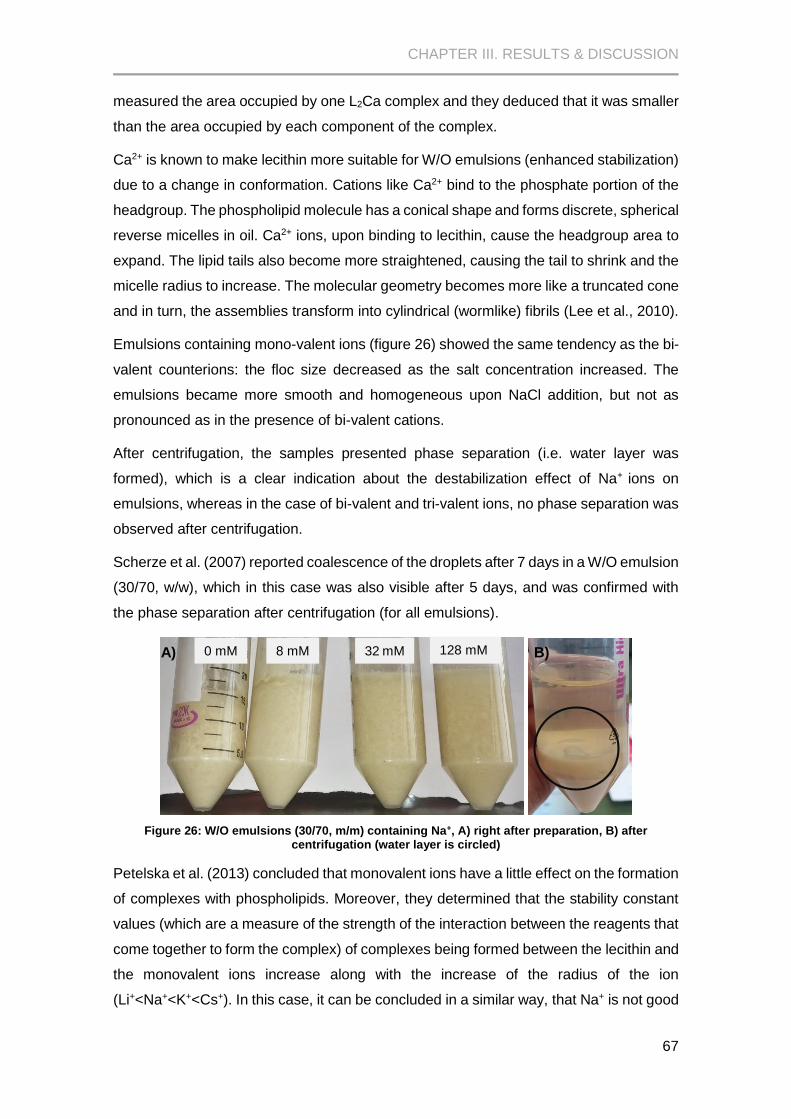
CHAPTER III. RESULTS & DISCUSSION
67
measured the area occupied by one L2Ca complex and they deduced that it was smaller
than the area occupied by each component of the complex.
Ca2+ is known to make lecithin more suitable for W/O emulsions (enhanced stabilization)
due to a change in conformation. Cations like Ca2+ bind to the phosphate portion of the
headgroup. The phospholipid molecule has a conical shape and forms discrete, spherical
reverse micelles in oil. Ca2+ ions, upon binding to lecithin, cause the headgroup area to
expand. The lipid tails also become more straightened, causing the tail to shrink and the
micelle radius to increase. The molecular geometry becomes more like a truncated cone
and in turn, the assemblies transform into cylindrical (wormlike) fibrils (Lee et al., 2010).
Emulsions containing mono-valent ions (figure 26) showed the same tendency as the bi-
valent counterions: the floc size decreased as the salt concentration increased. The
emulsions became more smooth and homogeneous upon NaCl addition, but not as
pronounced as in the presence of bi-valent cations.
After centrifugation, the samples presented phase separation (i.e. water layer was
formed), which is a clear indication about the destabilization effect of Na+ ions on
emulsions, whereas in the case of bi-valent and tri-valent ions, no phase separation was
observed after centrifugation.
Scherze et al. (2007) reported coalescence of the droplets after 7 days in a W/O emulsion
(30/70, w/w), which in this case was also visible after 5 days, and was confirmed with
the phase separation after centrifugation (for all emulsions).
Figure 26: W/O emulsions (30/70, m/m) containing Na+, A) right after preparation, B) after centrifugation (water layer is circled)
Petelska et al. (2013) concluded that monovalent ions have a little effect on the formation
of complexes with phospholipids. Moreover, they determined that the stability constant
values (which are a measure of the strength of the interaction between the reagents that
come together to form the complex) of complexes being formed between the lecithin and
the monovalent ions increase along with the increase of the radius of the ion
(Li+<Na+<K+<Cs+). In this case, it can be concluded in a similar way, that Na+ is not good
0 mM 8 mM 32 mM 128 mM A) B)
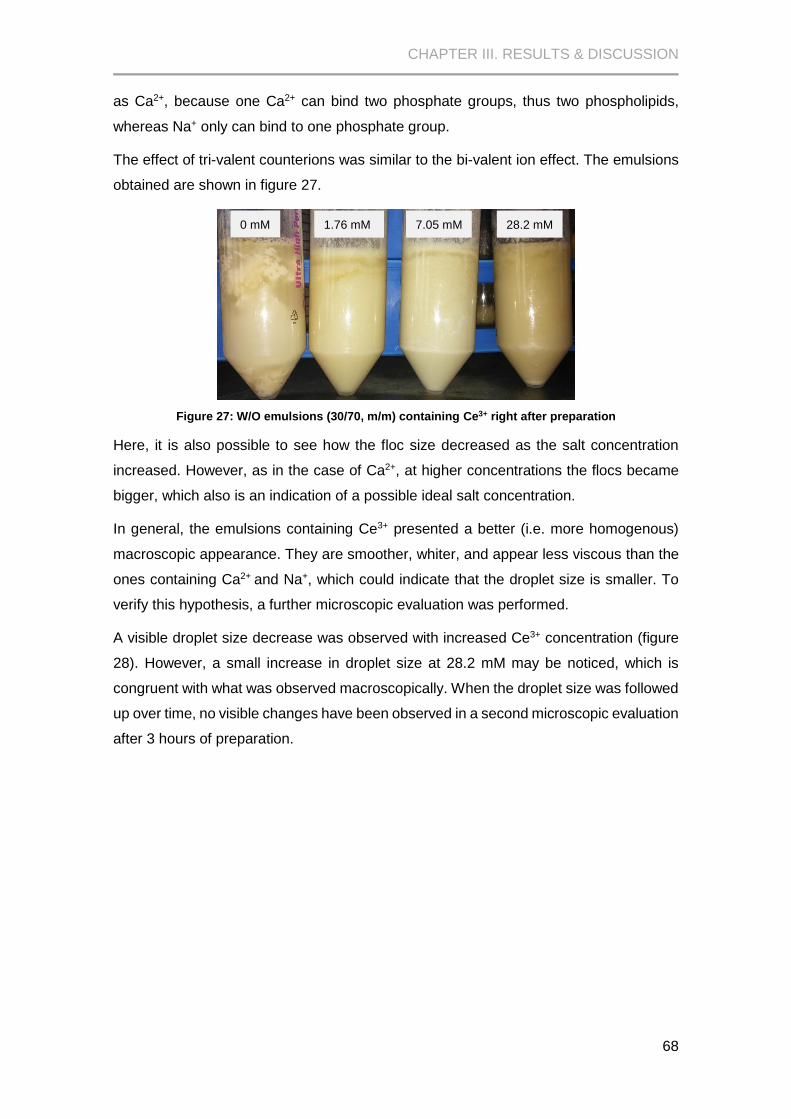
CHAPTER III. RESULTS & DISCUSSION
68
as Ca2+, because one Ca2+ can bind two phosphate groups, thus two phospholipids,
whereas Na+ only can bind to one phosphate group.
The effect of tri-valent counterions was similar to the bi-valent ion effect. The emulsions
obtained are shown in figure 27.
Figure 27: W/O emulsions (30/70, m/m) containing Ce3+ right after preparation
Here, it is also possible to see how the floc size decreased as the salt concentration
increased. However, as in the case of Ca2+, at higher concentrations the flocs became
bigger, which also is an indication of a possible ideal salt concentration.
In general, the emulsions containing Ce3+ presented a better (i.e. more homogenous)
macroscopic appearance. They are smoother, whiter, and appear less viscous than the
ones containing Ca2+ and Na+, which could indicate that the droplet size is smaller. To
verify this hypothesis, a further microscopic evaluation was performed.
A visible droplet size decrease was observed with increased Ce3+ concentration (figure
28). However, a small increase in droplet size at 28.2 mM may be noticed, which is
congruent with what was observed macroscopically. When the droplet size was followed
up over time, no visible changes have been observed in a second microscopic evaluation
after 3 hours of preparation.
0 mM 1.76 mM 7.05 mM 28.2 mM
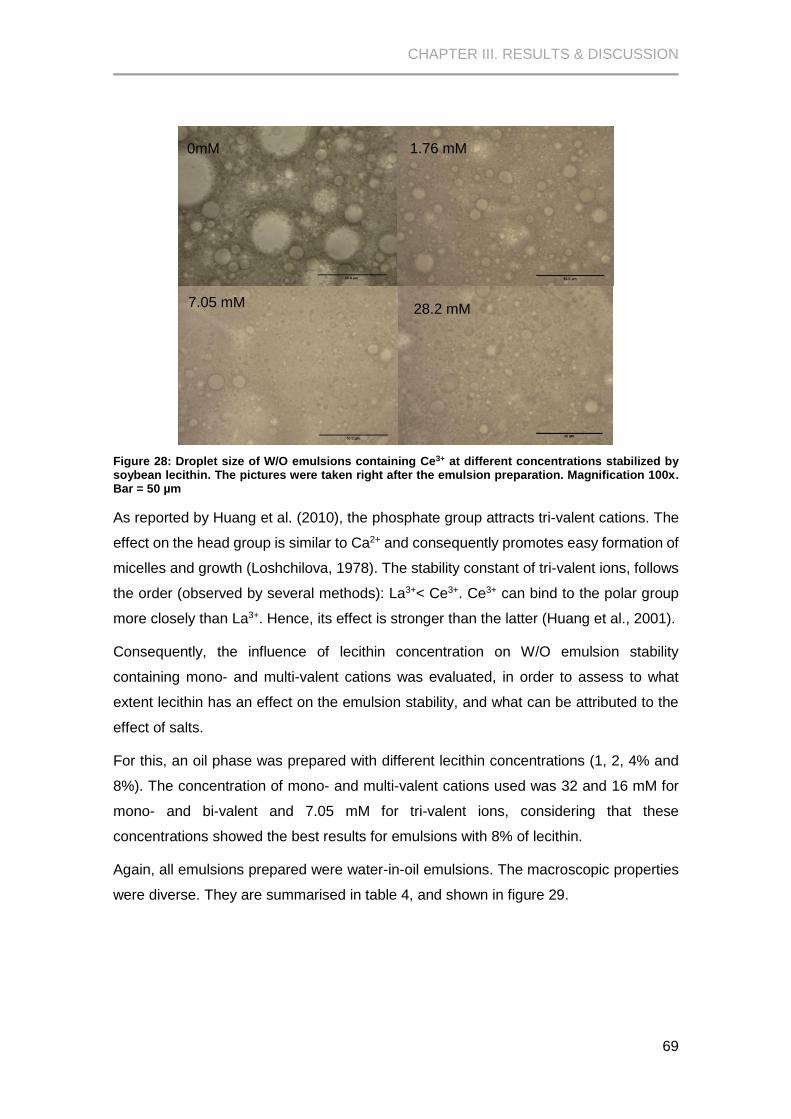
CHAPTER III. RESULTS & DISCUSSION
69
Figure 28: Droplet size of W/O emulsions containing Ce3+ at different concentrations stabilized by soybean lecithin. The pictures were taken right after the emulsion preparation. Magnification 100x. Bar = 50 µm
As reported by Huang et al. (2010), the phosphate group attracts tri-valent cations. The
effect on the head group is similar to Ca2+ and consequently promotes easy formation of
micelles and growth (Loshchilova, 1978). The stability constant of tri-valent ions, follows
the order (observed by several methods): La3+< Ce3+. Ce3+ can bind to the polar group
more closely than La3+. Hence, its effect is stronger than the latter (Huang et al., 2001).
Consequently, the influence of lecithin concentration on W/O emulsion stability
containing mono- and multi-valent cations was evaluated, in order to assess to what
extent lecithin has an effect on the emulsion stability, and what can be attributed to the
effect of salts.
For this, an oil phase was prepared with different lecithin concentrations (1, 2, 4% and
8%). The concentration of mono- and multi-valent cations used was 32 and 16 mM for
mono- and bi-valent and 7.05 mM for tri-valent ions, considering that these
concentrations showed the best results for emulsions with 8% of lecithin.
Again, all emulsions prepared were water-in-oil emulsions. The macroscopic properties
were diverse. They are summarised in table 4, and shown in figure 29.
0mM
CeCl3
1.76 mM
7.05 mM
28.2 mM
CeCl3
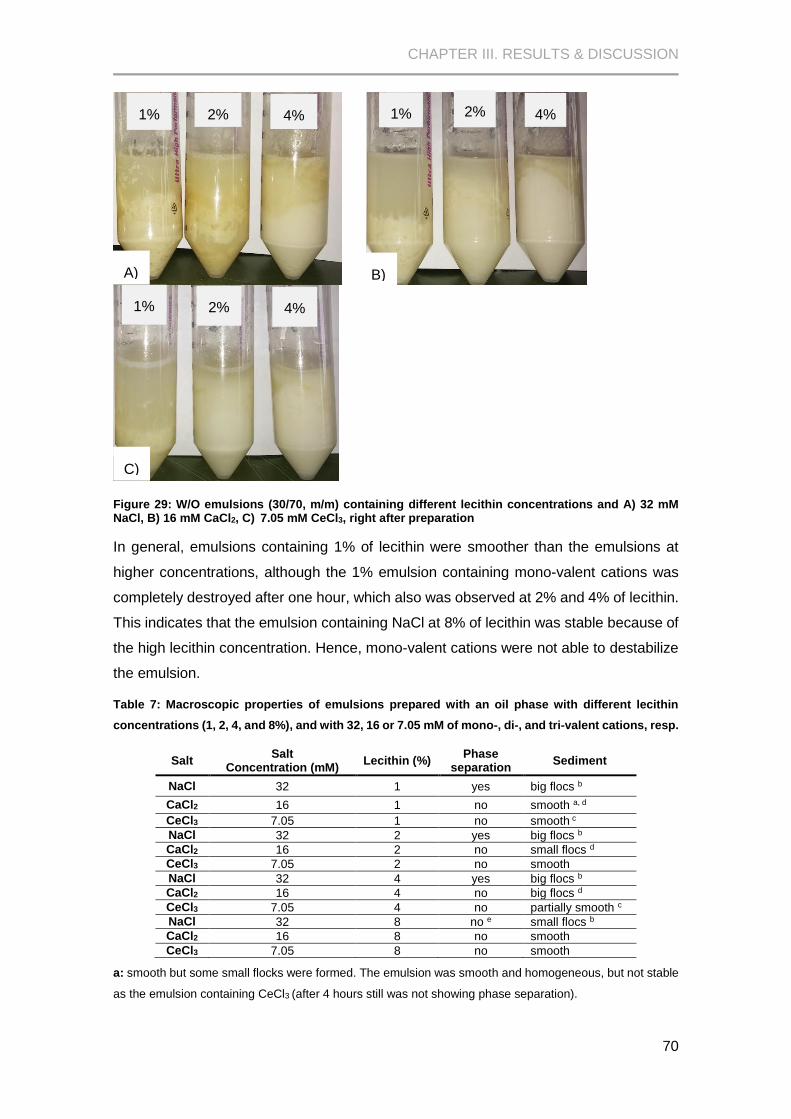
CHAPTER III. RESULTS & DISCUSSION
70
Figure 29: W/O emulsions (30/70, m/m) containing different lecithin concentrations and A) 32 mM NaCl, B) 16 mM CaCl2, C) 7.05 mM CeCl3, right after preparation
In general, emulsions containing 1% of lecithin were smoother than the emulsions at
higher concentrations, although the 1% emulsion containing mono-valent cations was
completely destroyed after one hour, which also was observed at 2% and 4% of lecithin.
This indicates that the emulsion containing NaCl at 8% of lecithin was stable because of
the high lecithin concentration. Hence, mono-valent cations were not able to destabilize
the emulsion.
Table 7: Macroscopic properties of emulsions prepared with an oil phase with different lecithin
concentrations (1, 2, 4, and 8%), and with 32, 16 or 7.05 mM of mono-, di-, and tri-valent cations, resp.
Salt Salt
Concentration (mM) Lecithin (%)
Phase separation
Sediment
NaCl 32 1 yes big flocs b
CaCl2 16 1 no smooth a, d
CeCl3 7.05 1 no smooth c
NaCl 32 2 yes big flocs b
CaCl2 16 2 no small flocs d
CeCl3 7.05 2 no smooth
NaCl 32 4 yes big flocs b
CaCl2 16 4 no big flocs d
CeCl3 7.05 4 no partially smooth c
NaCl 32 8 no e small flocs b
CaCl2 16 8 no smooth
CeCl3 7.05 8 no smooth
a: smooth but some small flocks were formed. The emulsion was smooth and homogeneous, but not stable
as the emulsion containing CeCl3 (after 4 hours still was not showing phase separation).
1% 2% 4% 1% 2% 4%
1% 2% 4%
A) B)
C)

CHAPTER III. RESULTS & DISCUSSION
71
b: emulsions containing Na+ showed already big flocks after preparation, and a total phase separation was
visible after few hours of preparation.
c: emulsions containing Ce3+ were stable at all lecithin concentrations. At low lecithin concentrations,
emulsions were more liquid-like and sedimentation was visible after 2 days.
d: at low lecithin concentrations, emulsions containing Ca2+ were totally destroyed after 2 days.
e: phase separation was possible to see after centrifugation step.
Moreover, emulsions containing 1% and 2% of lecithin were more liquid-like emulsions,
while emulsions containing 4% and 8% of lecithin appeared more viscous. In addition,
the flocs were bigger and compact.
Considering the good results observed with Ce3+, the lowest lecithin concentration where
stable emulsions were obtained, was sought. In this sense, oil phases containing 0.01,
0.05, 0.1, 0.25, and 0.5% soybean lecithin were used to prepare emulsions containing
7.05 mM CeCl3. In addition, a blank was prepared, i.e. an emulsion only containing oil
and a water phase with 7.05 mM CeCl3. As expected, the latter emulsion was
destabilised immediately after preparation (figure 32.a): a clear water layer was
immediately obvious.
Emulsions containing 0.5% and 0.05% were still stable, liquid-like emulsions, whereby
sedimentation became visible after 3 hours. On the other hand, emulsions with only
0.01% lecithin showed the same effect as the blank, indicating that this small amount of
lecithin was not able to stabilize the emulsion anymore, neither with the presence of tri-
valent cations. In this case, the emulsion was destroyed, i.e. a phase separation was
already visible some minutes after preparation.
Figure 30: W/O emulsions containing 7.05 mM CeCl3 and different lecithin concentrations, right after preparation.
This means that the critical soybean lecithin concentration at which emulsions are stable
in the presence of tri-valent cations (7.05 mM) is in the range between 0.01 and 0.05%,
where the molar ratio of Ce3+ to lecithin is about 4.5 to 1.
0.01% 0.05% 0.5% blank
a) b) c) d)
CHAPTER III. RESULTS & DISCUSSION
72
W/O emulsions were clearly improved with the addition of CeCl3. This effect is already
seen with a lecithin content of about 0.05% and 7.05 mM of CeCl3. Not only the stability
was improved but also the macroscopic properties: smoother, whiter, and more
homogeneous emulsions.
Huang et al. (2001) evaluated the effect of divalent and trivalent salts on the micelle
formation in C8-lecithin solutions using the techniques of static and dynamic light
scattering. They concluded that the micelles in calcium solutions and the tri-valent
solutions formed easily and were stable. They explained this effect somehow by the
counterion effect between the salts and the polar head of the lecithin. The
phosphatidylcholine polar head is zwitterionic at pH between 3 and 11. This means that
in this pH range, the phosphate group of the polar head has a net negative charge and
the choline group has an equal positive charge with a spatial separation. In aqueous
solution, water molecules are bound to the phosphate group while none is bound to the
choline group. When salts are added to the solution, cations bind to the phosphate group.
For divalent salts, the following order of binding has been observed Ba2+ < Mg2+ < Ca2+.
For trivalent salts, the order is La3+ < Ce3+ (Loshchilova, 1978). It has also been found
that Ca2+ can even be bound to the phosphate group as close as 1–2 Å; therefore, among
the divalent cations, calcium ions have the strongest effect on the surface potential of
the amphiphilic molecules (Huang et al., 2001).
However, according to Regulation (EC) No 1333/2008 of the European Parliament and
of the Council of 16 December 2008 on Food Additives, specifically in Annex II (Positive
List of additives), CeCl3 is not listed, which means that it is not allowed to be used in
foods. Nevertheless, it could be used in other technical applications.
3.4 Electrophoretic mobility
To see the effect of CeCl3 on lecithin, the electrophoretic mobility of suspension
containing soybean lecithin and different ratios of CeCl3 were measured.
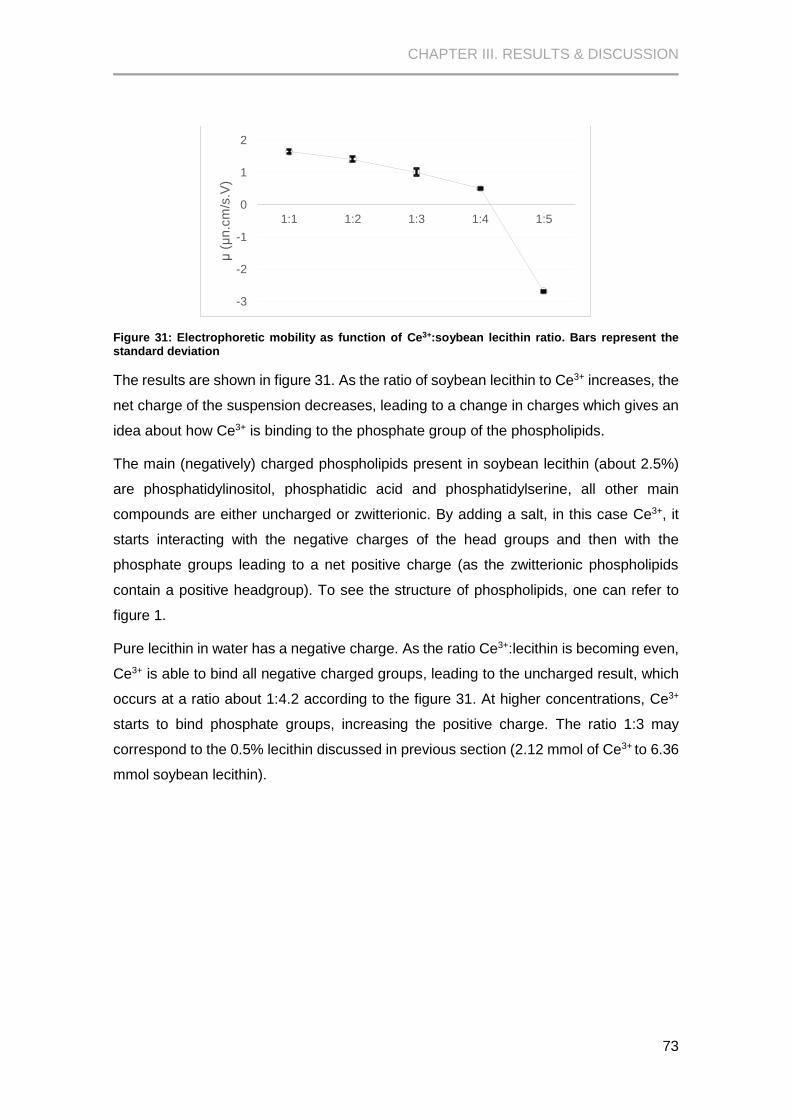
CHAPTER III. RESULTS & DISCUSSION
73
Figure 31: Electrophoretic mobility as function of Ce3+:soybean lecithin ratio. Bars represent the standard deviation
The results are shown in figure 31. As the ratio of soybean lecithin to Ce3+ increases, the
net charge of the suspension decreases, leading to a change in charges which gives an
idea about how Ce3+ is binding to the phosphate group of the phospholipids.
The main (negatively) charged phospholipids present in soybean lecithin (about 2.5%)
are phosphatidylinositol, phosphatidic acid and phosphatidylserine, all other main
compounds are either uncharged or zwitterionic. By adding a salt, in this case Ce3+, it
starts interacting with the negative charges of the head groups and then with the
phosphate groups leading to a net positive charge (as the zwitterionic phospholipids
contain a positive headgroup). To see the structure of phospholipids, one can refer to
figure 1.
Pure lecithin in water has a negative charge. As the ratio Ce3+:lecithin is becoming even,
Ce3+ is able to bind all negative charged groups, leading to the uncharged result, which
occurs at a ratio about 1:4.2 according to the figure 31. At higher concentrations, Ce3+
starts to bind phosphate groups, increasing the positive charge. The ratio 1:3 may
correspond to the 0.5% lecithin discussed in previous section (2.12 mmol of Ce3+ to 6.36
mmol soybean lecithin).
-3
-2
-1
0
1
2
1:1 1:2 1:3 1:4 1:5μ
(μn.c
m/s
.V)

74
CHAPTER IV
Conclusions
CHAPTER IV. CONCLUSIONS
75
In this research, the characterization and functionality of native and fractionated lecithin
from different sources was evaluated.
As a first step of this research, soybean and sunflower lecithin were fractionated, having
as objective to improve their O/W emulsifying properties by adding amounts of water to
lecithin dissolved in a hexane/isopropanol mixture that may hydrate impurities and make
them insoluble in the solvent, leading to precipitation.
After fractionation, the lecithins were characterized. First, the total phospholipid content
was determined. Two methods were used. The first method was acid digestion with
subsequent colorimetric determination as described in Chapter II, section 3.1.1. This
method has not given the results that were expected, they were not reproducible
(showed with a large variance) and the expected amount of phospholipids was not
recovered.
The second method used to determine phospholipids content was a commercial kit test,
purchased from HACH®. This method has a fast and simple procedure, and is based on
the same principles as the former method. In this case, the results were better, and the
phospholipid recovery was as expected. Native soybean lecithin yielded the highest
phospholipid content (87%), while native sunflower lecithin yielded 83% and corn lecithin
51%, which was expected because of its crude form. Regarding the fractionated lecithin,
a decrease of phospholipid content was observed as more water was added to the
mixture. The same trend has been observed for soybean and sunflower. This decrease
may be due to the amphiphilic behaviour of the phospholipids. Some may have migrated
to the sediments and/or separated during the filtration step.
Secondly, nitrogen-containing phospholipids (N-PL) were determined using the standard
Kjeldahl method. These phospholipids are basically PC, PE and PS, which are the major
components of lecithins, besides PI that has no nitrogen in its structure. The results
showed that the N-PL content in sunflower lecithin is higher than in soybean lecithin but
no significant differences were found between fractionated samples (for both lecithins).
The N-PL content in corn lecithin was unrealistically high. Some extra analyses (i.e.
inorganic nitrogen determination) were performed. The amount of ammonia found in the
sample was too low and neither nitrate nor nitrite was present. This low amount cannot
explain the high N-content determined with Kejdahl, therefore the nitrogen must come
from other, non-characterized N-containing compounds in the lecithin (which was in
crude form).
CHAPTER IV. CONCLUSIONS
76
As a confirmation of these simple methods, a 31P-NMR measurement was performed.
After obtaining the spectra and the corresponding peak integration, the peak areas
showed the same trend as observed with the above mentioned methods. This leads to
a conclusion that the former methods applied are a good alternative for lecithin analysis.
They are easily accessible, relatively cheap and they don’t need a specially trained staff
to perform them.
On the other hand, the functionality of native and fractionated lecithin samples was
evaluated. The droplet size distribution of oil-in-water emulsions was followed over time.
The emulsions containing fractionated lecithin were more stable (p-value<0.00001) than
the native lecithin samples, for both sources (soybean and sunflower), although no
significant differences were found within the different fractionated samples. This was
confirmed with the 1D pfg NMR results, where no distinct cream layer could be observed
on top of the emulsions prepared with the fractionated samples with added water.
Corn lecithin had a different behaviour. The droplet size directly after preparation was in
the same range than soybean lecithin samples and smaller than sunflower lecithin
samples, but the increase was not pronounced over time. However, a cream layer could
be identified with profilometric analysis, which indicates that coagulation is prone to
occur.
The influence of mono-valent ions on water-in-oil emulsions was evaluated, concluding
that Na+ has no beneficial effect on the emulsion’s stability. On the contrary, it tends to
destabilize it.
On the other side, bi-valent ions showed a stabilizing effect on lecithin-stabilised W/O
emulsions. Tri-valent ions showed a better stabilizing effect than bi-valent ions, even at
0.05 wt-% lecithin, where the molar ratio of Ce3+ to lecithin is about 4.5 to 1.
Several studies describe the bi- and tri-valent ions stabilizing effect, as well as the
binding between the ions and the phospholipids. At first, the cations bind to the negatively
charged phospholipids, after which cations start to bind to the negatively charged
phosphate group of the zwitterionic phospholipids. One can assume that one Ca2+ is able
to bind two phospholipids, and one Ce3+ is able to bind three of them, leading to a change
in the structure of the micelles formed (from spherical micelles to cylindrical fibrils). The
binding of Ce3+ to soybean lecithin was confirmed with electrophoretic mobility
measurements, where a change in charge was observed from negative to positive as
the Ce3+ concentration was increased.
Further research could be done on purification and modification of corn lecithin, although
the native form (containing water) performs quite well. Also, the influence of tri-valent

CHAPTER IV. CONCLUSIONS
77
ions on O/W emulsions can be sought, as well as a food grade alternative for cerium.
Furthermore, further research is needed to optimise 1D pfg NMR profilometry to follow
the creaming behaviour of O/W emulsions, especially regarding to the frequency and
signal intensity shifts. This is necessary to be able to quantify the amount of water and
oil present in the cream layer.

78
CHAPTER V
Appendices
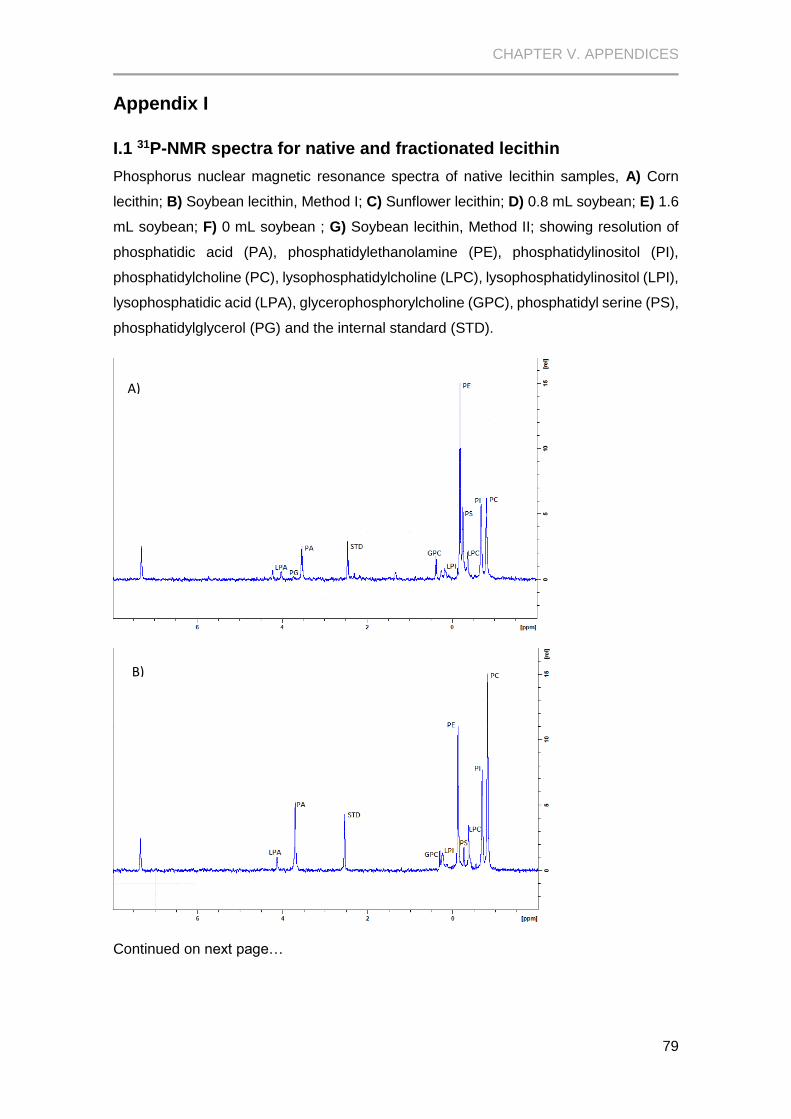
CHAPTER V. APPENDICES
79
Appendix I
I.1 31P-NMR spectra for native and fractionated lecithin
Phosphorus nuclear magnetic resonance spectra of native lecithin samples, A) Corn
lecithin; B) Soybean lecithin, Method I; C) Sunflower lecithin; D) 0.8 mL soybean; E) 1.6
mL soybean; F) 0 mL soybean ; G) Soybean lecithin, Method II; showing resolution of
phosphatidic acid (PA), phosphatidylethanolamine (PE), phosphatidylinositol (PI),
phosphatidylcholine (PC), lysophosphatidylcholine (LPC), lysophosphatidylinositol (LPI),
lysophosphatidic acid (LPA), glycerophosphorylcholine (GPC), phosphatidyl serine (PS),
phosphatidylglycerol (PG) and the internal standard (STD).
Continued on next page…
A)
B)
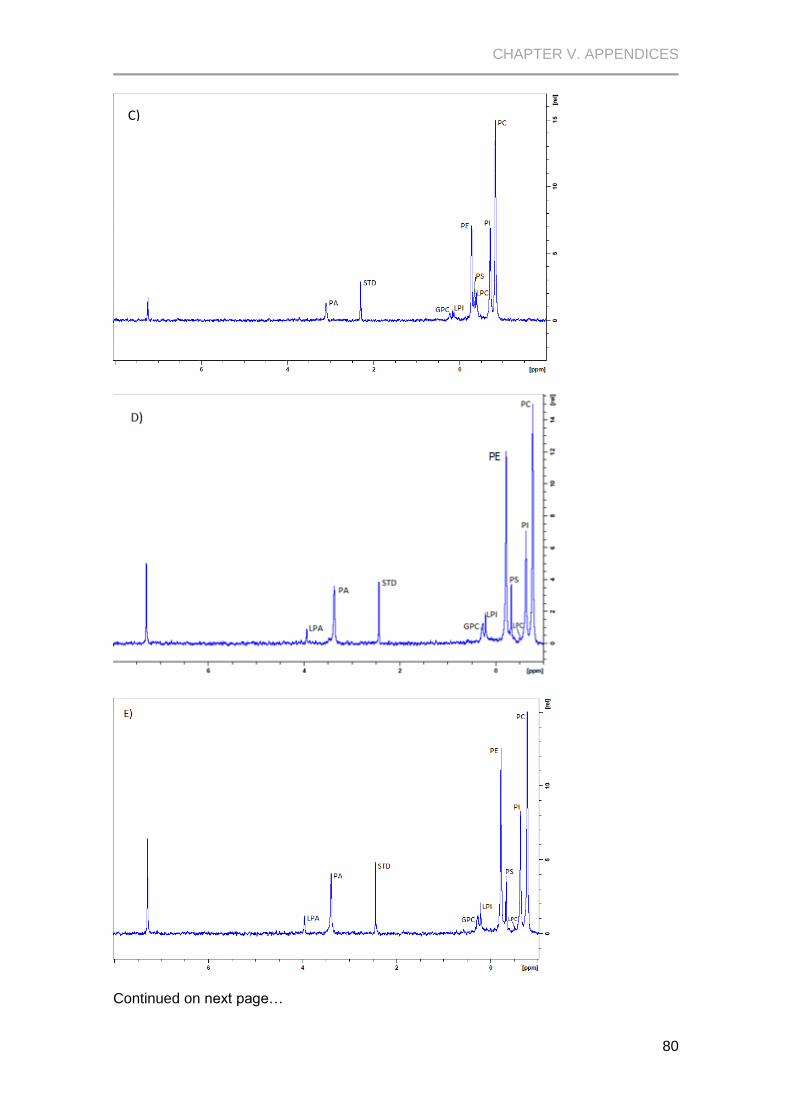
CHAPTER V. APPENDICES
80
Continued on next page…
C)

CHAPTER V. APPENDICES
81
F)
G)
CHAPTER V. APPENDICES
82
Appendix II
II.1 Paired t-test comparing soybean and sunflower PL content
Paired t-Test
data: x: soybean in SDF27 , and y: sunflower in SDF27
t = 3.56, df = 5, p-value = 0.0162
alternative hypothesis: mean of differences is not equal to 0
95 percent confidence interval:
0.05256113 0.32568946
sample estimates:
mean of x - y
0.1891253
II.2 ANOVA of droplet size results obtained with laser diffraction
measures
II.2.1 Soybean lecithin
*** Analysis of Variance Model ***
Short Output:
Call:
aov(formula = droplet.size ~ sample * day, data = soybean, na.action =
na.exclude)
Residual standard error: 0.2773241
Estimated effects may be unbalanced
Df Sum of Sq Mean Sq F Value Pr(F)
sample 4 46.17630 11.54408 150.1012 0.000000e+000
day 3 17.45714 5.81905 75.6618 0.000000e+000
sample:day 12 4.49894 0.37491 4.8748 4.695403e-006
Residuals 85 6.53723 0.07691
Type III Sum of Squares
Df Sum of Sq Mean Sq F Value Pr(F)
sample 4 46.30139 11.57535 150.5078 0.000000e+000
day 3 14.92469 4.97490 64.6858 0.000000e+000
sample:day 12 4.49894 0.37491 4.8748 4.695403e-006
Residuals 85 6.53723 0.07691
95 % simultaneous confidence intervals for specified
linear combinations, by the Tukey method
critical point: 2.8035000000000001
response variable: droplet.size
intervals excluding 0 are flagged by '****'
CHAPTER V. APPENDICES
83
Estimate Std.Error Lower Bound Upper Bound
native-0 mL 0.75100 0.0332 0.65800 0.84400 ****
native-0.4 mL 0.83800 0.0313 0.75000 0.92600 ****
native-0.8 mL 0.82500 0.0384 0.71700 0.93300 ****
native-1.6 mL 0.74900 0.0313 0.66100 0.83600 ****
0 mL-0.4 mL 0.08690 0.0332 -0.00633 0.18000
0 mL-0.8 mL 0.07370 0.0400 -0.03830 0.18600
0 mL-1.6 mL -0.00267 0.0332 -0.09590 0.09050
0.4 mL-0.8 mL -0.01320 0.0384 -0.12100 0.09440
0.4 mL-1.6 mL -0.08950 0.0313 -0.17700 -0.00167
0.8 mL-1.6 mL -0.07630 0.0384 -0.18400 0.03130
95 % simultaneous confidence intervals for specified
linear combinations, by the Tukey method
critical point: 2.6347
response variable: droplet.size
intervals excluding 0 are flagged by '****'
Estimate Std.Error Lower Bound Upper Bound
0-1 -0.0964 0.0307 -0.177 -0.0155 ****
0-4 -0.2250 0.0320 -0.309 -0.1410 ****
0-23 -0.5130 0.0307 -0.594 -0.4330 ****
1-4 -0.1290 0.0320 -0.213 -0.0443 ****
1-23 -0.4170 0.0307 -0.498 -0.3360 ****
4-23 -0.2880 0.0320 -0.373 -0.2040 ****
II.2.2 Sunflower lecithin
*** Analysis of Variance Model ***
Short Output:
Call:
aov(formula = droplet.size ~ sample * day, data = sunflower, na.action =
na.exclude)
Type III Sum of Squares
Df Sum of Sq Mean Sq F Value Pr(F)
sample 4 24.77519 6.193797 1197.872 0.000000e+000
day 3 6.08734 2.029115 392.428 0.000000e+000
sample:day 12 0.95107 0.079256 15.328 3.995915e-012
Residuals 45 0.23268 0.005171
95 % simultaneous confidence intervals for specified
linear combinations, by the Tukey method
critical point: 2.7871999999999999

CHAPTER V. APPENDICES
84
response variable: droplet.size
intervals excluding 0 are flagged by '****'
Estimate Std.Error Lower Bound Upper Bound
native-0 mL 1.50000 0.0849 1.2700 1.7400 ****
native-0.4 mL 1.68000 0.0801 1.4500 1.9000 ****
native-0.8 mL 1.65000 0.0980 1.3800 1.9200 ****
native-1.6 mL 1.50000 0.0801 1.2700 1.7200 ****
0 mL-0.4 mL 0.17400 0.0849 -0.0629 0.4100
0 mL-0.8 mL 0.14700 0.1020 -0.1370 0.4320
0 mL-1.6 mL -0.00533 0.0849 -0.2420 0.2310
0.4 mL-0.8 mL -0.02640 0.0980 -0.3000 0.2470
0.4 mL-1.6 mL -0.17900 0.0801 -0.4020 0.0441
0.8 mL-1.6 mL -0.15300 0.0980 -0.4260 0.121
95 % simultaneous confidence intervals for specified
linear combinations, by the Tukey method
critical point: 2.6206
response variable: droplet.size
intervals excluding 0 are flagged by '****'
Estimate Std.Error Lower Bound Upper Bound
0-1 -0.193 0.0784 -0.398 0.0127
0-4 -0.450 0.0816 -0.664 -0.2360 ****
0-23 -1.030 0.0784 -1.230 -0.8210 ****
1-4 -0.257 0.0816 -0.471 -0.0431 ****
1-23 -0.834 0.0784 -1.040 -0.6280 ****
4-23 -0.577 0.0816 -0.791 -0.3630 ****
II.2.3 Differences between different native lecithins droplet size distribution
*** Analysis of Variance Model ***
Short Output:
Call:
aov(formula = Droplet.size ~ Day * Sample, data = SDF31, na.action =
na.exclude)
Residual standard error: 0.3871124
Estimated effects may be unbalanced
Df Sum of Sq Mean Sq F Value Pr(F)
Day 3 8.159959 2.719986 18.15067 0.000000157
Sample 2 7.057661 3.528831 23.54815 0.000000197
Day:Sample 6 3.355726 0.559288 3.73217 0.004986824
Residuals 39 5.844384 0.149856
95 % simultaneous confidence intervals for specified
linear combinations, by the Tukey method
CHAPTER V. APPENDICES
85
critical point: 2.4363
response variable: Droplet.size
intervals excluding 0 are flagged by '****'
Estimate Std.Error Lower Bound Upper Bound
Sunflower-Corn 0.884 0.151 0.515 1.250 ****
Sunflower-Soybean 0.140 0.137 -0.193 0.474
Corn-Soybean -0.744 0.129 -1.060 -0.429 ****
II.3 Nitrogen-containing phospholipids
II.3.1 Soybean
*** Analysis of Variance Model ***
Short Output:
Call:
aov(formula = PL.content ~ Sample, data = SDF29, na.action = na.exclude)
Terms:
Sample Residuals
Sum of Squares 145.5338 110.0800
Deg. of Freedom 1 4
Residual standard error: 5.245951
Estimated effects may be unbalanced
Df Sum of Sq Mean Sq F Value Pr(F)
Sample 1 145.5338 145.5338 5.28829 0.08297296
Residuals 4 110.0800 27.5200
II.3.2 Sunflower
*** Analysis of Variance Model ***
Short Output:
Call:
aov(formula = PL.content ~ Sample * PL.content, data = SDF30, na.action =
na.exclude)
Type III Sum of Squares
Df Sum of Sq Mean Sq F Value Pr(F)
Sample 4 94.00114 23.50028 2.428885 0.17837
Sample:PL.content
Residuals 5 48.37670 9.67534
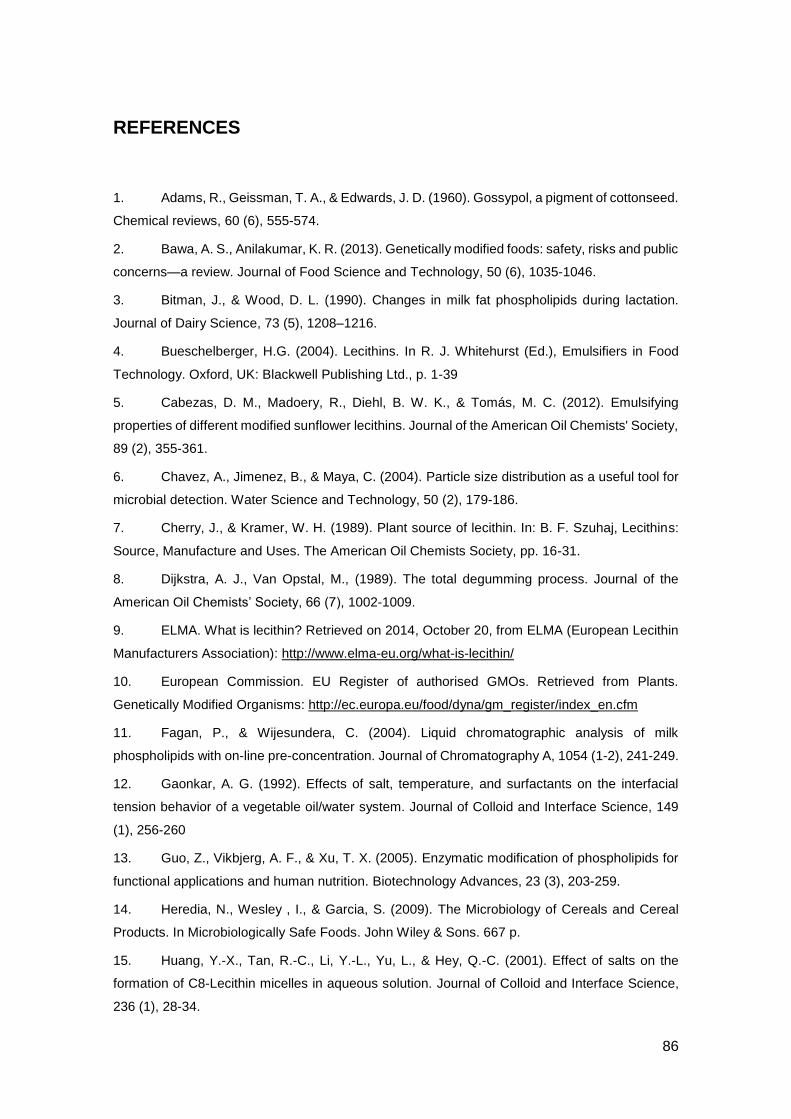
86
REFERENCES
1. Adams, R., Geissman, T. A., & Edwards, J. D. (1960). Gossypol, a pigment of cottonseed.
Chemical reviews, 60 (6), 555-574.
2. Bawa, A. S., Anilakumar, K. R. (2013). Genetically modified foods: safety, risks and public
concerns—a review. Journal of Food Science and Technology, 50 (6), 1035-1046.
3. Bitman, J., & Wood, D. L. (1990). Changes in milk fat phospholipids during lactation.
Journal of Dairy Science, 73 (5), 1208–1216.
4. Bueschelberger, H.G. (2004). Lecithins. In R. J. Whitehurst (Ed.), Emulsifiers in Food
Technology. Oxford, UK: Blackwell Publishing Ltd., p. 1-39
5. Cabezas, D. M., Madoery, R., Diehl, B. W. K., & Tomás, M. C. (2012). Emulsifying
properties of different modified sunflower lecithins. Journal of the American Oil Chemists' Society,
89 (2), 355-361.
6. Chavez, A., Jimenez, B., & Maya, C. (2004). Particle size distribution as a useful tool for
microbial detection. Water Science and Technology, 50 (2), 179-186.
7. Cherry, J., & Kramer, W. H. (1989). Plant source of lecithin. In: B. F. Szuhaj, Lecithins:
Source, Manufacture and Uses. The American Oil Chemists Society, pp. 16-31.
8. Dijkstra, A. J., Van Opstal, M., (1989). The total degumming process. Journal of the
American Oil Chemists’ Society, 66 (7), 1002-1009.
9. ELMA. What is lecithin? Retrieved on 2014, October 20, from ELMA (European Lecithin
Manufacturers Association): http://www.elma-eu.org/what-is-lecithin/
10. European Commission. EU Register of authorised GMOs. Retrieved from Plants.
Genetically Modified Organisms: http://ec.europa.eu/food/dyna/gm_register/index_en.cfm
11. Fagan, P., & Wijesundera, C. (2004). Liquid chromatographic analysis of milk
phospholipids with on-line pre-concentration. Journal of Chromatography A, 1054 (1-2), 241-249.
12. Gaonkar, A. G. (1992). Effects of salt, temperature, and surfactants on the interfacial
tension behavior of a vegetable oil/water system. Journal of Colloid and Interface Science, 149
(1), 256-260
13. Guo, Z., Vikbjerg, A. F., & Xu, T. X. (2005). Enzymatic modification of phospholipids for
functional applications and human nutrition. Biotechnology Advances, 23 (3), 203-259.
14. Heredia, N., Wesley , I., & Garcia, S. (2009). The Microbiology of Cereals and Cereal
Products. In Microbiologically Safe Foods. John Wiley & Sons. 667 p.
15. Huang, Y.-X., Tan, R.-C., Li, Y.-L., Yu, L., & Hey, Q.-C. (2001). Effect of salts on the
formation of C8-Lecithin micelles in aqueous solution. Journal of Colloid and Interface Science,
236 (1), 28-34.
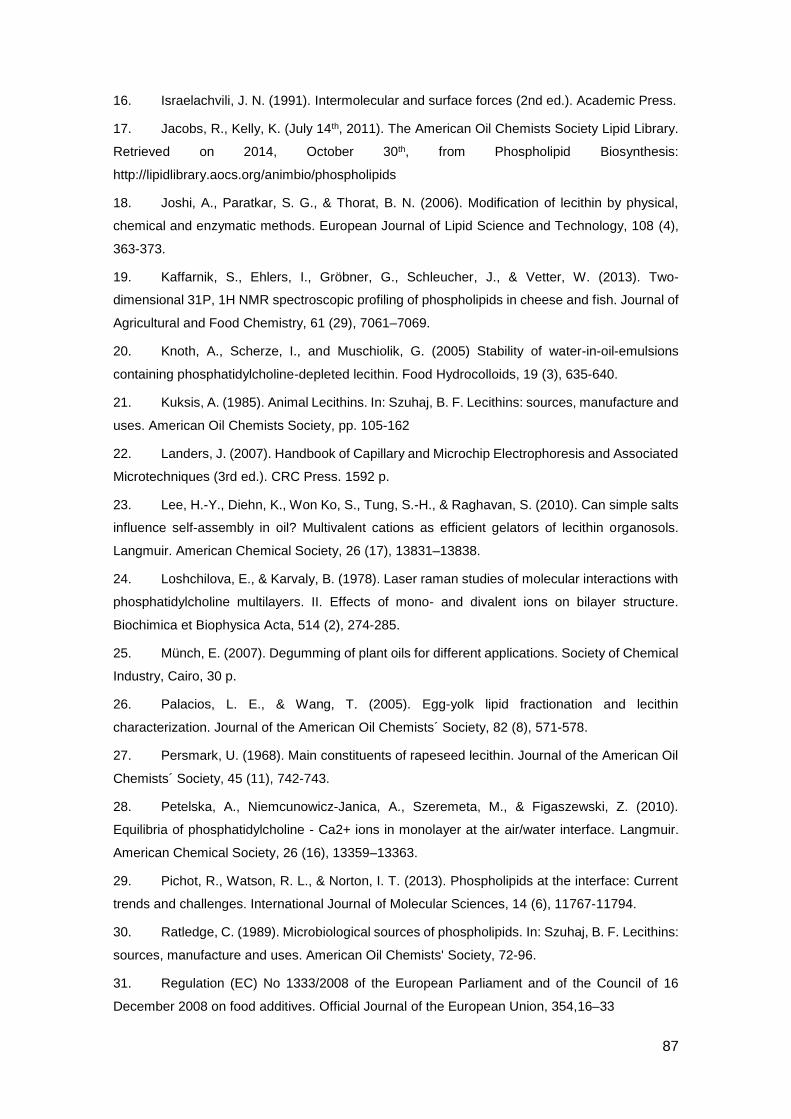
87
16. Israelachvili, J. N. (1991). Intermolecular and surface forces (2nd ed.). Academic Press.
17. Jacobs, R., Kelly, K. (July 14th, 2011). The American Oil Chemists Society Lipid Library.
Retrieved on 2014, October 30th, from Phospholipid Biosynthesis:
http://lipidlibrary.aocs.org/animbio/phospholipids
18. Joshi, A., Paratkar, S. G., & Thorat, B. N. (2006). Modification of lecithin by physical,
chemical and enzymatic methods. European Journal of Lipid Science and Technology, 108 (4),
363-373.
19. Kaffarnik, S., Ehlers, I., Gröbner, G., Schleucher, J., & Vetter, W. (2013). Two-
dimensional 31P, 1H NMR spectroscopic profiling of phospholipids in cheese and fish. Journal of
Agricultural and Food Chemistry, 61 (29), 7061–7069.
20. Knoth, A., Scherze, I., and Muschiolik, G. (2005) Stability of water-in-oil-emulsions
containing phosphatidylcholine-depleted lecithin. Food Hydrocolloids, 19 (3), 635-640.
21. Kuksis, A. (1985). Animal Lecithins. In: Szuhaj, B. F. Lecithins: sources, manufacture and
uses. American Oil Chemists Society, pp. 105-162
22. Landers, J. (2007). Handbook of Capillary and Microchip Electrophoresis and Associated
Microtechniques (3rd ed.). CRC Press. 1592 p.
23. Lee, H.-Y., Diehn, K., Won Ko, S., Tung, S.-H., & Raghavan, S. (2010). Can simple salts
influence self-assembly in oil? Multivalent cations as efficient gelators of lecithin organosols.
Langmuir. American Chemical Society, 26 (17), 13831–13838.
24. Loshchilova, E., & Karvaly, B. (1978). Laser raman studies of molecular interactions with
phosphatidylcholine multilayers. II. Effects of mono- and divalent ions on bilayer structure.
Biochimica et Biophysica Acta, 514 (2), 274-285.
25. Münch, E. (2007). Degumming of plant oils for different applications. Society of Chemical
Industry, Cairo, 30 p.
26. Palacios, L. E., & Wang, T. (2005). Egg-yolk lipid fractionation and lecithin
characterization. Journal of the American Oil Chemists´ Society, 82 (8), 571-578.
27. Persmark, U. (1968). Main constituents of rapeseed lecithin. Journal of the American Oil
Chemists´ Society, 45 (11), 742-743.
28. Petelska, A., Niemcunowicz-Janica, A., Szeremeta, M., & Figaszewski, Z. (2010).
Equilibria of phosphatidylcholine - Ca2+ ions in monolayer at the air/water interface. Langmuir.
American Chemical Society, 26 (16), 13359–13363.
29. Pichot, R., Watson, R. L., & Norton, I. T. (2013). Phospholipids at the interface: Current
trends and challenges. International Journal of Molecular Sciences, 14 (6), 11767-11794.
30. Ratledge, C. (1989). Microbiological sources of phospholipids. In: Szuhaj, B. F. Lecithins:
sources, manufacture and uses. American Oil Chemists' Society, 72-96.
31. Regulation (EC) No 1333/2008 of the European Parliament and of the Council of 16
December 2008 on food additives. Official Journal of the European Union, 354,16–33
88
32. Reich, H. J. (2010). Relaxation in NMR Spectroscopy. Retrieved on 2015, May 4th from
Chemistry Department,University of Wisconsin:
http://www.chem.wisc.edu/areas/reich/nmr/notes-8-tech-1-relax.pdf
33. Rosen, M. J., & Kunjappu, J. T. (2012). Surfactants and interfacial phenomena (4th ed.).
John Wiley & Sons, 616 p.
34. Rossi, M. (2007). Use of Lecithin and Lecithin Fractions. In R. Huopalahti, R. Lopez-
Fandiño, M. Anton, & R. Schade. Bioactive egg compounds. Berlin, Germany: Springer, 11 p.
35. Royal Society of Chemistry, (2015). Ultrasonication. Retrieved on 2015, May 9th from
RSC Prospect: http://www.rsc.org/publishing/journals/prospect/ontology.asp?id=CMO:0001708
36. Sai Prasad, P. S., Vandana, V., & Karuna, M. S. (2011). Rapid hydroxylation of soybean
lecithin under microwave-assisted conditions. Journal of the American Oil Chemists' Society, 88
(7), 1081-1082.
37. Schaper, M., Parada, S. (2001). Organismos genéticamente modificados: su impacto
socioeconómico en la agricultura de los países de la Comunidad Andina, Mercosur y Chile.
Retrieved on 2014, November 14th, from Medio Ambiente y Desarrollo. United Nations:
http://www.cepal.org/publicaciones/xml/4/9694/lcl1638e.pdf
38. Scherze, I., Knoth, A., Muschiolik, G. (2006). Effect of emulsification method on the
properties of lecithin- and PGPR-stabilized Water-in-Oil-emulsions. Journal of Dispersion Science
and Technology, 27 (4), 427–434.
39. Schneider, M. E. (1989). Fractionation of lecithin. In: Szuhaj, B. F. Lecithins: sources,
manufacture and uses. American Oil Chemists’ Society, pp. 116–127.
40. Scholfield, C. R. (1981). Composition of soybean lecithin. Journal of the American Oil
Chemists Society, 58 (10), 889-892.
41. Shchipunov, Y. A. (2002), Lecithin. In: Somasundaran, P., Encyclopedia of Surface and
Colloid Science, New York, pp. 2997-3017.
42. Sipos, E. F., Szuhaj, B. F. (1996). Lecithin. Bailey’s Industrial Oil and Fat Products, 311-
396.
43. Sourkes, T. L. (2004). The discovery of lecithin, the first phospholipid. Bulletin for the
History of Chemistry, 29 (7), 7 p.
44. Soy Info Center. Retrieved on 2014, October 28th, from
http://www.soyinfocenter.com/index.php
45. Stevens, C., & Tsukamoto, J. (2014). 31P NMR sample preparation for gums and oils.
Ghent University, SynBioC. Ghent: Unpublished method.
46. Szuhaj, B. F. (2005). Lecithins. In: Shahidi, F. (Ed.). Bailey's Industrial Oil and Fat
Products, 6th edition. John Wiley & Sons, pp. 361-456.
89
47. Thudichum, J. (1930). Researches on the Chemical Constitution of the Brain. In J.
Thudichum, Report of the Medical Officer of the Privy Council and Local Government Board.
Berlin. Springer.
48. Valletta, M. (2010). Consumer perception and GMOs in the European Union.
Organisation for Economic Co-operation and Development, pp. 87-94.
49. Van der Meeren, P., Vanderdeelen, J., Baert, L. (1988). Quantification of phospholipid
phosphorus in sub-micromolar concentrations. Bulletin des Sociétés Chimiques Belges, 97 (6),
413-418.
50. van Nieuwenhuyzen, W. (2014). The changing world of lecithins. International News on
Fats, Oils, and Related Materials (INFORM), 25 (4), 7 p.
51. van Nieuwenhuyzen, W., Tomas, M. (2008). Update on vegetable lecithin and
phospholipid technologies. European Journal of Lipid Science and Technology, 110 (5), 472-486.
52. Vermeir, L. (2011). Formulation and characterization aspects of low fat whipping cream
by Water/Oil/Water technology. Thesis. Ghent University, Belgium.
53. Wabel, C. (1998). Influence of lecithin on structure and stability of parenteral fat
emulsions. Frankfurt am Main, Germany, PhD thesis.
54. Weber, E. J. (1981). Compositions of commercial corn and soybean lecithins. Journal of
the American Oil Chemists Society, 58 (10), 898-901.
55. Whitehourst, R. J. (2004). Emulsifiers in Food Technology. Northampton. Blackwell
Publishing.
56. WHO. (n.d.). World Health Organization. Retrieved on 2014, October 30th, from Food,
Genetically modified: http://www.who.int/topics/food_genetically_modified/en/
57. Wuxin, Z., Martins, J., Saveyn, P., Govoreanu, R., Verbruggen, K., Ariën, T., Van der
Meeren, P. (2011). Sedimentation and resuspendability evaluation of pharmaceutical
suspensions by low-field one dimensional pulsed field gradient NMR profilometry. Pharmaceutical
Development and Technology, 18 (4), 787-97.
58. Yingzi W., Tong, W. (2004). Fractionation of crude soybean lecithin with aqueous ethanol.
Journal of the American Oil Chemists' Society, 81 (7), 697-704.