characteristics of surfacewindstructureof tropical
TRANSCRIPT

Characteristics of surface wind structure of tropicalcyclones over the north Indian Ocean
M Mohapatra∗ and Monica Sharma
India Meteorological Department, Mausam Bhavan, Lodi Road, New Delhi 110 003, India.∗Corresponding author. e-mail: [email protected]
Tropical cyclone (TC) wind field monitoring and forecast are important for mariners, ships on sea andmodelling group for creation of synthetic vortex, and storm surge and coastal inundation forecasting.Among others, a multi-platform satellite surface wind analysis developed by Co-operative Institute forResearch in the Atmosphere (CIRA), USA for the TCs are referred by India Meteorological Departmentfor surface wind field monitoring of TC. Hence, a study has been undertaken to analyze the characteristicsof surface wind distribution and hence the structure of TC based on the real time data available fromCIRA during 2007–2013. The study includes 19 TCs over the Bay of Bengal (BOB) and six over ArabianSea (AS). The maximum radial extent of winds reaching threshold values of 34(17), 50(26) and 64(33)knot (ms−1) in each of the four geographical quadrants has been segregated with respect to season offormation, basin of formation and intensity of TC for analysis. The objective is to develop a referencesurface wind structure of TC and examine its validity with respect to physical processes.The size of outer core (34(17) knot (ms−1) wind radial extension) as well as inner core (50(26) and
64(33) knot (ms−1) wind radial extension) increases significantly with increase in intensification of TCover BOB during both pre-monsoon and post-monsoon seasons and over AS during pre-monsoon season.The outer core of winds in TCs over the BOB is asymmetric in both pre-monsoon and post-monsoonseasons and for all categories of intensity of TCs. On the other hand, the asymmetry in inner core windsis significantly less. There is also no asymmetry in radial wind extension over the AS during both theseasons, except in case of outer core wind radial extension of VSCS during pre-monsoon season. The lowlevel environment like enhanced cross equatorial flow, lower/middle level relative humidity, vertical windshear and proximity of TC to the land surface are the determining factors for the size and asymmetryof TCs over the NIO.
1. Introduction
As the government, industry and private sectorinformation needs become more sophisticated andthe observational data improve, there is an increas-ing need for reliable tropical cyclone (TC) surfacewind analysis (Knaff et al. 2011). There is also nowclear evidence that TC impacts (wind and stormsurge damage) are related to measures of the kinet-ic energy derived from the surface wind structures.
Disaster managers who prepare for the impact ofa landfalling TC may use the wind field informa-tion as guidance as to where the most severewind or surge damage may occur. On the otherhand, an insurer may want quantitative dam-age estimates. In this case, surface wind struc-ture, even in a quadrant-based form can servethe purpose. In quadrant-based form, the ‘windradii’ products represent the estimated maxi-mum horizontal extent of a particular maximum
Keywords. Tropical cyclone; surface wind radii; north Indian Ocean.
J. Earth Syst. Sci. 124, No. 7, October 2015, pp. 1573–1598c© Indian Academy of Sciences 1573

1574 M Mohapatra and Monica Sharma
sustained wind speed (MSW), viz., 34(17), 50(26)and 64(33) knot (ms−1) from the circulationcentre (referred as R34, R50 and R64) in eachof four quadrants, viz., northeast (NE), southeast(SE), northwest (NW) and southwest (SW). Thisquadrant-based wind information also serves as in-put to numerical weather prediction (NWP)modelsand storm surge models that are run prior to land-falling events to create synthetic vortex (Chourasiaet al. 2013), as most of the NWPmodels fail to simu-late accurately the location and intensity of the TC.The creation of synthetic vortex helps in improv-ing the track and intensity forecast of the model.In the parametric storm surge prediction mod-els, the surface wind structure in the quadrant-based form along with the radius of maximum wind(RMW) and pressure drop at the centre are uti-lized to create the wind stress and hence predict thestorm surge (Dube et al. 2013). In post-event cases,these wind structure data are utilized for diagno-sis of TC and to better plan future TC forecasts.Engineers and planners rely on historical TC infor-mation to determine long-term risks to facilitiesand infrastructure and to ensure the resilience ofcommunities to potential disasters.Considering all the above, TC surface wind fields
are the subject of operational products of variousTC forecasting agencies in the globe. There havebeen several attempts in recent years to generatereal time surfacewinddistributionaround the centreof TC through satellite-based observations (Kossinet al. 2007), as actual observations through ships andbuoys are verymeager over the vastOceanic regions,especially over north IndianOcean (Mohapatra et al.2012) and the observations through aircraft recon-naissance using various instrumentation includingdrop-sonde, etc., are mostly limited to north Atlan-tic Ocean with the initiative of USA. For this pur-pose, Co-operative Institute for Research in theAtmosphere (CIRA),USAcombines several satellite-based inputs from scatterometer, cloud motion vec-tors, IR flight-level proxy winds and AMSU-basednon-linear balance winds (Bessho et al. 2006) tocreate global satellite-only surface wind analysis.The method makes use of a variational data fittingtechnique on a cylindrical grid that allows variabledata weights in combination with bulk quality con-trol (Knaff et al. 2007). Since 1996, wind analyses(H*Wind) have been conducted on a research basisby Hurricane Research Division (HRD), NationalOcean and Atmospheric Administration (NOAA),USA to create real-time hurricane wind field guid-ance for forecasters at the National Hurricane Cen-ter (NHC), USA.Verification of the wind fields fromCIRA against H*Wind analyses shows that theresulting wind field has mean absolute errors thatare generally <5 m/s. Results were also shown toout-perform Atlantic climatology for 34(17), 50(26)
and 64(33) knot (ms−1) wind radii estimates as wellas show significant temporal correlation with TCsize changes (Knaff et al. 2011). It is found thatwind radii are well correlated with storm radii.Errors are generally lower than climatology (Knaffet al. 2007), except in the SE quadrant. However,64(33) knot (ms−1) winds are too large, which causescentral pressure estimates to be too low for themost intense systems. The 34(17) knot (ms−1) windsare a little too small. There are negative biases in SE(NE) quadrant in the Northern Hemisphere (South-ern Hemisphere). Most of the inner core errors areassociated with poorly estimated RMWs.The TC surface wind structure monitoring and
forecast was commenced by IMD in 2010 (RegionalSpecialized Meteorological Centre (RSMC), NewDelhi, 2011) with the very severe cyclonic storm(VSCS), Giri (20–22 October, 2010) over the Bay ofBengal (BOB). This operational product containedanalyzed and forecast wind field (wind radii in fourgeographical quadrants, viz., NW, NE, SW and SEfor thresholds of 28(14), 34(17), 50(26) and 64(33)knots (ms−1)) valid for next 72 hr till 2012 andforecast period was extended to 120 hr from 2013.The primary methods for TC wind field estimationby IMD involves satellite-based scatterometer esti-mates, cloud motion vectors, water vapour-basedwind vectors, wind estimates from brightness tem-peratures, estimates fromRadar products andNWPmodel analyses products (IMD 2013). The multi-platform satellite-based surface wind analyses asdeveloped by CIRA for the TCs on real time basisare also utilized by IMD for monitoring of surfacewind radii in four geographical quadrants of TCs.Detailed review of the status of monitoring and pre-diction of surface wind structure in the globe and inIndia are discussed in section 2. In the absence ofaircraft reconnaissance and limited buoys, satellite-based wind observations are the only source whenTC is located in the deep sea region of NIO. Hence,the effective utilization of above-mentioned multi-platform-based satellite-derived wind product is veryessential to minimize the error in intensity andstructure monitoring and forecast. So, a study hasbeen undertaken to analyze the mean character-istics of surface wind distribution and hence thestructure of TC based on the real time data avail-able from CIRA during 2007–2013. The databasecontains 25 TCs over the NIO as defined by RSMC,New Delhi. It includes 19 TCs over the BOB and6 TCs over the Arabian Sea (AS). The objective isto examine this product with respect to physicalprocesses over the region in addition to derivingthe climatological information. This study can beutilized as a reference for (i) validation of NWPmodel analyses and forecasts and (ii) real timemonitoring and forecast of surface wind structure.Further, it can be utilized for better understanding

Surface wind structure of tropical cyclones over the north Indian Ocean 1575
of physical processes in genesis, intensification andmovement of TCs over the NIO.
2. Status of surface wind structuremonitoring and prediction in India
and the globe
Over the north Atlantic Ocean, the technology ofobserving the surface wind from reconnaissance air-craft has greatly improved with the operationalimplementation of stepped frequency microwaveradiometer (SFMR) on reconnaissance aircraftutilized both at NOAA for research and NHC forroutine operational reconnaissance (Uhlhorn et al.2007). The use of the SFMR and scatterometry-based sea surface wind data and flight-level dataare used to analyze TCwind field size and structure.However, most of the other TC warning centresrely on satellite techniques to assess TC winds andstructure due to lack of aircraft reconnaissance andseveral new techniques have been developed in therecent years for this purpose.Wind radii for 34(17) and 50(26) knot (ms−1)
are forecast through 72 hr and 64(33) knot (ms−1)radii are forecast through 36 hr by NHC, USA(Rappaport et al. 2009). While this representationof the surface wind structure is recognized as beingcrude, NHC believes that insufficient observationsare available to accurately specify the analysis (orforecast) wind field to any greater precision. Evenwhen reconnaissance aircraft data are available,the vast majority of the circulation remains un-sampled. Even best-track (Jarvinen et al. 1988)estimates of TC size are considered by forecastersto have large relative errors (perhaps 25–40%).Since 2007, JMA has used ASCAT data for
30(15) and 50(26) knot (ms−1) wind radii determi-nation of tropical storms (TCs with MSW of 34(17)knot (ms−1) or more). Rain flagged and wind speedestimates greater than 50(26) knot (ms−1) are notutilized in such analyses. In RSMC, La Reunion,scatterometry is also interpreted with caution in the40(21)–50(26) knot (ms−1)range, and considered low-biased near the RMW (Uhlhorn and Black 2003).The available sparse surface observations frombuoys or synoptic stations (ships are used with morecaution) are used to check validity of scatterometerwinds. Winds radii are given by quadrants for30(15) knot (ms−1) and 50(26) knot (ms−1). Nowind radii and RMW forecasts are made by RSMCLa Re Union. The Australian Bureau of Meteoro-logy (BoM) has three Tropical Cyclone WarningCentres (TCWCs) in Brisbane, Darwin and Perth.The radii of 34(17), 50(26) and 64(33) knot (ms−1)winds are analyzed by these centres based on know-ledge of climatology, ASCAT, ship observations ofopportunity, and the extent/nature of convection,
especially as measured by satellite (passive micro-wave). The CIRA/NESDIS wind analyses are alsoused by them, although forecasters find the val-ues obtained are typically larger than in-house esti-mates. The BoM TCWCs forecast wind radii usinga combination of persistence with a bias towardsclimatology and stage of development; consideringboth landfall and model surface wind fields.RSMC, New Delhi analyses radii of 28(14),
34(17), 50(26) and 64(33) knot (ms−1) 3-min windsin four geographical quadrants every 6 hr basedon 00, 06, 12 and 18 UTC from the stage of deepdepression (MSW of 28(14) knot (ms−1) or more)onwards, if the system is expected to intensify intoa TC. In addition, the forecast wind radii of 28(14),34(17), 50(26) and 64(33) knot (ms−1) thresholdare generated up to 120 hr in the interval of 6 hrfor first 24-hr forecast period and in the intervalof 12 hr for the subsequent forecast periods. Theprimary methods for TC wind field estimation byIMD involve satellite-based scatterometer esti-mates, cloud motion vectors, water vapour-basedwind vectors, wind estimates from brightness tem-peratures, multi-platform satellite-basedwind devel-oped by CIRA, estimates from RADAR productsand NWP model analyses and forecast products(IMD 2013). The IMD’s NWP model system guid-ance includes IMD-Global Forecast system (GFS),UK Meteorogical Office, Japan MeteorologicalAgency (JMA), ARP-Meteo-France, National Cen-tre for Environmental Prediction (NCEP) GFS,Weather Research and Forecast (WRF) and Hur-ricane WRF models. Consensus analysis and fore-casts that gather all or part of the numericalforecast and uses synoptic and climatological guid-ance are utilized to issue analysis and forecastsurface wind radii in four geographical quadrants.
3. Data and methodology
A study has been undertaken to analyze the meancharacteristics of surface wind distribution andhence the structure of TC based on the real timemulti-platform satellite-based data available fromCIRA. Details about the CIRA data are discussedin section 3.1. To carry out the study, the TC datafrom 2007–2013 over the NIO has been considered.The maximum radial extent of winds reachingthreshold values of 34(17), 50(26) and 64(33) knot(ms−1) in each of the four geographical quad-rants has been segregated with respect to season,basin and intensity. The mean and standard devi-ation (SD) for each set of data are calculated andanalyzed.The NIO consists of two sub-basins, viz., BOB
and AS. As the physical characteristics with gene-sis, intensification and movement of TCs over the

1576 M Mohapatra and Monica Sharma
AS differ from that of BOB, the surface wind struc-ture has been analyzed with respect to BOB andAS separately. There are 25 TCs over the NIOincluding 19 TCs over the BOB and 6 over the ASduring the period. A total of 404 cases based on00, 06, 12 and 18 UTC data of CIRA are consid-ered. Further, the TCs over the NIO show bi-modalbehaviour (IMD 2008) in their genesis with pri-mary maxima in post-monsoon season (October–December) and secondary maxima in pre-monsoonseason (March–May). The surface wind analysishas been performed during these two seasons sep-arately, as their tracks, genesis and intensificationcharacteristics are different in these two differentseasons. There has been one TC during monsoonmonths (1–7 June 2007). Since the TC in themonth of June (onset phase of monsoon) has pre-monsoon characteristics, it has been considered asthe TC in pre-monsoon season (March–May) foranalysis purpose. As such, there are 9 (6 over BOBand 3 over AS) and 16 (13 over BOB and 3 overAS) TCs during pre-monsoon and post-monsoonseasons respectively (table 1, figure 1).
To verify the impact of intensity of TCs on thesurface wind structure, the TCs have been clas-sified into four categories, viz., (i) cyclonic storm(CS)(maximum surface wind speed of 34(17)–47(24)knot (ms−1)), (ii) severe cyclonic storm (SCS) (48(25)–63(32) knot (ms−1) or more), (iii) very severe cyclonicstorm (VSCS) (64(33)–119(61) knot (ms−1)) and (iv)super cyclonic storm (SuCS) (120(62) knot (ms−1) ormore) based on the MSW estimated by CIRA sur-face wind analysis. The definition of the TCs ana-lyzed here is same as that adopted by IMD (2013).Past studies indicate that relative humidity (RH)
and vertical wind shear of horizontal wind playdominant role in determining surface wind struc-ture of TC (Hill and Lackmann 2009; Xu and Wang2010). To analyze the associated relative humidity(RH), we have considered the horizontal and verti-cal profile of RH around the TC centre based onNCEP/NCAR Reanalysis-2 (Kanamitsu et al. 2002).This is a 1◦ × 1◦ gridded point data at six hourlyinterval (00, 06, 12 and 18 UTC) corresponding tothe time of observation of sea surface wind basedon multi-platform dataset available from CIRA.
Table 1. Details of the tropical cyclones (TCs) under consideration.
Maximum Basin of Season of Type of track Region of
Sl. no. Year Life period intensity formation formation of TC landfall
1 2007 13–15 May CS BOB PM S/C Bangladesh
2 2007 1–7 June SuCS AS Monsoon S/C Oman, Iran
3 2007 11–16 November VSCS BOB PS R Bangladesh
4 2008 27 April –3 May VSCS BOB PM R Myanmar
5 2008 25–27 October CS BOB PS S/C Bangladesh
6 2008 13–16 November CS BOB PS S/C AP
7 2008 25–27 November CS BOB PS S/C TN
8 2009 14–17 April CS BOB PM R Bangladesh
9 2009 23–26 May SCS BOB PM S/C WB
10 2009 9–12 November CS AS PS R Maharashtra
11 2009 10–15 December CS BOB PS R Sri Lanka
12 2010 17–21 May SCS BOB PM R AP
13 2010 19–23 May CS AS PM S/C –
14 2010 31 May–7 June VSCS AS PM R Oman, Pakistan
15 2010 20–23 October VSCS BOB PS S/C Myanmar
16 2010 4-8 November SCS BOB PS S/C TN
17 2011 29 October–4 November CS AS PS R Oman
18 2011 25–31 December VSCS BOB PS S/C TN
19 2012 28 October–1 November CS BOB PS R TN
20 2012 22–26 October CS AS PS S/C Somalia
21 2013 10–16 May CS BOB PM R Bangladesh
22 2013 8–14 October VSCS BOB PS S/C Odisha
23 2013 19–22 November SCS BOB PS S/C AP
24 2013 23–28 November VSCS BOB PS S/C AP
25 2013 6–14 December VSCS BOB PS R TN
CS: cyclonic storm, SCS: severe cyclonic storm, VSCS: very severe cyclonic storm.BOB: Bay of Bengal, AS: Arabian Sea, PM: pre-monsoon season, PS: post-monsoon season.R: recurving/looping, S/C: straight moving/climatological.AP: Andhra Pradesh, TN: Tamil Nadu and Puducherry.

Surface wind structure of tropical cyclones over the north Indian Ocean 1577
Figure 1. Tracks of TCs over the north Indian Ocean during 2007–2013 under consideration in the study.
Vertical profile has been considered for the standardisobaric levels from 1000–100 hPa at four rep-resentative points located 2◦ latitude/longitudeaway from the centre of the TC in four geograph-ical quadrants. As the mid-tropospheric RH playsa significant role in cyclogenesis and intensifica-tion, the horizontal distribution of RH at 500 hPalevel is also presented and analyzed. Quality of thisdataset depends on the observations available overthe sea region and their assimilation in the NCEPGlobal Forecast System (GFS) model. The verticalwind shear between upper and lower troposphericlevels has also been analyzed based on the satellite-derived products available from Co-operative Insti-tute for Meteorological Satellite Studies (CIMSS)(http://tropic.ssec.wisc.edu) corresponding to thetime of observation of surface wind from multi-platform satellite dataset from CIRA. The limita-tion of this data includes the fact that, this productis based on tracking of the cloud or water vapourfeatures as mentioned above and low level windsare often not available near the core of TC. Hence,the method of bogusing is applied using ECMWFanalyses and forecasts as first guess.Though there can be other dynamical factors like
lower level vorticity/convergence and upper leveldivergence, etc., governing the wind structure ofTC, here the study has been limited to analysis of
the role of RH and vertical wind shear. The roleof other dynamical features will be taken up in aseparate study.
3.1 Surface wind data developed by CIRA
The experimental global product by CIRA that com-bine satellite-based winds consists of (i) advancedmicrowave sounding unit (AMSU)-derived bal-anced winds, (ii) scatterometry, (iii) cloud/featuretrack winds, and (iv) infra red (IR)-based analogsof flight-level (850–700 hPa) winds (i.e., aircraft-based wind analogs). These are created as partof an NCEP, USA operational TC intensity andstructure products. The real-time cases are avail-able at http://rammb.cira.colostate.edu/products/tc realtime/ and http://www.ssd.noaa.gov/PS/TROP/mtcswa.html.AMSU antenna temperatures are used to estimate
temperature retrievals and cloud liquid water(Goldberg 1999). Cloud liquid water and horizontaltemperature anomalies are used to correct temper-ature retrievals (Demuth et al. 2004, 2006). The cor-rected temperatures are then analyzed on standardpressure levels (using GFS boundary condi-tions). Using the resulting height field, the non-linear balance equation is solved to estimate the

1578 M Mohapatra and Monica Sharma
2-dimensional wind field at 700 hPa level, whichis then converted into 10-m surface wind (Besshoet al. 2006). Because of the resolution of AMSU,the winds in the core of TCs are not resolved usingthis method. The AMSU is based on Polar orbit-ing satellite (NOAA-15, 16 and 18), which has poorresolution. The winds are too weak near the centreand too asymmetric.Sea surface wind based on principle of scattero-
metry uses active radar method (k-band, c-band).The surface wind (10-m wind) vectors are derivedfrom ASCAT and OSCAT scatterometers. WhileASCAT uses c-band radar with 25 km resolutionand less affected by precipitation, OSCAT, likeQuikSCAT uses k-band radar. They provide accu-rate low level winds and attenuate in high winds(i.e., �50(26) knot (ms−1)). Winds are adverselyaffected by heavy precipitation (Uhlhorn and Black2003).The cloud/feature tracked winds are routinely
available based on Geostationary OperationalEnvironmental Satellites (GOES), USA. However,low-level winds are often not available near the coreof TCs. It is based on tracking of clouds or watervapor features, which are assigned a pressure level.These winds are available once in 3 hrs.The IR flight-level analog winds (Mueller et al.
2006) are representative winds near the core of theTC and make surface analysis possible. Based onIR imagery, the analysis of the azimuthal meanbrightness temperatures is carried out, which helpsin scaling the TC size by providing two-dimen-sional flight-level (700 hPa) wind estimate. Theshortcomings are that the winds are too symmetricand have limitations in cases of small RMW andmultiple wind maxima.
4. Results and discussion
The mean pattern of surface wind radii for windthreshold of 34(17), 50(26) and 64(33) knot (ms−1)with respect to AS TCs during pre-monsoon andpost-monsoon seasons are analysed and discussedin sections 4.1 and 4.2, respectively. Similarly,mean pattern of surface wind radii for wind thresh-old of 34(17), 50(26) and 64(33) knot (ms−1) withrespect to BOB TCs during pre-monsoon and post-monsoon seasons are presented and discussed insections 4.3 and 4.4, respectively.
4.1 Mean pattern of surface wind radii of TCsover the AS during pre-monsoon season
The mean pattern of surface wind radii for fourgeographical quadrants of TCs over the AS duringpre-monsoon season with different intensities areshown along with the SD in table 2 and figure 2.The results have been analyzed with respect toasymmetry in wind and size of the TC in thefollowing subsections.
4.1.1 Asymmetry in wind distribution
Considering 34(17) knot (ms−1) wind threshold,radius varies from 40(74) nautical mile (nm) (km)in NW and SW quadrants to 45(83) nm (km) inNE and 48(89) nm (km) in SE quadrant in caseof CS (table 2, figure 2). There is no significantdifference in mean wind radii in four geographicalquadrants according to Student’s t test (table 3).Hence, the wind distribution is symmetric aroundthe centre. When the TC intensifies into SCS,
Table 2. Mean wind radii (nm/km) in four quadrants of a tropical cyclone over the Arabian Sea during pre-monsoon season.
Wind
threshold
(knot/ Mean wind radii (nm/km) Standard deviation (nm/km)
ms−1) Category NW NE SW SE Mean NW NE SW SE Mean
34/17 CS 40/74(15) 45/83(16) 40/74(16) 48/89(17) 43/80 13/24 16/30 10/19 17/31 13.6/25.2
SCS 76/141(14) 72/133(14) 71/131(14) 71/131(14) 72.4/134.1 19/35 16/30 17/31 21/39 17.2/31.9
VSCS 122/226(17) 134/248(17) 107/198(17) 117/217(17) 120/222 18/33 30/56 27/50 44/81 22.8/42
SuCS 113/209(5) 127/235(5) 120/222(5) 122/226(5) 120/223 27/50 40/74 12/22 17/31 18.4/34.1
50/26 SCS 40/74(14) 40/74(14) 40/74(12) 41/76(13) 40.3/74.6 11/20 12/22 11/20 14/26 12.0/22.2
VSCS 69/128(17) 71/131(17) 62/115(17) 61/113(17) 65.8/122 26/48 20/37 22/41 10/19 18.4/34.1
SuCS 72/133(5) 70/130(5) 65/120(5) 65/120(5) 68.0/126 21/39 17/31 14/26 7/13 13.0/24
64/33 VSCS 40/74(17) 43/80(17) 39/72(15) 41/76(15) 40.8/75.6 16/30 13/24 12/22 11/20 12.6/23.3
SuCS 44/81(5) 46/85(5) 40/74(5) 44/81(5) 43.7/90 12/22 11/20 10/19 11/20 10.8/20
CS: cyclonic storm, SCS: severe CS, VSCS: very severe CS, SuCS: super CS.NW: northwest, NE: northeast, SW: southwest, SE: southeast.Figures inside the parentheses indicate number of observations.

Surface wind structure of tropical cyclones over the north Indian Ocean 1579
Figure 2. Quadrant radii of 34(17) (green), 50(26) (yellow)
and 64(33) (red) knot (ms−1) wind (R34, R50 and R64) inassociation with TCs of different intensities (a) CS, (b) SCS,(c) VSCS, and (d) SuCS during pre-monsoon season. Thevalues written inside each quadrant indicate mean R34, R50and R64 (nm).
wind radius of 34(17) knot (ms−1) wind becomes71(131) nm (km) in SE and SW quadrants, 72(133)nm (km) in NE and 76(141) nm (km) in NW quad-rants (table 2). Like the case of CS, the differencein mean wind radii is not statistically significantfor any two geographical quadrants (table 3).When SCS intensifies into VSCS stage, theradial extent becomes maximum in NE quad-rant (134(248) nm (km)) followed by NW quadrant(122(226)nm(km)) and is minimum in SWquadrant(107(198) nm (km)). The difference in mean windradii between NW and SW quadrants is significantat 5% level and between NE and SW quadrants at1% level (table 3).When the system intensifies fromVSCS to SuCS stage, there is no significant changein asymmetry of the wind distribution. However,the number of cases in SuCS stage is less (5) togeneralize the conclusion. Considering the radiusof 50(26) knot (ms−1) wind threshold, the asym-metry decreases in case of SCS, VSCS and SuCSand is statistically insignificant (tables 2, 3, figure2). The asymmetry further decreases when weconsider wind radii of 64(33) knot (ms−1) windthreshold and distribution becomes almost uniformaround the centre. Thus the asymmetry is limitedto the outer core of the storm, which determines thesize of the storm and in case of VSCS only withthe extent of 34(17) knot (ms−1) wind being max-imum in northeastern sector. The higher wind innortheastern sector may be due to addition of stormvector motion in this sector, as the storm moveswest-northwestwards/northwestwards (figure 1).Toanalyze the cause and effect relationship betweenthe storm vector motion and the wind radii dis-tribution, the translational speed and direction oneach day of the TC have been calculated and com-pared with the wind radii. Considering the exampleof VSCS, Phet over AS on 3 June 2010 when theintensity was VSCS, the mean translational speedand direction of the TC was 5.2(2.7) knot (ms−1)and 300◦, respectively. From figure 3(c), winds innortheast sector are east–southeasterly and hencethe storm motion vector becomes additive, whereasit does not have much effect on southeast sector andreduces the wind in northwest and southwest sec-tors. The maximum impact of storm motion vectorin modifying the wind distribution is about 5(2.6)knot (ms−1). However, as it can be seen from figure3(a–f), the R-34 is not always maximum in NEquadrant throughout the life period of TC, as itbecomes higher in SE quadrant on some days.Koteswaram and Gaspar (1956) analyzing the sur-face wind structure based on the ship data of severecyclones (48(25) knot (ms−1) and more) over theBOB and AS during 1925–1954 have shown thatwind velocity is more in the right half of the TCwith respect to direction of movement. The asym-metry in maximum wind varied from right forward

1580 M Mohapatra and Monica Sharma
Table 3. Level of significance (%) in difference of mean wind radii (nm/km) in four geographical quadrants of tropicalcyclones over the Bay of Bengal and Arabian Sea.
Level of significance (%) in difference of mean wind radii between various quadrants
Wind NW– NW– NW NE– NE– SW– NW– NW– NW– NE– NE– SW–
threshold NE SW SE SW SE SE NE SW SE SW SE SE
(knot/ms−1) Season Category Bay of Bengal Arabian Sea
34/17 Pre-M CS
SCS 01 05 01
VSCS 05 05 01 05 01
SuCS
Post-M CS 05 05 05
SCS 01 05 01 05
VSCS 05 05 05
SuCS 05 01 01 05
50/26 Pre-M SCS
VSCS 05
SuCS
Post-M SCS
VSCS
SuCS 05 01
64/33 Pre-M VSCS
SuCS
Post-M VSCS
SuCS 05 01
CS: cyclonic storm, SCS: severe CS, VSCS: very severe CS, SuCS: super CS, NW: northwest,NE: northeast, SW: southwest, SE: southeast, Pre-M: pre-monsoon, Post-M: post-monsoon.
sector in some cases to left rear sector in othercases. The size of the TC was found to be asym-metrical with radius of 34(17) knot (ms−1) windbeing maximum in NE quadrant and minimum inSW quadrant. As there was no segregation of databased on basin, season and intensity, it is difficultto make more specific conclusions from this study.Colon et al. (1970) analyzed the structure of theTC based on the only TC over the AS on 22ndMay 1963 using aircraft reconnaissance. Accordingto him, the low level wind field showed a band ofmaximum winds (>50(26) knot (ms−1)) at a heightof 2000 ft extending in a slightly spiralling configu-ration around the rear and right semi-circles. Theradial position of this band varied considerably indifferent quadrants indicating asymmetry in winddistribution.The larger mean wind radius in NE quadrant
may be due to the fact that the TCs over theAS during pre-monsoon season occur in associa-tion with monsoon surge and inter-tropical con-vergence zone (ITCZ), which roughly runs along10◦N in the month of May (Rao 1976). In boththese cases, the cross equatorial flow increases lead-ing to increase in wind over NE quadrant. Toillustrate the above, the wind distribution at sur-face level based on CIRA’s multi-platform satellite
observation during the life period of TC, Phet,a VSCS over AS during 31 May–7 June, 2010 isshown in figure 3. It clearly indicates the crossequatorial flow being fetched into the NE quad-rant of the TC. It goes against the earlier findingsof Dean et al. (2009) that the size of a given TCmay be primarily a function of the geometry of thedisturbance that serves to initiate it rather thana property of the large-scale environment, as thecross equatorial flow is a large scale environmentfeature.The role of RH has been examined during the
life period of the TC. A typical example of thehorizontal distribution of RH at 500 hPa level dur-ing life period of TC, Phet is presented in figure 4based on NCEP/NCAR Reanalysis-2. It is gener-ally expected that the RH in and around the cen-tre of TC would be high. However, it can beenseen from figure 4 that the region of maximum RHvaries during the life cycle of a TC and may beaway from the centre of the TC. It may be due tothe fact that the region of maximum RH dependson several factors including the stage of TC likedeveloping, matured and dissipating stage, envi-ronmental conditions like vertical wind shear andlocation of embedded meso-scale vortices in the TCfield, etc. For example, in the case of TCs with

Surface wind structure of tropical cyclones over the north Indian Ocean 1581
Figure 3. (a–f) Surface wind distribution at 0000 UTC of 1–6 June 2010 in association with very severe cyclonic storm,Phet over the Arabian Sea (31 May–7 June 2010).

1582 M Mohapatra and Monica Sharma
(a) (b) (c)
(d) (e) (f)
Figure 4. (a–f) Relative humidity at 500 hPa level at 0000 UTC of 1–6 June 2010 in association with the very severecyclonic storm, Phet over the Arabian Sea (1–7 June 2010). +: Centre of TC as per IMD best track.
convection sheared from the centre, which usuallyoccurs in case of marginal TCs and developingTCs, the centre of maximum RH may be differentfrom the system centre. Comparing figures 2, 3 and4, the region of higher radial extent is in agreementwith the region of higher RH. To analyze furtherthe relation between RH and wind distribution,we have considered the vertical profile of RH atcentre and four representative points in four geo-graphical quadrants located at two degrees latitudeand longitude away from the centre. The resultsare shown in figure 5(a–d) for the representativeTC, Phet over the AS during pre-monsoon season.It is found that quadrant with maximum R34 issame as the quadrants associated with maximumRH at lower tropospheric (900–850 hPa) and mid-dle tropospheric (500–400 hPa) levels on 2nd June,middle level on 3rd June and lower levels on 4thand 5th June, 2010. The RH has been maximum
in SE followed by NE quadrant on 2–5 June inlower levels and in SE quadrant on 2 June andNE quadrant on 3–5 June in middle levels. Hence,asymmetry in wind structure of TC is reflected inthe distribution of RH in lower and middle tropo-spheric levels also. Of course, the preferred level ofmaximum RH varies within the life cycle of a TCas well as from one TC to the other as it will beshown in next section.
4.1.2 Size of TC
When the CS intensifies into SCS stage, there issignificant increase in size (radius of 34(17) knot(ms−1) wind threshold) due to increase in radialextent in all quadrants at 1% level (table 4). WhenSCS intensifies into VSCS stage, the wind radiusagain significantly increases in all quadrants at

Surface wind structure of tropical cyclones over the north Indian Ocean 1583
(a) (b) (c)
(d) (e) (f)
(g) (i)(h)
(j) (l)(k)
100
200
300
400
500
600
700
800
900
1000
0 10 20 30 40 50 60 70 80 90 100
CentreSW: R34=100nm(185km), R50=60nm(110km)NW: R34=105nm(195km), R50=55nm(100km)NE: R34=105nm(195km), R50=60nm(110km)SE: R34=130nm(240km), R50=70nm(130km)
100
200
300
400
500
600
700
800
900
1000
0 10 20 30 40 50 60 70 80 90 100
Centre
NE: R34=180nm(315km), R50=75nm(140km)
SE: R34=140nm(260km), R50=55nm(100km)
SW: R34=140nm(260km), R50=55nm(100km)
NW: R34=145nm(270km), R50=85nm(155km)
100
200
300
400
500
600
700
800
900
1000
0 10 20 30 40 50 60 70 80 90 100
SE: R34=175nm(325km), R50=55nm(100km)
Centre
NE: R34=160nm(295km), R50=65nm(120km)
SW: R34=120nm(215km), R50=55nm(100km)
NW: R34=150nm(280km), R50=40nm(75km)
100
200
300
400
500
600
700
800
900
1000
0 10 20 30 40 50 60 70 80 90 100
Centre
NE: R34=80nm(150km), R50=25nm(45km)
SE: R34=70nm(130km), R50=30nm(55km)
SW: R34=65nm(120km), R50=30nm(55km)
NW: R34=70nm(130km), R50=25nm(45km)
100
200
300
400
500
600
700
800
900
1000
0 10 20 30 40 50 60 70 80 90 100
CentreNE: R34=100nm(185km)SE: R34=100nm(185km)SW: R34=80nm(150km)NW: R34=55nm(100km)
100
200
300
400
500
600
700
800
900
1000
0 10 20 30 40 50 60 70 80 90 100
CentreNE: R34=70nm(130km)SW: R34=0nm(0km)NW: R34=45nm(80km)SE: R34=80nm(150km)
100
200
300
400
500
600
700
800
900
1000
0 10 20 30 40 50 60 70 80 90 100
Centre
NE: R34=95nm(175km), R50=40nm(75km)
SE: R34=110nm(205km), R50=50nm(95km)
SW: R34=90nm(165km), R50=40nm(75km)
NW: R34=95nm(175km), R50=40nm(75km)
100
200
300
400
500
600
700
800
900
1000
10 20 30 40 50 60 70 80 90 100
NE: R34=60nm(110km)SW: R34=45nm(85km)NW: R34=60nm(110km)CentreSE: R34=50nm(95km)
100
200
300
400
500
600
700
800
900
1000
10 20 30 40 50 60 70 80 90 100 110 120
CentreNE: R34=75nm(140km), R50=30nm(55km)SE: R34=65nm(120km), R50=0nm(0km)SW: R34=65nm(120km), R50=20nm(35km)
100
200
300
400
500
600
700
800
900
1000
0 10 20 30 40 50 60 70 80 90 100 110
Centre
SE: R34=115nm(210km), R50=70nm(130km)
SW: R34=125nm(230km), R50=75nm(140km)
NE: R34=140nm(260km), R50=75nm(140km)
NW=: R34=140nm(260km), R50=75nm(140km)
100
200
300
400
500
600
700
800
900
1000
0 10 20 30 40 50 60 70 80 90 100
Centre
NE: R34=150nm(280km), R50=85nm(155km)
SE: R34=125nm(230km), R50=75nm(140km)
SW: R34=135nm(250km), R50=70nm(130km)
NW: R34=150nm(280km), R50=90nm(165km)
100
200
300
400
500
600
700
800
900
1000
0 10 20 30 40 50 60 70 80 90 100
SE: R34=245nm(455km), R50=45nm(80km)
SW: R34=100nm(185km), R50=35nm(65km)
NW: R34=135nm(250km), R50=45nm(80km)
Centre
NE: R34=245nm(455km), R50=50nm(90km)
Figure 5. Relative humidity (%) at standard isobaric levels at four representative points (2◦ latitude/longitude away fromthe centre of TC) in four geographical quadrants of TC (a–d) 00 UTC of 2, 3, 4 and 5 June 2010 for Phet, (e) 00 UTC of11 November 2009 for Phyan, (f–g) 06 UTC of 24 and 00 UTC of 25 May 2009 for Aila, and (h–l) 1200 UTC of 9th, 00UTC of 10th, 11th, 12th and 13th October 2013 for Phailin.
1% level (table 4). When the system intensifiesfrom VSCS to SuCS stage, there is no significantchange in size. Hence the size of the TC increaseswith increase in intensity upto VSCS stage. Thesize of the 50(26) knot (ms−1) wind also signifi-cantly increases as the TC intensifies from SCS toVSCS stage. This observation on increase in sizewith increase in intensity goes against the fact over
north Atlantic found by Frank (1977). Accordingto him, while the inner structure of a TC oftenvaries significantly both during the lifetime of astorm and across storms, the outer storm radius,defined as the radius at which the perturbationwinds directly associated with the storm vanish,is believed to remain relatively constant during astorm’s lifetime.

1584 M Mohapatra and Monica Sharma
4.2 Mean pattern of surface wind radii of TCsover the AS during post-monsoon season
4.2.1 Asymmetry in wind distribution
Considering the 34(17) knot (ms−1) wind radiiassociated with CS (table 5, figure 6), it is max-imum in SE (107(198) nm (km) followed by SW
quadrant (83(154) nm (km)) and minimum overNE quadrant (63(117) nm (km)). However, the dif-ference in mean wind radii for any two geographi-cal quadrants is not statistically significant at 5%level (table 3). The 34(17) knot (ms−1) wind radiusin case of SCS, becomes maximum in NE followedby NW quadrant and minimum in SW quadrant
Table 4. Level of significance (%) in difference of mean wind radii with intensification of tropical cyclones over the Bay ofBengal and Arabian Sea.
Level of significance (%) in change in wind radii in different quadrants and
Wind threshold average radii with change in intensity
(knot/ms−1) Basin Season CS to SCS SCS to VSCS VSCS to SuCS
34/17 BOB Pre-M NS 1% level for all quadrants DNA
and average radii
BOB Post-M 1% level: NW, NE 1% level for all quadrants 1% level: SW, SE, NE,
and 5% level: SE and average radii average and 5% level:
and average radii NW radii
AS Pre-M 1% level for all 1% level for all quadrants NS
quadrants and and average radii
average radii
AS Post-M NS DNA DNA
50/26 BOB Pre-M NA 1% level: NE, SW and NA
average radii
BOB Post-M NA 1% level for all quadrants 1% level for all quadrants
and average radii and average radii
AS Pre-M NA 1% level for all quadrants NS
and average radii
AS Post-M NA DNA DNA
64/33 BOB Pre-M NA NA DNA
BOB Post-M NA NA 1% level for all quadrants
and average radii
AS Pre-M NA NA NS
AS Post-M NA NA DNA
AS: Arabian Sea, BOB: Bay of Bengal.CS: cyclonic storm, SCS: severe CS, VSCS: very severe CS, SuCS: super CS.NW: northwest, NE: northeast, SW: southwest, SE: southeast.Pre-M: pre-monsoon, Post-M: post-monsoon.DNA: data not available.NA: not applicable as MSW with CS is <50(26) knot (ms−1) and SCS is <64(33) knot (ms−1).NS: not significant at 5% level.
Table 5. Mean wind radii (nm/km) in four quadrants of a tropical cyclone over the Arabian Sea during post-monsoon season.
Wind threshold Mean wind radii (nm/km) Standard deviation (nm/km)
(knot/ms−1) Category NW NE SW SE Mean NW NE SW SE Mean
34/17 CS 71/131(8) 63/117(10) 83/154(6) 107/198(6) 71.8/133 79/146 70/130 96/178 117/217 76.9/142
SCS 73/135(2) 78/145(2) 55/102(2) 68/126(2) 68.1/126.1 4/7.4 4/7.4 14/26 4/7.4 4.4/8.1
50/26 SCS 25/46(2) 25/46(2) 25/46(2) 25/46(1) 25/46 – – – – –
CS: cyclonic storm, SCS: severe CS, VSCS: very severe CS, SuCS: super CS.NW: northwest, NE: northeast, SW: southwest, SE: southeast.Figures given within parentheses indicate the number of observations.–: data not sufficient.

Surface wind structure of tropical cyclones over the north Indian Ocean 1585
Figure 6. Quadrant radii of 34(17) (green), 50(26) (yellow)
and 64(33) (red) knot (ms−1) wind (R34, R50 and R64) inassociation with TCs of different intensities (a) CS, (b) SCS,(c) VSCS, and (d) SuCS during post-monsoon season. Thevalues written inside each quadrant indicate mean R34, R50and R64 (nm).
(table 5), though there is no significant differencein radii in different quadrants at 5% level (table 3).Considering the 50(26) and 64(33) knot (ms−1)wind threshold, there is no asymmetry in winddistribution like that in pre-monsoon season TCsover the AS. Hence, there is no significant asym-metry in wind distributions around the centre ofTC over the AS during post-monsoon season fordifferent thresholds, like 34(17), 50(26) and 64(33)(ms−1) winds. It may be due to the fact that thewind distribution in post-monsoon TC is modu-lated by the combined effect of the forward speedof TC, cross equatorial flow and the northeastmonsoon. To illustrate the above fact, the sur-face wind distribution in association with a post-monsoon TC, Phyan (9–12 November, 2009) overthe AS is shown in figure 7. To analyze the roleof RH, the horizontal distribution of RH at mid-dle tropospheric level for TC, Phyan is shown infigure 8 and the vertical profile of RH at four rep-resentative points in four geographical quadrantsof TC, Phyan are shown in figure 5(e). It is foundthat RH is maximum in NE quadrant in lower andmiddle levels at 0000 UTC of 11th November, 2009which is also the quadrant of maximum R34. At0600 and 1200 UTC of 11th November, 2009, theRH is maximum in NW followed by NE quadrantin middle levels (figure 8) and R34 is also maximumin NW quadrant (figure 6).
4.2.2 Size of TC
As the TC over the AS in post-monsoon seasonintensifies into SCS, the size of the TC (radius of34(17) knot (ms−1) wind) does not increase signifi-cantly unlike pre-monsoon season (tables 4 and 5).However, there is significant increase in size of innercore winds (50(26) knot (ms−1) or more) when theCS intensifies into SCS. Dean et al. (2009) investi-gated the size distribution of Atlantic TCs, notingthat the underlying internal and environmental fac-tors that determine both individual storm size andthe climatological size distribution remain enig-matic. It is argued that, in the absence of landinteraction, the size of a storm is observed tovary only marginally during its lifetime prior torecurvature into the extra-tropics. However, signif-icant variation exists between storms, regardless ofbasin, location and time of year. Considering thetracks of TCs over AS during post-monsoon sea-son, it can be observed that there was northeast-ward recurvature of one of the three TCs underthe influence of mid-latitude westerlies and theother two were not impacted by mid-latitude west-erlies. Further, the land interaction is less overAS, as most parts of the track lies over the seaarea.

1586 M Mohapatra and Monica Sharma
Figure 7. Surface wind distribution at (a) 0600 UTC of 10 November, (b) 0000, (c) 0600, and (d) 1200 UTC of 11 November,in association with cyclonic storm, Phyan over the Arabian Sea (9–12 November 2009).
4.3 Mean pattern of surface wind radii of BOBTCs during pre-monsoon season
4.3.1 Asymmetry in wind distribution
The mean pattern of surface wind radii for fourgeographical quadrants of TCs over the BOB dur-ing pre-monsoon season with different intensitiesare shown along with the SDs in table 6 andfigure 2. The 34(17) knot (ms−1) wind radius incase of CS is maximum in SE quadrant (82(152)
nm (km)) and minimum over NW quadrant (52(96)nm (km)). However, the asymmetry is not statis-tically significant at 5% level. When the systemintensifies into SCS, the asymmetry is significant at5% level between NW and NE/SW/SE quadrants.The 34(17) knot (ms−1) wind radius becomes max-imum in SE (72(133) nm (km)) and minimum overNW quadrant (52(96) nm (km)). The wind radiusbecomes maximum in SE (121(244) nm (km)) andminimum in NW (89(165) nm (km)) quadrant in

Surface wind structure of tropical cyclones over the north Indian Ocean 1587
(a) (b)
(c) (d)
Figure 8. Relative humidity at 500 hPa level at (a) 0600 UTC of 10 November and (b) 0000, (c) 0600 and (d) 1200 UTCof 11 November 2009 in association with the cyclonic storm, Phyan over the Arabian Sea (9–12 November 2009). +: Centreof TC as per IMD best track.
VSCS stage. The asymmetry is significant at 5%level between NW and NE, NW and SW and at 1%level between NW and SE quadrants. Thus, unlikeTCs over the AS, the sector of larger wind radiusdoes not change with intensification of the TC overthe BOB in pre-monsoon season. The larger windradius in SE quadrant may be due to the fact thatthe TCs over the BOB during pre-monsoon seasonoccur mainly in association with monsoon surgeand ITCZ, which roughly runs along 10◦N in the
month of May and early June. The frequency ofTCs in pre-monsoon season is maximum in themonth of May. In these cases, the cross equato-rial flow increases leading to increase in wind overSE quadrant. It goes against the earlier findingsof Dean et al. (2009) as mentioned in previoussection 4.1.1. To illustrate it further, the multi-platform satellite-based surface wind in case of anSCS, Aila over the BOB during 23–26 May 2009,which occurred during onset phase of monsoon is

1588 M Mohapatra and Monica Sharma
Table 6. Mean wind radii (nm/km) in four quadrants of a tropical cyclone over the Bay of Bengal during pre-monsoonseason.
Windthreshold Mean wind radii (nm/km) Standard deviation (nm/km)
(knot/ms−1) Category NW NE SW SE Mean NW NE SW SE Mean
34/17 CS 52/96(19) 64/119(22) 69/128(16) 82/152(22) 72.7/134.6 44/81 30/56 72/133 76/141 48.5/90
SCS 52/96(29) 71/131(29) 61/113(29) 72/133(29) 63.9/118.3 16/30 35/65 20/37 36/67 23.1/43
VSCS 89/165(24) 104/193(24) 114/211(24) 121/224(24) 107.0/198 17/31 32/59 51/94 43/80 29.8/55
50/26 SCS 32/59(6) 31/57(13) 29/54(8) 43/80(16) 31.7/58.7 11/20 12/22 8/15 50/93 6.9/13
VSCS 39/72(24) 43/80(24) 48/89(24) 51/94(24) 44.9/83 9/17 12/22 21/39 22/41 14.6/27
64/33 VSCS 24/44(23) 25/46(22) 26/48(23) 27/50(24) 25.7/48 6/11 5/9 8/15 9/17 6.1/11
CS: cyclonic storm, SCS: severe CS, VSCS: very severe CS, SuCS: super CS.NW: northwest, NE: northeast, SW: southwest, SE: southeast.Figures given within parentheses indicate the number of observations.
shown in figure 9. To examine the role of RH, thehorizontal distribution of RH at middle level dur-ing life period of Aila are shown in figure 10 andvertical profiles of RH are shown in figure 5(f–g).While the RH is maximum in SE followed by NEquadrant in lower and middle levels on 24th and25th May, 2009 (figure 5f–g), the R34 is alsomaximum in SE followed by NE quadrant (table 6,figure 2).Considering the 50(26) knot (ms−1) wind radii,
the asymmetry decreases. However, the radialextent is maximum in SE quadrant in case of SCSand VSCS like that of 34(17) knot (ms−1) windradius (table 6). The difference in wind radii issignificant only between NE and SE quadrants incase of SCS (table 3). Considering the wind radiiof 64(33) knot (ms−1) wind, the distribution issymmetrical about the centre of TC. Thus theasymmetry in outer core wind increases with inten-sification of TC, being symmetrical in CS stage andthe radial extent is maximum in SE quadrant inSCS or higher intensity stage. The inner core windsof 50(26) and 64(33) knot (ms−1) are symmetricalin case of VSCS or higher intensity TCs.
4.3.2 Size of TC
There is no significant change in size (34(17)knot (ms−1) wind radius) when CS intensifies intoSCS (table 4). When SCS intensifies into VSCS,the average size significantly increases along withthat in all four quadrants at 1% level (table 4).Also there is significant increase in size of 50(26)knot (ms−1) wind radii in NE and SW quadrantsalong with the average wind radii. Hence to con-clude, the size of outer core as well as inner corewinds increases significantly with increase in inten-sification of TC over BOB during pre-monsoonseason.
4.4 Mean pattern of surface wind radii of BOBTCs during post-monsoon season
4.4.1 Asymmetry in wind distribution
The 34(17) knot (ms−1) wind distribution in caseof the post-monsoon season TCs is shown in table 7and figure 6. The radial extent is maximum overSE (69(128) nm (km)) followed by SW (65(120)nm (km)) quadrant and minimum over NW (48(89)nm (km)) quadrant. The asymmetry is significantat 5% level between NW and SW, NW and SE andNE and SE quadrants. As the CS intensifies intoSCS, the radial extent becomes maximum in NEfollowed by NW quadrant and is minimum overSE quadrant. The asymmetry is significant at 1%level between NW and SE, NE and SE and at 5%level between NE and SW quadrants. Hence, higherradial extent shifts from southern to northern sec-tor as CS intensifies into SCS like that of TCs overthe AS during post-monsoon season due to simi-lar reasons. When SCS intensifies into VSCS, theasymmetry continues and is significant at 5% levelbetween NW and SE, NW and SW and NE and SWquadrants. During VSCS stage, the wind radius ismaximum over NW (112(207) nm (km)) followedby NE (110(203) nm (km)) quadrant. With inten-sification into SuCS stage, asymmetry is also sig-nificant at 1% level between NW and SW, NE andSW and at 5% level between NW and NE and SWand SE quadrants. Thus the outer core winds aresignificantly asymmetric in all stages of intensityof TCs over the BOB during post-monsoon season.However, the region of higher radial extent shiftsfrom southern sector in CS stage to northern sec-tor in SCS/VSCS stage. The inner core winds aresymmetrical around the centre.According to Fujibe and Kitabatake (2007),
asymmetries in the outer regions of the TC wererelated to strong TCs in a thermally asymmetric

Surface wind structure of tropical cyclones over the north Indian Ocean 1589
(a) (b)
(c) (d)
Figure 9. Surface wind distribution at (a) 0600 UTC of 24 May and (b) 0000 and (c) 1200 UTC of 25 May and (d) 0000 UTCof 26 May in association with severe cyclonic storm, Aila over the Bay of Bengal (23–26 May 2009).
environment. It is needless to mention that duringthe period of analysis, the BOB has witnessedstronger TCs in post-monsoon seasons as 8 out of13 TCs were SCS/VSCS. Also the thermal asym-metry is higher over the BOB during post-monsoonseason due to prevalence of northeast monsooncirculation to the south of 15◦N and mid-latitudewesterlies to the north of 20◦N. The SD is higherin case of 34(17) knot (ms−1) wind radii over SW
and SE quadrants in case of CS indicating largecase to case variation like that of pre-monsoon CSover the BOB.Considering 50(26) and 64(33) knot (ms−1) wind
radii, winds are almost symmetrical in case of SCSand VSCS with low SDs. According to Fujibe andKitabatake (2007), symmetric inner core winds areassociated with strong mature and symmetric TC.As mentioned in previous paragraph, the frequency

1590 M Mohapatra and Monica Sharma
(a) (b)
(c) (d)
Figure 10. Relative humidity at 500 hPa level at (a) 0600 UTC of 24 May and (b) 0000 and (c) 1200 UTC of 25 May and(d) 0000 UTC of 26 May 2009 in association with the severe cyclonic storm, AILA over the Bay of Bengal (23–26 May2009). +: Centre of TC as per IMD best track.
of strong TCs (SCS/VSCS) was higher over BOBin post-monsoon season during 2007–2013 (periodof study).To examine the role of RH at lower and middle
tropospheric levels on the asymmetry in wind dis-tribution, the surface wind distribution and hor-izontal distribution of RH at middle levels in arepresentative TC, Phailin (9–13th October 2013)are shown in figures 11 and 12, respectively. The
vertical profile of the RH in four geographicalquadrants of TC, Phailin are shown in figure 5(h–l). The quadrant of maximum R34 is same as thequadrant with maximum RH in lower levels at0000 UTC of 11th and 13th and at both lowerand middle levels on 12th October 2013. It isnot in agreement at 1200 UTC of 9th and 0000UTC of 10th October 2013 (growing phase of TC,Phailin).
Surface wind structure of tropical cyclones over the north Indian Ocean 1591
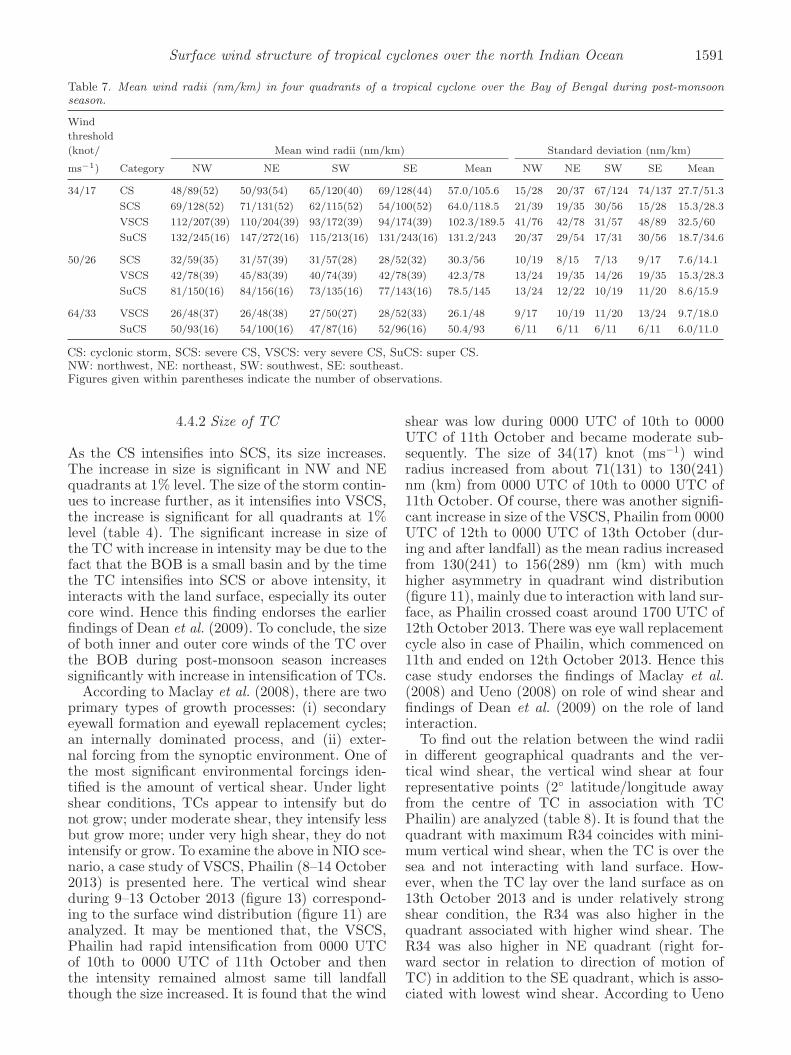
Table 7. Mean wind radii (nm/km) in four quadrants of a tropical cyclone over the Bay of Bengal during post-monsoonseason.
Wind
threshold
(knot/ Mean wind radii (nm/km) Standard deviation (nm/km)
ms−1) Category NW NE SW SE Mean NW NE SW SE Mean
34/17 CS 48/89(52) 50/93(54) 65/120(40) 69/128(44) 57.0/105.6 15/28 20/37 67/124 74/137 27.7/51.3
SCS 69/128(52) 71/131(52) 62/115(52) 54/100(52) 64.0/118.5 21/39 19/35 30/56 15/28 15.3/28.3
VSCS 112/207(39) 110/204(39) 93/172(39) 94/174(39) 102.3/189.5 41/76 42/78 31/57 48/89 32.5/60
SuCS 132/245(16) 147/272(16) 115/213(16) 131/243(16) 131.2/243 20/37 29/54 17/31 30/56 18.7/34.6
50/26 SCS 32/59(35) 31/57(39) 31/57(28) 28/52(32) 30.3/56 10/19 8/15 7/13 9/17 7.6/14.1
VSCS 42/78(39) 45/83(39) 40/74(39) 42/78(39) 42.3/78 13/24 19/35 14/26 19/35 15.3/28.3
SuCS 81/150(16) 84/156(16) 73/135(16) 77/143(16) 78.5/145 13/24 12/22 10/19 11/20 8.6/15.9
64/33 VSCS 26/48(37) 26/48(38) 27/50(27) 28/52(33) 26.1/48 9/17 10/19 11/20 13/24 9.7/18.0
SuCS 50/93(16) 54/100(16) 47/87(16) 52/96(16) 50.4/93 6/11 6/11 6/11 6/11 6.0/11.0
CS: cyclonic storm, SCS: severe CS, VSCS: very severe CS, SuCS: super CS.NW: northwest, NE: northeast, SW: southwest, SE: southeast.Figures given within parentheses indicate the number of observations.
4.4.2 Size of TC
As the CS intensifies into SCS, its size increases.The increase in size is significant in NW and NEquadrants at 1% level. The size of the storm contin-ues to increase further, as it intensifies into VSCS,the increase is significant for all quadrants at 1%level (table 4). The significant increase in size ofthe TC with increase in intensity may be due to thefact that the BOB is a small basin and by the timethe TC intensifies into SCS or above intensity, itinteracts with the land surface, especially its outercore wind. Hence this finding endorses the earlierfindings of Dean et al. (2009). To conclude, the sizeof both inner and outer core winds of the TC overthe BOB during post-monsoon season increasessignificantly with increase in intensification of TCs.According to Maclay et al. (2008), there are two
primary types of growth processes: (i) secondaryeyewall formation and eyewall replacement cycles;an internally dominated process, and (ii) exter-nal forcing from the synoptic environment. One ofthe most significant environmental forcings iden-tified is the amount of vertical shear. Under lightshear conditions, TCs appear to intensify but donot grow; under moderate shear, they intensify lessbut grow more; under very high shear, they do notintensify or grow. To examine the above in NIO sce-nario, a case study of VSCS, Phailin (8–14 October2013) is presented here. The vertical wind shearduring 9–13 October 2013 (figure 13) correspond-ing to the surface wind distribution (figure 11) areanalyzed. It may be mentioned that, the VSCS,Phailin had rapid intensification from 0000 UTCof 10th to 0000 UTC of 11th October and thenthe intensity remained almost same till landfallthough the size increased. It is found that the wind
shear was low during 0000 UTC of 10th to 0000UTC of 11th October and became moderate sub-sequently. The size of 34(17) knot (ms−1) windradius increased from about 71(131) to 130(241)nm (km) from 0000 UTC of 10th to 0000 UTC of11th October. Of course, there was another signifi-cant increase in size of the VSCS, Phailin from 0000UTC of 12th to 0000 UTC of 13th October (dur-ing and after landfall) as the mean radius increasedfrom 130(241) to 156(289) nm (km) with muchhigher asymmetry in quadrant wind distribution(figure 11), mainly due to interaction with land sur-face, as Phailin crossed coast around 1700 UTC of12th October 2013. There was eye wall replacementcycle also in case of Phailin, which commenced on11th and ended on 12th October 2013. Hence thiscase study endorses the findings of Maclay et al.(2008) and Ueno (2008) on role of wind shear andfindings of Dean et al. (2009) on the role of landinteraction.To find out the relation between the wind radii
in different geographical quadrants and the ver-tical wind shear, the vertical wind shear at fourrepresentative points (2◦ latitude/longitude awayfrom the centre of TC in association with TCPhailin) are analyzed (table 8). It is found that thequadrant with maximum R34 coincides with mini-mum vertical wind shear, when the TC is over thesea and not interacting with land surface. How-ever, when the TC lay over the land surface as on13th October 2013 and is under relatively strongshear condition, the R34 was also higher in thequadrant associated with higher wind shear. TheR34 was also higher in NE quadrant (right for-ward sector in relation to direction of motion ofTC) in addition to the SE quadrant, which is asso-ciated with lowest wind shear. According to Ueno

1592 M Mohapatra and Monica Sharma
Figure 11. Surface wind distribution at (a) 1200 UTC of 9 October and (b–f) 0000 UTC of 10–14 October in associationwith very severe cyclonic storm, Phailin over the Bay of Bengal (8–14 October 2013).

Surface wind structure of tropical cyclones over the north Indian Ocean 1593
(a) (b)
(c) (d)
(e) (f)
Figure 12. Relative humidity at 500 hPa level at (a) 1200 UTC of 9 October and (b–f) 0000 UTC of 10–14 October 2013in association with the very severe cyclonic storm, Phailin over the Bay of Bengal (8–14 October 2013). +: Centre of TCas per IMD best track.

1594 M Mohapatra and Monica Sharma
(a) (b)
(c) (d)
(e) (f)
Figure 13. Vertical wind shear in a deep layer (200–850 hPa level) at (a–f) 0000 UTC of 8–13 October 2013 in associationwith the very severe cyclonic storm, Phailin (8–14 October 2013) over the Bay of Bengal.
(2008), when the shear amplitude is smaller thanthe TC motion vector, storm asymmetries tendedto be on the right with respect to motion. How-ever, under relatively strong shear conditions, thatare in the same direction as motion, maximumwinds could be shifted to the left with respect tomotion.
4.5 Comparison of wind radii and size of TCsover AS and BOB during pre- and
post-monsoon seasons
Comparing the wind radii of 34(17) knot (ms−1)wind in pre- and post-monsoon season TCsover the AS (figures 2 and 6), the size of the

Surface wind structure of tropical cyclones over the north Indian Ocean 1595
Table 8. Vertical wind shear (VWS) of horizontal wind at four representative points (two degree latitude/longitude awayfrom the centre) in four geographical quadrants of TC, Phailin.
Direction of VWS
Date/time (UTC) Magnitude of VWS knot (ms−1) according to 16 points of compass
Quadrants NE SE SW NW NE SE SW NW
08.10.13/0000 7 (3.6) 25 (12.9) 40 (20.6) 20 (10.3) NNE NE E ENE
09.10.13/0000 15 (7.7) 25 (12.9) 30 (15.4) 10 (5.1) NW NNE E N
10.10.13/0000 7 (3.6) 7 (3.6) 25 (12.9) 5 (2.6) W NE ENE W
11.10.13/0000 18 (9.3) 7 (3.6) 25 (12.9) 3 (1.6) SW SSW ENE SW
12.10.13/0000 15 (7.7) 10 (5.1) 35 (18) 7 (3.6) SSW SSW ENE SSW
13.10.13/0000 30 (15.5) 5 (2.6) 10 (5.1) 30 (15.5) SSW SSE SE SSW
Table 9(a). Level of significance (%) in difference of mean wind radii of tropical cyclones over the Bay of Bengal andArabian Sea.
Level of significance (%) in difference of mean wind radii of TCs over BoB and AS
Wind threshold AS pre-monsoon– BOB pre-monsoon– AS pre-monsoon– AS post-monsoon–
(knot/ms−1) Category AS post-monsoon BOB post-monsoon BOB pre-monsoon BOB post-monsoon
34/17 CS 10% 5% 1% –
SCS – – – –
VSCS – – – –
SuCS – – – –
50/26 SCS – – 5% –
VSCS – – – –
SuCS – – – –
64/33 VSCS – – 5% –
SuCS – – – –
CS: cyclonic storm, SCS: severe CS, VSCS: very severe CS, SuCS: super CS.AS: Arabian Sea, BOB: Bay of Bengal.–: not significant at 5% level.
Table 9(b). Level of significance (%) in difference of mean wind radii in four geographical quadrants of tropical cyclonesover the Bay of Bengal and Arabian Sea.
Level of significance (%) in difference of mean wind radii of TCs over BoB and AS in
four geographical quadrants
Wind threshold AS pre-monsoon–post-monsoon BOB pre-monsoon–post-monsoon
(knot/ms−1) Category NW NE SW SE NW NE SW SE
34/17 CS – – 5% 5% – 1% – –
SCS – – – – 1% – – 1%
VSCS – – – – 1% – 5% 5%
50/26 SCS 5% – 5% – – – – –
VSCS – – – – – – 5% 5%
64/33 VSCS – – – – – – – –
CS: cyclonic storm, SCS: severe CS, VSCS: very severe CS.AS: Arabian Sea, BOB: Bay of Bengal.–: not significant at 5% level.
CS is larger in post-monsoon at 10% level of signifi-cance (table 9a) and no difference in case of SCSor above intensity storms. The size of post-monsoonCS is almost double the size of pre-monsoon CSover AS. Comparing the wind radii in diffe-rent quadrants of the TC over the AS during
pre- and post-monsoon seasons (table 9b), the34(17) knot (ms−1) wind radii are higher in post-monsoon than in pre-monsoon season over SWand SE quadrants only in case of CS. It indi-cates dominant role played by the cross equato-rial flow in enhancing the wind in SW and SE

1596 M Mohapatra and Monica Sharma
quadrants and minimum role of northeast monsooncirculation in the surface wind distribution forthe post-monsoon TCs over the AS. When CSintensifies into SCS, there is no significant differ-ence in 34(17) knot (ms−1) wind radii in differ-ent quadrants during pre- and post-monsoon sea-sons. However, 50(26) knot (ms−1) wind radii inNW and SW quadrants are significantly higher inpost-monsoon than in pre-monsoon season. Thuswith the intensification of TC over the AS, thenortheast monsoon circulation as well as crossequatorial flow influence the size of core wind ofthe TC in NW and SW quadrants. Lee et al.(2010) examined some of the factors that controlthe initial size of TCs in the western-north Pacificusing QuikSCAT data. Findings suggest that itis the low-level environment that determines thedifference between large and small size storms dur-ing the early intensification period. Hence, simi-lar to western-north Pacific, low level environmentlike enhanced cross equatorial flow leads to largersize of the TC and both cross equatorial flow andnortheast monsoon circulation increase the coresize of the TC over the AS in post-monsoon than inpre-monsoon season. Considering the SD (tables 2and 5), there is large variation in the size of the CSover AS during post-monsoon than in pre-monsoonseason. The SD is similar in case of SCS in boththe seasons.In comparison to the size of CSs over BOB dur-
ing pre-monsoon season, the CSs in post-monsoonseasons are smaller (tables 6, 7 and 9a). The differ-ence in mean wind radii is significant at 5% level.Considering the wind radii in different quadrants,the 34(17) knot (ms−1) wind radii in SE quadrantof SCS and SW and SE quadrants of VSCS arehigher and in NW quadrant of SCS and VSCS areless in pre-monsoon than in post-monsoon season.It may be due to enhanced cross equatorial flowover BOB during pre-monsoon season, especially inthe month of June in association with the onset ofsummer monsoon over the region leading to higherwind in SE and SW quadrants. On the other hand,the winds are stronger in post-monsoon season overthe NW quadrant in association with the northeastmonsoon circulation prevalent over the BOB dur-ing this season. The size of the core wind (50(26)knot (ms−1) wind radii) is higher in SW and SEquadrants of VSCS only during pre-monsoon thanin post-monsoon season. There is no difference in64(33) knot (ms−1) wind radii in different quad-rants during pre- and post-monsoon seasons. Thus,the northeast monsoon circulation has the influ-ence only on outer core wind distribution ofSCS and VSCS in NW quadrant, whereas thecross equatorial flow in association with summermonsoon influence both outer core (34(17) knot(ms−1)) and inner core (50(26) knot (ms−1)) wind
distribution in SW and SE quadrants of VSCS overBOB during pre-monsoon season.Comparing TCs over BOB and AS during pre-
monsoon season, the size is significantly larger overBOB and the asymmetry is also higher over theBOB than over the AS (tables 3, 4, 7). Of course,the SD is higher over the BOB than over theAS indicating larger case-to-case variation over theBOB. The significant increase in size of the TCmay be due to the fact that the BOB is a smallerbasin surrounded by the landmass. There is landinteraction in the later part of the TC leading toincrease in size of the TC. Comparing with theTCs over the AS in pre-monsoon season, the radialextents of 50(26) and 64(33) knot (ms−1) winds aresignificantly less over BOB than over AS in caseof SCS and VSCS respectively (tables 5 and 9a).Hence, though overall size (radius of 34(17) knot(ms−1) wind) of the TC is larger over BOB, theinner core is smaller as compared to that of the TCsover AS. In case of 64(33) knot (ms−1) wind, theradius in case of TC over the BOB is almost halfof that over the AS. It may be due to the fact that,the causative factor for the TCs, viz., the monsoonsurge is more vigorous during onset phase of mon-soon over the AS. The SDs are less and almost sim-ilar as that of TCs over the AS during pre-monsoonseason. There is no significant difference in size ofTCs during post-monsoon season over BOB andAS (table 9a).
5. Conclusions
The average size of TC (radius of 34(17) knot(ms−1) wind) over the AS is about 43(80), 72(133),120(222) nm (km) respectively in case of CS, SCS,VSCS during pre-monsoon season and 70(130) nm(km) in case of both CS and SCS during post-monsoon season. Similarly the average size of TCover BoB is about 73(135), 64(118) and 107(198)nm (km) in case of CS, SCS and VSCS respectivelyduring pre-monsoon and 57(105), 64(118) and102(189) nm (km) during post-monsoon season.The size of the SuCS, which occurred duringpre-monsoon season over the AS and post-monsoonseason over the BOB is about 120(222) and130(241) nm (km) respectively.The size of outer core (34(17) knot (ms−1)
wind radial extension) as well as inner corewinds (50(26) and 64(33) knot (ms−1) wind radialextension) increases significantly with increasein intensification of TC over BOB during bothpre- and post-monsoon seasons. Over the AS,the size of outer core of the TC increases withincrease in intensity during pre-monsoon seasonand no significant change during post-monsoonseason.

Surface wind structure of tropical cyclones over the north Indian Ocean 1597
The average sizes of outer core wind of theTCs over the BOB and AS as well as during pre-and post-monsoon seasons differ from each otheronly in case of CS stage. The average size of CS ishigher in pre-monsoon than in post-monsoon sea-son over the AS and opposite is the case over theBOB. The average size of the CS over BOB ishigher than that over the AS during pre-monsoonseason and there is no significant difference duringpost-monsoon season. Though overall size (radiusof 34(17) knot (ms−1) wind) of the TC during pre-monsoon season is larger over BOB, as comparedto that over the AS, the inner core is smaller. Incase of 64(33) knot (ms−1) wind, the radius in caseof TC over the BOB is almost half of that overthe AS.The outer core of winds in TCs over the BOB
is asymmetric in both pre- and post-monsoon sea-sons and for all categories of intensity of TCs.The region of higher radial extent shifts fromsouthern sector in CS stage to northern sectorin SCS/VSCS stage of TCs over the BOB dur-ing post-monsoon season. On the other hand, theasymmetry in inner core winds is significantlyless during both the seasons and all categories ofintensity. There is also no asymmetry in radialwind extension over the AS during both the sea-sons, except in case of outer core wind radialextension of VSCS during pre-monsoon season.The low level environment like enhanced cross
equatorial flow, lower and middle level RH, verti-cal wind shear and proximity of TC to the landsurface are the determining factors for the size andasymmetry of TCs over the NIO.The cross equatorial flow enhances the outer core
wind (34(17) knot (ms−1) wind radii) in SW andSE quadrants of CS only and there is minimumrole of northeast monsoon circulation in the surfacewind distribution for the post-monsoon TCs overthe AS. However, with the intensification of TCover the AS, the northeast monsoon circulation aswell as cross equatorial flow positively influence thesize of core wind (50(26) knot (ms−1) wind radii)of the TC over the AS in NW and SW quadrants.The northeast monsoon circulation enhances
only the outer core wind radii (34(17) knot (ms−1)wind radii) of SCS and VSCS in NW quadrant,whereas the cross equatorial flow in associationwith summer monsoon enhances both outer core(34(17) knot (ms−1)) and inner core (50(26) knot(ms−1)) wind radii in SW and SE quadrants of TCover BOB during pre-monsoon season.The asymmetry is generally higher in the sector
associated with higher RH in lower and/or middlelevels. However, there is variation in relationshipbetween the asymmetry in surface wind and thevertical distribution of RH in different quadrantswithin the lifecycle of a TC as well as from one
TC to the other. Out of 12 cases considered foranalyzing the relation between wind radii and RH,10 cases show definite relationship as mentionedabove and other two cases (growing phase of TC,Phailin) do not show any relationship.The quadrant with maximum outer core (34(17)
knot (ms−1) wind radii coincides with the quad-rant with minimum vertical wind shear, when theTC is over the sea and not interacting with landsurface. However, when the TC is over land sur-face and is under relatively strong shear condi-tion, outer core wind radii are also higher in thequadrant associated with higher wind shear.
Acknowledgements
We acknowledge CIRA, USA for providing thesatellite-based wind field around the TC andNCEP/NCAR for reanalysis products online whichhave been used in the study. We also thank Direc-tor General of Meteorology, IMD, for providingus an opportunity to carry out this work. Weare thankful to the reviewers for their valuablesuggestions that improved the manuscript.
References
Bessho K, DeMaria M and Knaff J A 2006 Tropical cyclonewind retrievals from the Advanced Microwave SounderUnit (AMSU): Application to surface wind analysis;J. Appl. Meteorol. Climatol. 45 399–415.
Chourasia Manjusha, Ashrit R G and John P George 2013Impact of cyclone bogusing and regional assimilation ontropical cyclone, track and intensity predictions; Mausam64 135–148.
Colon Jose A, Raman C R V and Srinivasan V 1970 Trop-ical cyclone of May 1963 over Arabian Sea; Indian J.Meteorol. Geophys. 21 1–22.
Dean L, Emanuel K A and Chavas D R 2009 On the sizedistribution of Atlantic tropical cyclones; Geophys. Res.Lett. 36 L14803, doi: 10.1029/2009GL039051.
Demuth J L, DeMaria M, Knaff J A and Vonder Haar TH 2004 Evaluation of advanced microwave sounding unittropical-cyclone intensity and size estimation algorithms;J. Appl. Meteorol. 43 282–296.
Demuth J L, DeMaria M and Knaff J A 2006 Improvement ofadvanced microwave sounding unit tropical cyclone inten-sity and size estimation algorithms; J. Appl. Meteorol.Climatol. 45 1573–1581.
Dube S K, Jisme Poulose and Rao A D 2013 Numericalsimulation of storm surge associated with severe cyclonicstorm in the Bay of Bengal during 2008–2011; Mausam64 193–202.
Frank William M 1977 The structure and energetics of thetropical cyclone II. Dynamics and energetics; Mon. Wea.Rev. 105 1136–1150.
Fujibe F and Kitabatake N 2007 Classification of surfacewind fields of tropical cyclones at landfall on the Japanmain islands; J. Meteor. Soc. Japan 85 747–765.
Goldberg M D 1999 Generation of retrieval productsfrom AMSU-A: Methodology and validation; 10th Inter-national TOVS Study Conference, Boulder, Colorado,27 January–2 February.

1598 M Mohapatra and Monica Sharma
Hill K A and Lackmann G M 2009 Influence of enviromentalhumidity on tropical cyclone size; Mon. Wea. Rev. 103294–3315.
IMD 2008 Tracks of cyclones and depressions (1891–2007),electronic version 1.0/2008; IMD, Chennai, India.
IMD 2013 Cyclone warning in India: Standard operationprocedure; Published by IMD, New Delhi, India.
Jarvinen B R, Neuman C J and Davis M A S 1988 A tropicalcyclone data tape for the north Atlantic basin; NOAATech. Memo. NWS NHC-22, 21p.
Kanamitsu M, Ebisuzaki W, Woollen J, Yang S-K, HniloJ J, Fiorino M and Potter G L 2002 NCEP-DOE AMIP-II Reanalysis (R-2); Bull. Am. Meteorol. Soc. 831631–1643.
Knaff J A, DeMaria M, Molenar D A, Sampson C R andSeybold M G 2011 An automated, objective, multi-satellite platform tropical cyclone surface wind analysis;J. Appl. Meteorol. 50 2149–2166.
Knaff J A, Sampson C R, DeMaria M, Marchok T P, GrossJ M and McAdie C J 2007 Statistical tropical cyclonewind radii prediction using climatology and persistence;Wea. Forecasting 22 781–791.
Kossin J P, Knaff J A, Berger H I, Herndon D C, CramT A, Velden C S, Murnane R J and Hawkins J D 2007Estimating hurricane wind structure in the absence ofaircraft reconnaissance; Wea. Forecasting 22 89–101.
Koteswaram P and Gaspar S 1956 The surface struc-ture of tropical cyclone in the Indian Ocean; Indian J.Meteorol. Geophys. 7 339–352.
Lee C-S, Cheung K K W, Fang W-T and Elsberry R L 2010Initial maintenance of tropical cyclone size in the westernnorth Pacific; Mon. Wea. Rev. 138 3207–3223.
Maclay K S, DeMaria M and Vonder Haar T H 2008 Tropicalcyclone inner core kinetic energy evolution; Mon. Wea.Rev. 136 4882–4898.
Mohapatra M, Bandyopadhyay B K and Tyagi Ajit 2012Best track parameters of tropical cyclones over the northIndian Ocean: A review; Natural Hazards 63 1285–1317.
Mueller K J, DeMaria M, Knaff J A, Kossin J P andVonder Haar T H 2006 Objective estimation of tropicalcyclone wind structure from infrared satellite data; Wea.Forecasting 21 990–1005.
Rappaport E N and Co-authors 2009 Advances and chal-lenges at the National Hurricane Center; Wea. Forecast-ing 24 395–419.
Rao Y P 1976 “Southwest Monsoon.” Meteorol. Monogr.Synoptic Meteorol., No. 1/1976, India MeteorologicalDepartment, New Delhi, 335p.
RSMC, New Delhi 2011 Report on cyclonic disturbancesover the north Indian Ocean during 2010; IMD, NewDelhi, India.
Uhlhorn E W and Black P G 2003 Verification of remotelysensed sea surface winds in hurricanes; J. Atmos. Oceanic.Technol. 20 99–116.
Uhlhorn E W, Franklin J L, Goodberlet M, Carsell Jand Goldstein A S 2007 Hurricane surface wind mea-surement from operational stepped frequency microwaveradiometer; Mon Wea. Rev. 135 1370–1385.
Ueno M 2008 Effects of ambient vertical wind shear on theinner-core asymmetries and vertical tilt of a simulatedtropical cyclone; J. Meteor. Soc. Japan 86 531–555.
Xu Jing and Wang Y 2010 Sensitivity of tropical cycloneinner-core size and intensity to the radial distribution ofsurface entropy flux; J. Atmos. Sci. 67 1831–1852.
MS received 4 December 2014; revised 16 May 2015; accepted 31 May 2015