characteristics of speech errors produced by children … · lshss characteristics of speech errors...
TRANSCRIPT
LSHSS
Characteristics of Speech ErrorsProduced by Children With and WithoutDelayed Phonological Awareness Skills
Susan RvachewPi-Yu ChiangNatalia Evans
McGill University, Montréal, Québec
S everal studies have shown that children with speech-sound disorders are at significantly higher risk ofbeginning formal education with delayed phono-
logical awareness abilities relative to children with typicallydeveloping speech and language skills, and are thus at risk fordelayed acquisition of reading (Raitano, Pennington, Tunick,Boada, & Shriberg, 2004; Rvachew, Ohberg, Grawburg, &Heyding, 2003; Webster, Plante, & Couvillion, 1997). At thesame time, a substantial proportion of children with speech-sounddisorders enter school with age-appropriate phonological awarenessskills and subsequently learn to read without difficulty. The pro-portion of children with a preschool history of speech-sounddisorders who have demonstrated poor reading outcomes duringthe early school years varies across studies, with Bird, Bishop,and Freeman (1995) reporting 77% of children and Larrivee andCatts (1999) reporting 60% of children scoring more than 1 SDbelow the mean on standardized measures of reading ability.
Justice, Invernizzi, and Meier (2002) pointed out that it is notpractical for school speech-language pathologists (SLPs) to conductearly literacy screening with all children who have a preschoolhistory of speech and language delay, and therefore it is importantto understand which children have the highest risk of ongoingdifficulties with reading acquisition. They suggested that screeningbe directed at children who have difficulties with more than onedomain of language development; thus, children who have isolateddifficulties with phonology normally would not be candidates forfollow-up. Although it is true that children with speech-sounddisorders and concomitant language impairment are at greatestrisk of reading delay, the risk is also elevated for children whosedifficulties are restricted to inaccurate articulation of speech sounds(Bird et al., 1995; Nathan, Stackhouse, Goulandris, & Snowling,2004). For example, Nathan et al. reported that 47% of preschoolerswith isolated articulation difficulties and 63% of preschoolers withconcommittant speech and language problems scored more than
ABSTRACT: Purpose: The purpose of this study was to examine therelationship between the types of speech errors that are produced bychildrenwith speech-sound disorders and the children’s phonologicalawareness skills during their prekindergarten andkindergarten years.Method: Fifty-eight children with speech-sound disorders wereassessed during the spring of their prekindergarten year and thenagain at the end of their kindergarten year. The children’s responseson the Goldman–Fristoe Test of Articulation (R. Goldman &M. Fristoe, 2000) were described in terms of match ratios for thefeatures of each target sound and the type of error produced. Matchratios and error type frequencieswere then examined as a functionofthe child’s performance on a test of phonological awareness.Results: Lower match ratios for +distributed and higher frequenciesof typical syllable structure errors and atypical segment errors
were associatedwith poorer phonological awareness test performance.However, no aspect of the children’s error patterns proved to bea reliable indicator of which individual child would pass or failthe test. The best predictor of test performance at the end of thekindergarten year was test performance 1 year earlier. Childrenwho achieved age-appropriate articulation skills by the end ofkindergarten also achieved age-appropriate phonological aware-ness skills.Conclusion: Children who enter kindergarten with delayed articula-tion skills should be monitored to ensure age-appropriate acquisitionof phonological awareness and literacy skills.
KEY WORDS: speech-sound disorders, phonological awareness,phonological errors
LANGUAGE, SPEECH, AND HEARING SERVICES IN SCHOOLS • Vol. 38 • 60–71 • January 2007 * American Speech-Language-Hearing Association
0161-1461/06/3801-0060
60
1 SD below the mean on measures of reading and/or spelling atthe end of first grade.
Justice et al. (2002) suggested that the severity of the speech-sound disorders might differentiate those children with speech-sound disorders who are at risk for reading difficulties from thosewho are not at risk for difficulties. The published data relating tothis hypothesis are inconclusive. Bird et al. (1995) found that thepercentage of consonants correct (PCC) during the kindergartenassessment was 61 and 49 for children with good and poor readingoutcomes, respectively. However, the children in this study all hadsevere speech-sound disorders, regardless of reading outcomes(a severity ranking of severe is defined as a score more than 2 SDbelow the mean, which would be 72 PCC for children of this age).Larrivee and Catts (1999) and Rvachew and Grawburg (2006)included a larger range of severity levels and indexed severity onthe basis of children’s responses to a standardized citation-formmeasure of articulation abilities. In these studies, severity of thespeech-sound disorder was not clearly correlated with phonologicalawareness skills.
It is possible that the relationship between severity of the speech-sound disorder and the child’s risk of reading delay is unclearbecause articulation accuracy is not the most sensitive indicatorof severity. Given similar levels of articulation accuracy, measuredas the frequency of consonant errors, two children might varysubstantially in severity depending on the nature of the errorsproduced. A child whose errors are primarily of the distortion typemight be considered to be less severely impaired than a child whoseerrors consist of substitutions of one phoneme for another. Achild whose errors are restricted to segment substitutions mightbe considered to be less severely impaired than a child who producesomissions that alter the syllable structure of the word. A child whoseerror patterns are typical among younger normally developingchildren might be considered to be less severely impaired than achild whose error patterns are rarely produced by children withnormal or delayed speech development. At the level of distinctivefeatures, a child who demonstrates some knowledge of all distinctivefeatures in the native language might be considered to be lessseverely impaired than a child who lacks major sound class dis-tinctions in his or her phonological system.
In summary, it is clear that concomitant language impairmentenhances the risk of phonological awareness difficulties amongchildren with a speech-sound disorder. This question will not befurther explored in this article. The risk of phonological awarenessdifficulties among children with speech-sound disorders but rela-tively good language skills remains unclear, as does the relationshipbetween severity of speech-sound disorder and phonologicalawareness skills. This study addresses the hypothesis that greaterseverity of speech-sound disorders will predict phonologicalawareness difficulties by examining both the nature and the numberof the errors that are produced on a standardized measure ofarticulation abilities.
The purpose of this study was to examine the relationshipbetween the nature of a child’s speech-sound errors and the child’sperformance on a phonological awareness test before entry intokindergarten and at the end of the kindergarten year. Both concurrentand longitudinal predictive relationships between patterns of speecherrors and phonological awareness skills were examined. The chil-dren’s phonological systems were described using two differentanalyses, both derived from a picture naming sample. In the firstanalysis, match ratios for the child’s use of target consonant features
were calculated. In the second analysis, each consonant error wascoded as belonging to one of five possible types: typical segmenterror, atypical segment error, typical syllable structure error,atypical syllable structure error, or distortion error. The study isdescriptive in nature, and no specific a priori hypotheses wereposited about the specific characteristics of the error type profile thatmight be associated with phonological awareness difficulties.
METHOD
Participants
SLPs at two pediatric hospitals were asked to refer 4- and5-year-old children who were receiving or waiting to receive speechtherapy for remediation of a speech-sound disorder during theirprekindergarten year for participation in a longitudinal study of earlyliteracy development in children with speech-sound disorders.The selection criteria were as follows: primary diagnosis of speechdelay of unknown origin (although concomitant language impair-ment and suspected dyspraxia of speech were not exclusionarycriteria); normal hearing and oral-motor function documented bythe child’s clinician before referral to the study; and native speakerof English. Children whose speech-sound disorder was secondaryto other conditions such as sensory-neural hearing loss, Downsyndrome, cerebral palsy, or cleft palate were excluded.
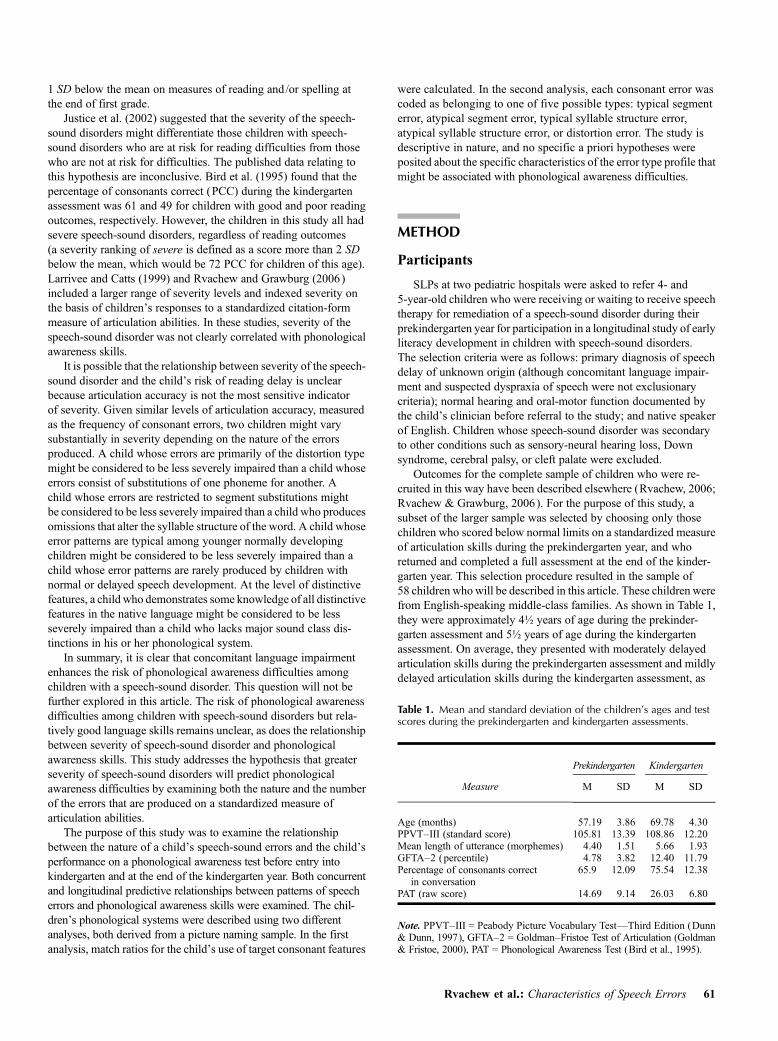
Outcomes for the complete sample of children who were re-cruited in this way have been described elsewhere (Rvachew, 2006;Rvachew & Grawburg, 2006). For the purpose of this study, asubset of the larger sample was selected by choosing only thosechildren who scored below normal limits on a standardized measureof articulation skills during the prekindergarten year, and whoreturned and completed a full assessment at the end of the kinder-garten year. This selection procedure resulted in the sample of58 children whowill be described in this article. These children werefrom English-speaking middle-class families. As shown in Table 1,they were approximately 42 years of age during the prekinder-garten assessment and 52 years of age during the kindergartenassessment. On average, they presented with moderately delayedarticulation skills during the prekindergarten assessment and mildlydelayed articulation skills during the kindergarten assessment, as
Table 1. Mean and standard deviation of the children’s ages and testscores during the prekindergarten and kindergarten assessments.
Measure
Prekindergarten Kindergarten
M SD M SD
Age (months) 57.19 3.86 69.78 4.30PPVT–III (standard score) 105.81 13.39 108.86 12.20Mean length of utterance (morphemes) 4.40 1.51 5.66 1.93GFTA–2 (percentile) 4.78 3.82 12.40 11.79Percentage of consonants correct
in conversation65.9 12.09 75.54 12.38
PAT (raw score) 14.69 9.14 26.03 6.80
Note. PPVT–III = Peabody Picture Vocabulary Test—Third Edition (Dunn& Dunn, 1997), GFTA–2 = Goldman–Fristoe Test of Articulation (Goldman& Fristoe, 2000), PAT = Phonological Awareness Test (Bird et al., 1995).
Rvachew et al.: Characteristics of Speech Errors 61
measured by the Goldman–Fristoe Test of Articulation—SecondEdition (GFTA–2; Goldman & Fristoe, 2000). All children scoredbelow normal limits on the GFTA–2 during the prekindergartenassessment, but 26% achieved age-appropriate articulation skills bythe end of the kindergarten year. PCC, derived from conversationsamples, confirms a moderately severe speech-sound disorder onaverage during the prekindergarten assessment, with the mean PCCbeing 65.94, which corresponds to a standard score of z = j1.85(see Austin & Shriberg, 1997, for normative reference data). PCCduring this assessment ranged from 40.55 (severe SSD, z = j5.15)to 91.64 (above average speech, z = 1.49). However, GFTA–2percentiles appeared to provide a more accurate indicator of speech-sound disorders. For example, the child who obtained a PCC of91.64 had not mastered the features +continuant or the place nodedorsal, which indicates a significant problem because stoppingof fricatives and fronting of velars would not be expected in a childwho was approaching 5 years of age.
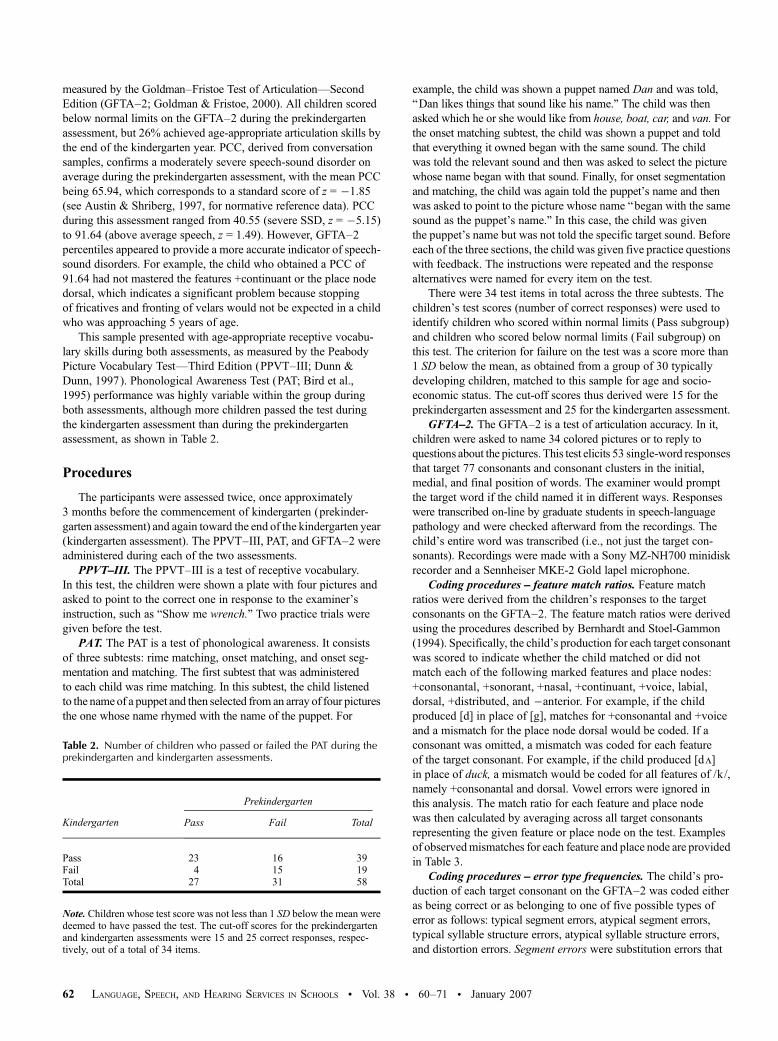
This sample presented with age-appropriate receptive vocabu-lary skills during both assessments, as measured by the PeabodyPicture Vocabulary Test—Third Edition (PPVT–III; Dunn &Dunn, 1997). Phonological Awareness Test (PAT; Bird et al.,1995) performance was highly variable within the group duringboth assessments, although more children passed the test duringthe kindergarten assessment than during the prekindergartenassessment, as shown in Table 2.
Procedures
The participants were assessed twice, once approximately3 months before the commencement of kindergarten (prekinder-garten assessment) and again toward the end of the kindergarten year(kindergarten assessment). The PPVT–III, PAT, and GFTA–2 wereadministered during each of the two assessments.
PPVT–III. The PPVT–III is a test of receptive vocabulary.In this test, the children were shown a plate with four pictures andasked to point to the correct one in response to the examiner’sinstruction, such as “Show me wrench.” Two practice trials weregiven before the test.
PAT. The PAT is a test of phonological awareness. It consistsof three subtests: rime matching, onset matching, and onset seg-mentation and matching. The first subtest that was administeredto each child was rime matching. In this subtest, the child listenedto the nameof a puppet and then selected from an array of four picturesthe one whose name rhymed with the name of the puppet. For
example, the child was shown a puppet named Dan and was told,“Dan likes things that sound like his name.” The child was thenasked which he or she would like from house, boat, car, and van. Forthe onset matching subtest, the child was shown a puppet and toldthat everything it owned began with the same sound. The childwas told the relevant sound and then was asked to select the picturewhose name began with that sound. Finally, for onset segmentationand matching, the child was again told the puppet’s name and thenwas asked to point to the picture whose name “began with the samesound as the puppet’s name.” In this case, the child was giventhe puppet’s name but was not told the specific target sound. Beforeeach of the three sections, the child was given five practice questionswith feedback. The instructions were repeated and the responsealternatives were named for every item on the test.
There were 34 test items in total across the three subtests. Thechildren’s test scores (number of correct responses) were used toidentify children who scored within normal limits (Pass subgroup)and children who scored below normal limits (Fail subgroup) onthis test. The criterion for failure on the test was a score more than1 SD below the mean, as obtained from a group of 30 typicallydeveloping children, matched to this sample for age and socio-economic status. The cut-off scores thus derived were 15 for theprekindergarten assessment and 25 for the kindergarten assessment.
GFTA–2. The GFTA–2 is a test of articulation accuracy. In it,children were asked to name 34 colored pictures or to reply toquestions about the pictures. This test elicits 53 single-word responsesthat target 77 consonants and consonant clusters in the initial,medial, and final position of words. The examiner would promptthe target word if the child named it in different ways. Responseswere transcribed on-line by graduate students in speech-languagepathology and were checked afterward from the recordings. Thechild’s entire word was transcribed (i.e., not just the target con-sonants). Recordings were made with a Sony MZ-NH700 minidiskrecorder and a Sennheiser MKE-2 Gold lapel microphone.
Coding procedures – feature match ratios. Feature matchratios were derived from the children’s responses to the targetconsonants on the GFTA–2. The feature match ratios were derivedusing the procedures described by Bernhardt and Stoel-Gammon(1994). Specifically, the child’s production for each target consonantwas scored to indicate whether the child matched or did notmatch each of the following marked features and place nodes:+consonantal, +sonorant, +nasal, +continuant, +voice, labial,dorsal, +distributed, and janterior. For example, if the childproduced [d] in place of [g], matches for +consonantal and +voiceand a mismatch for the place node dorsal would be coded. If aconsonant was omitted, a mismatch was coded for each featureof the target consonant. For example, if the child produced [dÃ]in place of duck, a mismatch would be coded for all features of /k/,namely +consonantal and dorsal. Vowel errors were ignored inthis analysis. The match ratio for each feature and place nodewas then calculated by averaging across all target consonantsrepresenting the given feature or place node on the test. Examplesof observedmismatches for each feature and place node are providedin Table 3.
Coding procedures – error type frequencies. The child’s pro-duction of each target consonant on the GFTA–2 was coded eitheras being correct or as belonging to one of five possible types oferror as follows: typical segment errors, atypical segment errors,typical syllable structure errors, atypical syllable structure errors,and distortion errors. Segment errors were substitution errors that
Table 2. Number of children who passed or failed the PAT during theprekindergarten and kindergarten assessments.
Kindergarten
Prekindergarten
Pass Fail Total
Pass 23 16 39Fail 4 15 19Total 27 31 58
Note. Children whose test score was not less than 1 SD below the mean weredeemed to have passed the test. The cut-off scores for the prekindergartenand kindergarten assessments were 15 and 25 correct responses, respec-tively, out of a total of 34 items.
62 LANGUAGE, SPEECH, AND HEARING SERVICES IN SCHOOLS • Vol. 38 • 60–71 • January 2007
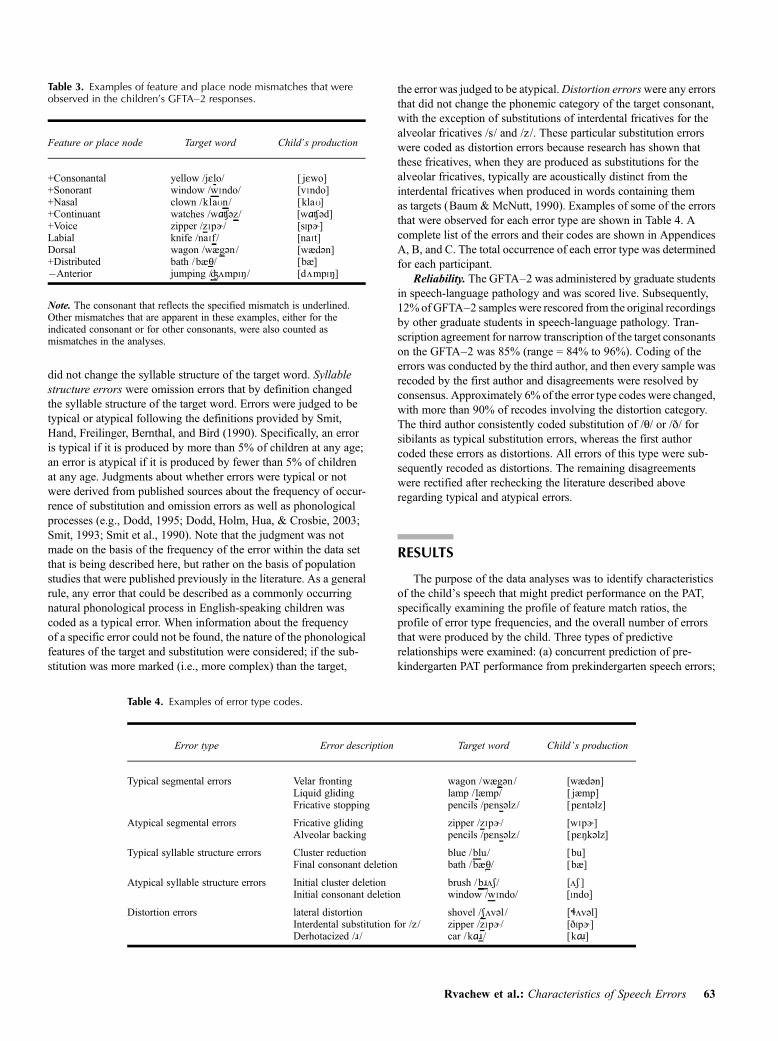
did not change the syllable structure of the target word. Syllablestructure errors were omission errors that by definition changedthe syllable structure of the target word. Errors were judged to betypical or atypical following the definitions provided by Smit,Hand, Freilinger, Bernthal, and Bird (1990). Specifically, an erroris typical if it is produced by more than 5% of children at any age;an error is atypical if it is produced by fewer than 5% of childrenat any age. Judgments about whether errors were typical or notwere derived from published sources about the frequency of occur-rence of substitution and omission errors as well as phonologicalprocesses (e.g., Dodd, 1995; Dodd, Holm, Hua, & Crosbie, 2003;Smit, 1993; Smit et al., 1990). Note that the judgment was notmade on the basis of the frequency of the error within the data setthat is being described here, but rather on the basis of populationstudies that were published previously in the literature. As a generalrule, any error that could be described as a commonly occurringnatural phonological process in English-speaking children wascoded as a typical error. When information about the frequencyof a specific error could not be found, the nature of the phonologicalfeatures of the target and substitution were considered; if the sub-stitution was more marked (i.e., more complex) than the target,
the error was judged to be atypical.Distortion errorswere any errorsthat did not change the phonemic category of the target consonant,with the exception of substitutions of interdental fricatives for thealveolar fricatives /s/ and /z/. These particular substitution errorswere coded as distortion errors because research has shown thatthese fricatives, when they are produced as substitutions for thealveolar fricatives, typically are acoustically distinct from theinterdental fricatives when produced in words containing themas targets (Baum & McNutt, 1990). Examples of some of the errorsthat were observed for each error type are shown in Table 4. Acomplete list of the errors and their codes are shown in AppendicesA, B, and C. The total occurrence of each error type was determinedfor each participant.
Reliability. The GFTA–2 was administered by graduate studentsin speech-language pathology and was scored live. Subsequently,12% of GFTA–2 samples were rescored from the original recordingsby other graduate students in speech-language pathology. Tran-scription agreement for narrow transcription of the target consonantson the GFTA–2 was 85% (range = 84% to 96%). Coding of theerrors was conducted by the third author, and then every sample wasrecoded by the first author and disagreements were resolved byconsensus. Approximately 6% of the error type codes were changed,with more than 90% of recodes involving the distortion category.The third author consistently coded substitution of /q/ or /8/ forsibilants as typical substitution errors, whereas the first authorcoded these errors as distortions. All errors of this type were sub-sequently recoded as distortions. The remaining disagreementswere rectified after rechecking the literature described aboveregarding typical and atypical errors.
RESULTS
The purpose of the data analyses was to identify characteristicsof the child’s speech that might predict performance on the PAT,specifically examining the profile of feature match ratios, theprofile of error type frequencies, and the overall number of errorsthat were produced by the child. Three types of predictiverelationships were examined: (a) concurrent prediction of pre-kindergarten PAT performance from prekindergarten speech errors;
Table 3. Examples of feature and place node mismatches that wereobserved in the children’s GFTA–2 responses.
Feature or place node Target word Child’s production
+Consonantal yellow /jelo/ [ jewo]+Sonorant window /wIndo/ [vIndo]+Nasal clown /klaOn/ [klaO]+Continuant watches /wɑa«z/ [wɑa«d]+Voice zipper /zIpY/ [sIpY]Labial knife /naIf / [naIt]Dorsal wagon /w&g«n/ [w&d«n]+Distributed bath /b&_q/ [b&]jAnterior jumping /_uÃmpI:/ [dÃmpI:]
Note. The consonant that reflects the specified mismatch is underlined.Other mismatches that are apparent in these examples, either for theindicated consonant or for other consonants, were also counted asmismatches in the analyses.
Table 4. Examples of error type codes.
Error type Error description Target word Child ’s production
Typical segmental errors Velar fronting wagon /w&g«n/ [w&d«n]Liquid gliding lamp /l&mp/ [ j&mp]Fricative stopping pencils /pens«lz / [pent«lz]
Atypical segmental errors Fricative gliding zipper /zIpY/ [wIpY]Alveolar backing pencils /pens«lz / [pe:k«lz]
Typical syllable structure errors Cluster reduction blue /blu/ [bu]Final consonant deletion bath /b&_q/ [b&]
Atypical syllable structure errors Initial cluster deletion brush /b_aÃS/ [ÃS ]Initial consonant deletion window /wIndo/ [Indo]
Distortion errors lateral distortion shovel /_SÃv«l / [ Ãv«l]Interdental substitution for /z/ zipper /zIpY/ [8IpY]Derhotacized /a / car /kɑa_a / [kɑa
°a]
Rvachew et al.: Characteristics of Speech Errors 63
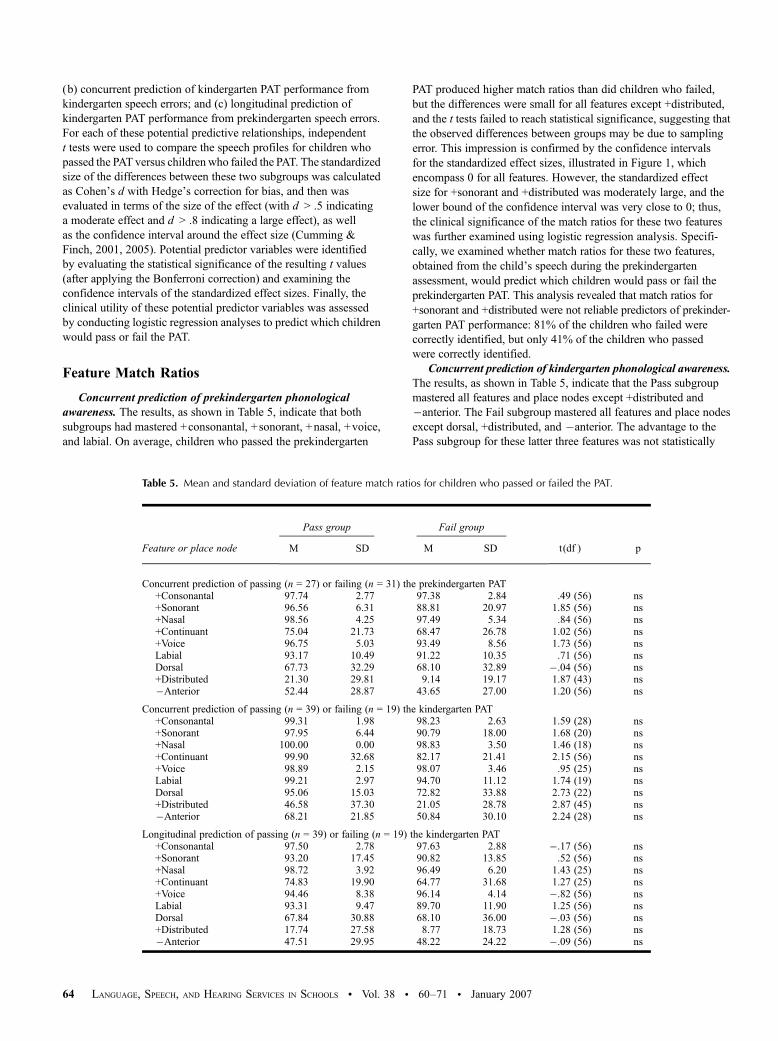
(b) concurrent prediction of kindergarten PAT performance fromkindergarten speech errors; and (c) longitudinal prediction ofkindergarten PAT performance from prekindergarten speech errors.For each of these potential predictive relationships, independentt tests were used to compare the speech profiles for children whopassed the PAT versus children who failed the PAT. The standardizedsize of the differences between these two subgroups was calculatedas Cohen’s d with Hedge’s correction for bias, and then wasevaluated in terms of the size of the effect (with d > .5 indicatinga moderate effect and d > .8 indicating a large effect), as wellas the confidence interval around the effect size (Cumming &Finch, 2001, 2005). Potential predictor variables were identifiedby evaluating the statistical significance of the resulting t values(after applying the Bonferroni correction) and examining theconfidence intervals of the standardized effect sizes. Finally, theclinical utility of these potential predictor variables was assessedby conducting logistic regression analyses to predict which childrenwould pass or fail the PAT.
Feature Match Ratios
Concurrent prediction of prekindergarten phonologicalawareness. The results, as shown in Table 5, indicate that bothsubgroups had mastered +consonantal, +sonorant, +nasal, +voice,and labial. On average, children who passed the prekindergarten
PAT produced higher match ratios than did children who failed,but the differences were small for all features except +distributed,and the t tests failed to reach statistical significance, suggesting thatthe observed differences between groups may be due to samplingerror. This impression is confirmed by the confidence intervalsfor the standardized effect sizes, illustrated in Figure 1, whichencompass 0 for all features. However, the standardized effectsize for +sonorant and +distributed was moderately large, and thelower bound of the confidence interval was very close to 0; thus,the clinical significance of the match ratios for these two featureswas further examined using logistic regression analysis. Specifi-cally, we examined whether match ratios for these two features,obtained from the child’s speech during the prekindergartenassessment, would predict which children would pass or fail theprekindergarten PAT. This analysis revealed that match ratios for+sonorant and +distributed were not reliable predictors of prekinder-garten PAT performance: 81% of the children who failed werecorrectly identified, but only 41% of the children who passedwere correctly identified.
Concurrent prediction of kindergarten phonological awareness.The results, as shown in Table 5, indicate that the Pass subgroupmastered all features and place nodes except +distributed andjanterior. The Fail subgroup mastered all features and place nodesexcept dorsal, +distributed, and janterior. The advantage to thePass subgroup for these latter three features was not statistically
Table 5. Mean and standard deviation of feature match ratios for children who passed or failed the PAT.
Feature or place node
Pass group Fail group
t(df ) pM SD M SD
Concurrent prediction of passing (n = 27) or failing (n = 31) the prekindergarten PAT+Consonantal 97.74 2.77 97.38 2.84 .49 (56) ns+Sonorant 96.56 6.31 88.81 20.97 1.85 (56) ns+Nasal 98.56 4.25 97.49 5.34 .84 (56) ns+Continuant 75.04 21.73 68.47 26.78 1.02 (56) ns+Voice 96.75 5.03 93.49 8.56 1.73 (56) nsLabial 93.17 10.49 91.22 10.35 .71 (56) nsDorsal 67.73 32.29 68.10 32.89 j.04 (56) ns+Distributed 21.30 29.81 9.14 19.17 1.87 (43) nsjAnterior 52.44 28.87 43.65 27.00 1.20 (56) ns
Concurrent prediction of passing (n = 39) or failing (n = 19) the kindergarten PAT+Consonantal 99.31 1.98 98.23 2.63 1.59 (28) ns+Sonorant 97.95 6.44 90.79 18.00 1.68 (20) ns+Nasal 100.00 0.00 98.83 3.50 1.46 (18) ns+Continuant 99.90 32.68 82.17 21.41 2.15 (56) ns+Voice 98.89 2.15 98.07 3.46 .95 (25) nsLabial 99.21 2.97 94.70 11.12 1.74 (19) nsDorsal 95.06 15.03 72.82 33.88 2.73 (22) ns+Distributed 46.58 37.30 21.05 28.78 2.87 (45) nsjAnterior 68.21 21.85 50.84 30.10 2.24 (28) ns
Longitudinal prediction of passing (n = 39) or failing (n = 19) the kindergarten PAT+Consonantal 97.50 2.78 97.63 2.88 j.17 (56) ns+Sonorant 93.20 17.45 90.82 13.85 .52 (56) ns+Nasal 98.72 3.92 96.49 6.20 1.43 (25) ns+Continuant 74.83 19.90 64.77 31.68 1.27 (25) ns+Voice 94.46 8.38 96.14 4.14 j.82 (56) nsLabial 93.31 9.47 89.70 11.90 1.25 (56) nsDorsal 67.84 30.88 68.10 36.00 j.03 (56) ns+Distributed 17.74 27.58 8.77 18.73 1.28 (56) nsjAnterior 47.51 29.95 48.22 24.22 j.09 (56) ns
64 LANGUAGE, SPEECH, AND HEARING SERVICES IN SCHOOLS • Vol. 38 • 60–71 • January 2007
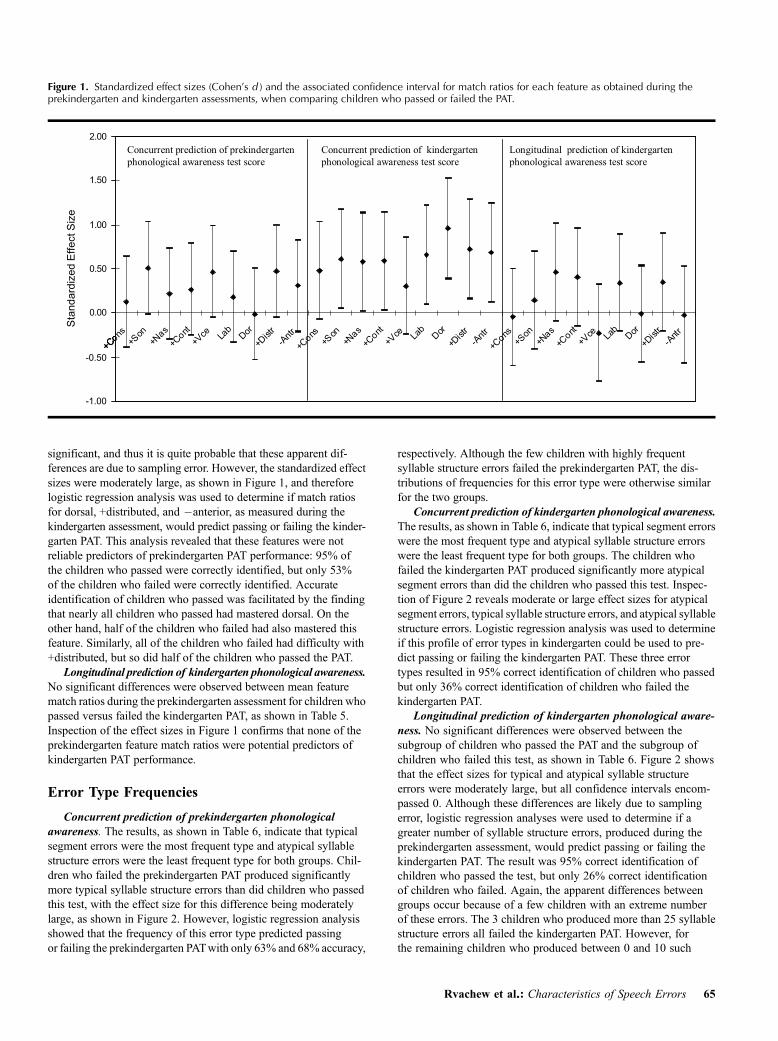
significant, and thus it is quite probable that these apparent dif-ferences are due to sampling error. However, the standardized effectsizes were moderately large, as shown in Figure 1, and thereforelogistic regression analysis was used to determine if match ratiosfor dorsal, +distributed, and janterior, as measured during thekindergarten assessment, would predict passing or failing the kinder-garten PAT. This analysis revealed that these features were notreliable predictors of prekindergarten PAT performance: 95% ofthe children who passed were correctly identified, but only 53%of the children who failed were correctly identified. Accurateidentification of children who passed was facilitated by the findingthat nearly all children who passed had mastered dorsal. On theother hand, half of the children who failed had also mastered thisfeature. Similarly, all of the children who failed had difficulty with+distributed, but so did half of the children who passed the PAT.
Longitudinal prediction of kindergarten phonological awareness.No significant differences were observed between mean featurematch ratios during the prekindergarten assessment for children whopassed versus failed the kindergarten PAT, as shown in Table 5.Inspection of the effect sizes in Figure 1 confirms that none of theprekindergarten feature match ratios were potential predictors ofkindergarten PAT performance.
Error Type Frequencies
Concurrent prediction of prekindergarten phonologicalawareness. The results, as shown in Table 6, indicate that typicalsegment errors were the most frequent type and atypical syllablestructure errors were the least frequent type for both groups. Chil-dren who failed the prekindergarten PAT produced significantlymore typical syllable structure errors than did children who passedthis test, with the effect size for this difference being moderatelylarge, as shown in Figure 2. However, logistic regression analysisshowed that the frequency of this error type predicted passingor failing the prekindergarten PATwith only 63% and 68% accuracy,
respectively. Although the few children with highly frequentsyllable structure errors failed the prekindergarten PAT, the dis-tributions of frequencies for this error type were otherwise similarfor the two groups.
Concurrent prediction of kindergarten phonological awareness.The results, as shown in Table 6, indicate that typical segment errorswere the most frequent type and atypical syllable structure errorswere the least frequent type for both groups. The children whofailed the kindergarten PAT produced significantly more atypicalsegment errors than did the children who passed this test. Inspec-tion of Figure 2 reveals moderate or large effect sizes for atypicalsegment errors, typical syllable structure errors, and atypical syllablestructure errors. Logistic regression analysis was used to determineif this profile of error types in kindergarten could be used to pre-dict passing or failing the kindergarten PAT. These three errortypes resulted in 95% correct identification of children who passedbut only 36% correct identification of children who failed thekindergarten PAT.
Longitudinal prediction of kindergarten phonological aware-ness. No significant differences were observed between thesubgroup of children who passed the PAT and the subgroup ofchildren who failed this test, as shown in Table 6. Figure 2 showsthat the effect sizes for typical and atypical syllable structureerrors were moderately large, but all confidence intervals encom-passed 0. Although these differences are likely due to samplingerror, logistic regression analyses were used to determine if agreater number of syllable structure errors, produced during theprekindergarten assessment, would predict passing or failing thekindergarten PAT. The result was 95% correct identification ofchildren who passed the test, but only 26% correct identificationof children who failed. Again, the apparent differences betweengroups occur because of a few children with an extreme numberof these errors. The 3 children who produced more than 25 syllablestructure errors all failed the kindergarten PAT. However, forthe remaining children who produced between 0 and 10 such
Figure 1. Standardized effect sizes (Cohen’s d ) and the associated confidence interval for match ratios for each feature as obtained during theprekindergarten and kindergarten assessments, when comparing children who passed or failed the PAT.
Rvachew et al.: Characteristics of Speech Errors 65

errors, there was no relationship between number of syllablestructure errors before kindergarten and PAT performance at theend of kindergarten.
Overall Articulation Accuracy
The profile of speech errors in prekindergarten did not serve topredict PAT performance at the end of kindergarten. Therefore,severity as indexed by overall performance on the GFTA–2 wasexamined as a predictor of phonological awareness. The relationship
between GFTA–2 percentile and PAT performance is illustratedin Figure 3. Severity rankings were derived from the children’sGFTA–2 percentile, as obtained during the prekindergarten assess-ment. The severity ranks shown on the figure correspond to per-centile ranks of 2 or less for the severe category, 3 through 6 for themoderate category, and 7 through 15 for the mild category. Thenumber of children in each severity rank was 20, 21, and 17 forthe severe, moderate, and mild severity ranks, respectively. MeanPAT score for each severity rank is shown as a function of assess-ment (prekindergarten or kindergarten). The standard error bars
Figure 2. Standardized effect sizes (Cohen’s d ) and the associated confidence interval for each error type frequency as obtained during theprekindergarten and kindergarten assessments, when comparing children who passed or failed the PAT.
Table 6. Mean and standard deviation of error type frequencies for children who passed or failed the PAT.
Error type
Pass group Fail group
t(df ) pM SD M SD
Concurrent prediction of passing (n = 27) or failing (n = 31) the prekindergarten PATTypical segmental 16.22 6.82 13.65 6.70 1.45 (56) nsAtypical segmental 5.33 4.30 7.48 4.92 j1.76 (56) nsTypical syllable structure 7.56 5.04 13.29 8.65 j3.02 (56) .004Atypical syllable structure 2.37 7.27 2.35 4.10 .01 (56) nsDistortion 4.70 4.91 4.48 4.64 .18 (56) ns
Concurrent prediction of passing (n = 39) or failing (n = 19) the kindergarten PATTypical segmental 10.00 5.54 12.84 7.41 j1.48 (28) nsAtypical segmental 1.69 1.85 4.63 4.17 j2.94 (22) .008Typical syllable structure 2.44 2.95 7.37 8.30 j2.5 (20) nsAtypical syllable structure 0.18 0.45 2.05 4.49 j1.8 (18) nsDistortion 3.95 4.36 3.00 4.11 .79 (56) ns
Longitudinal prediction of passing (n = 39) or failing (n = 19) the kindergarten PATTypical segmental 15.33 6.89 13.84 7.54 .78 (56) nsAtypical segmental 6.15 4.44 7.16 5.33 j.76 (56) nsTypical syllable structure 9.26 6.30 13.42 9.58 j1.98 (56) nsAtypical syllable structure 1.41 4.02 4.32 8.00 j1.49 (23) nsDistortion 4.97 5.22 3.79 3.49 .89 (56) ns
66 LANGUAGE, SPEECH, AND HEARING SERVICES IN SCHOOLS • Vol. 38 • 60–71 • January 2007
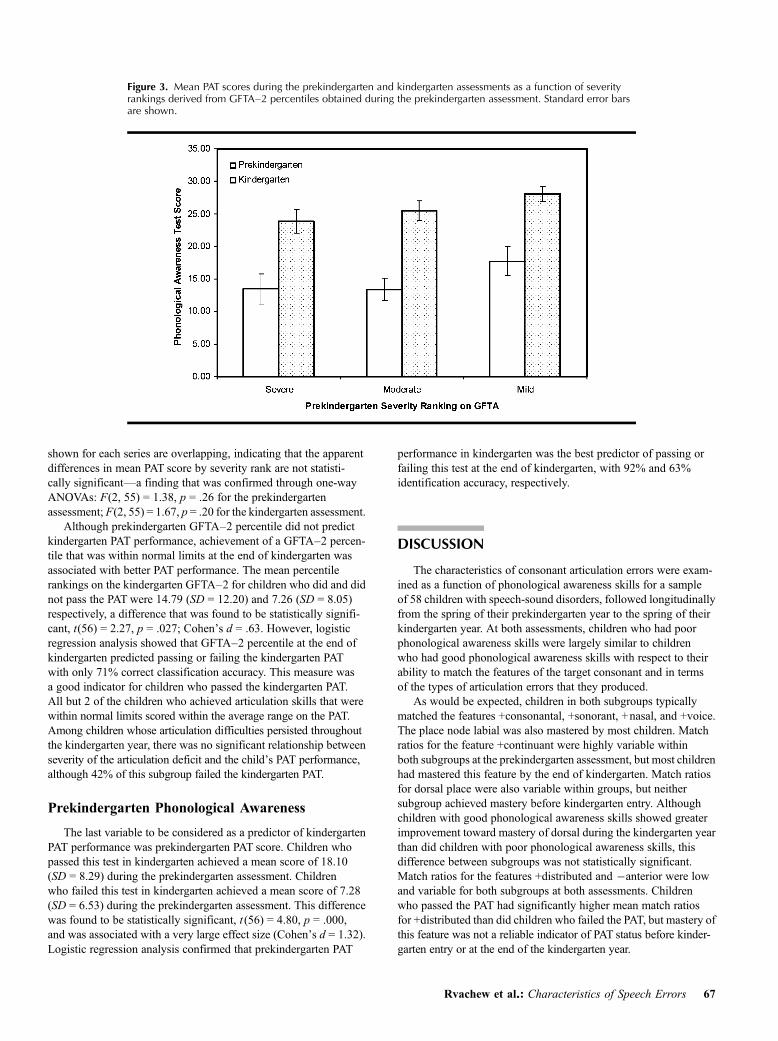
shown for each series are overlapping, indicating that the apparentdifferences in mean PAT score by severity rank are not statisti-cally significant—a finding that was confirmed through one-wayANOVAs: F(2, 55) = 1.38, p = .26 for the prekindergartenassessment; F(2, 55) = 1.67, p = .20 for the kindergarten assessment.
Although prekindergarten GFTA–2 percentile did not predictkindergarten PAT performance, achievement of a GFTA–2 percen-tile that was within normal limits at the end of kindergarten wasassociated with better PAT performance. The mean percentilerankings on the kindergarten GFTA–2 for children who did and didnot pass the PAT were 14.79 (SD = 12.20) and 7.26 (SD = 8.05)respectively, a difference that was found to be statistically signifi-cant, t(56) = 2.27, p = .027; Cohen’s d = .63. However, logisticregression analysis showed that GFTA–2 percentile at the end ofkindergarten predicted passing or failing the kindergarten PATwith only 71% correct classification accuracy. This measure wasa good indicator for children who passed the kindergarten PAT.All but 2 of the children who achieved articulation skills that werewithin normal limits scored within the average range on the PAT.Among children whose articulation difficulties persisted throughoutthe kindergarten year, there was no significant relationship betweenseverity of the articulation deficit and the child’s PAT performance,although 42% of this subgroup failed the kindergarten PAT.
Prekindergarten Phonological Awareness
The last variable to be considered as a predictor of kindergartenPAT performance was prekindergarten PAT score. Children whopassed this test in kindergarten achieved a mean score of 18.10(SD = 8.29) during the prekindergarten assessment. Childrenwho failed this test in kindergarten achieved a mean score of 7.28(SD = 6.53) during the prekindergarten assessment. This differencewas found to be statistically significant, t (56) = 4.80, p = .000,and was associated with a very large effect size (Cohen’s d = 1.32).Logistic regression analysis confirmed that prekindergarten PAT
performance in kindergarten was the best predictor of passing orfailing this test at the end of kindergarten, with 92% and 63%identification accuracy, respectively.
DISCUSSION
The characteristics of consonant articulation errors were exam-ined as a function of phonological awareness skills for a sampleof 58 children with speech-sound disorders, followed longitudinallyfrom the spring of their prekindergarten year to the spring of theirkindergarten year. At both assessments, children who had poorphonological awareness skills were largely similar to childrenwho had good phonological awareness skills with respect to theirability to match the features of the target consonant and in termsof the types of articulation errors that they produced.
As would be expected, children in both subgroups typicallymatched the features +consonantal, +sonorant, +nasal, and +voice.The place node labial was also mastered by most children. Matchratios for the feature +continuant were highly variable withinboth subgroups at the prekindergarten assessment, but most childrenhad mastered this feature by the end of kindergarten. Match ratiosfor dorsal place were also variable within groups, but neithersubgroup achieved mastery before kindergarten entry. Althoughchildren with good phonological awareness skills showed greaterimprovement toward mastery of dorsal during the kindergarten yearthan did children with poor phonological awareness skills, thisdifference between subgroups was not statistically significant.Match ratios for the features +distributed and janterior were lowand variable for both subgroups at both assessments. Childrenwho passed the PAT had significantly higher mean match ratiosfor +distributed than did children who failed the PAT, but mastery ofthis feature was not a reliable indicator of PAT status before kinder-garten entry or at the end of the kindergarten year.
Figure 3. Mean PAT scores during the prekindergarten and kindergarten assessments as a function of severityrankings derived from GFTA–2 percentiles obtained during the prekindergarten assessment. Standard error barsare shown.
Rvachew et al.: Characteristics of Speech Errors 67
Some differences in the profiles of error types were observedbetween subgroups. During both assessments and for both groups,ranking of error types frommost to least frequentwas typical segment,typical syllable structure, atypical segment, distortion, and atypicalsyllable structure. However, children who failed the PAT beforekindergarten entry produced significantly more typical syllablestructure errors than did children who passed. During the kindergartenassessment, children who failed the PAT produced significantlymore atypical segment errors than did children who passed. Childrenwho failed the kindergarten PATwere somewhat more likely toproduce typical and atypical syllable structure errors and atypicalsegment errors during the prekindergarten assessment, althoughthese between-group differences were not statistically significant.
Overall, the results of this study point to a trend toward a rela-tionship between severity of speech-sound disorders and risk ofphonological awareness problems, but this trend was not statisticallyreliable or clinically significant, as shown in Figure 3. Childrenwith mild speech-sound disorders did achieve numerically highermean scores on the PAT than did children with severe speech-sounddisorders, but there was a great deal of overlap in the range ofPAT scores observed within each severity ranking. Furthermore,41% of prekindergarten children with mild speech-sound disordersfailed the prekindergarten PAT, whereas 36% of kindergartenchildren with mild speech-sound disorders failed the kindergartenPAT. If children with mild speech-sound disorders are systematicallyexcluded from screening for potential literacy deficits, more thana third of these children will not receive the follow-up they needin order to ensure age-appropriate phonological awareness skills atthe onset of reading instruction.
Similarly, the error type analysis discussed above hints at some-what greater severity of speech-sound disorders among childrenwith poor phonological awareness in that these children tended toproduce more typical syllable structure errors and atypical segmenterrors than did children with good phonological awareness skills.Furthermore, children with good phonological awareness skillsproduced numerically higher mean match ratios for almost everyfeature coded. However, these differences were not statisticallysignificant. Logistic regression analyses revealed that the child’spattern of error types was not a reliable indicator of which childwould pass or fail the PAT at either assessment. Although someconcurrent predictive relationships between the characteristics ofthe children’s consonant articulations and PAT performance wereobserved, no longitudinal relationships were observed. In otherwords, mastery of the feature +distributed before kindergartendid not predict PAT performance 1 year later. Similarly, a highfrequency of syllable structure errors during the prekindergartenassessment was not a reliable indicator of PAT performance at theend of the kindergarten year.
The severity of the child’s speech-sound disorder during theprekindergarten assessment, as indicated by the GFTA percentile,was not a reliable longitudinal predictor of PAT status at the endof kindergarten. However, those children who achieved age-appropriate articulation skills before the end of the kindergartenyear were very likely to have achieved age-appropriate phono-logical awareness skills. Among those children whose articulationdifficulties persisted through the kindergarten year, however, severityof the speech-sound disorder was not a reliable indicator of whichchildren would present with good phonological awareness skills.
In summary, the results of this study indicate that severity of achild’s speech-sound disorder, as indexed by a variety of metrics,
is not a reliable indicator of the child’s risk of beginning formalreading instruction with below average phonological awarenessskills. This finding is consistent with previous studies, such asLarrivee and Catts (1999), who found that kindergarten articulationaccuracy on the Arizona Articulation Proficiency Scale (Fudala& Reynolds, 1988) was not significantly different for childrenwho proved to be good or poor readers at the end of first grade.However, these findings are not consistent with the conclusions ofBird et al. (1995), who reported significantly poorer kindergartenPCC scores for children who later proved to be poor readers (n = 24)in comparison with good readers (n = 7). However, their studyinvolved a sample of older children who all had very low PCCscores. Furthermore, their study was designed to predict readingin Grade 2 from speech and phonological awareness measures inkindergarten, whereas our study was designed to predict phono-logical awareness in kindergarten from articulation accuracy beforekindergarten entry.
Although we found that severity of a child’s speech deficitdid not predict phonological awareness, we did observe that childrenwho obtained articulation test scores that were within normal limitsbefore the end of kindergarten also achieved age-appropriate PATperformance during this assessment. Our finding that short-termnormalization of the child’s speech was a positive prognosticindicator is consistent with the “critical age hypothesis” (Nathanet al., 2004). Interpretation of this finding is difficult, however,because we do not have reliable information about the children’sprior history of speech therapy. It is possible that the childrenwho achieved age-appropriate speech and phonological awarenessin kindergarten received more effective or more intensive inter-vention before kindergarten entry, which in turn accounts fortheir relatively good phonological awareness skills at the end ofkindergarten. On the other hand, it is possible that children whohave good phonological awareness skills as preschoolers respondbetter to speech therapy. Both possibilities are worthy of futureexperimental investigations.
Other Potential Predictors
This study was focused specifically on the predictive relationshipbetween the nature of the children’s speech-sound errors and therisk of difficulties with phonological awareness. Overt characteristicsof the children’s speech proved to be poor predictors of passingor failing a PAT. Other studies have identified other variables that areassociated with phonological awareness skills.
Receptive vocabulary skills are a known correlate of phono-logical awareness abilities even among children with typical speech(Chaney, 1992; Cooper, Roth, Speece, & Schatschneider, 2002;Dickinson, McCabe, Anastasopoulos, Peisner-Feinberg, & Poe,2003; Metsala, 1999). This relationship has been observed amongchildren with speech-sound disorders (Rvachew&Grawburg, 2006),and it is clear that children with a combined speech and languageproblem are at significantly greater risk of literacy difficulties than arechildren with speech-sound disorders alone (Nathan et al., 2004).At the same time, it has been shown that the risk of difficulties withphonological awareness is not restricted to children with speech-sounddisorders and concomitant delays in receptive language skills (Birdet al., 1995; Rvachew et al., 2003). Although exceptionally goodreceptive vocabulary skills appear to be associated with age-appropriate phonological abilities in children with speech-sounddisorders, children with speech-sound disorders and average
68 LANGUAGE, SPEECH, AND HEARING SERVICES IN SCHOOLS • Vol. 38 • 60–71 • January 2007

receptive vocabulary skills are at substantial risk of delayed develop-ment of phonological awareness skills (Rvachew & Grawburg, 2006).In addition, Larrivee and Catts (1999) found that language skillswere only weakly related to written word recognition skills, whereaskindergarten phonological awareness skills were strongly correlatedwith reading in first grade for children with speech-sound disorders.
Another variable that may be associated with phonologicalawareness and reading skills is the quality of the children’s underlyingrepresentations (Elbro, Borstrom, & Peters, 1998). Larrivee andCatts (1999) reported that the best predictor of phonological aware-ness and reading skills in children with speech-sound disorders wasmultisyllabic nonword and real word repetition accuracy. Theysuggested that the children’s performance on these tasks reflectedthe quality of their underlying phonological representations. Thissuggestion is supported by the subsequent finding of strong con-current and longitudinal correlations between speech perceptionand phonological awareness skills in children with speech-sounddisorders (Rvachew, 2006; Rvachew & Grawburg, 2006).
Letter knowledge is another variable that is significantly correlatedwith both phonological awareness and early reading abilities inchildren with typical speech and language (Lonigan, Burgess, &Anthony, 2000; Storch & Whitehurst, 2002). This relationshipholds also for children with speech-sound disorders, but the rela-tionship is attenuated. For example, Bird et al. (1995) found thatchildren with speech-sound disorders and good letter-sound knowl-edge had better reading and spelling abilities than did childrenwith speech-sound disorders and poor letter-sound knowledge.However, children with speech-sound disorders and good letter-sound knowledge had worse reading and spelling abilities than didchildren with typical speech and good letter-sound knowledge.
In summary, phonological awareness and early reading abilitiesare correlated with vocabulary skills, strength of underlying phono-logical representations, and letter-sound knowledge in childrenwith typical speech and children with speech-sound disorders.However, even when these variables are controlled, children withspeech-sound disorders tend to have significantly poorer phonologicalawareness and decoding skills than do children with typical speech.
FUTURE RESEARCH DIRECTIONS
Although error type frequencies proved to be unreliable pre-dictors of PAT performance, the particular profile of error typesthat was weakly associated with phonological awareness deficitsin this study is of theoretical interest and may have clinical impli-cations. Ongoing research is required in order to better understandthis relationship. Replication of these results with a similar sampleof children would validate the existence of a relationship betweensyllable structure errors and phonological awareness deficits. Exten-sion of the results to different samples such as children with con-comitant speech and language delayswould also be interesting. Studiesof older children with severe speech-sound disorders would also beof interest. Although syllable structure errors during the preschoolperiod did not predict phonological awareness in kindergarten, itis possible that the persistence of these types of errors into kinder-garten and first grade could be a marker for ongoing difficultieswith literacy.
Investigation of the relationship between syllable structureerrors and known predictors of phonological awareness would also
be of interest. It is not known whether children who have difficultywith speech perception tasks or nonword repetition are likely toproduce a high proportion of syllable structure errors. Studies ofthe role of weak underlying phonological representations as apossible cause of syllable structure errors might explain why thiserror profile is associated with phonological awareness.
If the relationship between syllable structure errors and phono-logical awareness is validated in future studies, the clinical implicationsof this relationship could be illuminated by experimental investigationsthat examine intervention factors. For example, it is possible thatapproaches to speech therapy that focus on segments (i.e., the tradi-tional approach) would be less likely to promote phonological aware-ness than would approaches that target syllable structure errors earlyin the treatment program (i.e., nonlinear phonology, Bernhardt,1994; phonological process approach, Hodson & Paden, 1983).
CLINICAL IMPLICATIONS
The best longitudinal predictor of kindergarten PAT status wasPAT score before kindergarten. Of those children who passed thePAT before kindergarten entry, 85% showed good phonologicalawareness abilities at the end of kindergarten. However, half of thechildren who failed the PAT before kindergarten entry continued toshow difficulties with phonological awareness skills 1 year later.
These findings lead to two key recommendations for clinicalpractice. We caution that these recommendations may be validonly for those children who are similar to those described in thisreport, specifically, children with a preschool history of primaryspeech-sound disorder of unknown origin. These results cannot begeneralized to children whose speech-sound disorder is accompa-nied by significant delays in receptive language skills or to childrenwhose speech-sound disorder is secondary to some other devel-opmental condition. Furthermore, these recommendations may notapply to children who present with residual distortion errors atschool entry despite having no prior history of delayed speech orlanguage development.
The first recommendation is that children who are receivingspeech therapy for remediation of a primary speech-sound disorderas preschoolers should receive an assessment of their phonologicalawareness skills before school entry. The child’s teacher and theschool SLP should be alerted to the presence of delayed phonologicalawareness skillswhen a child is transferred from a preschool service toa school jurisdiction. The second recommendation is that childrenwhose speech-sound disorder persists after the onset of formalschooling should receive ongoing monitoring of their speech, lan-guage, and literacy development with appropriate follow-up.
ACKNOWLEDGMENTS
This research was supported by a research grant from the CanadianLanguage and Literacy Research Network. We are grateful to the familieswho participated in this research and to the students who were involved in thecollection and transcription of the speech samples, including GenevieveCloutier, Myra Cox, Meghann Grawburg, Joan Heyding, Debbie Hughes,Alyssa Ohberg, Alysha Serviss, and Rishanthi Sivakumaran. We also thankthe SLPs at the Alberta Children’s Hospital and the Children’s Hospitalof Eastern Ontario for their assistance with the recruitment of children.
Rvachew et al.: Characteristics of Speech Errors 69

REFERENCES
Austin, D., & Shriberg, L. D. (1997). Lifespan reference data forten measures of articulation competence using the speech disordersclassification system. Madison, WI: Waisman Center on MentalRetardation and Human Development, University of Wisconsin–Madison.
Baum, S. R., & McNutt, J. C. (1990). An acoustic analysis of frontalmisarticulation of /s/ in children. Journal of Phonetics, 18, 51–63.
Bernhardt, B. (1994). Phonological intervention techniques for syllable andword structure development. Clinics in Communication Disorders, 4, 54–65.
Bernhardt, B., & Stoel-Gammon, C. (1994). Nonlinear phonology:Introduction and clinical application. Journal of Speech and HearingResearch, 37, 123–143.
Bird, J., Bishop, D. V. M., & Freeman, N. H. (1995). Phonologicalawareness and literacy development in children with expressivephonological impairments. Journal of Speech and Hearing Research,38, 446–462.
Chaney, C. (1992). Language development, metalinguistic skills, andprint knowledge in 3-year-old children. Applied Psycholinguistics,13, 485–514.
Cooper, D. H., Roth, F. P., Speece, D. L., & Schatschneider, C. (2002).The contribution of oral language skills to the development ofphonological awareness. Applied Psycholinguistics, 23, 399–416.
Cumming, G., & Finch, S. (2001). A primer on the understanding, use,and calculation of confidence intervals that are based on central andnoncentral distributions. Educational and Psychological Measurement,61(4), 532–574.
Cumming, G., & Finch, S. (2005). Inference by eye: Confidence intervalsand how to read pictures of data. American Psychologist, 60(2), 170–180.
Dickinson, D. K., McCabe, A., Anastasopoulos, L., Peisner-Feinberg,E. S., & Poe, M. D. (2003). The comprehensive language approach toearly literacy: The interrelationships among vocabulary, phonologicalsensitivity, and print knowledge among preschool-aged children. Journalof Educational Psychology, 95(3), 465–481.
Dodd, B. (1995). Procedures for classification of subgroups of speechdisorder. In B. Dodd (Ed.), The differential diagnoses and treatment ofchildren with speech disorder (pp. 49–64). San Diego, CA: Singular.
Dodd, B., Holm, A., Hua, Z., & Crosbie, S. (2003). Phonologicaldevelopment: A normative study of British English-speaking children.Clinical Linguistics & Phonetics, 17(8), 617–643.
Dunn, L. M., & Dunn, L. M. (1997). Peabody Picture Vocabulary Test(3rd ed.). Circle Pines, MN: American Guidance Service.
Elbro, C., Borstrom, I., & Peters, D. K. (1998). Predicting dyslexia fromkindergarten: The importance of distinctness of phonological represen-tations of lexical items. Reading Research Quarterly, 33(1), 36–60.
Fudala, J. B., & Reynolds, W. M. (1988). Arizona ArticulationProficiency Scale. Los Angeles: Western Psychological Services.
Goldman, R., & Fristoe, M. (2000).Goldman–Fristoe Test of Articulation(2nd ed.). Circle Pines, MN: American Guidance Service.
Hodson, B. W., & Paden, E. P. (1983). Targeting intelligible speech:A phonological approach to remediation. Boston: College Hill.
Justice, L. M., Invernizzi, M. A., & Meier, J. D. (2002). Designing andimplementing an early literacy screening protocol: Suggestions for thespeech-language pathologist. Language, Speech, and Hearing Services inSchools, 33, 84–101.
Larrivee, L. S., & Catts, H. W. (1999). Early reading achievement inchildren with expressive phonological disorders. American Journal ofSpeech-Language Pathology, 8, 118–128.
Lonigan, C. J., Burgess, S. R., & Anthony, J. L. (2000). Developmentof emergent literacy and early reading skills in preschool children:Evidence from a latent-variable longitudinal study. DevelopmentalPsychology, 36(5), 596–613.
Metsala, J. L. (1999). Young children’s phonological awareness andnonword repetition as a function of vocabulary development.Journal of Educational Psychology, 91(1), 3–19.
Nathan, L., Stackhouse, J., Goulandris, N., & Snowling, M. J. (2004).The development of early literacy skills among children with speechdifficulties: A test of the “critical age hypothesis.” Journal of Speech,Language, and Hearing Research, 47, 377–391.
Raitano, N. A., Pennington, B. F., Tunick, B. F., Boada, R., &Shriberg, L. D. (2004). Pre-literacy skills of subgroups of children withspeech sound disorders. Journal of Child Psychology and Psychiatry,45(4), 821–835.
Rvachew, S. (2006). Longitudinal prediction of implicit phonological aware-ness skills. American Journal of Speech-Language Pathology, 15, 165–176.
Rvachew, S., & Grawburg, M. (2006). Correlates of phonologicalawareness in preschoolers with speech sound disorders. Journal ofSpeech, Language, and Hearing Research, 49, 74–87.
Rvachew, S., Ohberg, A., Grawburg, M., & Heyding, J. (2003).Phonological awareness and phonemic perception in 4-year-old childrenwith delayed expressive phonology skills. American Journal of Speech-Language Pathology, 12, 463–471.
Smit, A. B. (1993). Phonological error distributions in the Iowa-NebraskaArticulation Norms Project: Consonant singletons. Journal of Speechand Hearing Research, 36, 533–547.
Smit, A. B., Hand, L., Freilinger, J. J., Bernthal, J. E., & Bird, A.(1990). The Iowa Articulation Norms Project and its Nebraskareplication. Journal of Speech and Hearing Disorders, 55, 779–798.
Storch, S. A., &Whitehurst, G. J. (2002). Oral language and code-relatedprecursors to reading: Evidence from a longitudinal structural model.Developmental Psychology, 38(6 ), 934–947.
Webster, P. E., Plante, A. S., & Couvillion, M. (1997). Phonologicimpairment and prereading: Update on a longitudinal study. Journal ofLearning Disabilities, 30(4), 365–376.
Received August 3, 2005Revision received January 2, 2006Accepted July 5, 2006DOI: 10.1044/0161-1461(2007/006)
Contact author: Dr. Susan Rvachew, Communication Sciences andDisorders, McGill University, 1266 Pine Avenue West, Montréal, Québec,Canada, H3G 1A8. E-mail: [email protected]
70 LANGUAGE, SPEECH, AND HEARING SERVICES IN SCHOOLS • Vol. 38 • 60–71 • January 2007

APPENDIXA. LISTOFERRORSCODEDASTYPICALORATYPICAL SEGMENTERRORS
Target consonant Typical substitutions Atypical substitutions
m n : p dn m d: n d gb m w vp b t k spt d n k h s tS wd t k g f v Zk t d m p f q s S tSg t d k n : b v s sj st dZ jf p b t d g fw q sf s ts S h w jv b f t d g z S Z w j lq t d f s z p k g pf st qf tq S h w l8 t d v s z n b g S Z h w js t d z n p k g pv f ts st S h j lz d s g f v S Z dz st j lS t d s z b k g f v st ts tS dZ h j ltS t d s z ts tz dz dZ k tw f fsdZ d z Z ts ds dz dS b k g tw dj f v fs w j lw b v lj w v la j w « � t d v s z dZ ll j w b d v d h
APPENDIX B. LIST OF ERRORS CODED AS TYPICAL OR ATYPICAL SYLLABLESTRUCTURE ERRORS
Target structure Typical Atypical
Word initial singleton OmissionWord final singleton OmissionWord initial cluster Omission of 1 of 2 segments Omission of all segments
Omission of 1 of 3 segmentsOmission of 2 of 3 segmentsEpenthesis (vowel insertion between segments)
Word final cluster Omission of any or all segmentsWord initial weak syllable Omission
WeakeningWord final weak syllable OmissionWord internal weak syllable Omission
WeakeningAny strong syllable Omission
APPENDIX C. LIST OF ERRORS CODED AS DISTORTIONS
Target manner class Transcription
Stops Cw C°C
Sibilants Cw q 8 C°C CCD Cd D
Liquids wr rw r�CD Cd D
Note. C denotes a consonant (either stop, sibilant, or liquid, as indicated); D and d indicate a distortion that thetranscriber was unwilling or unable to identify more specifically.
Rvachew et al.: Characteristics of Speech Errors 71