characteristics of minimum wage workers, 2013. bureau of labor statistics marh report bls reports...
TRANSCRIPT
U.S. BUREAU OF LABOR STATISTICS
M A R C H 2 0 1 4 R E P O R T 1 0 4 8
BLS Reports │ March 2014 • www.bls.gov 1
Characteristics of Minimum Wage Workers, 2013
In 2013, 75.9 million workers age 16 and older in the United States were paid at hourly rates, representing 58.8 percent of all wage and salary workers. Among
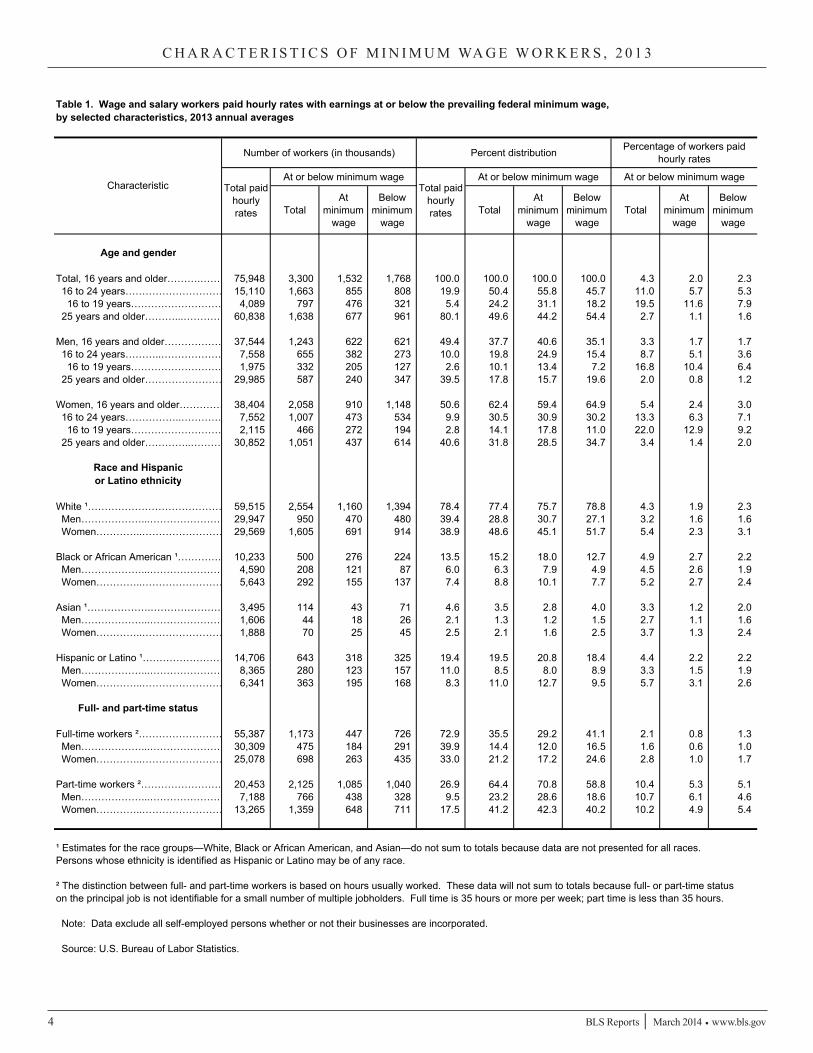
those paid by the hour, 1.5 million earned exactly the prevailing federal minimum wage of $7.25 per hour. About 1.8 million had wages below the federal minimum. Together, these 3.3 million workers with wages at or below the federal minimum made up 4.3 percent of all hourly paid workers.
The percentage of hourly paid workers earning the prevailing federal minimum wage or less declined from 4.7 percent in 2012 to 4.3 percent in 2013. This remains well
below the figure of 13.4 percent in 1979, when data were first collected on a regular basis. (See table 10.)
This report presents highlights and statistical tables of minimum wage workers in 2013. The data are obtained from the Current Population Survey (CPS), a national monthly survey of approximately 60,000 households conducted by the U.S. Census Bureau for the U.S. Bureau of Labor Statistics (BLS). Information on earnings is collected from one-fourth of the CPS sample each month.
The CPS does not include questions on whether workers are covered by the minimum wage provisions of the federal Fair Labor Standards Act (FLSA) or by individual state or local minimum wage laws. The estimates of workers paid at or below the federal minimum wage are based solely on the hourly wage they report (which does not include overtime pay, tips, or commissions). For more information on concepts and definitions of minimum wage data, see the technical notes section at the end of this report.
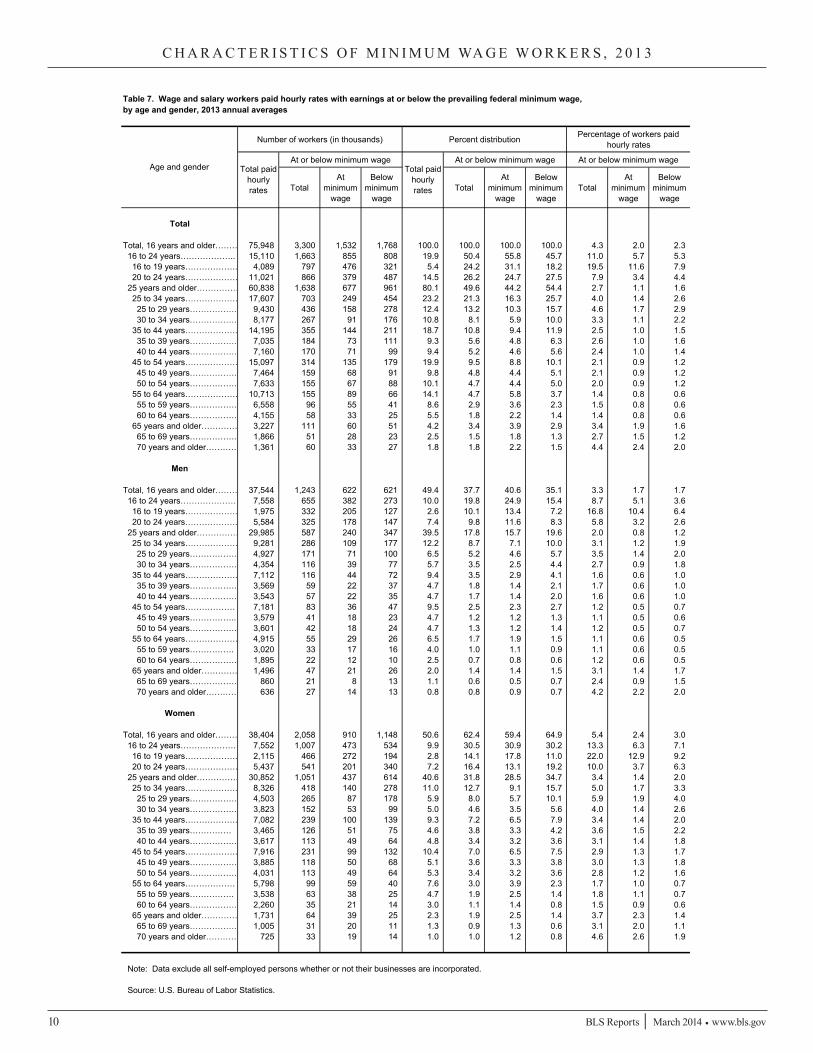
HighlightsAge. Minimum wage workers tend to be young. Although workers under age 25 represented only about one-fifth of hourly paid workers, they made up about half of those paid the federal minimum wage or less. Among employed teenagers (ages 16 to 19) paid by the hour, about 20 percent
CONTENTSHighlights . . . . . . . . . . . . . . . . . . . . . . . . . . . . . . . . . . . . . . 1
Statistical Tables . . . . . . . . . . . . . . . . . . . . . . . . . . . . . . . . . 4
Technical Notes . . . . . . . . . . . . . . . . . . . . . . . . . . . . . . . . . 16
2 BLS Reports │ March 2014 • www.bls.gov
C H A R A C T E R I S T I C S O F M I N I M U M WA G E W O R K E R S , 2 0 1 3
earned the minimum wage or less, compared with about 3 percent of workers age 25 and older. (See tables 1 and 7.)
Gender. Among workers who were paid hourly rates in 2013, about 5 percent of women had wages at or below the prevailing federal minimum, compared with about 3 percent of men. (See table 1.)
Race and Hispanic or Latino ethnicity. The percentage of hourly paid workers with wages at or below the federal minimum wage was little different among the major race and ethnicity groups. About 5 percent of Black workers, 4 percent of White workers and Hispanic or Latino workers, and 3 percent of Asian workers earned the federal minimum wage or less. (See table 1.)
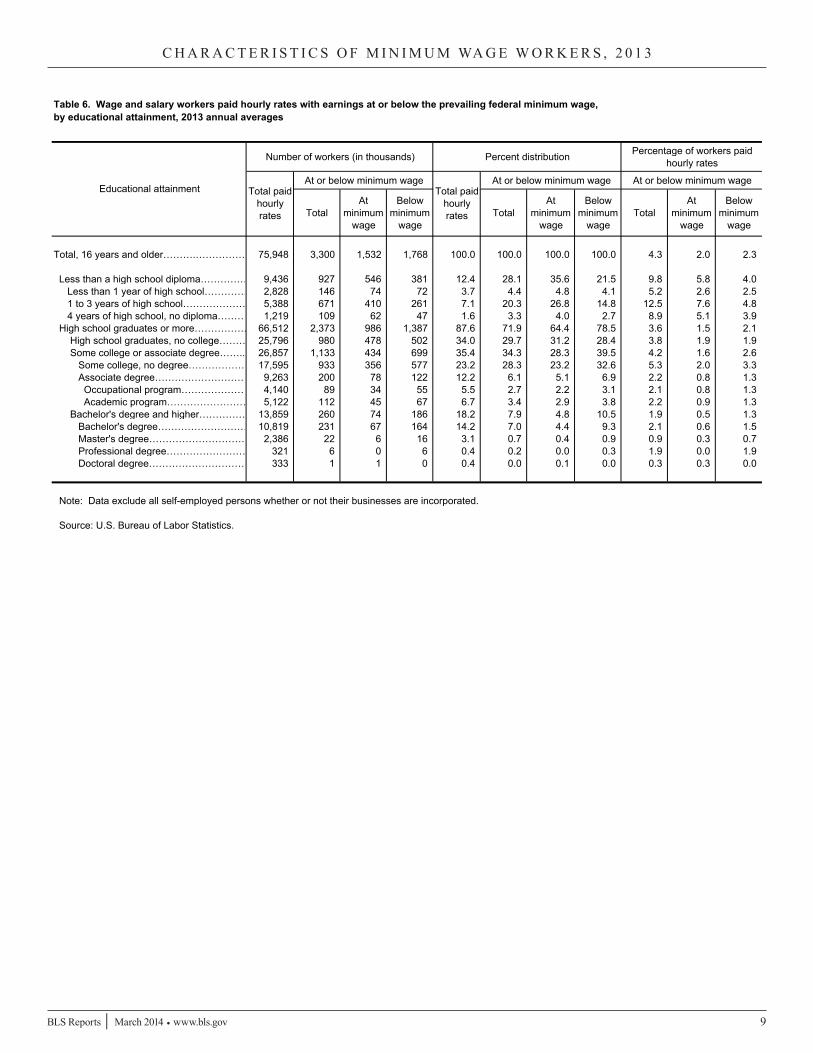
Education. Among hourly paid workers age 16 and older, about 10 percent of those without a high school diploma earned the federal minimum wage or less, compared with about 4 percent of those who had a high school diploma (with no college) and about 2 percent of college graduates. (See table 6.)
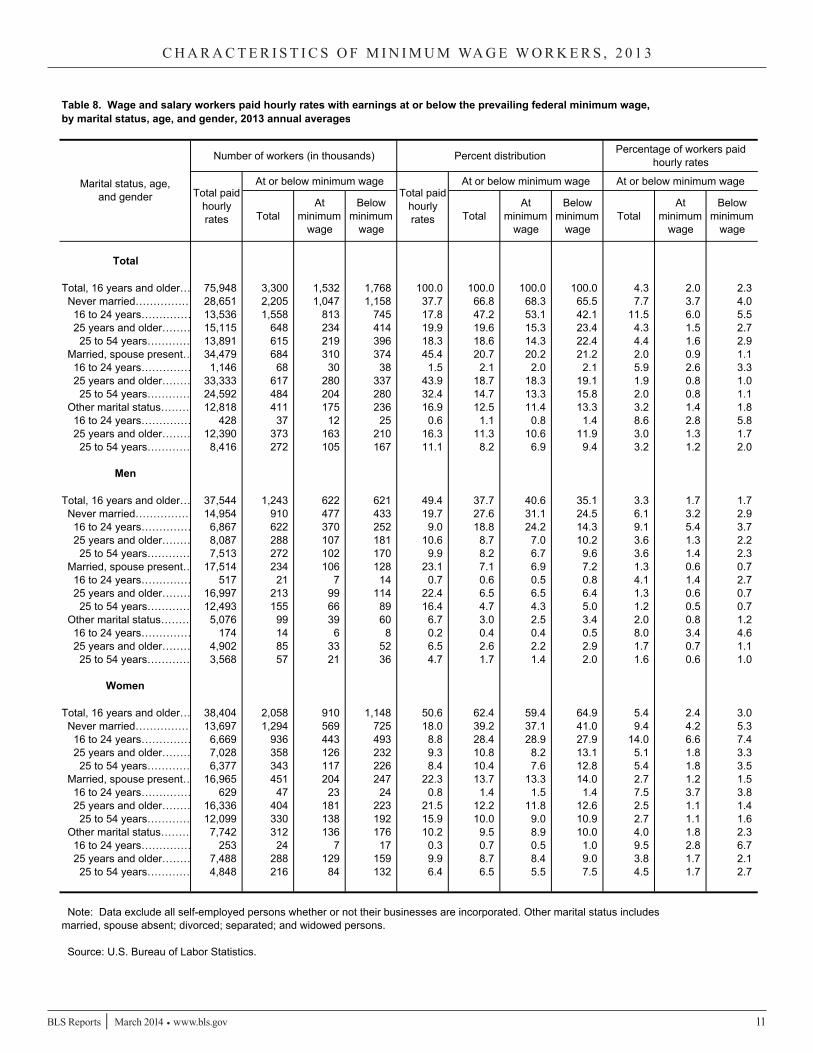
Marital status. Of those paid an hourly wage, never-married workers, who tend to be young, were more likely (8 percent) than married workers (2 percent) to earn the federal minimum wage or less. (See table 8.)
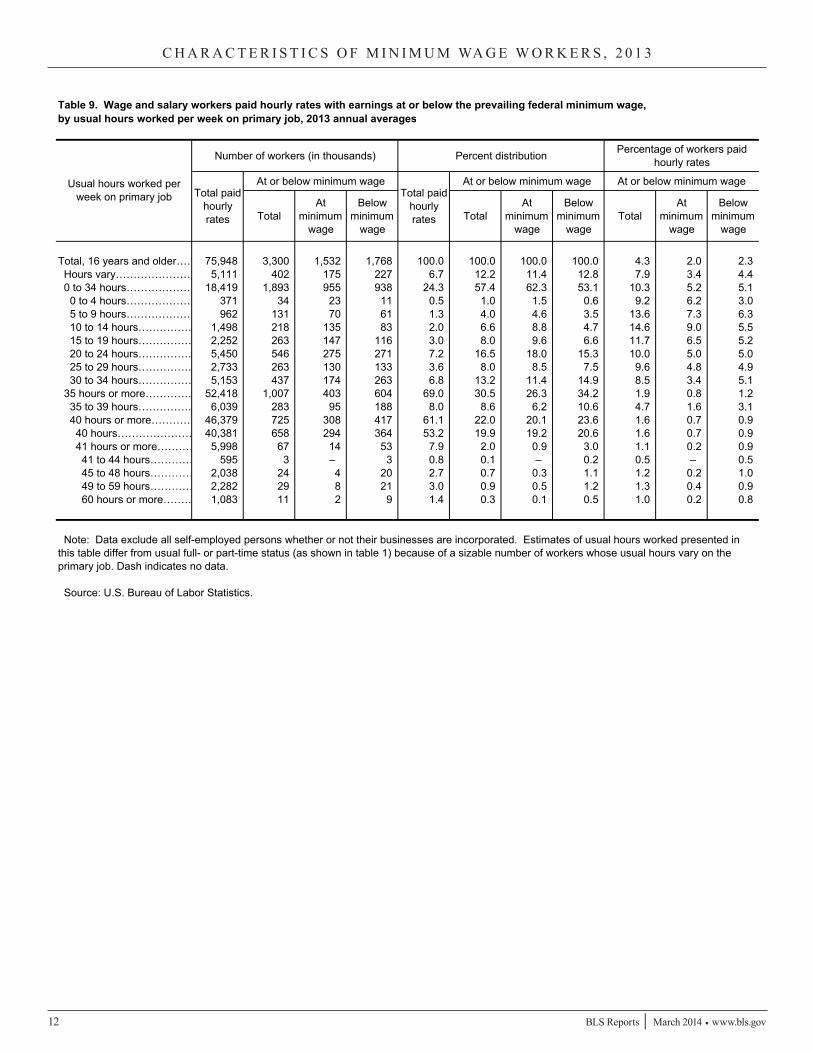
Full- and part-time status. About 10 percent of part-time workers (persons who usually work fewer than 35 hours per week) were paid the federal minimum wage or less,
compared with about 2 percent of full-time workers. (See tables 1 and 9.)
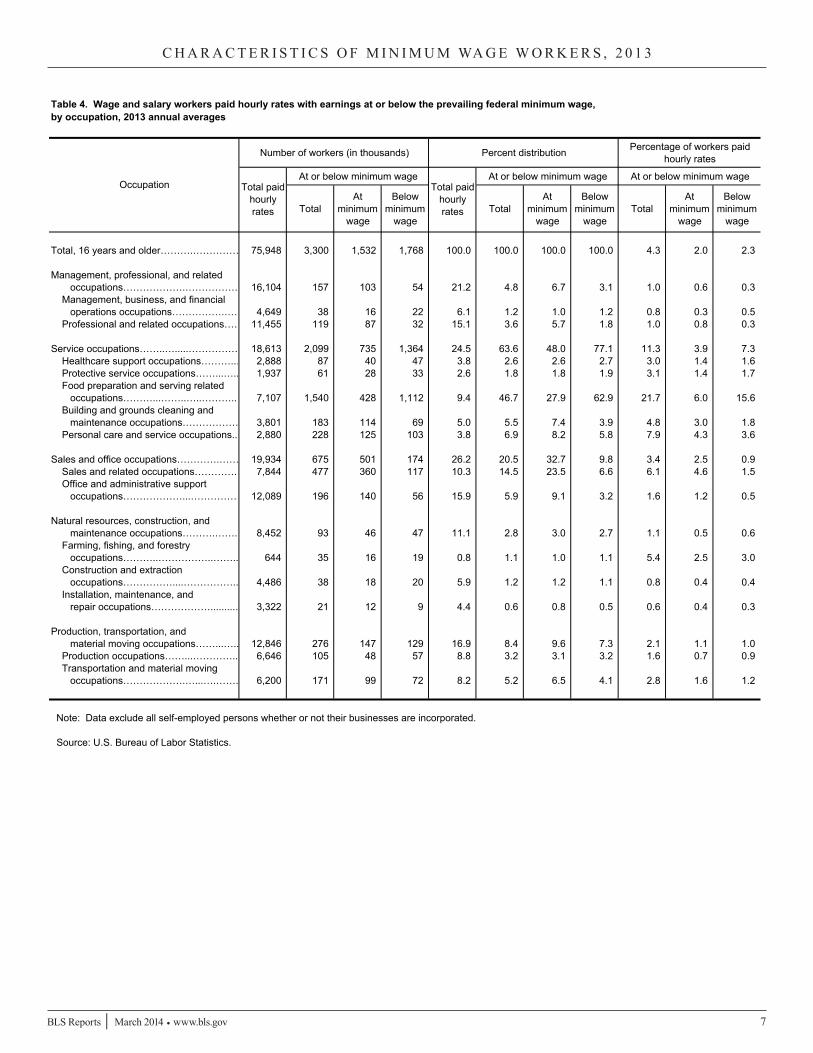
Occupation. Among major occupational groups, the highest percentage of hourly paid workers earning at or below the federal minimum wage was in service occupations, at about 11 percent. Almost two-thirds of workers earning the minimum wage or less in 2013 were employed in service occupations, mostly in food preparation and serving-related jobs. (See table 4.)
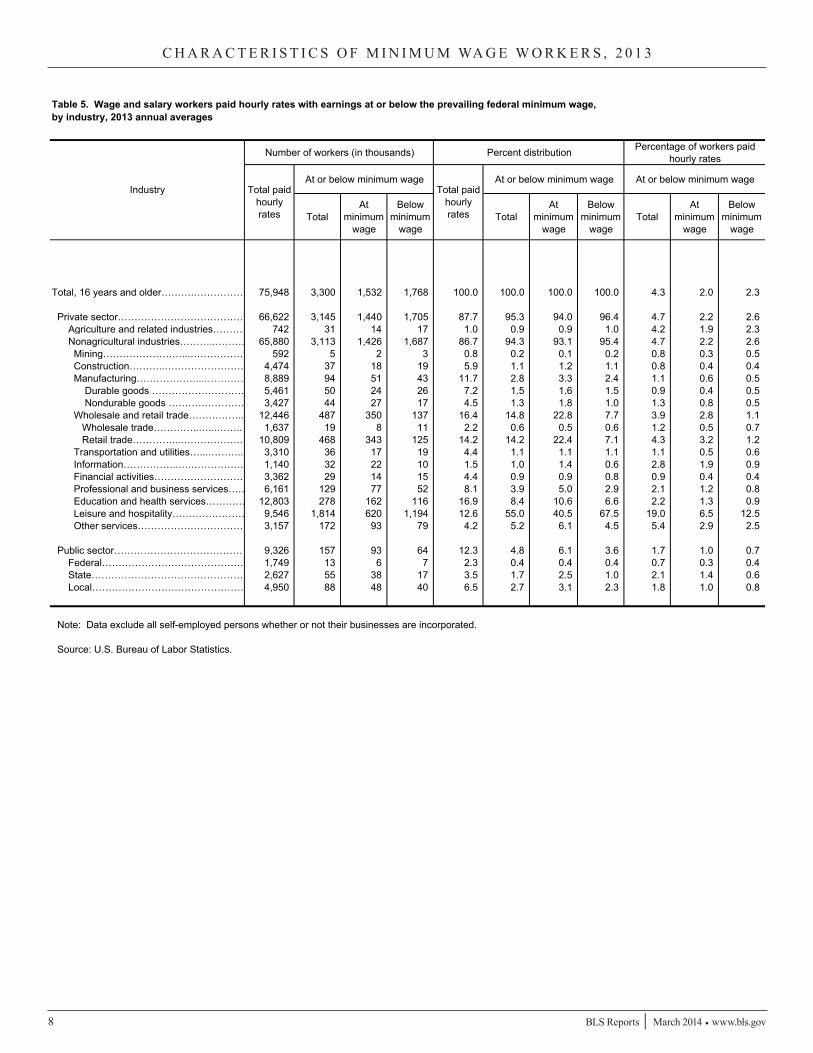
Industry. The industry with the highest percentage of workers earning hourly wages at or below the federal minimum wage was leisure and hospitality (19 percent). Just over half of all workers paid at or below the federal minimum wage were employed in this industry, the vast majority in restaurants and other food services. For many of these workers, tips may supplement the hourly wages received. (See table 5.)
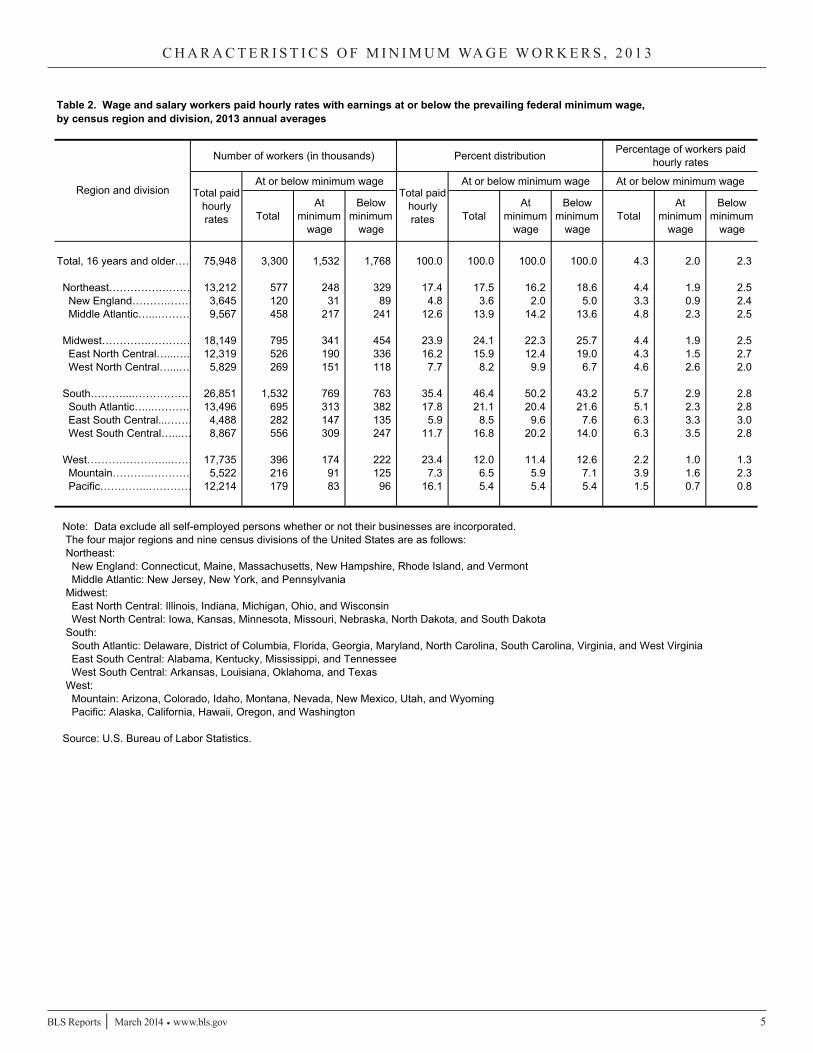
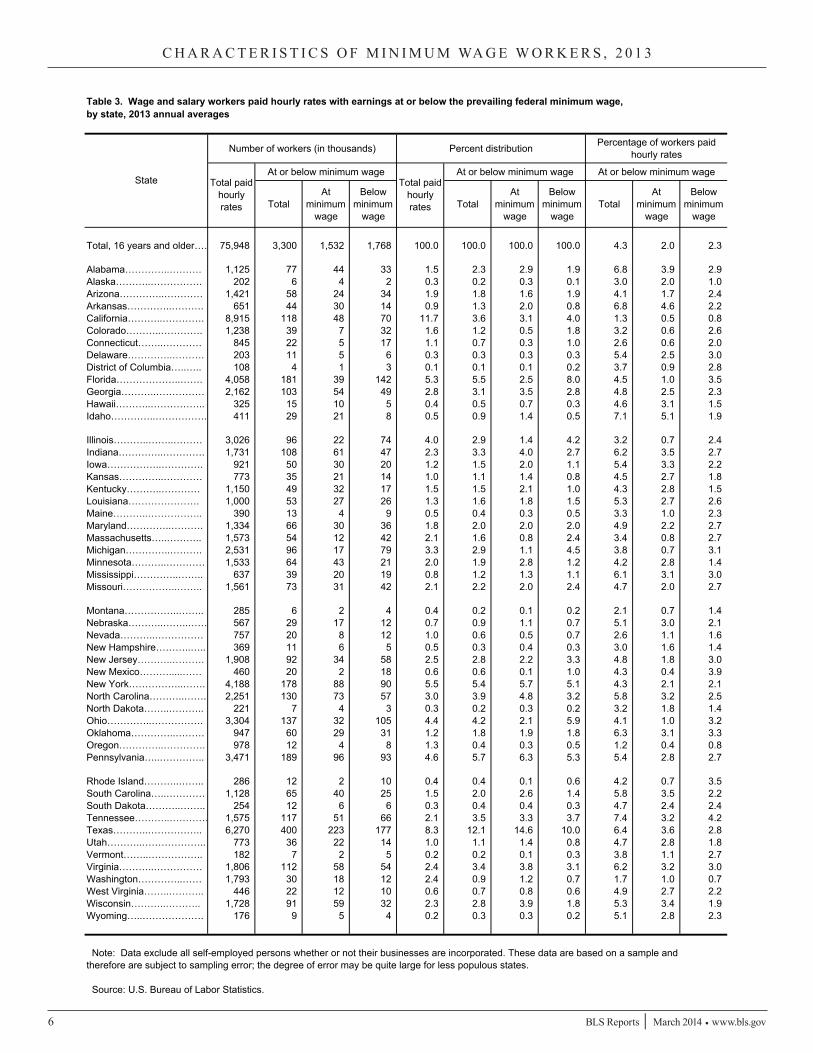
State of residence. The states with the highest percentages of hourly paid workers earning at or below the federal minimum wage were Tennessee and Idaho (both a little more than 7 percent). The states with the lowest percentages of hourly paid workers earning at or below the federal minimum wage were Washington, California, and Oregon (all less than 2 percent). It should be noted that some states have minimum wage laws establishing standards that exceed the federal minimum wage. (See tables 2 and 3.)
BLS Reports │ March 2014 • www.bls.gov 3
C H A R A C T E R I S T I C S O F M I N I M U M WA G E W O R K E R S , 2 0 1 3
Statistical Tables
4 BLS Reports │ March 2014 • www.bls.gov
C H A R A C T E R I S T I C S O F M I N I M U M WA G E W O R K E R S , 2 0 1 3
Table 1. Wage and salary workers paid hourly rates with earnings at or below the prevailing federal minimum wage,by selected characteristics, 2013 annual averages
Number of workers (in thousands) Percent distribution Percentage of workers paidhourly rates
At or below minimum wage At or below minimum wage At or below minimum wage
TotalAt
minimumwage
Belowminimum
wageTotal
Atminimum
wage
Belowminimum
wageTotal
Atminimum
wage
Belowminimum
wage
Age and gender
Total, 16 years and older……….…… 75,948 3,300 1,532 1,768 100.0 100.0 100.0 100.0 4.3 2.0 2.3 16 to 24 years………………………… 15,110 1,663 855 808 19.9 50.4 55.8 45.7 11.0 5.7 5.3 16 to 19 years……………………… 4,089 797 476 321 5.4 24.2 31.1 18.2 19.5 11.6 7.9 25 years and older………...………… 60,838 1,638 677 961 80.1 49.6 44.2 54.4 2.7 1.1 1.6
Men, 16 years and older……………… 37,544 1,243 622 621 49.4 37.7 40.6 35.1 3.3 1.7 1.7 16 to 24 years………..……………… 7,558 655 382 273 10.0 19.8 24.9 15.4 8.7 5.1 3.6 16 to 19 years……………………… 1,975 332 205 127 2.6 10.1 13.4 7.2 16.8 10.4 6.4 25 years and older…………………… 29,985 587 240 347 39.5 17.8 15.7 19.6 2.0 0.8 1.2
Women, 16 years and older…………… 38,404 2,058 910 1,148 50.6 62.4 59.4 64.9 5.4 2.4 3.0 16 to 24 years……………..………… 7,552 1,007 473 534 9.9 30.5 30.9 30.2 13.3 6.3 7.1 16 to 19 years……………………… 2,115 466 272 194 2.8 14.1 17.8 11.0 22.0 12.9 9.2 25 years and older…………..……… 30,852 1,051 437 614 40.6 31.8 28.5 34.7 3.4 1.4 2.0
Race and Hispanicor Latino ethnicity
White ¹…………………………………… 59,515 2,554 1,160 1,394 78.4 77.4 75.7 78.8 4.3 1.9 2.3 Men………………...………………… 29,947 950 470 480 39.4 28.8 30.7 27.1 3.2 1.6 1.6 Women…………..…………………… 29,569 1,605 691 914 38.9 48.6 45.1 51.7 5.4 2.3 3.1
Black or African American ¹…………… 10,233 500 276 224 13.5 15.2 18.0 12.7 4.9 2.7 2.2 Men………………...………………… 4,590 208 121 87 6.0 6.3 7.9 4.9 4.5 2.6 1.9 Women…………..…………………… 5,643 292 155 137 7.4 8.8 10.1 7.7 5.2 2.7 2.4
Asian ¹……………….………………… 3,495 114 43 71 4.6 3.5 2.8 4.0 3.3 1.2 2.0 Men………………...………………… 1,606 44 18 26 2.1 1.3 1.2 1.5 2.7 1.1 1.6 Women…………..…………………… 1,888 70 25 45 2.5 2.1 1.6 2.5 3.7 1.3 2.4
Hispanic or Latino ¹…………………… 14,706 643 318 325 19.4 19.5 20.8 18.4 4.4 2.2 2.2 Men………………...………………… 8,365 280 123 157 11.0 8.5 8.0 8.9 3.3 1.5 1.9 Women…………..…………………… 6,341 363 195 168 8.3 11.0 12.7 9.5 5.7 3.1 2.6
Full- and part-time status
Full-time workers ²……………………. 55,387 1,173 447 726 72.9 35.5 29.2 41.1 2.1 0.8 1.3 Men………………...………………… 30,309 475 184 291 39.9 14.4 12.0 16.5 1.6 0.6 1.0 Women…………..…………………… 25,078 698 263 435 33.0 21.2 17.2 24.6 2.8 1.0 1.7
Part-time workers ²…………………… 20,453 2,125 1,085 1,040 26.9 64.4 70.8 58.8 10.4 5.3 5.1 Men………………...………………… 7,188 766 438 328 9.5 23.2 28.6 18.6 10.7 6.1 4.6 Women…………..…………………… 13,265 1,359 648 711 17.5 41.2 42.3 40.2 10.2 4.9 5.4
¹ Estimates for the race groups—White, Black or African American, and Asian—do not sum to totals because data are not presented for all races. Persons whose ethnicity is identified as Hispanic or Latino may be of any race.
² The distinction between full- and part-time workers is based on hours usually worked. These data will not sum to totals because full- or part-time statuson the principal job is not identifiable for a small number of multiple jobholders. Full time is 35 hours or more per week; part time is less than 35 hours.
Note: Data exclude all self-employed persons whether or not their businesses are incorporated.
Source: U.S. Bureau of Labor Statistics.
Total paid hourlyrates
Characteristic Total paid hourlyrates
BLS Reports │ March 2014 • www.bls.gov 5
C H A R A C T E R I S T I C S O F M I N I M U M WA G E W O R K E R S , 2 0 1 3
Table 2. Wage and salary workers paid hourly rates with earnings at or below the prevailing federal minimum wage,by census region and division, 2013 annual averages
Number of workers (in thousands) Percent distribution Percentage of workers paidhourly rates
At or below minimum wage At or below minimum wage At or below minimum wage
TotalAt
minimumwage
Belowminimum
wageTotal
Atminimum
wage
Belowminimum
wageTotal
Atminimum
wage
Belowminimum
wage
Total, 16 years and older…… 75,948 3,300 1,532 1,768 100.0 100.0 100.0 100.0 4.3 2.0 2.3
Northeast…………….……… 13,212 577 248 329 17.4 17.5 16.2 18.6 4.4 1.9 2.5 New England……….……… 3,645 120 31 89 4.8 3.6 2.0 5.0 3.3 0.9 2.4 Middle Atlantic…...……… 9,567 458 217 241 12.6 13.9 14.2 13.6 4.8 2.3 2.5
Midwest………….………… 18,149 795 341 454 23.9 24.1 22.3 25.7 4.4 1.9 2.5 East North Central…...…. 12,319 526 190 336 16.2 15.9 12.4 19.0 4.3 1.5 2.7 West North Central…...… 5,829 269 151 118 7.7 8.2 9.9 6.7 4.6 2.6 2.0
South………...……………… 26,851 1,532 769 763 35.4 46.4 50.2 43.2 5.7 2.9 2.8 South Atlantic…...………. 13,496 695 313 382 17.8 21.1 20.4 21.6 5.1 2.3 2.8 East South Central...……. 4,488 282 147 135 5.9 8.5 9.6 7.6 6.3 3.3 3.0 West South Central…...… 8,867 556 309 247 11.7 16.8 20.2 14.0 6.3 3.5 2.8
West…………………...…… 17,735 396 174 222 23.4 12.0 11.4 12.6 2.2 1.0 1.3 Mountain………..………… 5,522 216 91 125 7.3 6.5 5.9 7.1 3.9 1.6 2.3 Pacific…………..………… 12,214 179 83 96 16.1 5.4 5.4 5.4 1.5 0.7 0.8
Note: Data exclude all self-employed persons whether or not their businesses are incorporated. The four major regions and nine census divisions of the United States are as follows:
Northeast: New England: Connecticut, Maine, Massachusetts, New Hampshire, Rhode Island, and Vermont Middle Atlantic: New Jersey, New York, and PennsylvaniaMidwest: East North Central: Illinois, Indiana, Michigan, Ohio, and Wisconsin West North Central: Iowa, Kansas, Minnesota, Missouri, Nebraska, North Dakota, and South DakotaSouth: South Atlantic: Delaware, District of Columbia, Florida, Georgia, Maryland, North Carolina, South Carolina, Virginia, and West Virginia East South Central: Alabama, Kentucky, Mississippi, and Tennessee West South Central: Arkansas, Louisiana, Oklahoma, and TexasWest: Mountain: Arizona, Colorado, Idaho, Montana, Nevada, New Mexico, Utah, and Wyoming Pacific: Alaska, California, Hawaii, Oregon, and Washington
Source: U.S. Bureau of Labor Statistics.
Total paid hourlyrates
Region and division Total paid hourlyrates
6 BLS Reports │ March 2014 • www.bls.gov
C H A R A C T E R I S T I C S O F M I N I M U M WA G E W O R K E R S , 2 0 1 3
Table 3. Wage and salary workers paid hourly rates with earnings at or below the prevailing federal minimum wage,by state, 2013 annual averages
Number of workers (in thousands) Percent distribution Percentage of workers paidhourly rates
At or below minimum wage At or below minimum wage At or below minimum wage
TotalAt
minimumwage
Belowminimum
wageTotal
Atminimum
wage
Belowminimum
wageTotal
Atminimum
wage
Belowminimum
wage
Total, 16 years and older…… 75,948 3,300 1,532 1,768 100.0 100.0 100.0 100.0 4.3 2.0 2.3
Alabama…………..………. 1,125 77 44 33 1.5 2.3 2.9 1.9 6.8 3.9 2.9Alaska………..……………. 202 6 4 2 0.3 0.2 0.3 0.1 3.0 2.0 1.0Arizona…………..………… 1,421 58 24 34 1.9 1.8 1.6 1.9 4.1 1.7 2.4Arkansas…………..………. 651 44 30 14 0.9 1.3 2.0 0.8 6.8 4.6 2.2California………..…………. 8,915 118 48 70 11.7 3.6 3.1 4.0 1.3 0.5 0.8Colorado………..…………. 1,238 39 7 32 1.6 1.2 0.5 1.8 3.2 0.6 2.6Connecticut……..………… 845 22 5 17 1.1 0.7 0.3 1.0 2.6 0.6 2.0Delaware…………..………. 203 11 5 6 0.3 0.3 0.3 0.3 5.4 2.5 3.0District of Columbia…..….. 108 4 1 3 0.1 0.1 0.1 0.2 3.7 0.9 2.8Florida………………..……. 4,058 181 39 142 5.3 5.5 2.5 8.0 4.5 1.0 3.5Georgia………..…………… 2,162 103 54 49 2.8 3.1 3.5 2.8 4.8 2.5 2.3Hawaii………..…………….. 325 15 10 5 0.4 0.5 0.7 0.3 4.6 3.1 1.5Idaho…………..……………. 411 29 21 8 0.5 0.9 1.4 0.5 7.1 5.1 1.9
Illinois………..……..……… 3,026 96 22 74 4.0 2.9 1.4 4.2 3.2 0.7 2.4Indiana…………..…………. 1,731 108 61 47 2.3 3.3 4.0 2.7 6.2 3.5 2.7Iowa……………..…………. 921 50 30 20 1.2 1.5 2.0 1.1 5.4 3.3 2.2Kansas…………..………… 773 35 21 14 1.0 1.1 1.4 0.8 4.5 2.7 1.8Kentucky………..………… 1,150 49 32 17 1.5 1.5 2.1 1.0 4.3 2.8 1.5Louisiana…………………. 1,000 53 27 26 1.3 1.6 1.8 1.5 5.3 2.7 2.6Maine………..…………….. 390 13 4 9 0.5 0.4 0.3 0.5 3.3 1.0 2.3Maryland…………..………. 1,334 66 30 36 1.8 2.0 2.0 2.0 4.9 2.2 2.7Massachusetts…..……….. 1,573 54 12 42 2.1 1.6 0.8 2.4 3.4 0.8 2.7Michigan…………..………. 2,531 96 17 79 3.3 2.9 1.1 4.5 3.8 0.7 3.1Minnesota………..………… 1,533 64 43 21 2.0 1.9 2.8 1.2 4.2 2.8 1.4Mississippi…………..…….. 637 39 20 19 0.8 1.2 1.3 1.1 6.1 3.1 3.0Missouri……………..…….. 1,561 73 31 42 2.1 2.2 2.0 2.4 4.7 2.0 2.7
Montana……………..…….. 285 6 2 4 0.4 0.2 0.1 0.2 2.1 0.7 1.4Nebraska………..……..…… 567 29 17 12 0.7 0.9 1.1 0.7 5.1 3.0 2.1Nevada………..…………… 757 20 8 12 1.0 0.6 0.5 0.7 2.6 1.1 1.6New Hampshire………..….. 369 11 6 5 0.5 0.3 0.4 0.3 3.0 1.6 1.4New Jersey………..………. 1,908 92 34 58 2.5 2.8 2.2 3.3 4.8 1.8 3.0New Mexico……….....…… 460 20 2 18 0.6 0.6 0.1 1.0 4.3 0.4 3.9New York……………..……. 4,188 178 88 90 5.5 5.4 5.7 5.1 4.3 2.1 2.1North Carolina………..……. 2,251 130 73 57 3.0 3.9 4.8 3.2 5.8 3.2 2.5North Dakota……..……….. 221 7 4 3 0.3 0.2 0.3 0.2 3.2 1.8 1.4Ohio…………..……………. 3,304 137 32 105 4.4 4.2 2.1 5.9 4.1 1.0 3.2Oklahoma…………..……… 947 60 29 31 1.2 1.8 1.9 1.8 6.3 3.1 3.3Oregon…………..…………. 978 12 4 8 1.3 0.4 0.3 0.5 1.2 0.4 0.8Pennsylvania…..………….. 3,471 189 96 93 4.6 5.7 6.3 5.3 5.4 2.8 2.7
Rhode Island………..…….. 286 12 2 10 0.4 0.4 0.1 0.6 4.2 0.7 3.5South Carolina…..………… 1,128 65 40 25 1.5 2.0 2.6 1.4 5.8 3.5 2.2South Dakota………..…….. 254 12 6 6 0.3 0.4 0.4 0.3 4.7 2.4 2.4Tennessee………..………… 1,575 117 51 66 2.1 3.5 3.3 3.7 7.4 3.2 4.2Texas………..…………….. 6,270 400 223 177 8.3 12.1 14.6 10.0 6.4 3.6 2.8Utah………..……………….. 773 36 22 14 1.0 1.1 1.4 0.8 4.7 2.8 1.8Vermont……..…………….. 182 7 2 5 0.2 0.2 0.1 0.3 3.8 1.1 2.7Virginia………..…………… 1,806 112 58 54 2.4 3.4 3.8 3.1 6.2 3.2 3.0Washington…………..…… 1,793 30 18 12 2.4 0.9 1.2 0.7 1.7 1.0 0.7West Virginia……..……….. 446 22 12 10 0.6 0.7 0.8 0.6 4.9 2.7 2.2Wisconsin………..……….. 1,728 91 59 32 2.3 2.8 3.9 1.8 5.3 3.4 1.9Wyoming…..………………. 176 9 5 4 0.2 0.3 0.3 0.2 5.1 2.8 2.3
Note: Data exclude all self-employed persons whether or not their businesses are incorporated. These data are based on a sample andtherefore are subject to sampling error; the degree of error may be quite large for less populous states.
Source: U.S. Bureau of Labor Statistics.
State Total paid hourlyrates
Total paid hourlyrates
BLS Reports │ March 2014 • www.bls.gov 7
C H A R A C T E R I S T I C S O F M I N I M U M WA G E W O R K E R S , 2 0 1 3
Number of workers (in thousands) Percent distribution Percentage of workers paidhourly rates
At or below minimum wage At or below minimum wage At or below minimum wage
TotalAt
minimumwage
Belowminimum
wageTotal
Atminimum
wage
Belowminimum
wageTotal
Atminimum
wage
Belowminimum
wage
Total, 16 years and older……….…………… 75,948 3,300 1,532 1,768 100.0 100.0 100.0 100.0 4.3 2.0 2.3
Management, professional, and related occupations……………….……………… 16,104 157 103 54 21.2 4.8 6.7 3.1 1.0 0.6 0.3 Management, business, and financial operations occupations…………….…… 4,649 38 16 22 6.1 1.2 1.0 1.2 0.8 0.3 0.5 Professional and related occupations…… 11,455 119 87 32 15.1 3.6 5.7 1.8 1.0 0.8 0.3
Service occupations……..….....…………… 18,613 2,099 735 1,364 24.5 63.6 48.0 77.1 11.3 3.9 7.3 Healthcare support occupations………..… 2,888 87 40 47 3.8 2.6 2.6 2.7 3.0 1.4 1.6 Protective service occupations……...….. 1,937 61 28 33 2.6 1.8 1.8 1.9 3.1 1.4 1.7 Food preparation and serving related occupations………...……..…..……….. 7,107 1,540 428 1,112 9.4 46.7 27.9 62.9 21.7 6.0 15.6 Building and grounds cleaning and maintenance occupations……………… 3,801 183 114 69 5.0 5.5 7.4 3.9 4.8 3.0 1.8 Personal care and service occupations.. 2,880 228 125 103 3.8 6.9 8.2 5.8 7.9 4.3 3.6
Sales and office occupations………….…… 19,934 675 501 174 26.2 20.5 32.7 9.8 3.4 2.5 0.9 Sales and related occupations………….… 7,844 477 360 117 10.3 14.5 23.5 6.6 6.1 4.6 1.5 Office and administrative support occupations………………...…………… 12,089 196 140 56 15.9 5.9 9.1 3.2 1.6 1.2 0.5
Natural resources, construction, and maintenance occupations……….……. 8,452 93 46 47 11.1 2.8 3.0 2.7 1.1 0.5 0.6 Farming, fishing, and forestry occupations………..……………..…….. 644 35 16 19 0.8 1.1 1.0 1.1 5.4 2.5 3.0 Construction and extraction occupations……………....…………….. 4,486 38 18 20 5.9 1.2 1.2 1.1 0.8 0.4 0.4 Installation, maintenance, and repair occupations……………….........… 3,322 21 12 9 4.4 0.6 0.8 0.5 0.6 0.4 0.3
Production, transportation, and material moving occupations……...….. 12,846 276 147 129 16.9 8.4 9.6 7.3 2.1 1.1 1.0 Production occupations……...………….. 6,646 105 48 57 8.8 3.2 3.1 3.2 1.6 0.7 0.9 Transportation and material moving occupations……………….…...….……. 6,200 171 99 72 8.2 5.2 6.5 4.1 2.8 1.6 1.2
Note: Data exclude all self-employed persons whether or not their businesses are incorporated.
Source: U.S. Bureau of Labor Statistics.
Total paid hourlyrates
Occupation Total paid hourlyrates
Table 4. Wage and salary workers paid hourly rates with earnings at or below the prevailing federal minimum wage, by occupation, 2013 annual averages
8 BLS Reports │ March 2014 • www.bls.gov
C H A R A C T E R I S T I C S O F M I N I M U M WA G E W O R K E R S , 2 0 1 3
Number of workers (in thousands) Percent distribution Percentage of workers paidhourly rates
At or below minimum wage At or below minimum wage At or below minimum wage
TotalAt
minimumwage
Belowminimum
wageTotal
Atminimum
wage
Belowminimum
wageTotal
Atminimum
wage
Belowminimum
wage
Total, 16 years and older……….…………… 75,948 3,300 1,532 1,768 100.0 100.0 100.0 100.0 4.3 2.0 2.3
Private sector………………………………… 66,622 3,145 1,440 1,705 87.7 95.3 94.0 96.4 4.7 2.2 2.6 Agriculture and related industries………… 742 31 14 17 1.0 0.9 0.9 1.0 4.2 1.9 2.3 Nonagricultural industries………..……… 65,880 3,113 1,426 1,687 86.7 94.3 93.1 95.4 4.7 2.2 2.6 Mining……………………...……………… 592 5 2 3 0.8 0.2 0.1 0.2 0.8 0.3 0.5 Construction………..…………………… 4,474 37 18 19 5.9 1.1 1.2 1.1 0.8 0.4 0.4 Manufacturing………………...………… 8,889 94 51 43 11.7 2.8 3.3 2.4 1.1 0.6 0.5 Durable goods ………………………… 5,461 50 24 26 7.2 1.5 1.6 1.5 0.9 0.4 0.5 Nondurable goods …………………… 3,427 44 27 17 4.5 1.3 1.8 1.0 1.3 0.8 0.5 Wholesale and retail trade…………….. 12,446 487 350 137 16.4 14.8 22.8 7.7 3.9 2.8 1.1 Wholesale trade…………..…...…….. 1,637 19 8 11 2.2 0.6 0.5 0.6 1.2 0.5 0.7 Retail trade…………...………………. 10,809 468 343 125 14.2 14.2 22.4 7.1 4.3 3.2 1.2 Transportation and utilities…...……….. 3,310 36 17 19 4.4 1.1 1.1 1.1 1.1 0.5 0.6 Information……………..….……………. 1,140 32 22 10 1.5 1.0 1.4 0.6 2.8 1.9 0.9 Financial activities……………………… 3,362 29 14 15 4.4 0.9 0.9 0.8 0.9 0.4 0.4 Professional and business services…… 6,161 129 77 52 8.1 3.9 5.0 2.9 2.1 1.2 0.8 Education and health services………… 12,803 278 162 116 16.9 8.4 10.6 6.6 2.2 1.3 0.9 Leisure and hospitality…………………… 9,546 1,814 620 1,194 12.6 55.0 40.5 67.5 19.0 6.5 12.5 Other services…………………………… 3,157 172 93 79 4.2 5.2 6.1 4.5 5.4 2.9 2.5
Public sector………………………………… 9,326 157 93 64 12.3 4.8 6.1 3.6 1.7 1.0 0.7 Federal……………………………………. 1,749 13 6 7 2.3 0.4 0.4 0.4 0.7 0.3 0.4 State………………………………………… 2,627 55 38 17 3.5 1.7 2.5 1.0 2.1 1.4 0.6 Local………………………………………… 4,950 88 48 40 6.5 2.7 3.1 2.3 1.8 1.0 0.8
Note: Data exclude all self-employed persons whether or not their businesses are incorporated.
Source: U.S. Bureau of Labor Statistics.
Total paid hourlyrates
Industry Total paid hourlyrates
Table 5. Wage and salary workers paid hourly rates with earnings at or below the prevailing federal minimum wage,by industry, 2013 annual averages
BLS Reports │ March 2014 • www.bls.gov 9
C H A R A C T E R I S T I C S O F M I N I M U M WA G E W O R K E R S , 2 0 1 3
Number of workers (in thousands) Percent distribution Percentage of workers paidhourly rates
At or below minimum wage At or below minimum wage At or below minimum wage
TotalAt
minimumwage
Belowminimum
wageTotal
Atminimum
wage
Belowminimum
wageTotal
Atminimum
wage
Belowminimum
wage
Total, 16 years and older……….…………… 75,948 3,300 1,532 1,768 100.0 100.0 100.0 100.0 4.3 2.0 2.3
Less than a high school diploma…………… 9,436 927 546 381 12.4 28.1 35.6 21.5 9.8 5.8 4.0 Less than 1 year of high school…………. 2,828 146 74 72 3.7 4.4 4.8 4.1 5.2 2.6 2.5 1 to 3 years of high school………………… 5,388 671 410 261 7.1 20.3 26.8 14.8 12.5 7.6 4.8 4 years of high school, no diploma……… 1,219 109 62 47 1.6 3.3 4.0 2.7 8.9 5.1 3.9 High school graduates or more……………. 66,512 2,373 986 1,387 87.6 71.9 64.4 78.5 3.6 1.5 2.1 High school graduates, no college……… 25,796 980 478 502 34.0 29.7 31.2 28.4 3.8 1.9 1.9 Some college or associate degree…….. 26,857 1,133 434 699 35.4 34.3 28.3 39.5 4.2 1.6 2.6 Some college, no degree……………… 17,595 933 356 577 23.2 28.3 23.2 32.6 5.3 2.0 3.3 Associate degree………………………… 9,263 200 78 122 12.2 6.1 5.1 6.9 2.2 0.8 1.3 Occupational program………………… 4,140 89 34 55 5.5 2.7 2.2 3.1 2.1 0.8 1.3 Academic program…………………… 5,122 112 45 67 6.7 3.4 2.9 3.8 2.2 0.9 1.3 Bachelor's degree and higher…………… 13,859 260 74 186 18.2 7.9 4.8 10.5 1.9 0.5 1.3 Bachelor's degree……………………… 10,819 231 67 164 14.2 7.0 4.4 9.3 2.1 0.6 1.5 Master's degree………………………… 2,386 22 6 16 3.1 0.7 0.4 0.9 0.9 0.3 0.7 Professional degree…………………… 321 6 0 6 0.4 0.2 0.0 0.3 1.9 0.0 1.9 Doctoral degree………………………… 333 1 1 0 0.4 0.0 0.1 0.0 0.3 0.3 0.0
Note: Data exclude all self-employed persons whether or not their businesses are incorporated.
Source: U.S. Bureau of Labor Statistics.
Total paid hourlyrates
Educational attainment Total paid hourlyrates
Table 6. Wage and salary workers paid hourly rates with earnings at or below the prevailing federal minimum wage,by educational attainment, 2013 annual averages
10 BLS Reports │ March 2014 • www.bls.gov
C H A R A C T E R I S T I C S O F M I N I M U M WA G E W O R K E R S , 2 0 1 3
Table 7. Wage and salary workers paid hourly rates with earnings at or below the prevailing federal minimum wage,by age and gender, 2013 annual averages
Number of workers (in thousands) Percent distribution Percentage of workers paidhourly rates
At or below minimum wage At or below minimum wage At or below minimum wage
TotalAt
minimumwage
Belowminimum
wageTotal
Atminimum
wage
Belowminimum
wageTotal
Atminimum
wage
Belowminimum
wage
Total
Total, 16 years and older……… 75,948 3,300 1,532 1,768 100.0 100.0 100.0 100.0 4.3 2.0 2.3 16 to 24 years……………….. 15,110 1,663 855 808 19.9 50.4 55.8 45.7 11.0 5.7 5.3 16 to 19 years………………. 4,089 797 476 321 5.4 24.2 31.1 18.2 19.5 11.6 7.9 20 to 24 years………………… 11,021 866 379 487 14.5 26.2 24.7 27.5 7.9 3.4 4.4 25 years and older…………… 60,838 1,638 677 961 80.1 49.6 44.2 54.4 2.7 1.1 1.6 25 to 34 years………………… 17,607 703 249 454 23.2 21.3 16.3 25.7 4.0 1.4 2.6 25 to 29 years……………… 9,430 436 158 278 12.4 13.2 10.3 15.7 4.6 1.7 2.9 30 to 34 years……………… 8,177 267 91 176 10.8 8.1 5.9 10.0 3.3 1.1 2.2 35 to 44 years………………. 14,195 355 144 211 18.7 10.8 9.4 11.9 2.5 1.0 1.5 35 to 39 years……………… 7,035 184 73 111 9.3 5.6 4.8 6.3 2.6 1.0 1.6 40 to 44 years……………… 7,160 170 71 99 9.4 5.2 4.6 5.6 2.4 1.0 1.4 45 to 54 years………………… 15,097 314 135 179 19.9 9.5 8.8 10.1 2.1 0.9 1.2 45 to 49 years……………… 7,464 159 68 91 9.8 4.8 4.4 5.1 2.1 0.9 1.2 50 to 54 years……………… 7,633 155 67 88 10.1 4.7 4.4 5.0 2.0 0.9 1.2 55 to 64 years………………… 10,713 155 89 66 14.1 4.7 5.8 3.7 1.4 0.8 0.6 55 to 59 years……………… 6,558 96 55 41 8.6 2.9 3.6 2.3 1.5 0.8 0.6 60 to 64 years……………… 4,155 58 33 25 5.5 1.8 2.2 1.4 1.4 0.8 0.6 65 years and older…………… 3,227 111 60 51 4.2 3.4 3.9 2.9 3.4 1.9 1.6 65 to 69 years……………… 1,866 51 28 23 2.5 1.5 1.8 1.3 2.7 1.5 1.2 70 years and older………… 1,361 60 33 27 1.8 1.8 2.2 1.5 4.4 2.4 2.0
Men
Total, 16 years and older……… 37,544 1,243 622 621 49.4 37.7 40.6 35.1 3.3 1.7 1.7 16 to 24 years………………… 7,558 655 382 273 10.0 19.8 24.9 15.4 8.7 5.1 3.6 16 to 19 years………………. 1,975 332 205 127 2.6 10.1 13.4 7.2 16.8 10.4 6.4 20 to 24 years………………. 5,584 325 178 147 7.4 9.8 11.6 8.3 5.8 3.2 2.6 25 years and older…………… 29,985 587 240 347 39.5 17.8 15.7 19.6 2.0 0.8 1.2 25 to 34 years………………… 9,281 286 109 177 12.2 8.7 7.1 10.0 3.1 1.2 1.9 25 to 29 years……………… 4,927 171 71 100 6.5 5.2 4.6 5.7 3.5 1.4 2.0 30 to 34 years……………… 4,354 116 39 77 5.7 3.5 2.5 4.4 2.7 0.9 1.8 35 to 44 years………………. 7,112 116 44 72 9.4 3.5 2.9 4.1 1.6 0.6 1.0 35 to 39 years……………… 3,569 59 22 37 4.7 1.8 1.4 2.1 1.7 0.6 1.0 40 to 44 years……………… 3,543 57 22 35 4.7 1.7 1.4 2.0 1.6 0.6 1.0 45 to 54 years……………… 7,181 83 36 47 9.5 2.5 2.3 2.7 1.2 0.5 0.7 45 to 49 years…………….. 3,579 41 18 23 4.7 1.2 1.2 1.3 1.1 0.5 0.6 50 to 54 years……………… 3,601 42 18 24 4.7 1.3 1.2 1.4 1.2 0.5 0.7 55 to 64 years………………… 4,915 55 29 26 6.5 1.7 1.9 1.5 1.1 0.6 0.5 55 to 59 years……………. 3,020 33 17 16 4.0 1.0 1.1 0.9 1.1 0.6 0.5 60 to 64 years……………… 1,895 22 12 10 2.5 0.7 0.8 0.6 1.2 0.6 0.5 65 years and older…………… 1,496 47 21 26 2.0 1.4 1.4 1.5 3.1 1.4 1.7 65 to 69 years……………… 860 21 8 13 1.1 0.6 0.5 0.7 2.4 0.9 1.5 70 years and older………… 636 27 14 13 0.8 0.8 0.9 0.7 4.2 2.2 2.0
Women
Total, 16 years and older……… 38,404 2,058 910 1,148 50.6 62.4 59.4 64.9 5.4 2.4 3.0 16 to 24 years………………… 7,552 1,007 473 534 9.9 30.5 30.9 30.2 13.3 6.3 7.1 16 to 19 years………………. 2,115 466 272 194 2.8 14.1 17.8 11.0 22.0 12.9 9.2 20 to 24 years………………… 5,437 541 201 340 7.2 16.4 13.1 19.2 10.0 3.7 6.3 25 years and older…………… 30,852 1,051 437 614 40.6 31.8 28.5 34.7 3.4 1.4 2.0 25 to 34 years………………. 8,326 418 140 278 11.0 12.7 9.1 15.7 5.0 1.7 3.3 25 to 29 years……………… 4,503 265 87 178 5.9 8.0 5.7 10.1 5.9 1.9 4.0 30 to 34 years……………… 3,823 152 53 99 5.0 4.6 3.5 5.6 4.0 1.4 2.6 35 to 44 years………………. 7,082 239 100 139 9.3 7.2 6.5 7.9 3.4 1.4 2.0 35 to 39 years…………… 3,465 126 51 75 4.6 3.8 3.3 4.2 3.6 1.5 2.2 40 to 44 years……………… 3,617 113 49 64 4.8 3.4 3.2 3.6 3.1 1.4 1.8 45 to 54 years………………. 7,916 231 99 132 10.4 7.0 6.5 7.5 2.9 1.3 1.7 45 to 49 years……………… 3,885 118 50 68 5.1 3.6 3.3 3.8 3.0 1.3 1.8 50 to 54 years……………… 4,031 113 49 64 5.3 3.4 3.2 3.6 2.8 1.2 1.6 55 to 64 years……………… 5,798 99 59 40 7.6 3.0 3.9 2.3 1.7 1.0 0.7 55 to 59 years……………. 3,538 63 38 25 4.7 1.9 2.5 1.4 1.8 1.1 0.7 60 to 64 years……………… 2,260 35 21 14 3.0 1.1 1.4 0.8 1.5 0.9 0.6 65 years and older…………… 1,731 64 39 25 2.3 1.9 2.5 1.4 3.7 2.3 1.4 65 to 69 years……………… 1,005 31 20 11 1.3 0.9 1.3 0.6 3.1 2.0 1.1 70 years and older………… 725 33 19 14 1.0 1.0 1.2 0.8 4.6 2.6 1.9
Note: Data exclude all self-employed persons whether or not their businesses are incorporated.
Source: U.S. Bureau of Labor Statistics.
Total paid hourlyrates
Age and gender Total paid hourlyrates
BLS Reports │ March 2014 • www.bls.gov 11
C H A R A C T E R I S T I C S O F M I N I M U M WA G E W O R K E R S , 2 0 1 3
Table 8. Wage and salary workers paid hourly rates with earnings at or below the prevailing federal minimum wage,by marital status, age, and gender, 2013 annual averages
Number of workers (in thousands) Percent distribution Percentage of workers paidhourly rates
At or below minimum wage At or below minimum wage At or below minimum wage
TotalAt
minimumwage
Belowminimum
wageTotal
Atminimum
wage
Belowminimum
wageTotal
Atminimum
wage
Belowminimum
wage
Total
Total, 16 years and older… 75,948 3,300 1,532 1,768 100.0 100.0 100.0 100.0 4.3 2.0 2.3 Never married……………… 28,651 2,205 1,047 1,158 37.7 66.8 68.3 65.5 7.7 3.7 4.0 16 to 24 years…………… 13,536 1,558 813 745 17.8 47.2 53.1 42.1 11.5 6.0 5.5 25 years and older……… 15,115 648 234 414 19.9 19.6 15.3 23.4 4.3 1.5 2.7 25 to 54 years………… 13,891 615 219 396 18.3 18.6 14.3 22.4 4.4 1.6 2.9 Married, spouse present… 34,479 684 310 374 45.4 20.7 20.2 21.2 2.0 0.9 1.1 16 to 24 years…………… 1,146 68 30 38 1.5 2.1 2.0 2.1 5.9 2.6 3.3 25 years and older……… 33,333 617 280 337 43.9 18.7 18.3 19.1 1.9 0.8 1.0 25 to 54 years………… 24,592 484 204 280 32.4 14.7 13.3 15.8 2.0 0.8 1.1 Other marital status……… 12,818 411 175 236 16.9 12.5 11.4 13.3 3.2 1.4 1.8 16 to 24 years…………… 428 37 12 25 0.6 1.1 0.8 1.4 8.6 2.8 5.8 25 years and older……… 12,390 373 163 210 16.3 11.3 10.6 11.9 3.0 1.3 1.7 25 to 54 years………… 8,416 272 105 167 11.1 8.2 6.9 9.4 3.2 1.2 2.0
Men
Total, 16 years and older… 37,544 1,243 622 621 49.4 37.7 40.6 35.1 3.3 1.7 1.7 Never married……………… 14,954 910 477 433 19.7 27.6 31.1 24.5 6.1 3.2 2.9 16 to 24 years…………… 6,867 622 370 252 9.0 18.8 24.2 14.3 9.1 5.4 3.7 25 years and older……… 8,087 288 107 181 10.6 8.7 7.0 10.2 3.6 1.3 2.2 25 to 54 years………… 7,513 272 102 170 9.9 8.2 6.7 9.6 3.6 1.4 2.3 Married, spouse present… 17,514 234 106 128 23.1 7.1 6.9 7.2 1.3 0.6 0.7 16 to 24 years…………… 517 21 7 14 0.7 0.6 0.5 0.8 4.1 1.4 2.7 25 years and older……… 16,997 213 99 114 22.4 6.5 6.5 6.4 1.3 0.6 0.7 25 to 54 years………… 12,493 155 66 89 16.4 4.7 4.3 5.0 1.2 0.5 0.7 Other marital status……… 5,076 99 39 60 6.7 3.0 2.5 3.4 2.0 0.8 1.2 16 to 24 years…………… 174 14 6 8 0.2 0.4 0.4 0.5 8.0 3.4 4.6 25 years and older……… 4,902 85 33 52 6.5 2.6 2.2 2.9 1.7 0.7 1.1 25 to 54 years………… 3,568 57 21 36 4.7 1.7 1.4 2.0 1.6 0.6 1.0
Women
Total, 16 years and older… 38,404 2,058 910 1,148 50.6 62.4 59.4 64.9 5.4 2.4 3.0 Never married……………… 13,697 1,294 569 725 18.0 39.2 37.1 41.0 9.4 4.2 5.3 16 to 24 years…………… 6,669 936 443 493 8.8 28.4 28.9 27.9 14.0 6.6 7.4 25 years and older……… 7,028 358 126 232 9.3 10.8 8.2 13.1 5.1 1.8 3.3 25 to 54 years………… 6,377 343 117 226 8.4 10.4 7.6 12.8 5.4 1.8 3.5 Married, spouse present… 16,965 451 204 247 22.3 13.7 13.3 14.0 2.7 1.2 1.5 16 to 24 years…………… 629 47 23 24 0.8 1.4 1.5 1.4 7.5 3.7 3.8 25 years and older……… 16,336 404 181 223 21.5 12.2 11.8 12.6 2.5 1.1 1.4 25 to 54 years………… 12,099 330 138 192 15.9 10.0 9.0 10.9 2.7 1.1 1.6 Other marital status……… 7,742 312 136 176 10.2 9.5 8.9 10.0 4.0 1.8 2.3 16 to 24 years…………… 253 24 7 17 0.3 0.7 0.5 1.0 9.5 2.8 6.7 25 years and older……… 7,488 288 129 159 9.9 8.7 8.4 9.0 3.8 1.7 2.1 25 to 54 years………… 4,848 216 84 132 6.4 6.5 5.5 7.5 4.5 1.7 2.7
Note: Data exclude all self-employed persons whether or not their businesses are incorporated. Other marital status includesmarried, spouse absent; divorced; separated; and widowed persons.
Source: U.S. Bureau of Labor Statistics.
Total paid hourlyrates
Marital status, age,and gender Total paid
hourlyrates
12 BLS Reports │ March 2014 • www.bls.gov
C H A R A C T E R I S T I C S O F M I N I M U M WA G E W O R K E R S , 2 0 1 3
Table 9. Wage and salary workers paid hourly rates with earnings at or below the prevailing federal minimum wage,by usual hours worked per week on primary job, 2013 annual averages
Number of workers (in thousands) Percent distribution Percentage of workers paidhourly rates
At or below minimum wage At or below minimum wage At or below minimum wage
TotalAt
minimumwage
Belowminimum
wageTotal
Atminimum
wage
Belowminimum
wageTotal
Atminimum
wage
Belowminimum
wage
Total, 16 years and older…… 75,948 3,300 1,532 1,768 100.0 100.0 100.0 100.0 4.3 2.0 2.3 Hours vary………………… 5,111 402 175 227 6.7 12.2 11.4 12.8 7.9 3.4 4.4 0 to 34 hours……………… 18,419 1,893 955 938 24.3 57.4 62.3 53.1 10.3 5.2 5.1 0 to 4 hours……………… 371 34 23 11 0.5 1.0 1.5 0.6 9.2 6.2 3.0 5 to 9 hours……………… 962 131 70 61 1.3 4.0 4.6 3.5 13.6 7.3 6.3 10 to 14 hours…………… 1,498 218 135 83 2.0 6.6 8.8 4.7 14.6 9.0 5.5 15 to 19 hours…………… 2,252 263 147 116 3.0 8.0 9.6 6.6 11.7 6.5 5.2 20 to 24 hours…………… 5,450 546 275 271 7.2 16.5 18.0 15.3 10.0 5.0 5.0 25 to 29 hours…………… 2,733 263 130 133 3.6 8.0 8.5 7.5 9.6 4.8 4.9 30 to 34 hours…………… 5,153 437 174 263 6.8 13.2 11.4 14.9 8.5 3.4 5.1 35 hours or more…………… 52,418 1,007 403 604 69.0 30.5 26.3 34.2 1.9 0.8 1.2 35 to 39 hours…………… 6,039 283 95 188 8.0 8.6 6.2 10.6 4.7 1.6 3.1 40 hours or more………… 46,379 725 308 417 61.1 22.0 20.1 23.6 1.6 0.7 0.9 40 hours………………… 40,381 658 294 364 53.2 19.9 19.2 20.6 1.6 0.7 0.9 41 hours or more………… 5,998 67 14 53 7.9 2.0 0.9 3.0 1.1 0.2 0.9 41 to 44 hours………… 595 3 – 3 0.8 0.1 – 0.2 0.5 – 0.5 45 to 48 hours………… 2,038 24 4 20 2.7 0.7 0.3 1.1 1.2 0.2 1.0 49 to 59 hours………… 2,282 29 8 21 3.0 0.9 0.5 1.2 1.3 0.4 0.9 60 hours or more……… 1,083 11 2 9 1.4 0.3 0.1 0.5 1.0 0.2 0.8
Note: Data exclude all self-employed persons whether or not their businesses are incorporated. Estimates of usual hours worked presented inthis table differ from usual full- or part-time status (as shown in table 1) because of a sizable number of workers whose usual hours vary on theprimary job. Dash indicates no data.
Source: U.S. Bureau of Labor Statistics.
Total paid hourlyrates
Usual hours worked per week on primary job Total paid
hourlyrates
BLS Reports │ March 2014 • www.bls.gov 13
C H A R A C T E R I S T I C S O F M I N I M U M WA G E W O R K E R S , 2 0 1 3
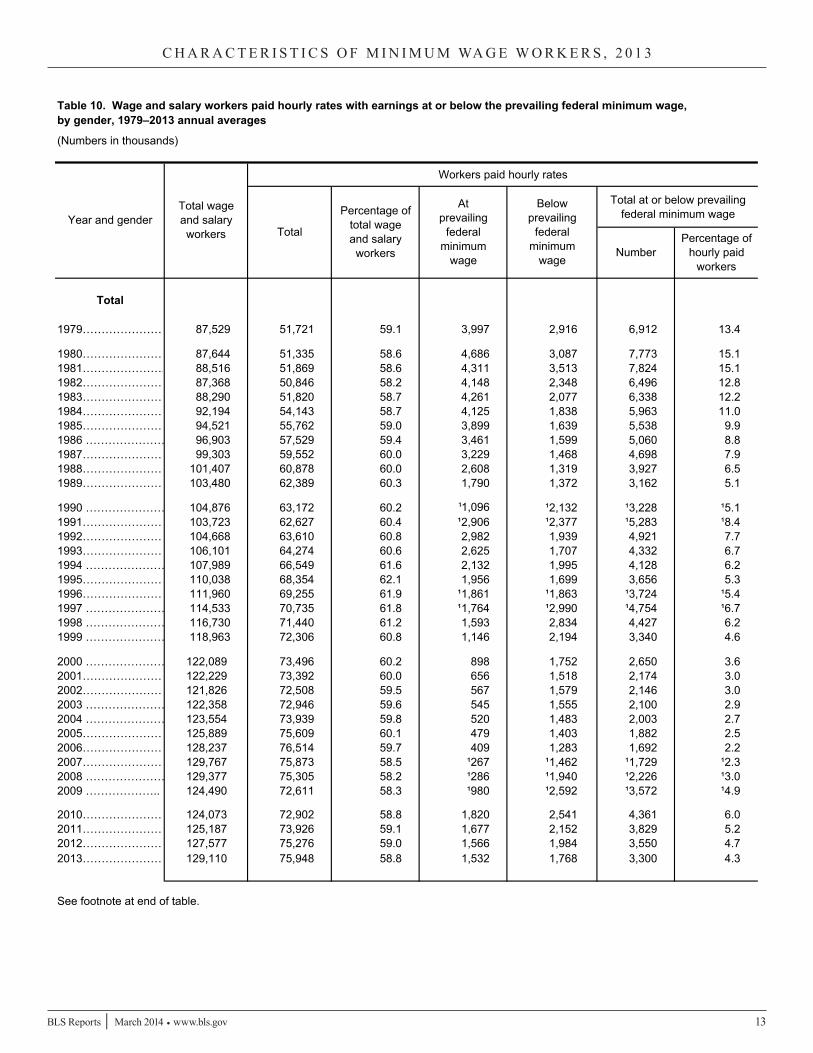
Table 10. Wage and salary workers paid hourly rates with earnings at or below the prevailing federal minimum wage,by gender, 1979–2013 annual averages
(Numbers in thousands)
Workers paid hourly rates
Total at or below prevailing federal minimum wage
Total
1979…………………… 87,529 51,721 59.1 3,997 2,916 6,912 13.4
1980…………………… 87,644 51,335 58.6 4,686 3,087 7,773 15.11981…………………. 88,516 51,869 58.6 4,311 3,513 7,824 15.11982…………………… 87,368 50,846 58.2 4,148 2,348 6,496 12.81983…………………… 88,290 51,820 58.7 4,261 2,077 6,338 12.21984…………………… 92,194 54,143 58.7 4,125 1,838 5,963 11.01985…………………… 94,521 55,762 59.0 3,899 1,639 5,538 9.91986 ………………… 96,903 57,529 59.4 3,461 1,599 5,060 8.81987…………………… 99,303 59,552 60.0 3,229 1,468 4,698 7.91988…………………… 101,407 60,878 60.0 2,608 1,319 3,927 6.51989…………………… 103,480 62,389 60.3 1,790 1,372 3,162 5.1
1990 ………………… 104,876 63,172 60.2 ¹1,096 ¹2,132 ¹3,228 ¹5.11991…………………… 103,723 62,627 60.4 ¹2,906 ¹2,377 ¹5,283 ¹8.41992…………………… 104,668 63,610 60.8 2,982 1,939 4,921 7.71993…………………… 106,101 64,274 60.6 2,625 1,707 4,332 6.71994 ………………… 107,989 66,549 61.6 2,132 1,995 4,128 6.21995…………………… 110,038 68,354 62.1 1,956 1,699 3,656 5.31996…………………… 111,960 69,255 61.9 ¹1,861 ¹1,863 ¹3,724 ¹5.41997 ………………… 114,533 70,735 61.8 ¹1,764 ¹2,990 ¹4,754 ¹6.71998 ………………… 116,730 71,440 61.2 1,593 2,834 4,427 6.21999 ………………… 118,963 72,306 60.8 1,146 2,194 3,340 4.6
2000 ………………… 122,089 73,496 60.2 898 1,752 2,650 3.62001…………………… 122,229 73,392 60.0 656 1,518 2,174 3.02002…………………… 121,826 72,508 59.5 567 1,579 2,146 3.02003 ………………… 122,358 72,946 59.6 545 1,555 2,100 2.92004 ………………… 123,554 73,939 59.8 520 1,483 2,003 2.72005…………………… 125,889 75,609 60.1 479 1,403 1,882 2.52006…………………… 128,237 76,514 59.7 409 1,283 1,692 2.22007…………………… 129,767 75,873 58.5 ¹267 ¹1,462 ¹1,729 ¹2.32008 ………………… 129,377 75,305 58.2 ¹286 ¹1,940 ¹2,226 ¹3.02009 ……………….. 124,490 72,611 58.3 ¹980 ¹2,592 ¹3,572 ¹4.9
2010…………………… 124,073 72,902 58.8 1,820 2,541 4,361 6.02011…………………… 125,187 73,926 59.1 1,677 2,152 3,829 5.22012…………………… 127,577 75,276 59.0 1,566 1,984 3,550 4.72013…………………… 129,110 75,948 58.8 1,532 1,768 3,300 4.3
See footnote at end of table.
Belowprevailing
federalminimum
wage
Percentage of hourly paid
workersNumber
Year and genderTotal wageand salary workers Total
Percentage oftotal wageand salary workers
Atprevailing
federalminimum
wage
14 BLS Reports │ March 2014 • www.bls.gov
C H A R A C T E R I S T I C S O F M I N I M U M WA G E W O R K E R S , 2 0 1 3
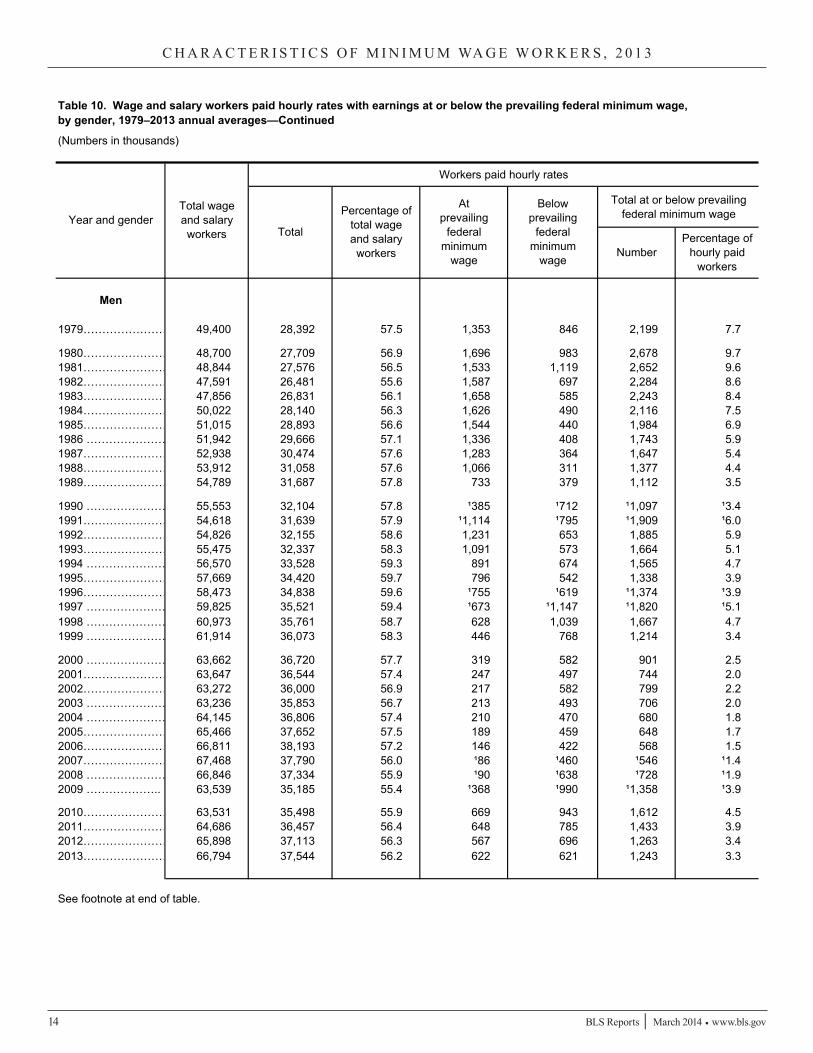
Table 10. Wage and salary workers paid hourly rates with earnings at or below the prevailing federal minimum wage,by gender, 1979–2013 annual averages—Continued
(Numbers in thousands)
Workers paid hourly rates
Total at or below prevailing federal minimum wage
Men
1979…………………… 49,400 28,392 57.5 1,353 846 2,199 7.7
1980…………………… 48,700 27,709 56.9 1,696 983 2,678 9.71981…………………. 48,844 27,576 56.5 1,533 1,119 2,652 9.61982…………………… 47,591 26,481 55.6 1,587 697 2,284 8.61983…………………… 47,856 26,831 56.1 1,658 585 2,243 8.41984…………………… 50,022 28,140 56.3 1,626 490 2,116 7.51985…………………… 51,015 28,893 56.6 1,544 440 1,984 6.91986 ………………… 51,942 29,666 57.1 1,336 408 1,743 5.91987…………………… 52,938 30,474 57.6 1,283 364 1,647 5.41988…………………… 53,912 31,058 57.6 1,066 311 1,377 4.41989…………………… 54,789 31,687 57.8 733 379 1,112 3.5
1990 ………………… 55,553 32,104 57.8 ¹385 ¹712 ¹1,097 ¹3.41991…………………… 54,618 31,639 57.9 ¹1,114 ¹795 ¹1,909 ¹6.01992…………………… 54,826 32,155 58.6 1,231 653 1,885 5.91993…………………… 55,475 32,337 58.3 1,091 573 1,664 5.11994 ………………… 56,570 33,528 59.3 891 674 1,565 4.71995…………………… 57,669 34,420 59.7 796 542 1,338 3.91996…………………… 58,473 34,838 59.6 ¹755 ¹619 ¹1,374 ¹3.91997 ………………… 59,825 35,521 59.4 ¹673 ¹1,147 ¹1,820 ¹5.11998 ………………… 60,973 35,761 58.7 628 1,039 1,667 4.71999 ………………… 61,914 36,073 58.3 446 768 1,214 3.4
2000 ………………… 63,662 36,720 57.7 319 582 901 2.52001…………………… 63,647 36,544 57.4 247 497 744 2.02002…………………… 63,272 36,000 56.9 217 582 799 2.22003 ………………… 63,236 35,853 56.7 213 493 706 2.02004 ………………… 64,145 36,806 57.4 210 470 680 1.82005…………………… 65,466 37,652 57.5 189 459 648 1.72006…………………… 66,811 38,193 57.2 146 422 568 1.52007…………………… 67,468 37,790 56.0 ¹86 ¹460 ¹546 ¹1.42008 ………………… 66,846 37,334 55.9 ¹90 ¹638 ¹728 ¹1.92009 ……………….. 63,539 35,185 55.4 ¹368 ¹990 ¹1,358 ¹3.9
2010…………………… 63,531 35,498 55.9 669 943 1,612 4.52011…………………… 64,686 36,457 56.4 648 785 1,433 3.92012…………………… 65,898 37,113 56.3 567 696 1,263 3.42013…………………… 66,794 37,544 56.2 622 621 1,243 3.3
See footnote at end of table.
Year and genderTotal wageand salary workers Total
Percentage oftotal wageand salary workers
Atprevailing
federalminimum
wage
Belowprevailing
federalminimum
wageNumber
Percentage of hourly paid
workers
BLS Reports │ March 2014 • www.bls.gov 15
C H A R A C T E R I S T I C S O F M I N I M U M WA G E W O R K E R S , 2 0 1 3
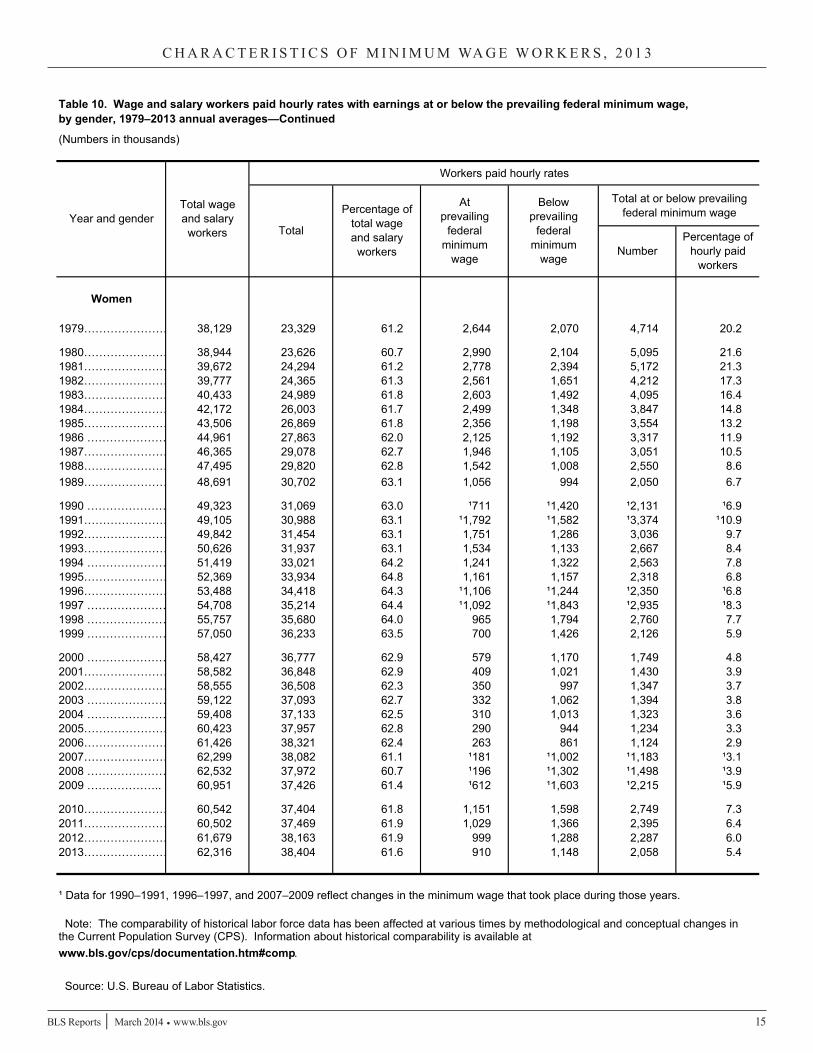
Table 10. Wage and salary workers paid hourly rates with earnings at or below the prevailing federal minimum wage,by gender, 1979–2013 annual averages—Continued
(Numbers in thousands)
Workers paid hourly rates
Total at or below prevailing federal minimum wage
Women
1979…………………… 38,129 23,329 61.2 2,644 2,070 4,714 20.2
1980…………………… 38,944 23,626 60.7 2,990 2,104 5,095 21.61981…………………. 39,672 24,294 61.2 2,778 2,394 5,172 21.31982…………………… 39,777 24,365 61.3 2,561 1,651 4,212 17.31983…………………… 40,433 24,989 61.8 2,603 1,492 4,095 16.41984…………………… 42,172 26,003 61.7 2,499 1,348 3,847 14.81985…………………… 43,506 26,869 61.8 2,356 1,198 3,554 13.21986 ………………… 44,961 27,863 62.0 2,125 1,192 3,317 11.91987…………………… 46,365 29,078 62.7 1,946 1,105 3,051 10.51988…………………… 47,495 29,820 62.8 1,542 1,008 2,550 8.61989…………………… 48,691 30,702 63.1 1,056 994 2,050 6.7
1990 ………………… 49,323 31,069 63.0 ¹711 ¹1,420 ¹2,131 ¹6.91991…………………… 49,105 30,988 63.1 ¹1,792 ¹1,582 ¹3,374 ¹10.91992…………………… 49,842 31,454 63.1 1,751 1,286 3,036 9.71993…………………… 50,626 31,937 63.1 1,534 1,133 2,667 8.41994 ………………… 51,419 33,021 64.2 1,241 1,322 2,563 7.81995…………………… 52,369 33,934 64.8 1,161 1,157 2,318 6.81996…………………… 53,488 34,418 64.3 ¹1,106 ¹1,244 ¹2,350 ¹6.81997 ………………… 54,708 35,214 64.4 ¹1,092 ¹1,843 ¹2,935 ¹8.31998 ………………… 55,757 35,680 64.0 965 1,794 2,760 7.71999 ………………… 57,050 36,233 63.5 700 1,426 2,126 5.9
2000 ………………… 58,427 36,777 62.9 579 1,170 1,749 4.82001…………………… 58,582 36,848 62.9 409 1,021 1,430 3.92002…………………… 58,555 36,508 62.3 350 997 1,347 3.72003 ………………… 59,122 37,093 62.7 332 1,062 1,394 3.82004 ………………… 59,408 37,133 62.5 310 1,013 1,323 3.62005…………………… 60,423 37,957 62.8 290 944 1,234 3.32006…………………… 61,426 38,321 62.4 263 861 1,124 2.92007…………………… 62,299 38,082 61.1 ¹181 ¹1,002 ¹1,183 ¹3.12008 ………………… 62,532 37,972 60.7 ¹196 ¹1,302 ¹1,498 ¹3.92009 ……………….. 60,951 37,426 61.4 ¹612 ¹1,603 ¹2,215 ¹5.9
2010…………………… 60,542 37,404 61.8 1,151 1,598 2,749 7.32011…………………… 60,502 37,469 61.9 1,029 1,366 2,395 6.42012…………………… 61,679 38,163 61.9 999 1,288 2,287 6.02013…………………… 62,316 38,404 61.6 910 1,148 2,058 5.4
¹ Data for 1990–1991, 1996–1997, and 2007–2009 reflect changes in the minimum wage that took place during those years.
Note: The comparability of historical labor force data has been affected at various times by methodological and conceptual changes in the Current Population Survey (CPS). Information about historical comparability is available at www.bls.gov/cps/documentation.htm#comp.
Source: U.S. Bureau of Labor Statistics.
NumberPercentage of
hourly paid workers
Year and genderTotal wageand salary workers Total
Percentage oftotal wageand salary workers
Atprevailing
federalminimum
wage
Belowprevailing
federalminimum
wage
Technical NotesC H A R A C T E R I S T I C S O F M I N I M U M WA G E W O R K E R S , 2 0 1 3
16 BLS Reports │ March 2014 • www.bls.gov
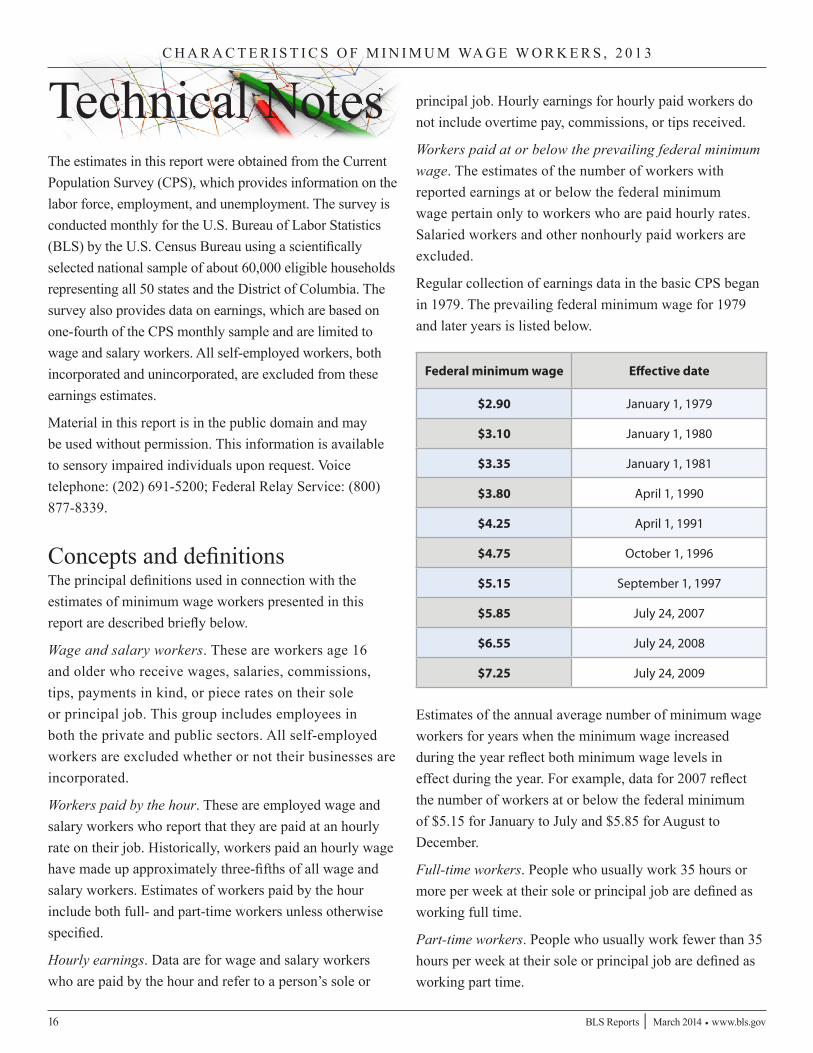
The estimates in this report were obtained from the Current Population Survey (CPS), which provides information on the labor force, employment, and unemployment. The survey is conducted monthly for the U.S. Bureau of Labor Statistics (BLS) by the U.S. Census Bureau using a scientifically selected national sample of about 60,000 eligible households representing all 50 states and the District of Columbia. The survey also provides data on earnings, which are based on one-fourth of the CPS monthly sample and are limited to wage and salary workers. All self-employed workers, both incorporated and unincorporated, are excluded from these earnings estimates.
Material in this report is in the public domain and may be used without permission. This information is available to sensory impaired individuals upon request. Voice telephone: (202) 691-5200; Federal Relay Service: (800) 877-8339.
Concepts and definitionsThe principal definitions used in connection with the estimates of minimum wage workers presented in this report are described briefly below.
Wage and salary workers. These are workers age 16 and older who receive wages, salaries, commissions, tips, payments in kind, or piece rates on their sole or principal job. This group includes employees in both the private and public sectors. All self-employed workers are excluded whether or not their businesses are incorporated.
Workers paid by the hour. These are employed wage and salary workers who report that they are paid at an hourly rate on their job. Historically, workers paid an hourly wage have made up approximately three-fifths of all wage and salary workers. Estimates of workers paid by the hour include both full- and part-time workers unless otherwise specified.
Hourly earnings. Data are for wage and salary workers who are paid by the hour and refer to a person’s sole or
principal job. Hourly earnings for hourly paid workers do not include overtime pay, commissions, or tips received.
Workers paid at or below the prevailing federal minimum wage. The estimates of the number of workers with reported earnings at or below the federal minimum wage pertain only to workers who are paid hourly rates. Salaried workers and other nonhourly paid workers are excluded.
Regular collection of earnings data in the basic CPS began in 1979. The prevailing federal minimum wage for 1979 and later years is listed below.
Federal minimum wage Effective date
$2.90 January 1, 1979
$3.10 January 1, 1980
$3.35 January 1, 1981
$3.80 April 1, 1990
$4.25 April 1, 1991
$4.75 October 1, 1996
$5.15 September 1, 1997
$5.85 July 24, 2007
$6.55 July 24, 2008
$7.25 July 24, 2009
Estimates of the annual average number of minimum wage workers for years when the minimum wage increased during the year reflect both minimum wage levels in effect during the year. For example, data for 2007 reflect the number of workers at or below the federal minimum of $5.15 for January to July and $5.85 for August to December.
Full-time workers. People who usually work 35 hours or more per week at their sole or principal job are defined as working full time.
Part-time workers. People who usually work fewer than 35 hours per week at their sole or principal job are defined as working part time.
BLS Reports │ March 2014 • www.bls.gov 17
C H A R A C T E R I S T I C S O F M I N I M U M WA G E W O R K E R S , 2 0 1 3
Race. In the survey process, race is determined by the household respondent. In accordance with the Office of Management and Budget guidelines, White, Black or African American, Asian, American Indian or Alaska Native, and Native Hawaiian or Other Pacific Islander are terms used to describe a person’s race. The latter two race groups and people who selected more than one race are included in totals but not separately identified in this report because the number of survey respondents is too small to develop estimates of sufficient quality.
Hispanic or Latino ethnicity. This refers to people who identified themselves in the survey process as being of Hispanic, Latino, or Spanish origin. People whose ethnicity is identified as Hispanic or Latino may be of any race.
Interpreting minimum wage dataThe CPS does not include questions on whether workers are covered by the minimum wage provisions of the federal Fair Labor Standards Act (FLSA) or by individual state or local minimum wage laws. The estimates of workers paid at or below the federal minimum wage are based solely on the hourly wage they report (which does not include overtime pay, tips, or commissions). It should be noted that some respondents might round hourly earnings when answering survey questions. As a result, some workers might be reported as having hourly earnings above or below the federal minimum wage when, in fact, they earn the minimum wage.
Some workers reported as earning at or below the prevailing federal minimum wage may not in fact be covered by federal or state minimum wage laws because of exclusions and exemptions in the statutes. Thus, the presence of workers with hourly earnings below the federal minimum wage does not necessarily indicate violations of the FLSA or state statutes in cases where such standards apply.
Estimates of the number of minimum wage workers in this report pertain only to workers who are paid hourly rates. Salaried workers and other workers who are not paid by the hour are excluded, even though some have earnings that, if converted to hourly rates, would be at or below the federal minimum wage. Consequently, the estimates presented in
this report likely understate the actual number of workers with hourly earnings at or below the minimum wage. BLS does not routinely estimate the hourly earnings of workers not paid by the hour because of data quality concerns associated with constructing such an estimate.
A number of states have established minimum wage rates that exceed the federal level. (Information on state minimum wage laws is available at www.dol.gov/whd/minwage/america.htm.) Users should be cautious about comparing state estimates in this report because of differing statutory minimum wages. It also should be noted that the CPS sample is based on residence; workers report their earnings on their job, which may or may not be located in the same state in which they live. In addition, the degree of sampling error may be quite large for some state estimates.
ReliabilityStatistics based on the CPS are subject to both sampling and nonsampling error. When a sample, rather than the entire population, is surveyed, there is a chance that the sample estimates may differ from the true population values they represent. The component of this difference that occurs because samples differ by chance is known as sampling error, and its variability is measured by the standard error of the estimate. There is about a 90-percent chance, or level of confidence, that an estimate based on a sample will differ by no more than 1.6 standard errors from the true population value because of sampling error. BLS analyses are generally conducted at the 90-percent level of confidence.
The CPS data also are affected by nonsampling error. Nonsampling error can occur for many reasons, including the failure to sample a segment of the population, inability to obtain information for all respondents in the sample, inability or unwillingness of respondents to provide correct information, and errors made in the collection or processing of the data. For example, respondents may round their hourly earnings to whole dollars when answering survey questions.
Information about the reliability of data from the CPS is available on the BLS website at www.bls.gov/cps/documentation.htm#reliability.