characteristics of dissolved organic matter in the upper ... · anthropogenic inputs from sewage,...
TRANSCRIPT
U.S. Department of the InteriorU.S. Geological Survey
Open-File Report 2017–1160
Prepared in cooperation with the Bureau of Reclamation
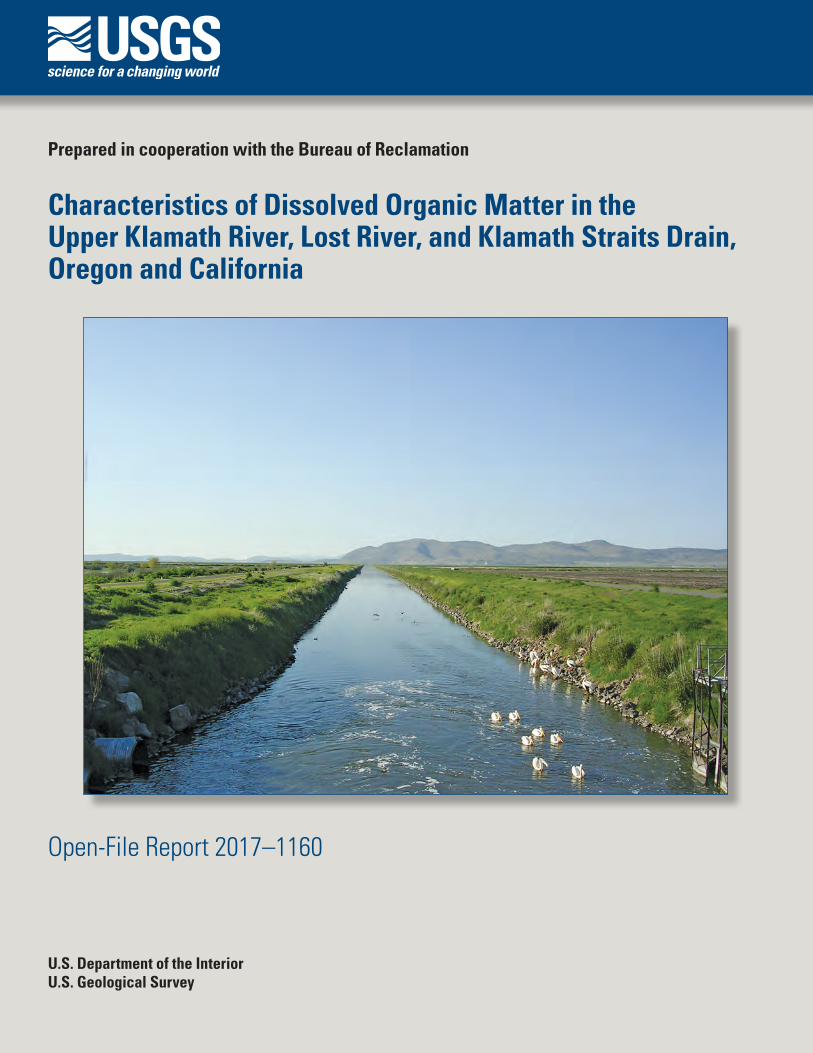
Characteristics of Dissolved Organic Matter in the Upper Klamath River, Lost River, and Klamath Straits Drain, Oregon and California

Cover: Photograph showing Klamath Straits Drain Headworks, looking north, May 25, 2005. Photograph by U.S. Geological Survey.

Characteristics of Dissolved Organic Matter in the Upper Klamath River, Lost River, and Klamath Straits Drain, Oregon and California
By Jami H. Goldman and Annett B. Sullivan
Prepared in cooperation with the Bureau of Reclamation
Open-File Report 2017-1160
U.S. Department of the Interior U.S. Geological Survey
U.S. Department of the Interior RYAN K. ZINKE, Secretary
U.S. Geological Survey William H. Werkheiser, Deputy Director exercising the authority of the Director
U.S. Geological Survey, Reston, Virginia: 2017
For more information on the USGS—the Federal source for science about the Earth, its natural and living resources, natural hazards, and the environment—visit https://www.usgs.gov/ or call 1–888–ASK–USGS (1–888–275–8747).
For an overview of USGS information products, including maps, imagery, and publications, visit https:/store.usgs.gov.
Any use of trade, firm, or product names is for descriptive purposes only and does not imply endorsement by the U.S. Government.
Although this information product, for the most part, is in the public domain, it also may contain copyrighted materials as noted in the text. Permission to reproduce copyrighted items must be secured from the copyright owner.
Suggested citation: Goldman, J.H., and Sullivan, A.B., 2017, Characteristics of dissolved organic matter in the Upper Klamath River, Lost River, and Klamath Straits Drain, Oregon and California: U.S. Geological Survey Open File Report 2017-1160, 21 p., https://doi.org/10.3133/ofr20171160.
ISSN 2331-1258 (online)

iii
Contents Abstract ..................................................................................................................................................................... 1 Introduction ................................................................................................................................................................ 1
Site Description ...................................................................................................................................................... 2 Purpose and Scope ................................................................................................................................................ 6
Methods ..................................................................................................................................................................... 6 Synoptic Samplings ................................................................................................................................................ 6 Sample Preparation and Analyses ......................................................................................................................... 7
Dissolved Organic Carbon, Particulate Carbon and Nitrogen, Dissolved Nitrogen, Chlorophyll a Concentrations ...................................................................................................................... 7
Optical Analysis ................................................................................................................................................. 7 Statistical Analyses ................................................................................................................................................ 8
Parallel Factor Analysis ..................................................................................................................................... 8 Principal Component Analysis ........................................................................................................................... 8
Results and Discussion ............................................................................................................................................. 9 Organic Matter Concentration ................................................................................................................................ 9
fDOM ................................................................................................................................................................10 Dissolved Organic Matter Composition .................................................................................................................13
Specific Ultraviolet Absorbance ........................................................................................................................13 Humification Index ............................................................................................................................................13 Fluorescence Index ...........................................................................................................................................13
Parallel Factor Analysis Results ............................................................................................................................14 Principal Component Analysis Results ..................................................................................................................14
Conclusions and Implications for Monitoring and Management ................................................................................17 Acknowledgments .....................................................................................................................................................18 References Cited ......................................................................................................................................................18
Figures Figure 1. Map showing sampling site locations in the Upper Klamath River, Lost River, and Klamath Straits Drain, south-central Oregon and northern California ...................................................................................... 3 Figure 2. Graphs showing average dissolved and particulate organic carbon (top) and dissolved and particulate nitrogen (bottom) concentrations per study site in the Upper Klamath River, Lost River, and Klamath Straits Drain, south-central Oregon and northern California ........................................................................ 9 Figure 3. Boxplots showing concentrations and optical characteristics of dissolved organic matter for study sites in the Upper Klamath River, Lost River, and Klamath Straits Drain, south-central Oregon and northern California ................................................................................................................................................... 11 Figure 4. Graphs showing fluorescent dissolved organic matter (fDOM) and dissolved organic carbon (DOC) for all sampling sites throughout the sampling period (top) and for all sites except site PPD (bottom), in the Upper Klamath River, Lost River, and Klamath Straits Drain, south-central Oregon and northern California ................................................................................................................................................... 12 Figure 5. Graphs showing principal component analysis loadings (top) and scores (bottom) using %C1-%C5, the humification index (HIX), and fluorescence index (FI) ........................................................... 16
iv
Tables Table 1. Names and description of sampling sites in the Upper Klamath River, Lost River, and Klamath Straits Drain, south-central Oregon and northern California. ....................................................................... 5 Table 2. Parallel factor analysis (PARAFAC) components and description, likely sources and correlation to dissolved organic carbon (DOC) concentrations and three-dimensional excitation-emission matrixes of each of the components. ......................................................................................................................................... 15
Conversion Factors International System of Units to Inch/Pound
Multiply By To obtain
Length nanometer (nm) 0.000000039 inch (in)
meter (m) 3.281 foot (ft)
kilometer (km) 0.6214 mile (mi)
Volume liter (L) 33.82 ounce, fluid (fl. oz)
liter (L) 0.2642 gallon (gal)
liter (L) 61.02 cubic inch (in3)
Flow rate
meter per second (m/s) 3.281 foot per second (ft/s)
Mass
gram (g) 0.03527 ounce, avoirdupois (oz)
kilogram (kg) 2.205 pound avoirdupois (lb)
Temperature in degrees Celsius (°C) may be converted to degrees Fahrenheit (°F) as °F = (1.8 × °C) + 32.
Supplemental Information Concentrations of chemical constituents in water are given in either milligrams per liter (mg/L) or micrograms per liter (µg/L).
Abbreviations BOD biochemical oxygen demand OM organic matter
DN dissolved nitrogen PARAFAC parallel factor analysis
DOC dissolved organic carbon PCA principal component analysis
DOM dissolved organic matter PN particulate nitrogen
fDOM fluorescent dissolved organic matter POC particulate organic carbon
EEM excitation-emission matrix RU raman units
FI fluorescence index SUVA specific ultraviolet b b
HIX humification index USGS U.S. Geological Survey
1
Characteristics of Dissolved Organic Matter in the Upper Klamath River, Lost River, and Klamath Straits Drain, Oregon and California
By Jami H. Goldman and Annett B. Sullivan
Abstract Concentrations of particulate organic carbon (POC) and dissolved organic carbon (DOC),
which together comprise total organic carbon, were measured in this reconnaissance study at sampling sites in the Upper Klamath River, Lost River, and Klamath Straits Drain in 2013–16. Optical absorbance and fluorescence properties of dissolved organic matter (DOM), which contains DOC, also were analyzed. Parallel factor analysis was used to decompose the optical fluorescence data into five key components for all samples. Principal component analysis (PCA) was used to investigate differences in DOM source and processing among sites.
At all sites in this study, average DOC concentrations were higher than average POC concentrations. The highest DOC concentrations were at sites in the Klamath Straits Drain and at Pump Plant D. Evaluation of optical properties indicated that Klamath Straits Drain DOM had a refractory, terrestrial source, likely extracted from the interaction of this water with wetland peats and irrigated soils. Pump Plant D DOM exhibited more labile characteristics, which could, for instance, indicate contributions from algal or microbial exudates. The samples from Klamath River also had more microbial or algal derived material, as indicated by PCA analysis of the optical properties. Most sites, except Pump Plant D, showed a linear relation between fluorescent dissolved organic matter (fDOM) and DOC concentration, indicating these measurements are highly correlated (R2=0.84), and thus a continuous fDOM probe could be used to estimate DOC loads from these sites.
Introduction Organic matter (OM) is found in all aquatic ecosystems (Battin and others, 2009). Typical
sources of organic matter include decaying plants, exudates from animals, algae, bacteria, and anthropogenic inputs from sewage, agriculture, and urban landscapes. Although OM has an essential role in ecosystem food webs and biogeochemical processing, OM decay can consume dissolved oxygen, an essential component of ecosystem health, leading to increased biochemical oxygen demand (BOD). Most natural OM also contains nitrogen and phosphorus, elements which are often targeted in nutrient-reduction plans.
Natural OM is a complex heterogeneous mixture of organic material. In the water column, OM is initially partitioned between operationally defined groups–particulate organic matter (POM) and dissolved organic matter (DOM). POM is retained on filters (about 0.7 µm pore-size), and DOM passes through those filters. POM and DOM are typically assessed by measuring concentrations of particulate organic carbon (POC) and dissolved organic carbon (DOC).

2
Humic substances make up 40–60 percent of DOC in natural waters (Beck and others, 1993) and contain aromatic (that is, high molecular weight, refractory) and aliphatic (low molecular weight, labile) components with various other functional groups, such as carboxylic acids, phenols, and amino acids. Humic substances can be further divided into humic acids, fulvic acids, and humin, based on solubility at various pH levels. Humic acids tend to have higher molecular weight and a higher hydrophobicity relative to fulvic acids and humin (Leenheer and Croue, 2003). Aquatic fulvic acids are more soluble, lower in oxygen and carbon content, and tend to have lower molecular weight than humic acids (Stevenson, 1982). The composition of DOM is highly variable and dependent on its precursor source material (for example, plants, soils, algae).
Absorbance and fluorescence spectroscopy are relatively inexpensive and rapid whole-water methods that provide information about quantity, characteristics, and sources of the DOM pool, such as the amount of humic and fulvic acids, protein-like material, and phytoplankton-derived material (Coble, 1996, 2007; McKnight and others, 2001; Stedmon and others, 2003; Hudson and others, 2007; Downing and others, 2009). Absorbance data can provide information about the chemical composition of the DOM pool (Weishaar and others, 2013). The response at a single wavelength is related to DOM concentration while the slope between two wavelengths or the ratios between them provides information about the composition of the DOM. For example, absorbance at 254 nanometers (nm) has been used in the drinking water industry as a proxy for DOC concentration for several decades (Weishaar and others, 2013). Fluorescence spectroscopy targets the subset of DOM that not only absorbs light energy, but also re-emits it at a longer wavelength (Murphy and others, 2010). Fluorescence intensity, reported in Raman units (RU), is measured across a range of excitation and emission wavelengths, thus creating an excitation-emission matrix (EEM). Similar to absorbance, the fluorescence peak intensity at a single excitation-emission pair is related to DOM concentration; however, changes in ratios of peak intensities or across wavelength ranges provide information related to the character and composition of DOM.
Site Description The Upper Klamath River, Klamath Straits Drain, and Lost River are adjacent, interconnected
waterbodies in south-central Oregon and northern California (fig. 1). The Lost River and Klamath Straits Drain are part of the Bureau of Reclamation Klamath Project, which supports agriculture by managing water delivery through these areas. The Upper Klamath River is a source of water to the Klamath Project, and also receives drainage from the Klamath Project. In addition to agriculture, these basins provide habitat for migrating birds and endangered fish species like the Lost River sucker (Deltistes luxatus) and shortnose sucker (Chasmistes brevirostris) (National Marine Fisheries Service and U.S. Fish and Wildlife Service, 2013) and are areas for recreation. In turn, the Upper Klamath River is the primary source of water to downstream reaches, including Klamath hydropower dams and reservoirs, and therefore exerts strong influence on water quality and associated processes in those reaches.

3
Figure 1. Map showing sampling site locations in the Upper Klamath River, Lost River, and Klamath Straits Drain, south-central Oregon and northern California. Site names and information are shown in table 1.

4
The Upper Klamath River is downstream of Upper Klamath Lake (fig. 1) and flows approximately 255 mi south and east to the Pacific Ocean. The part of the Klamath River included in this study includes the most upstream section, from the outflow of Upper Klamath Lake (site FMT) to the outflow of Keno Dam (site KRK), approximately 20 mi downstream (fig. 1, table 1). Three water withdrawals along this reach (sampling sites LRDC, NC, ADC97) also were sampled; these withdrawals bring Klamath River water to irrigated land near the Lost River and Klamath Straits Drain. The Lost River Diversion Channel (site LRDC) is a withdrawal in summer, bringing irrigation water to the Lost River; the flow direction switches in winter as water is drained from the Lost River into the Klamath River.
The Lost River basin lies to the east of the Klamath River (fig. 1), with its headwaters in Clear Lake. This study’s most upstream Lost River site (LRBM) was 11 mi downstream of Clear Lake. The Lost River flows to the confluence where Miller Creek (site MCRV) enters the Lost River, with water sourced from Gerber Reservoir. Then the Lost River turns west, passing through Harpold Dam (site LRBH), and south, passing by site LREW and then discharging into Tule Lake. A canal brings water from the outflow of Upper Klamath Lake into the Lost River between sampling sites LRBH and LREW, in summer. Tule Lake historically was the terminus for the Lost River, but a tunnel was constructed around 1940 at the western end of Tule Lake (near site PPD) that allows water to be occasionally pumped into the Lower Klamath National Wildlife Refuge. Water from the Refuge is released into the Klamath Straits Drain at site KSDH during some times of the year. Klamath Straits Drain is a 10-mile-long canal that also receives return flows from agricultural lands as it flows northward passing through sampling sites KST and KSD97, eventually discharging into the Klamath River.
Water quality in various parts of the Upper Klamath and Lost Rivers has been listed as impaired for constituents such as dissolved oxygen, pH, chlorophyll a, water temperature, arsenic, E Coli, and ammonia toxicity. A part of the water quality issues in the Upper Klamath River in summer is caused by death and decomposition of Aphanizomenon flos-aquae blooms imported from Upper Klamath Lake (Sullivan and others, 2011; Sullivan, Rounds, and others, 2013, Sullivan, Sogutlugil, and others, 2013). Additionally, an upper Klamath River TMDL (Oregon Department of Environmental Quality, 2017) requires greater than 80-percent reductions in total nitrogen, total phosphorus, and 5-day biochemical oxygen demand (BOD5) for the Lost River Diversion Channel and Klamath Straits Drain. The Lost River TMDL requires 50-percent reductions in dissolved inorganic nitrogen and carbonaceous biochemical oxygen demand (CBOD) and requires dissolved oxygen increases for impoundments (U.S. Environmental Protection Agency, 2008; Oregon Department of Environmental Quality, 2017).
Considerations of OM are important in these TMDL load reductions, since OM contains nitrogen and phosphorus, and OM decay affects dissolved oxygen and BOD5 by consuming oxygen. OM also affects downstream reaches of the Klamath River in a number of ways, for example, by transporting nutrients and carbon downstream into the highly productive reservoirs of the Klamath hydropower dams. Similarly, numerous restoration efforts are planned for different regions of the watershed upstream of the Klamath River, with objectives that often include nutrient and OM loading reductions. Therefore, having a better understanding of OM quality and OM sources within and exiting the upper Klamath River is expected to provide important insights into management of the Klamath River’s water quality.
5
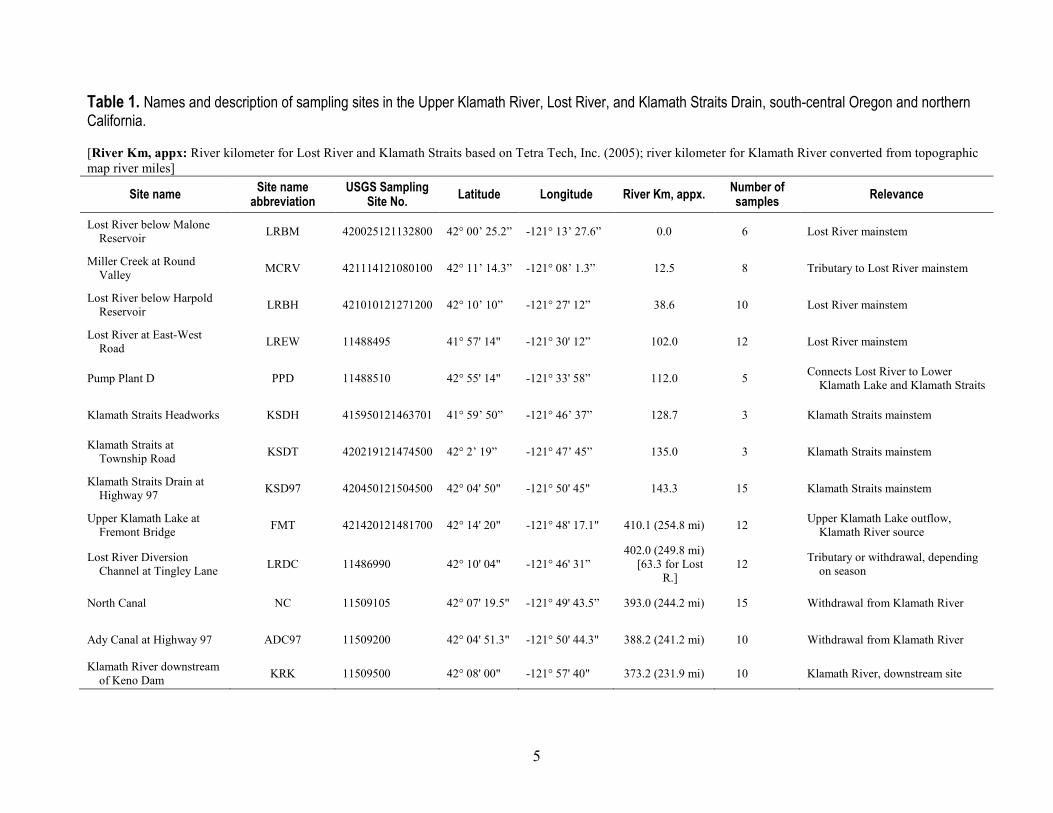
Table 1. Names and description of sampling sites in the Upper Klamath River, Lost River, and Klamath Straits Drain, south-central Oregon and northern California. [River Km, appx: River kilometer for Lost River and Klamath Straits based on Tetra Tech, Inc. (2005); river kilometer for Klamath River converted from topographic map river miles]
Site name Site name abbreviation
USGS Sampling Site No. Latitude Longitude River Km, appx. Number of
samples Relevance
Lost River below Malone Reservoir LRBM 420025121132800 42° 00’ 25.2” -121° 13’ 27.6” 0.0 6 Lost River mainstem
Miller Creek at Round Valley MCRV 421114121080100 42° 11’ 14.3” -121° 08’ 1.3” 12.5 8 Tributary to Lost River mainstem
Lost River below Harpold Reservoir LRBH 421010121271200 42° 10’ 10” -121° 27' 12” 38.6 10 Lost River mainstem
Lost River at East-West Road LREW 11488495 41° 57' 14" -121° 30' 12” 102.0 12 Lost River mainstem
Pump Plant D PPD 11488510 42° 55' 14" -121° 33' 58” 112.0 5 Connects Lost River to Lower Klamath Lake and Klamath Straits
Klamath Straits Headworks KSDH 415950121463701 41° 59’ 50” -121° 46’ 37” 128.7 3 Klamath Straits mainstem
Klamath Straits at Township Road KSDT 420219121474500 42° 2’ 19” -121° 47’ 45” 135.0 3 Klamath Straits mainstem
Klamath Straits Drain at Highway 97 KSD97 420450121504500 42° 04' 50" -121° 50' 45" 143.3 15 Klamath Straits mainstem
Upper Klamath Lake at Fremont Bridge FMT 421420121481700 42° 14' 20" -121° 48' 17.1" 410.1 (254.8 mi) 12 Upper Klamath Lake outflow,
Klamath River source
Lost River Diversion Channel at Tingley Lane LRDC 11486990 42° 10' 04" -121° 46' 31”
402.0 (249.8 mi) [63.3 for Lost
R.] 12 Tributary or withdrawal, depending
on season
North Canal NC 11509105 42° 07' 19.5" -121° 49' 43.5” 393.0 (244.2 mi) 15 Withdrawal from Klamath River
Ady Canal at Highway 97 ADC97 11509200 42° 04' 51.3" -121° 50' 44.3" 388.2 (241.2 mi) 10 Withdrawal from Klamath River
Klamath River downstream of Keno Dam KRK 11509500 42° 08' 00" -121° 57' 40" 373.2 (231.9 mi) 10 Klamath River, downstream site

6
Purpose and Scope This was a reconnaissance effort to gain insight into the character and sources of OM in three
waterbodies of the Upper Klamath Basin: Lost River, Klamath River, and Klamath Straits Drain. Concentrations of POC and DOC were measured, and optical absorbance and fluorescence spectroscopy was used to identify and characterize DOM source and processing. This study was performed as part of a long-term scientific collaboration between the U.S. Geological Survey and Bureau of Reclamation.
Sampling for this study was conducted in conjunction with larger basin studies. One such study was designed to determine water quality constituent loads in the Klamath River, Lost River, Klamath Straits Drain, Lost River Diversion Channel, and some canal sites with fieldwork occurring from March 2012 through February 2015). Organic carbon sampling for that study was conducted for 2 of the 3 study years (April 2013–February 2015). Additional sampling that began in February 2016 was designed to document baseline water-quality conditions in the Klamath Straits Drain prior to restoration work; optical properties of DOM were analyzed from February 2016 through May 2016.
Methods Synoptic Samplings
At most sampling sites, dissolved organic carbon (DOC) and particulate carbon and nitrogen samples were collected approximately every 8 weeks from April 2013 through February 2015. DOC is the largest component of DOM and thus is often used as a proxy for DOM. Samples for total nitrogen and chlorophyll a were also collected during the sample events. Dissolved nitrogen was estimated by subtracting particulate nitrogen from total nitrogen. Sampling schedules were calendar-based, rather than targeting particular hydrologic conditions. A subset of sites, including KSD97, ADC97, and NC were sampled approximately monthly from February 2016 through May 2016. Site KSDT was sampled from March through May 2016. When a site was non-flowing, samples were not collected; thus the total number of samples collected differs between sites (table 1).
Grab samples were collected at most sites from February to May 2016. For sites sampled for the water-quality loading study from April 2013 to February 2015, sample collection followed established USGS sampling protocols (U.S. Geological Survey, variously dated). When flows at the sampling sites exceeded 0.46 m/s (1.5 ft/s), samples were collected using the equal-width-increment (EWI) method as described in the USGS Field Manual (U.S. Geological Survey, 2006). The EWI method results in a composite sample that represents the streamflow-weighted concentration of analytes in the stream cross section being sampled. Samples were collected as grab samples when flows were less than 0.46 m/s (1.5 ft/s). These grab samples were collected in an open container, a DH-81 water-quality sampler, or a DH-95 water-quality sampler, without a nozzle and from a single point in the stream cross section. Where possible, grab samples were collected from several locations across the channel (U.S. Geological Survey, 2006) and combined into one representative sample. Sample data can be accessed at the USGS National Water Information System (U.S. Geological Survey, 2017) and in Goldman (2017).

7
Sample Preparation and Analyses
Dissolved Organic Carbon, Particulate Carbon and Nitrogen, Dissolved Nitrogen, Chlorophyll a Concentrations
Samples were prepared according to the U.S. Geological Survey National Field Manual (U.S. Geological Survey, variously dated). DOC samples were filtered with glass fiber filters (nominal 0.7 µm pore size, pre-combusted at 450 °C) using a TeflonTM filtration unit. Filtrate was collected into pre-combusted 125 mL glass amber bottles, acidified with 1 mL of 4.5N sulfuric acid and analyzed using persulfate oxidation methods described by Brenton and Arnett (1993). Particulate material was collected on the glass fiber filters and analyzed for particulate carbon and nitrogen by combusting particles in pure oxygen at 975 °C (Zimmerman and others, 1997). Total nitrogen in water was determined by alkaline persulfate digestion (Patton and Kryskalla, 2003). Particulate material for chlorophyll a analysis was collected on glass fiber filters, frozen until analysis, and analyzed by spectrophotometry using Standard Method 10200 H. Samples for DOC, particulate carbon and nitrogen, and total nitrogen were analyzed at the USGS National Water Quality Laboratory in Denver, Colorado. Samples for chlorophyll a were analyzed at the Bureau of Reclamation Laboratory in Boise, Idaho.
Optical Analysis Sample filtrate for optical analysis was collected into pre-combusted 40 mL glass amber bottles
and stored in the dark at 4°C. All samples were analyzed within 5 days of collection. Fluorescence EEM and absorbance spectra were measured simultaneously using a benchtop fluorometer (Aqualog®; Horiba Instruments, New Jersey). EEMs were constructed using excitation (ex) wavelengths of 240–600 nm at intervals of 3 nm and emission (em) wavelengths of 200 to 620 nm at intervals of 3.2 nm, with an integration time of 1 second and a charge-coupled device set to medium gain. Absorbance spectra were collected at wavelengths ranging from 240 to 600 nm at intervals of 3 nm.
Several standard corrections and normalizations were applied to the EEM data, including instrument-specific response correction and blank-correction against a Starna 3Q-10 Raman response. UV-visible absorption data were used to correct for fluorescence inner filter effects. Lastly, the EEM was normalized to the area under the water-Raman curve at an excitation wavelength of 350 nm converting the arbitrary units to Raman units (Stedmon and others, 2003; Murphy and others, 2010). The corrected EEMs then were imported into MATLAB® (version R2015.b) for further analysis, including removing interference from Raleigh scattering, trimming and interpolating the region of the EEM not affected by scattering and/or particles, converting the data into vectors, selecting characteristic peak signals (for example, SUVA, fDOM) and ratios (HIX, FI) for further analysis based on documented literature (Coble, 2007; Hudson and others, 2007; Stedmon and Bro, 2008), and plotting the data into contour and surface maps. Four descriptors were derived from optical absorbance and fluorescence measurements:
(1) Specific ultraviolet absorbance (SUVA): Specific ultraviolet absorbance at 254 nm divided by DOC concentration (Weishaar and others, 2003).
(2) Fluorescent dissolved organic matter (fDOM): The fraction of DOM that emits a fluorescent signal, measured at ex370 em460.
(3) Humification index (HIX): Ratio of the emission intensity in the 435–480 nm region to the emission intensity in the 300–345 nm region, with an excitation at 254 nm (Ohno, 2002).
(4) Fluorescence index (FI): The ratio of emission wavelengths at 470 and 520 nm obtained at excitation 370 nm.

8
Statistical Analyses
Parallel Factor Analysis Parallel factor analysis (PARAFAC) was used to decompose the fluorescence signatures in the
corrected EEMs into unique components that contain information about the characteristics of the DOM pool (Bro, 1997). PARAFAC is a multi-way statistical analysis that deconvolves absorption and emission spectra into orthogonal fluorophore groups (components) and determines loadings for each component that are proportional to their concentration. Component percentages can be calculated by dividing each component loading by the sum of the component loadings to reveal qualitative differences between samples (Andersson and Bro, 2000). Procedures established by Stedmon and Bro (2008) were used to develop a PARAFAC model for the Lost River samples using the N-way toolbox, version 6.1 (Bro, 1997; Andersson and Bro, 2000) and the drEEM toolbox, version 0.1.0 (Murphy and others, 2013) with MATLAB® (version R2015.b). The model included a non-negative constraint to help alleviate issues with higher relative instrument noise in samples having low fluorescence. Additionally, the data were normalized to the unit variance to alleviate collinearity. The PARAFAC model was validated using a combination of outlier identification, residual analysis, component validation, and replication by split-half analysis (Stedmon and Bro, 2008; Murphy and others, 2013).
Principal Component Analysis Pattern identification in the dataset was aided through the use of principal component analysis
(PCA). PCA is a data compression method that transforms a number of variables into a smaller number of uncorrelated variables called principal components. The first principal component accounts for most of the variability in the data, and each component thereafter accounts for as much of the remaining variability as possible. PCA was conducted using a covariance matrix with The Unscrambler X, version 10.2 (Camo Software, Inc.), and used to analyze the variance in the synoptic sample dataset. PCA was explored using all the optical properties and other ancillary data, including chlorophyll a and nutrients. Key variables included in the final analysis were PARAFAC percent component loadings (components C1–C5) and fluorescence variables (HIX and FI). PCA scores were computed and graphically represented by plotting the first principal component against the second.

9
Results and Discussion Organic Matter Concentration
DOM made up most of the total OM at these sites, ranging from 53 to 90 percent of average total OM between sites (fig. 2). There was additional OM in particulate form, which made up a smaller part of the total. This is consistent with studies in other systems; for instance, Kraus and others (2010) and Carpenter and others (2013) reported most organic carbon in their studies to be in the dissolved fraction. Similarly, more nitrogen was in dissolved form (52–89 percent) in this study compared to the particulate phase (fig. 2). This dissolved nitrogen included both organic forms and inorganic forms such as nitrate and ammonia.
Figure 2. Graphs showing average dissolved and particulate organic carbon (top) and dissolved and particulate nitrogen (bottom) concentrations per study site in the Upper Klamath River, Lost River, and Klamath Straits Drain, south-central Oregon and northern California. Dissolved values for organic carbon and nitrogen were determined by subtracting measured particulate values from whole water (total) values. The carbon values are limited to organic forms, while nitrogen values include both inorganic and organic forms. Values above each bar represent total concentrations (particulate + dissolved). Site names and information are shown in table 1.

10
DOC concentrations at Klamath River sites averaged 5–7 mg/L, and ranged from 3 to 12 mg/L (fig. 3). DOC concentrations were similar at Lost River sites upstream of Tule Lake, with averages of 6–8 mg/L and a range from 2 to 11 mg/L. DOC concentrations were higher at Pump Plant D at Tule Lake outflow, than at other Lost River and all Klamath River sites, with an average of 22 mg/L and with a range from 20 to 23 mg/L. DOC concentrations also was higher at Klamath Straits Drain sites, with an average of 18–24 mg/L and with a range from 9 to 37 mg/L.
POC concentrations at Klamath River sites averaged 2–5 mg/L, with a range from 1 to 17 mg/L (fig. 2). The POC sample collected at site FMT at the outflow of Upper Klamath Lake in late June when algal blooms often peak in Upper Klamath Lake was 17 mg/L; chlorophyll a was also elevated on that date at 216 µg/L. POC concentrations were relatively low at Lost River sites upstream of Tule Lake, with averages of 1–3 mg/L, and with a range from 0.4 to 11 mg/L. The sample collected at site LREW with 11 mg/L of POC had coincident elevated chlorophyll a concentration of 156 µg/L. POC concentrations at Pump Plant D averaged 7 mg/L, with a range from 1 to 14 mg/L. The sample with 14 mg/L POC had elevated chlorophyll a of 228 µg/L. POC concentrations at Klamath Straits Drain sites averaged 3–7 mg/L, with a range from 1 to 11 mg/L. The sample collected at site KSD97 with 11 mg/L of POC did not have elevated chlorophyll a associated with it, although a sample collected at site KSDT with 8 mg/L of POC did have elevated chlorophyll a, at 212 µg/L.
fDOM The fDOM signal was correlated to DOC concentration, at all sampling sites and for all sample
dates (fig. 4). Samples at site PPD appear to have a different fDOM to DOC relation compared to the other sites (fig. 4, top), so they were removed (fig. 4, bottom), which produced an improved fit. The linear relationship has scatter beyond about 20 mg/L DOC. In the future, this analysis might benefit from a multivariate regression including turbidity to account for colloidal suspended sediment or other material that could affect light scattering at higher concentrations (Downing and others, 2009).
Although this study focused on grab samples, advances in optical sensor technology have made it possible to use in-situ fluorometers to quantify DOM concentration and composition. Specifically, fDOM can be measured continuously (hourly, for example) and used as a reliable proxy for concentrations of DOC, with the addition of other signals such as turbidity. fDOM also can be used to estimate POC and TOC concentrations (Bergamaschi and others, 2005, 2012; Spencer and others, 2007; Saraceno and others, 2009; Pellerin and others, 2012).

11
Figure 3. Boxplots showing concentrations and optical characteristics of dissolved organic matter for study sites in the Upper Klamath River, Lost River, and Klamath Straits Drain, south-central Oregon and northern California. The number of samples (n) at each site is noted.

12
Figure 4. Graphs showing fluorescent dissolved organic matter (fDOM) and dissolved organic carbon (DOC) for all sampling sites throughout the sampling period (top) and for all sites except site PPD (bottom), in the Upper Klamath River, Lost River, and Klamath Straits Drain, south-central Oregon and northern California. Site names and descriptions shown in table 1.

13
Dissolved Organic Matter Composition
Specific Ultraviolet Absorbance SUVA is defined as UV absorbance at 254 nm, divided by DOC concentration. It indicates the
nature of DOC in water and has been used as a surrogate measurement of DOM aromaticity and molecular weight (Weishaar and others, 2003), with higher numbers associated with greater aromatic content. Loss of labile DOC (Pinney and others, 2000) and increasing age of source plant litter material (Fellman and others, 2013) has been shown to result in increased SUVA. Wetland DOC has been found to have elevated SUVA (Agren and others, 2008).
SUVA values in Klamath River samples averaged 3.2–3.6 L/mg-m, with a range of 2.3–4.4 L/mg-m (fig. 3). SUVA values in Klamath Straits Drain samples were similar and averaged 3.0–3.4 L/mg-m, with a range of 2.4–3.6 L/mg-m.
SUVA in Lost River samples had a wider range of values. SUVA values at Pump Plant D averaged 2.1, the lowest of any site. This could indicate some contribution from of algal derived DOC, and this site did have chlorophyll a values that ranged up to 247 µg/L (fig. 3). SUVA values were high at Malone Dam and Miller Creek sites, averaging 5.6 and 9.6 L/mg-m, respectively. It is unclear whether these elevated SUVA values indicate terrestrial material or whether values were affected by interference by iron or colloidal particles.
Humification Index The HIX is an indicator of the degree of humification, the process by which dead OM (leaves,
branches, algae, etc.) decomposes to form humus. Lower values indicate DOM sourced from labile material such as animal manure or algal exudates. Higher values indicate an increasing degree of humification (Ohno, 2002).
The high HIX values at the Klamath Straits sites (fig. 3), with average values ranging from 7.5 to 10.6, are indicative of older, highly decomposed, humified material likely the result of terrestrial material that has undergone microbial processing. The low values from some Klamath River sites and Pump Plant D are indicative of fresher, more labile organic material (for example, decomposition products of an algal bloom). Other Klamath River and Lost River sites exhibited mid-range HIX values.
Fluorescence Index The fluorescence index (FI) describes the relative contribution of terrestrial or microbial
sources of OM. FI values typically range from 1.3 to 1.9. Low values are typically associated with terrestrially derived material, such as plant and soil matter, and high values are associated with microbial sources, such as release from bacterial and algal cells (McKnight and others, 2001; Cory and McKnight, 2005).
Fluorescence indices at sampling sites in this study averaged 1.20 to 1.35, with a total range of 1.11–1.38 (fig. 3) showing small variation between sites. The highest average FI values were at Pump Plant D (1.35) and lowest at Klamath Straits Drain Township Road (1.20) (fig. 3).

14
Parallel Factor Analysis Results A five-component PARAFAC model applied to the full set of synoptic EEMs resulted in a
good fit (≥90 percent or greater) between the measured and modeled EEMs. The five modeled PARAFAC components were drawn from previously documented PARAFAC results that have been associated with different OM pools and compared with modeled compounds (table 2) (McKnight and others, 2001; Stedmon and others, 2003; Coble, 2007; Hudson and others, 2007; Stedmon and Bro, 2008; Cory and others, 2010). Component 1 (C1) is correlated strongly DOC concentration in this study. It is primarily a terrestrial, humic-like derived organic material but is more labile than C2, C3, and C4, which are also terrestrially derived OMs. C1 likely represents DOM that has undergone alteration by microbial processes resulting in DOM that is more labile and available to the system. C2, C3, and C4 are all similarly correlated to DOC and represent semi-labile material. C5 represents more algal/microbial derived OM and is the lowest predictor of DOC of all components. This component has been shown to be associated with fresh organic material and resembles amino acid protein-like material. On average, most sample sites consisted of 25–30 percent C1 and C2, 20–25 percent C3, 10–12 percent C4, and 5–12 percent C5. There are subtle variations seasonally and spatially. However on average, there were lower amounts of C5, the microbial/algal material, at the Klamath Straits sites and relatively more of the terrestrially derived materials C1-C4 at those sites.
Principal Component Analysis Results Principal component analysis (PCA) was used to further analyze the data and explore patterns
that may help explain the sources and composition of OM. Many potential inputs to PCA models were examined. The final model that explained the most variance (90 percent) and was most useful in illustrating spatial variability in the data contained the following as inputs: all PARAFAC component loading percentages, FI, and HIX (fig. 5, top graph). The PCA scores plot shows vertical and horizontal separation based on sample locations (fig. 5, bottom graph), which we attribute to differences in DOM composition and source material. The Klamath River sites are in the lower right quadrant, which is more representative of the microbial or algal derived OM. The Lost River samples are primarily center and positive on the PC2 gradient which is more representative of C1, terrestrial material that is more labile and possibly microbially processed. Most of the Klamath Straits sites are around the left quadrant and negative PC1 are representative of terrestrially derived semi-labile OM. Pump D separated itself from all samples showing that it has very distinctively different quality than most of these samples. Variations within this plot can be due to seasonal cycling also.

15
Table 2. Parallel factor analysis (PARAFAC) components and description, likely sources and correlation to dissolved organic carbon (DOC) concentrations and three-dimensional excitation-emission matrixes of each of the components. [Description: Likely sources, and correlation to DOC concentrations are from McKnight and others (2001), Stedmon and others (2003), Coble (2007), Hudson and others (2007), Stedmon and Bro (2008), and Cory and others (2010). The predictor R2 values are derived from this study’s data]
PARAFAC component Excitation/emission Description Probable source Peaks DOC predictor
R2 C1 310/422 Correlated to DOC, possibly altered by microbial
processing, labile Terrestrial humic-like
substance A, C, and M 0.81
C2 260(370)/472 Correlated to DOC less aromatic and semi-labile Terrestrial humic-like substance
A and C (FDOM range) 0.74
C3 265/464 Correlated to DOC, less aromatic and semi-labile Terrestrial and humic-like substance
A 0.73
C4 300/522 Correlated to DOC less aromatic and semi-labile Terrestrial humic-like substance
A,C, and D 0.68
C5 270/308(328)(512) Less aromatic, more labile, fresher material-microbially processed OM
Amino acids, free or bound in proteins
B and T 0.55

16
Figure 5. Graphs showing principal component analysis loadings (top) and scores (bottom) using %C1-%C5, the humification index (HIX), and fluorescence index (FI). Plotting PC1 versus PC2 explains 90 percent of the variance in the dataset. Colors in the bottom graph represent different basins and the PPD site in the Upper Klamath River, Lost River, and Klamath Straits Drain, south-central Oregon and northern California.

17
Conclusions and Implications for Monitoring and Management This reconnaissance study surveyed POC and DOC and the optical properties of DOM at 13
sampling sites in the Upper Klamath River, Lost River, and Klamath Straits Drain in 2012–15. There were two areas with high concentrations of DOC—Pump Plant D and Klamath Straits Drain; each with different DOM character. The results at Pump Plant D at the outflow of Tule Lake show the large change in OM concentration and lability that occurs between the Lost River inflow to Tule Lake and the Tule Lake outflow. This change could be due to several factors, such as (a) algal blooms in Tule Lake, (b) evaporation (and thus concentration) of water within Tule Lake, (c) recycling of water through irrigated lands around Tule Lake (Pischel and Gannett, 2015), and (d) introduction of OM by wildfowl (for example, Manny and others, 1994; David Evans and Associates, Inc., 2000) in the Tule Lake National Wildlife Refuge.
Historically, the outflow of water at Tule Lake was an important inflow into Lower Klamath National Wildlife Refuge and then into Klamath Straits Drain by pumping water through Pump Plant D. However, recent pumping cost increases have led to decreased pumping of Tule Lake water through that pump plant. Instead, Klamath River water (through Ady and North Canal withdrawals) has become an increasingly important source of water to the Klamath Straits Drain area. The high concentrations of DOC in Klamath Straits Drain represent an increase in OM concentration as Klamath River water is cycled through the Klamath Straits Drain area. Ady and North Canal DOC averaged 7 mg/L, and the Klamath Straits Drain sites averaged 18–24 mg/L.
Optical properties indicate that the DOM from the Klamath Straits Drain sites is characterized by high molecular weight material, suggesting that the water likely has strong interactions with the peat soils in the wetlands and irrigated Klamath Project farm lands surrounding and upstream of the Drain. Highly humified OM is indicative of material that has been processed or decomposed and now is highly refractory. While it does contain and thus transport nitrogen and phosphorus, as well as carbon, it tends to have lower BOD over the short-term as compared to fresher material such as algae and algal exudates. Long-term BOD experiments of Klamath Straits Drain water did show slow oxygen demand rates expressed over long-periods (Sullivan and others, 2010). The highly humified nature of the OM in Klamath Straits Drain samples is also in contrast to the more algal-derived OM in the Klamath River and Ady/North Canal waters that are currently the predominant source of waters to the Drain, illustrating that the imported DOM from the Klamath River and Upper Klamath Lake is augmented by OM from the Klamath Straits Drain area soils and wetlands. Evaporation, as water is used and recycled within this area, could also contribute to the high DOC concentrations in Klamath Straits Drain.
Future work could be targeted toward understanding of the short-term and seasonal DOM dynamics and toward pinpointing DOM sources more specifically. Deployment of an fDOM sensor above and (or) downstream of the outflow of the Klamath Straits Drain would be a way to more fully document the contribution of OM to the Klamath River from the Klamath Straits Drain. The continuous monitor would need to include a turbidity and water temperature sensor to provide required corrections to the continuous fDOM data (Downing and others, 2009). These monitors can help target sampling of other analytes of concern, because events with large fluxes of OM could potentially transport nutrients, metals or other contaminants of concern (Aiken and others, 1985). Further studies could be designed to examine how various land management activities, such as “walking wetlands,” contribute to OM cycling. Walking wetlands are an experimental program that floods farm fields seasonally or year-round for 1–4 years before returning them to agricultural production. To further investigate OM sources, a study could include optical analysis of source material, such as DOM leached from peat soil, leachates from bird droppings, and algal material.
18
Wetlands can have naturally high DOM, which can provide ecological benefits, as well as management benefits. For instance, the high light extinction associated with elevated DOM can lead to less dense aquatic plant growth in canals (Eilers, 2005). However, human or climate influence that leads to wet/dry cycles of peat soils can lead to increased oxidation and release of OM and nutrients into the water column (for example, Snyder and Morace, 1997). In areas where total nutrient reductions are specified, such as Klamath Straits Drain, it will continue to be important to understand and monitor the presence, amount, and characteristics of organic matter in these systems.
Acknowledgments We thank Robert Blake, Thomas Craig, Blake Eldridge, Charles Goebel, Douglas Labonte,
Alex Lee, Celeste Melosh, Liam Schenk, and Bradley Smith of the USGS Klamath Falls field office for participating in field work.
References Cited Agren, A., Buffam, I., Berggren, M., Bishop, K., Jansson, M., and Laudon, H., 2008, Dissolved
organic carbon characteristics in boreal streams in a forest-wetland gradient during the transition between winter and summer: Journal of Geophysical Research Biogeosciences, v. 113, G03031.
Aiken, G., McKnight, D.M., Wershaw, R.L., and MacCarthy, P., 1985, Humic substances in soil, sediment, and water: Wiley and Sons, New York, 149–173.
Andersson, C.A., and Bro, R., 2000, The N-way toolbox for MATLAB: Chemometrics and Intelligent Laboratory Systems, v. 52, 1–4.
Battin, T.J., Luyssaert, S., Kaplan, L.A., Aufdenkampe, A.K., Richter, A., and Tranvik, L.J., 2009, The boundless carbon cycle: Nature Geoscience, v. 2, p. 598–600.
Beck, A.J., Jones, K., Hayes, M., and Mingelgrim, U., 1993, Organic substances in soil and water— Natural constituents and their influences on contaminant behavior: Royal Society of Chemistry, Special Publication 135.
Bergamaschi, B.A., Kalve, E., Guenther, L., Mendez, G.O., and Belitz, K., 2005, An assessment of optical properties of dissolved organic material as quantitative source indicators in the Santa Ana River Basin, Southern California: U.S. Geological Survey Scientific Investigations Report 2005-5152, 38 p. [Also available at https://pubs.usgs.gov/sir/2008/5152/.]
Bergamaschi, B.A., Krabbenhoft, D.P., Aiken, G.R., Patino, E., Rumbold, D.G., and Orem, W.H., 2012, Tidally driven export of dissolved organic carbon, total mercury, and methylmercury from a mangrove-dominated estuary: Environmental Science and Technology, v. 46, no. 3, p. 1371–1378.
Brenton, R.W., and Arnett, T.L., 1993, Methods of analysis by the U.S. Geological Survey and national water quality laboratory—Determination of dissolved organic carbon by UV-promoted persulfate oxidation and infrared spectrometry: U.S. Geological Survey Open-File Report 92-480, p. 1–16. [Also available at https://pubs.er.usgs.gov/publication/ofr92480.]
Bro, R., 1997, PARAFAC—Tutorial and applications: Chemometrics and intelligent laboratory systems, v. 38, p. 149–171.
Carpenter, K.D., Kraus, T.E., Goldman, J.H., Sarceno, J.F., Downing, B.D., and Bergamaschi, B.A., 2013, Sources and characteristics of organic matter in the Clackamas River, Oregon, related to the formation of disinfection by-products in treated drinking water: U.S. Geological Survey Scientific Investigation Report 2013-5001, 78 p. [Also available at https://pubs.usgs.gov/sir/2013/5001/.]
Coble, P.G., 1996, Characterization of marine and terrestrial DOM in seawater using excitation-emission matrix spectroscopy: Marine Chemistry, v. 51, no. 4, p. 325–346.

19
Coble, P.G., 2007, Marine optical biogeochemistry—The chemistry of ocean color: Chemical Reviews, v. 107, no. 2, p. 402–418.
Cory, R.M., and McKnight, D.M., 2005, Fluorescence spectroscopy reveals ubiquitous presence of oxidized and reduced quinones in dissolved organic matter: Environmental Science and Technology, v. 39, p. 8,142-8,149.
Cory, R.M., Miller, M.P., McKnight, D.M., Guerard, J.J., and Miller, P.L., 2010, Effect of instrument-specific response on the analysis of fulvic acid fluorescence spectra: Limnology and Oceanography: Methods, v. 8, p. 67–78.
David Evans and Associates, Inc., 2000, Evaluation of marsh management practices and impacts to water quality within the Lower Klamath Lake National Wildlife Refuge: David Evans and Associates, Inc., Draft Technical Memorandum, 34 p.
Downing, B.D., Boss, E., Bergamaschi, B.A., Fleck, J.A., Lionberger, M.A., Ganju, N.K., Schoellhamer, D.H., and Fujii, R., 2009, Quantifying fluxes and characterizing compositional changes of dissolved organic matter in aquatic systems in situ using combined acoustic and optical measurements: Limnology and Oceanography—Methods, v. 7, p. 119–131.
Eilers, J.M., 2005, Aquatic vegetation in selected sites of the Lost River, OR and CA: MaxDepth Aquatics, Inc., appendix F.
Fellman, J.B., Petrone, K.C., and Grierson, P.F., 2013, Leaf litter age, chemical quality, and photodegradation control the fate of leachate dissolved organic matter in a dryland river: Journal of Arid Environments, v. 89, p. 30–37.
Goldman, J.H., 2017, Data from an analysis of dissolved organic matter in the Upper Klamath River, Lost River, and Klamath Straits Drain, Oregon and California, 2013–16: U.S. Geological Survey data release, https://doi.org/10.5066/F71Z42V4.
Hudson, N., Baker, A., and Reynolds, D., 2007, Fluorescence analysis of dissolved organic matter in natural, waste and polluted waters—A review: River Research and Applications, v. 23, no. 6, p. 631–649.
Kraus, T.E.C., Anderson, C.A., Morgenstern, K., Downing, B.D., Pellerin, B.A., and Bergamaschi, B.A., 2010, Determining sources of dissolved organic carbon and disinfection byproduct precursors to the McKenzie River, Oregon: Journal of Environmental Quality, v. 39, no. 6, p. 2100–2112.
Leenheer, J.A., and Croue, J.P., 2003, Characterizing aquatic dissolved organic matter: Environmental Science & Technology, v. 37, p. 18–26.
Manny, B.A., Johnson, W.C., and Wetzel, R.G., 1994, Nutrient additions by waterfowl to lakes and reservoirs—Predicting their effects on productivity and water quality: Hydrobiologia, v. 279, p. 121, doi:10.1007/BF00027847.
McKnight, D.M., Boyer, E.W., Westerhoff, P.K., Doran, P.T., Kulbe, T., and Andersen, D.T., 2001, Spectrofluorometric characterization of dissolved organic matter for indication of precursor organic material and aromaticity: Limnology and Oceanography, v. 46, no. 1, p. 38–48.
Murphy, K.R., Butler, K.D., Spencer, R.G.M., Stedmon, C.A., Boehme, J.R., and Aiken, G.R., 2010, Measurement of dissolved organic matter fluorescence in aquatic environments—An interlaboratory comparison: Environmental Science and Technology, v. 44, no. 24, p. 9405–9412.
Murphy, K.R., Stedmon C.A., Graeber, D., and Bro, R., 2013, Fluorescence spectroscopy and multi-way techniques—PARAFAC: Analytical Methods, v. 5, p. 6557–6566.
National Marine Fisheries Service and U.S. Fish and Wildlife Service, 2013, Biological opinions on the effects of proposed Klamath Project operations from May 31, 2013, through March 31, 2023, on five federally listed threatened and endangered species: NMFS SWR-2012-9372, 590 p.
20
Ohno, T., 2002, Fluorescence inner-filtering correction for determining the humification index of dissolved organic matter: Environmental Science and Technology, v. 36, p. 742–746.
Oregon Department of Environmental Quality, 2017, Upper Klamath and Lost River subbasins TMDL and water quality management plan [Online at http://www.oregon.gov/deq/FilterDocs/KlamathLostTMDL2017.pdf]
Patton, C.J., and Kryskalla, J.R., 2003, Methods of analysis by the U.S. Geological Survey National Water Quality Laboratory—Evaluation of alkaline persulfate digestion as an alternative to Kjeldahl digestion for determination of total and dissolved nitrogen and phosphorus in water: U.S. Geological Survey Water-Resources Investigations Report 03–4174, 33 p.
Pellerin, B.A., Saraceno, J.F., Shanley, J.B., Sebestyen, S.D., Aiken, G.R., Wollheim, W.M., and Bergamaschi, B.A., 2012, Taking the pulse of snowmelt—In situ sensors reveal seasonal, event and diurnal patterns of nitrate and dissolved organic matter variability in an upland forest stream: Biogeochemistry, v. 108, no. 1–3, p. 183–198.
Pinney, M.L., Westerhoff, P.K., and Baker, L., 2000, Transformations in dissolved organic carbon through constructed wetlands: Water Research, v. 34, p. 1897–1911.
Pischel, E.M., and Gannett, M.W., 2015, Effects of groundwater pumping on agricultural drains in the Tule Lake subbasin, Oregon and California: U.S. Geological Survey Scientific Investigations Report 2015–5087, 44 p., https://doi.org/10.3133/sir20155087.
Saraceno, J.F., Pellerin, B.A., Downing, B.D., Boss, E., Bachand, P.A.M., and Bergamaschi, B.A., 2009, High frequency in situ optical measurements during a storm event–Assessing relationships between dissolved organic matter, sediment concentrations, and hydrologic processes: Biogeosciences, v. 114, p. 1–11.
Snyder, D.T., and Morace, J.L., 1997, Nitrogen and phosphorus loading from drained wetlands adjacent to Upper Klamath and Agency Lakes, Oregon: U.S. Geological Survey Water-Resources Investigations Report 97-4059, 67 p. [Also available at https://pubs.er.usgs.gov/publication/wri974059.]
Spencer, R.G.M., Pellerin, B.A., Bergamaschi, B.A., Downing, B.D., Kraus, T.E.C., Smart, D.R., Dahgren, R.A., and Hernes, P.J., 2007, Diurnal variability in riverine dissolved organic matter composition determined by in situ optical measurement in the San Joaquin River (California, USA): Hydrological Processes, v. 21, no. 23, p. 3181–3189.
Stedmon, C.A., Markager, S., and Bro, R., 2003, Tracing dissolved organic matter in aquatic environments using a new approach to fluorescence spectroscopy: Marine Chemistry, v. 82, no. 3–4, p. 239–254.
Stedmon, C.A., and Bro, R., 2008, Characterizing dissolved organic matter fluorescence with parallel factor analysis—A tutorial: Limnology and Oceanography—Methods, v. 6, p. 1–6.
Stevenson, F.J., 1982, Humus chemistry: genesis, composition, reactions: John Wiley, 443 p. Sullivan, A.B., Rounds, S.A., Asbill-Case, J.R., and Deas, M.L., 2013, Macrophyte and pH buffering
updates to the Klamath River water-quality model upstream of Keno Dam, Oregon: U.S. Geological Survey Scientific Investigations Report 2013-5016, 52 p. [Also available at https://pubs.usgs.gov/sir/2013/5016/.]
Sullivan, A.B., Rounds, S.A., Deas, M.L., Asbill, J.R., Wellman, R.E., Stewart, M.A., Johnston, M.W., and Sogutlugil, I.E., 2011, Modeling hydrodynamics, water temperature, and water quality in the Klamath River upstream of Keno Dam, Oregon, 2006-09: U.S. Geological Survey Scientific Investigations Report 2011-5105, 70 p. [Also available at https://pubs.usgs.gov/sir/2011/5105/.]
Sullivan, A.B., Snyder, D.M., and Rounds, S.A., 2010, Controls on biochemical oxygen demand in the upper Klamath River, Oregon: Chemical Geology, v. 269, no. 1–2, p. 12–21.

21
Sullivan, A.B., Sogutlugil, I.E., Rounds, S.A., and Deas, M.L., 2013, Modeling the water-quality effects of changes to the Klamath River upstream of Keno Dam, Oregon: U.S. Geological Survey Scientific Investigations Report 2013–5135, 60 p. [Also available at https://pubs.usgs.gov/sir/2013/5135/.]
Tetra Tech, Inc., 2005, Model configuration and results, Lost River model for TMDL development. Prepared for: U.S. Environmental Protection Agency Region 10, U.S. Environmental Protection Agency Region 9, Oregon Department of Environmental Quality, North Coast Regional Water Quality Control Board, August 29, 2005.
U.S. Environmental Protection Agency, 2008, Lost River, California, total maximum daily loads: U.S. Environmental Protection Agency, 104 p.
U.S. Geological Survey, 2006, Collection of water samples (ver. 2.0): U.S. Geological Survey Techniques of Water-Resources Investigations, book 9, chap. A4. [Also available at https://pubs.water.usgs.gov/twri9A4/.]
U.S. Geological Survey, 2017, National Water Information System: Website, accessed December 5, 2017, at https://waterdata.usgs.gov/nwis.
U.S. Geological Survey, variously dated, National field manual for the collection of water-quality data: U.S. Geological Survey Techniques of Water-Resources Investigations, book 9, chaps. A1-A10, accessed July 11, 2017, at https://pubs.water.usgs.gov/twri9A.
Weishaar, J.L., Aiken, G.R., Bergamaschi, B.A., Fram, M.S., Fujii, R., and Mopper, K., 2003, Evaluation of specific ultraviolet absorbance as an indicator of the chemical composition and reactivity of dissolved organic carbon: Environmental Science and Technology, v. 37, p. 4,702–4,708.
Zimmerman, C.F., Keefe, C.W., and Bashe, J., 1997, Determination of carbon and nitrogen in sediments and particulates of estuarine/coastal waters using elemental analysis—Method 440.0: U.S. Environmental Protection Agency, accessed July 11, 2017, at https://cfpub.epa.gov/si/si_public_record_report.cfm?dirEntryId=309418.

Publishing support provided by the U.S. Geological SurveyScience Publishing Network, Tacoma Publishing Service Center
For more information concerning the research in this report, contact the Director, Oregon Water Science Center U.S. Geological Survey 2130 SW 5th Avenue Portland, Oregon 97201 https://or.water.usgs.gov

ISSN 2331-1258 (online)https://doi.org/10.3133/ofr20171160
Goldman and Sullivan—
Characteristics of dissolved organic matter in the Upper Klam
ath River, Lost River, and Klamath Straits Drain, Oregon and California—
Open-File Report 2017–1160