characteristics and stability of oxide films on plutonium
TRANSCRIPT

University of Nebraska - Lincoln University of Nebraska - Lincoln
DigitalCommons@University of Nebraska - Lincoln DigitalCommons@University of Nebraska - Lincoln
Student Research Projects, Dissertations, and Theses - Chemistry Department Chemistry, Department of
12-2010
Characteristics and Stability of Oxide Films on Plutonium Characteristics and Stability of Oxide Films on Plutonium
Surfaces Surfaces
Harry Guillermo García Flores University of Nebraska-Lincoln, [email protected]
Follow this and additional works at: https://digitalcommons.unl.edu/chemistrydiss
Part of the Physical Chemistry Commons
García Flores, Harry Guillermo, "Characteristics and Stability of Oxide Films on Plutonium Surfaces" (2010). Student Research Projects, Dissertations, and Theses - Chemistry Department. 17. https://digitalcommons.unl.edu/chemistrydiss/17
This Article is brought to you for free and open access by the Chemistry, Department of at DigitalCommons@University of Nebraska - Lincoln. It has been accepted for inclusion in Student Research Projects, Dissertations, and Theses - Chemistry Department by an authorized administrator of DigitalCommons@University of Nebraska - Lincoln.

CHARACTERISTICS AND STABILITY OF OXIDE FILMS ON PLUTONIUM
SURFACES
by
Harry G. García Flores
A DISSERTATION
Presented to the Faculty of
The Graduate College at the University of Nebraska
In Partial Fulfillment of Requirements
For the Degree of Doctor of Philosophy
Major: Chemistry
Under the Supervision of Professor Marjorie A. Langell
Lincoln, Nebraska
December, 2010

CHARACTERISTICS AND STABILITY OF OXIDE FILMS ON PLUTONIUM
SURFACES
Harry Guillermo García Flores, Ph.D.
University of Nebraska, 2010
Adviser: Marjorie A. Langell
The oxidation of plutonium (Pu) metal continues to be an area of considerable
activity. The reaction characteristics have significant implications for production use,
storage, and disposition of this radiological material. Developing an accurate physical
model of the structures, oxidation states, and oxygen concentration gradients present
during oxidation are essential to understanding this process. Traditionally, the stable
oxides of Pu have been thought to be plutonium sesquioxide (Pu2O3, O/Pu = 1.5, Pu3+)
and plutonium dioxide (PuO2, O/Pu = 2.0, Pu4+), existing in a layered structure on Pu
metal. Many of the notions of the layered Pu oxide model are based on extrapolations of
data acquired on bulk oxides with only a few supported with results from actual Pu oxide
film studies.
This dissertation involves a detailed study using x-ray photoelectron spectroscopy
(XPS) and Auger electron spectroscopy (AES) to measure the relative concentrations of
oxygen and plutonium, as well as the resulting oxidation states in the near-surface region.
A model to fit the XPS data has been developed for the accurate and reliable
quantification of oxide film stoichiometries (O2-/PuTot), and a relative sensitivity factor

(RSF) has been determined. The influence of temperature, pressure and exposure time on
oxide film characteristics was investigated.
The results indicate that, like PuO2, the sesquioxide is not stable on a clean metal
substrate under reducing conditions, resulting in substoichiometric films (Pu2O3-y). The
Pu2O3-y films prepared exhibit a variety of stoichiometries as a function of preparation
conditions. This study show a much greater than anticipated extent of auto-reduction of
PuO2 and challenge the commonly held notion of the stoichiometric stability of Pu2O3
thin films, especially in the presence of plutonium metal. The fate of gallium and carbon
impurities after oxidation of plutonium surfaces was probed. Both remain at the metal-
oxide interface upon oxidation of the metal. A new model of the plutonium/oxygen thin-
film system will be proposed and its applicability to thicker-films will be discussed.

iv
Acknowledgements
It has been a long time since this journey began in 1993. After a six year hiatus, I
was given a second opportunity in 2005 to return to Nebraska in order to continue my
studies. This would not have been possible without my two mentors. Professor Marjorie
Langell at the Chemistry Department in Nebraska who took me into her lab and provided
me with guidance, encouragement, and gloves and scarves to keep me warm during the
winter. Dr. David Pugmire who supervised my work while at Los Alamos National
Laboratory (where the investigation presented here was performed) and provided
guidance through the myriad safety and security protocols regulating work at a nuclear
facility. Thank you, both, for everything. I will always be grateful.
The other members of my Supervisory Committee deserve recognition as well for
their time and attention in evaluating this work: Dr. Choe, Dr. Harbison, Dr. Schubert,
and Dr. Zeng. A special thanks is warranted for Dr. Harbison who offered useful counsel
when I was contemplating a return to Nebraska. Especially the assurance that I would not
have to take cum exams again. Two RUI’s and two OPO’s were not a problem but I do
not think I could have handled a second set of those exams...
Several individuals at Los Alamos deserve recognition. Troy Nothwang, Amanda
Broach, and Sue Duncan for lending their expertise in the handling of nuclear materials.
Not only did they provide assistance in the movement of nuclear material in and out of
the instruments but often offered a helping hand in performing instrument maintenance –

v
and always with a smile. Dr. David Moore’s expertise in actinide materials and AES data
acquisition/interpretation were invaluable for this work. The plutonium samples studied
in this work were graciously provided by Dr. Franz Freibert. Dr. Paul Roussel (AWE in
the United Kingdom) needs to be acknowledged for his encyclopedic knowledge of the
plutonium literature and his willingness to share it with me –even answering my emails
from South Africa while attending the World Cup. I also want to thank Dr. Rollin Lakis
who suggested I go back to school and for introducing me to the Los Alamos National
Laboratory’s Graduate Research Assistance (GRA) program, which supported me during
the course of this work.
This document has been reviewed by LANL’s SAFE-1 Classification Group and
received the following release number: LA-UR-10-07870.

vi
TABLE OF CONTENTS
ABSTRACT ........................................................................................................................ ii
ACKNOWLEDGEMENTS ............................................................................................... iv
CHAPTER 1: INTRODUCTION ....................................................................................... 1
1.1 Background .............................................................................................................. 1
1.2 Properties of Plutonium ........................................................................................... 3
1.3 Chemistry of Plutonium ........................................................................................... 5
1.4 Surface Science of Plutonium .................................................................................. 8
1.5 Surface Oxidation of Plutonium ............................................................................ 11
CHAPTER 2: EXPERIMENTAL SECTION ................................................................... 15
2.1 Electron Spectroscopy ........................................................................................... 15
2.2 X-ray Photoelectron Spectroscopy ........................................................................ 16
2.3 Angle Dependent XPS ........................................................................................... 25
2.4 Auger Electron Spectroscopy ................................................................................ 26
2.5 Instrumentation ...................................................................................................... 32
2.5.1 XPS Instrument ............................................................................................... 37

vii
2.5.2 AES Instrument ............................................................................................... 48
2.6 Gas Handling Manifold and Dosing ...................................................................... 49
2.7 Plutonium Sample and Manipulator ...................................................................... 49
2.8 XPS Data Analysis ................................................................................................. 54
2.9 Plutonium Sensitivity Factor Determination ......................................................... 63
CHAPTER 3: EARLY STAGES OF PLUTONIUM OXIDATION ................................ 70
3.1 Oxygen Exposures of Clean Plutonium Metal ...................................................... 70
3.2 Carbide within the Oxide Film .............................................................................. 80
3.3 Discussion .............................................................................................................. 82
3.4 Conclusions ............................................................................................................ 83
CHAPTER 4: AR REACTION OF PLUTONIUM DIOXIDE FILMS ........................... 87
4.1 Current Understanding of the PuO2 AR Reaction ................................................. 88
4.2 In-situ XPS of Pu Metal Oxidation at Room Temperature .................................... 89
4.3 Effect of Temperature on the AR of PuO2 ............................................................. 95
4.4 Effect of Temperature on the Growth of Pu Oxide Films ..................................... 97
4.5 Thick PuO2 Films ................................................................................................. 100
4.6 Nature of the Pu Oxide System ............................................................................ 102
4.7 Conclusions .......................................................................................................... 104

viii
CHAPTER 5: COMPOSITION OF OXIDE FILMS ON PU METAL SURFACES ..... 108
5.1 AR of Plutonium Dioxide on Clean Surfaces ...................................................... 110
5.2 AR of PuO2 on Carbide-Contaminated Surfaces ................................................. 114
5.3 Conclusions .......................................................................................................... 124
CHAPTER 6: THE ROLE AND FATE OF IMPURITIES IN PU OXIDATION ......... 127
6.1 Gallium in Plutonium Metal ................................................................................ 127
6.2 Gallium in Plutonium Oxide ................................................................................ 128
6.3 Carbon Impurities in Plutonium Metal ................................................................ 132
6.3 Conclusions .......................................................................................................... 139
CHAPTER 7: CONCLUSIONS ..................................................................................... 143

1
Chapter 1 : Introduction
1.1 Background
Since the moment it was first isolated by man in February 23, 1941 [1], and
sufficient quantities of the metallic form were produced, scientists have been studying the
properties of plutonium. Knowledge obtained by scientists during the Manhattan Project
was essential if the new element was to be processed, handled, and used for the ultimate
goal: a nuclear weapon device. Today, while the primary interest of studying plutonium
is still centered on nuclear weapons, peaceful uses of the element have emerged [2].
Fifty years ago, NASA developed radioisotope thermal generators (RTG) that
convert the heat from the radioactive decay of plutonium-238 into electricity [3]. Space
exploration missions from the historic Pioneer 10 & 11 (the first crafts to explore the
edges of interstellar space), the Viking (Mars), and Voyager (outer planets) missions to
the more recent Galileo (Jupiter) and Cassini (Saturn & moons) spacecrafts, have all
utilized plutonium RTGs to provide the power needed by scientific and communications
instrumentations. In all of these cases, crafts have ventured to region of the outer Solar
System and beyond, where more conventional energy sources such as solar cells, are
impractical.
With the current concerns regarding greenhouse emissions from the combustion
of fossil fuels, nuclear energy is experiencing a renaissance. Most of the current nuclear

2
power production involves the fission of uranium for electricity production. However,
plutonium (as well as thorium) can also be utilized for nuclear power. Indeed, Japan
routinely sends its spent nuclear rods to Europe for reprocessing and ships the plutonium
back to the island to be used in higher ‘burnup ratios’ reactors [4]. The United States,
with its enormous surplus of plutonium from Cold War weapons inventory, has actively
invested in technologies to reprocess weapons grade plutonium into a fuel grade mixed
oxide (U & Pu) for reactors. Unfortunately, there are no commercial nuclear power
reactors capable of burning plutonium fuel in the U.S. That may change in the near future
with the recent national energy policy changes emphasizing nuclear energy [5].
An unexpected discovery was made recently regarding plutonium and
superconductivity. While probing the magnetic properties of the compound PuCoGa5,
measurements revealed diamagnetic behavior, a common indicator of superconductivity;
actinide group elements usually form magnetic compounds [6]. Later investigations
revealed that for this material, superconductivity is achieved at 18 K, not around 1 K as
most metals that are not considered very good superconductors, i.e., the low temperature
makes them undesirable for practical applications [7]. According to current theories, due
to the magnetic properties of heavy elements in the actinide group, such as plutonium,
this class of compounds should not superconduct, suggesting a new superconducting
mechanism not explained by current theories. Newer theories dealing with d-wave
pairing and spin fluctuation are being formulated to explain the superconductivity
properties of actinide elements.

3
1.2 Properties of Plutonium
From the first observations of the initial few milligrams produced, plutonium has
been surprising scientists with its unusual properties. Density measurements provided one
of the first indications that plutonium is not your typical metal. Manhattan Project teams
at the University of Chicago and at Los Alamos disagreed on the actual density of the
new element. The measured values ranged from 12 to 22 g/cm3 [2]. The fluctuating
densities were later determined to be due to the different solid phases of the measured
sample. Plutonium undergoes six crystalline phase transitions, as listed on Table 1.1 [8].
Table 1.1: The crystal structures and densities of plutonium metal solid phases [8].
Phase Crystal Structure Density (g/cm3)
Simple monoclinic 19.86 Face-centered monoclinic 17.70 Face-centered orthorhombic 17.14 Face-centered cubic 15.92 ’ Body-centered tetragonal 16.00 Body centered cubic 16.51
Liquid 16.65
As the metal is heated, the density of these distinct phases fluctuates by more than 20%.
The brittle -phase, an unusual low-symmetry monoclinic structure stable at room
temperature, expands at five times the rate of iron when heated. The high-symmetry, face
centered-cubic (fcc) -phase, stable at 310o C [9], contracts with rising temperature. At
640o C, plutonium melts; the aqueous phase has a high surface tension and the greatest

4
viscosity of any element in the Periodic Table. The -phase of plutonium can be
stabilized at room temperature with a small amount (~2%) of gallium or aluminum.
Gallium stabilized, -phase plutonium metal is a poly-crystalline material, as can be
observed in Figure 1.1.
Figure 1.1: Poly-crystalline nature of -plutonium metal. An electron micrograph (top left, black/white) shows its multigrain structure. An electron back-scattered diffraction (EBSD) pattern (bottom left, color) of the same surface region contrasts the different domains by color as a function of the crystalline direction shown in the legend (right, colored triangle).
While this fcc () phase is the closest packed structure of the six allotropes, it has the
lowest density. The main advantages of stabilizing the -phase with gallium are the
increased temperature stability range and the increased malleability of an fcc phase vs.
monoclinic, which allows for easier machining of the metal.

5
Plutonium’s strange behavior is not confined to the number of crystalline phases it
can accommodate. It is a poor electrical and thermal conductor; the electrical resistivity
increases as the temperature is lowered to 100 K. This anomalous behavior is generally
attributed to the 5f electrons numerous competing states near the ground state and the
shape of the 5f band [10].
1.3 Chemistry of Plutonium
As a consequence of the Cold War, the United States and the former Soviet Union
account for the vast majority of the environmental releases. Because of different
philosophies regarding storage and discharge of radionuclides, the amounts differ
(~2.6*106 Ci in US vs. ~1.7*109 Ci in USSR) [11]. Not surprisingly, most of the releases
occurred around nuclear material complexes. In the US, the Hanford Site and the
Savannah River Site are the main centers for reprocessing waste storage. Environmental
contamination is a major concern at these sites. Studies have shown that plutonium
undergoes numerous reactions in water and with minerals. The low solubility in most
natural water bodies and high sorption to minerals create a natural barrier against the
spread of accidental spills [11]. The plutonium uptake by plants is very limited (<
0.01%). Since plutonium is an alpha emitter, it must enter the body to deliver a radiation
dose. Fortunately, the human body has natural barriers to minimize uptakes of the
material. Only 5-25% of the inhaled plutonium is retained in the lungs, lymphs, liver, or
bones. Of the ingested plutonium 0.05% enters the blood stream; the rest is excreted.
Absorption through skin cuts is a serious danger, particularly to plutonium workers as it

6
offers a complete retention of plutonium in the body. Very high doses of ionizing
radiation, such as those from criticality accidents, are harmful and potentially fatal.
The corrosion chemistry of plutonium has been studied under different conditions
in order to ascertain the effect of relative humidity, oxygen content, and temperature
(among others) on the extent of the metal surface reaction [12]. While these studies were
performed on the different allotropes of plutonium as well, the following discussion will
only concern the delta- phase of plutonium. Corrosion of plutonium is of importance
because as the metal oxidizes, its surface spallates forming small particles of oxide that
are readily dispersible, creating an inhalation hazard that may endanger nuclear workers
at the workplace or the general population during an accidental release. In dry air and at
room temperature plutonium readily oxidizes forming plutonium oxide layers on the
metal. This protective oxide layer grows at a rate of 20 pm/hr [13]. Between PuO2 and the
metal, a thin layer of plutonium sesquioxide (Pu2O3) is thought to exist.
The oxidation of plutonium by water vapor is significantly faster than in dry air.
At room temperature, the reaction with water vapor (100% relative humidity) is 100
times faster; at 100o C, the corrosion occurs at 100,000 times faster than dry air [14].
Models devised to explain this increased reactivity assumed faster diffusivity of
hydroxide ions (OH-) as the driving force of the enhanced corrosion. Others have invoked
a water-mediated catalytic oxidation of plutonium to explain the oxidation behavior [15].
However, little experimental data exists to support the different hypotheses.

7
In one of the initial investigations of plutonium oxidation, several authors
reported on the reactivity of plutonium to inert (argon) atmosphere [16]. Surprisingly,
they reported that the plutonium sample gained weight, i.e., oxidized, faster in an inert
atmosphere (argon gas) than in an oxygen atmosphere. The explanation stated by the
authors is that exposure to oxygen yields a protective layer against further oxidation.
They presented additional experiment with varying concentrations of oxygen in argon
showing that the rate of the oxidation decreased with increasing oxygen content, offering
further support to the hypothesis for a protective oxide layer formed by oxygen. It is
likely that the perceived higher reactivity to an inert atmosphere was likely due to small
amounts of water vapor in the gas.
An important consideration when interpreting historical results of plutonium
oxidation and formulating oxidation models is the experimental techniques utilized for
these initial studies. Most of the studies involved the measurement of the metal sample
weight gain with respect to time [17]. The reaction rate units of measurement were
reported as micrograms of weight gained per sample area per minute (g/cm2/min). The
initial increases in sample weight were usually several hundreds of micrograms over a
period of several hours. When units are converted from weight gain to oxide thickness,
the detection limits of the technique is approximately 50 nm. Furthermore, in order to
acquire meaningful data with as small noise levels (biggest actual weight increase per
unit time) as possible, the weight gains were measured at higher than ambient
temperatures where the oxidation rate is faster allowing for more data points within the
time of the experiment. These inherent experimental limitations prevented the study of

8
the initial stages of plutonium oxidation. Additionally, characterization of the original
metal surface prior to the oxidation experiments was not possible. Without experimental
data of the initial stages of the oxidation of plutonium or information regarding the initial
conditions of the metal surface being studied, suggested hypotheses explaining the Pu
oxidation kinetics and how it occurs at the atomic level, remained unproven and little
more that conjectures.
1.4 Surface Science of Plutonium
Any investigation of plutonium involves more hazards than comparable studies on
the typical non-radioactive elements. Challenges involving human exposure,
environmental release, and security issues make the study of plutonium difficult. Despite
all of these vicissitudes, using microgram quantities and a special experimental set-up,
Veal [18] first reported the binding energies of the prominent core levels of plutonium
oxide via x-ray photoelectron spectroscopy (XPS). Because of the small amount of
material involved in the experiments, the oxidation state of the metal was not measured
independently, but assumed to be the dioxide from the preparation. Larson [19]
successfully prepared a clean plutonium metal surface and performed oxygen gas
reaction studies via XPS and AES. These experiments showed that the oxidation of
plutonium occurs in two stages. The first is a rapid reaction to a “suboxide”, a term used
in the paper to describe an oxide where the plutonium is not in the oxidation state of 4+,
as shown by the Pu 4f photoelectron signal. The second stage of the oxidation is a
steadily decreasing conversion from the “suboxide” to plutonium dioxide. The different
oxides were determined from changes in the XPS Pu 4f core level after exposure to

9
oxygen. This two stage oxidation mechanism was confirmed with high resolution
photoelectron spectroscopy (PES) performed at -196o C [20]. In a more detailed study of
plutonium metal and its oxides, Courteix [21] prepared plutonium metal thin films which
were exposed to air and analyzed by X-ray diffraction (XRD) to confirm the PuO2
composition as well as XPS analysis to determine the Pu 4f core level binding energy for
Pu4+, as in PuO2. This work confirmed the existence of a “suboxide”, as reported by
Larson [19], not only as the product of the oxidation of a clean Pu metal surface, but also
observed after ion bombardment of a PuO2 thin film with Ar+ which is expected to result
in reduction through preferential removal of the lattice oxygen. Courtiex assigned the
formula ~Pu2O3 to the suboxide formed, based on the binding energy shift of the Pu 4f
photoelectron signal as a function of Pu oxidation state. A short time after this study, the
same group published the binding energies for photoelectrons of a clean Pu metal surface
[22].
While plutonium oxide films on metal surfaces were characterized by XPS, there
was still no knowledge of how the plutonium binding energy relates to actual oxidation of
the metal or the effect of different oxidizing conditions on the composition of the thin
plutonium oxide film. To that end, Courtiex [23] monitored the oxidation of a Pu metal
surface with XPS to determine the effect of the oxidizing gas (oxygen and water vapor)
on the surface. As described in earlier reports [19, 21], upon exposure to oxygen gas, the
plutonium surface initially converted to a suboxide (Pu2O3) followed by a slow
conversion to the dioxide (PuO2) after several hours of oxygen exposure. When the same
experiment was performed with water vapor as the oxidizing gas, the metal surface

10
quickly oxidized to Pu2O3. The dioxide (PuO2) was not observed. It was hypothesized
that oxidation by water vapor occurs via a radical hydroxyl mechanism. These findings,
while not conclusive, supported the gravimetric oxidation experiments performed in the
past which showed oxidation of plutonium occurring 100 times faster with water vapor
(measured as sample weight gain) as opposed to oxidation with oxygen gas.
In addition to probing the typical products of the oxidation process of the metal
surface, XPS has also been employed to probe other plutonium compounds, and how
their surfaces change as a function of preparation or conditions. Native oxides grown in
air have been analyzed to determine the type of species formed [24]. PuO2 exposed to
water vapor showed evidence of Pu species of higher valence with the formula PuO2+x
indicating the formation of hydroxyls at the surface. Another compound, PuO2CO3, was
found to be predominantly Pu6+ which over time decomposed to Pu4+. Several alloys of
Pu, such as PuSe and PuSi2 have been studied in an effort to determine the effect of 5f
valence electron on screening of the 4f core electron [25]. Plutonium carbides of varying
compositions (PuC1-x) have also been prepared and studied for this purpose [26]. The
corrosion of Pu metal by carbon monoxide (CO) was investigated [27] and found to result
in the formation of oxide, carbide, and graphitic carbon. An interesting behavior of
plutonium oxide films, the auto-reduction of plutonium dioxide (PuO2) to plutonium
sesquioxide (Pu2O3) under a reducing (UHV) environment, was described and utilized
[28] to calculate the diffusion coefficient of oxygen through a plutonium dioxide film.
This process will be described in more detail in a following chapter.

11
1.5 Surface Oxidation of Plutonium
The preceding sections presented an overview of the current state of knowledge of
the oxidation of plutonium metal as well as a summary of some surface science
investigations dealing with plutonium. After all this work, the oxidation of plutonium is
still poorly understood, particularly during the early stages. Yet, this knowledge is of
importance if the elucidation of the oxidation kinetics of plutonium metal is to be
achieved. Corrosion is an important factor that must be accounted for during the
processing of plutonium metal into useful components. Plutonium has been known to
“spontaneously combust” [29] in glove boxes where metal machining operations take
place. Safe environmental parameters to ensure the stability of plutonium metal during
storage and waste disposal as well as safeguarding the reliability, safety, and surveillance
of nuclear weapons are also areas that can be improved with better understanding of the
oxidation of plutonium.
This dissertation aims to improve the understanding of the oxidation
characteristics of plutonium. To that end, surface science techniques, particularly XPS
and Auger electron spectroscopy (AES), are employed to probe the metal surface and the
oxides that develop on it during exposure to oxygen. The work is divided into four main
sections. The first deals with very thin oxide films that form during the initial stages of
oxidation at low pressures. The second part is an investigation of the auto-reduction of
PuO2. The investigation of the stoichiometry and stability of plutonium oxide films will
be addressed in the third part. The effects of impurities, both introduced and those
intrinsic to plutonium metal are addressed in the final section.

12
References
[1] Michaudon, A. F. and Buican, I. G., Los Alamos Science, 26 (2000) 4.
[2] Hammel, E. F., Plutonium Metallurgy at Los Alamos: 1943-1945, Los
Alamos Historical Society, 2000.
[3] Atomic Power in Space: A History, DOE Report # NE 32117 H1, 1987.
[4] Katahara, E., The Nonproliferation Review, Fall 1997, 53.
[5] U.S. Public Law 109-58, 109th Congress: Nuclear Policy Act of 2005.
[6] Sarrao, J. L., Morales, L. A., Thompson, J. D., Scott, B. L., Stewart, G. R.,
Wastin, F., Rebizant, J., Boulet, P., Colineau, E., Lander, G. H., Nature,
420 (2002) 297.
[7] Los Alamos National Laboratory Report # LALP-06-072, April 2006.
[8] Hecker, S. S., Harbur, D. R., Zocco, T. G., Progress in Materials Science,
49 (2004) 429.
[9] Wick, O. J., Plutonium Handbook- A Guide to the Technology, Vol. I &
II, (American Nuclear Society:1980), p. 33.
[10] Hecker, S. S., Timofeeva, L. F., Los Alamos Science, 26 (2000) 244.
[11] Hecker, S. S., Los Alamos Science, 26 (2000) 36.
[12] Colmenares, C. A., Prog. Solid St. Chem., 9 (1975) 139.

13
[13] Hasckhe, J. M., Allen, T. H., Stakebake, J. L., J. Alloys Comp., 243 (1996)
23.
[14] Stakebake, J. L., Larson, D. T., Haschke, J. M., J. Alloys Comp., 202
(1993) 251.
[15] Colmenares, C. A., Prog. Solid St. Chem., 15 (1984) 257.
[16] Raynor, J. B., Sackman, J. F., Nature, 197 (1963) 587.
[17] Plutonium 1965: Proceedings of 3rd International Conference on
Plutonium, London, Kay, A. E. & Waldron, M. B., eds. (Institute of
Metals, Chapman & Hall:1965)
[18] Veal, B. W., Lam, D. J., Diamond, H., Hoekstra, H. R., Phys. Rev. B, 15
(1977) 2929.
[19] Larson, D. T., J. Vac. Sci. Technol., 17 (1980) 55.
[20] Butterfield, M., Durakiewicz, T., Guziewicz, E., Joyce, J. J., Moore, D. P.,
Arko, A. J., Morales, L. A., Mat. Res. Soc. Proc., 802 (2004) 81.
[21] Courteix, D., Chayrouse, J., Heintz, L., Baptist, R., Solid State Comm., 39
(1981) 209.
[22] Baptist, R., Courteix, D., Chayrouse, J., Heintz, L., J. Phys. F:Met. Phys.,
12 (1982) 2103.

14
[23] Courteix, D., Fontaine, J. M., Lozes, G., CEA-CONF 8863, Seminar on
Surface Analysis, Oct 1986.
[24] Farr, J. D., Schulze, R. K., Neu, M. P., J. Nucl. Mater., 328 (2004) 124.
[25] Gouder, T., Havela, L., J. Alloy. Compd., 444-445 (2007) 149.
[26] Gouder, T., Havela, L., Shick, A. B., Huber, F., Wastin, F., Rebizant, J., J.
Phys.: Condens. Matter, 19 (2007) 476201.
[27] Tull S., 2003 Ph.D. Thesis, University of Wales, Cadiff, U.K.
[28] Morrall, P., Tull, S., Glascott, J., Roussel, P., J. Alloy. Compd., 444-445
(2007) 352.
[29] Haschke, J. M., Allen, T. H., Morales, L. A., Los Alamos Science, 26
(2000) 252.

15
Chapter 2: Experimental Section
Corrosion is defined by the International Union of Pure and Applied Chemistry
(IUPAC) as an irreversible interfacial reaction of a material with its environment which
results in consumption of the material or dissolution into the material of a component of
the environment [1]. During the oxidation of plutonium metal, oxygen diffuses through
the metal-gas interface forming an oxide film on the surface. Since the surface is the
starting point and the gateway through which oxidation occurs, an ideal experimental
technique to investigate this process is one which has enhanced surface sensitivity.
2.1 Electron Spectroscopy
One of the most appealing characteristics of electron spectroscopy is its
sensitivity to the surface of a material. As an electron is emitted from the material,
collisions attenuate the energy intensity of escaping electrons.
Where IO is the intensity of the electron emitted at a depth d, IS is the intensity of the
electron as it reaches the surface, and is the inelastic mean free path (IMFP). Within a
path length , 63% of all electrons are scattered. The sampling depth is generally defined
as the depth from with 95% of all electrons emitted are scattered by the time they reach
the surface (3). The IMFP of an electron is proportional to the kinetic energy of the
electron.

16
2.2 X-ray Photoelectron Spectroscopy
Electron spectroscopy for chemical analysis (ESCA), also referred as x-ray
photoelectron spectroscopy (XPS), involves the irradiation of a surface with soft x-rays
and analysis of the kinetic energy of the emitted photoelectrons, as illustrated in Figure
2.1. The photoemission process can be divided into three steps: (1) photon absorption and
Figure 2.1: Conceptual illustration of the electron photoemission process.
ionization (initial state effects), (2) relaxation of the atom and creation of the
photoelectron (final state effects) and (3) the transport of the ejected electron to the
surface (extrinsic effects). The energy of the ejected photoelectron is directly related to
the atom, from which it emerges,
where h is the energy of the photon (x-ray), KE is the kinetic energy of the ejected
photoelectron, is the combined spectrometer and sample work function and BE is the
binding energy of the electron. Not only is elemental identification possible, but the

17
chemical state of the element can also be probed via XPS due to the sensitivity of the
ejected electron to the nearest atoms. Interpretation of the binding energies of core
electrons in an XP spectra of became feasible with the formulation of Koopmans’
theorem [2], which equates the negative of the biding energy (BE) defined above to the
energy of the core electron in the XPS experiment. While useful, the theorem assumes
that there is no interaction between the ejected electron and the changing element in the
solid as the remaining electrons shift to shield the charged atom. The neglected atomic
orbital relaxation may cause underestimation of the calculated initial state energy of the
electron in the solid from the values measured. Nevertheless, the calculated binding
energies are generally qualitatively correct, for the given element. The width of the XPS
signal peak, full-width at half the maximum peak height (FWHM), is a function of
several factors including the linewidth of the x-ray source, the resolution of the electron
analyzer, and the natural line width of the transition. Core level transitions with a half-life
of 10-15 to 10-19 second yield line widths of between 0.05 and 4 eV [3].
An XP spectrum is characterized by peaks with a rising background to the higher
binding energy side of each set of peaks. The step-like pattern of the rising background is
caused by inelastically scattered photoelectrons. The height of the step can be utilized to
extract information on the depth of the atom from which the photoelectron emanated [4,
5]. Photoelectrons from atoms near the surface will exhibit a small background.
Photoelectrons from atoms near the surface will exhibit a small background rise while
those from atoms deeper beneath the surface show a steep rise in the background which

18
600 550 500 450 400 350 300 250 200
Inte
nsity
(A
.U.)
Binding Energy (eV)
C 1s
Pu 4fO 1s
Figure 2.2: XP spectra illustrating the effect of an adsorbed layer on a plutonium oxide surface. The oxide surface with a carbon adlayer (blue trace) exhibits a steep rise in background in the high binding energy side of the Pu 4f photoelectron signals. Following a brief ion sputtering cleaning of the surface (red trace), the carbon 1s signal disappears and the background step of the Pu 4f signal decreases.
may even swamp the main photoelectron peak. Surface contamination on a surface,may
even swamp the main photoelectron peak. Surface contamination on a surface, typically
from residual gases within the vacuum chamber, causes attenuation of the underlying
metal photoelectron resulting in a steep increase of the inelastically scattered electrons
background signal in the spectrum, as shown in Figure 2.2.

19
The structural features of core level photoelectron signals observed in an XP
spectrum can be attributed to several factors. Core photoelectrons from levels other than
s (l > 0), are doublets. The separation between the two peaks is due to the coupling
(quantum number, j) of the spin (quantum number, s) and the orbital angular momentum
(quantum number, l) of the photoejected core electron. The relative intensity of the
doublet is determined by the degeneracy 2j+1. Table 2.1 tabulates the relationship
between these quantum properties of the core electron.
A core level photoelectron is especially sensitive to the chemical environment of
the element in the solid. This environmental dependence, illustrated in Figure 2.3, is one
Table 2.1: X-ray photoelectron spectroscopy l-s coupling for core electron signals.
Quantum number Degeneracy2j + 1
Spectroscopic Level n l j= l ± s
1 2 3 4
0 0 1
1s 2s 3s 4s
2 3 4
1 1/2 , 3/2 1:2
2p1/2, 2p3/2
3p1/2, 3p3/2
4p1/2, 4p3/2
3 4
2 3/2, 5/2 2:3 3d3/2, 3d5/2
4d3/2, 4d5/2
4 3 5/2, 7/2 3:4 4f5/2, 4f7/2

20
460 450 440 430 420 410
Pu metal
Pu3+
Pu 4f5/2
Inte
nsity
(A
.U.)
Binding Energy (eV)
Pu 4f5/2
Pu4+
Figure 2.3: Chemical shift of the plutonium 4f photoelectron signal as a function of oxidation state. Plutonium metal (red), Pu3+ (green), and Pu4+ (blue) signal shifts toward higher binding energy with increasing formal charge. In addition to displaying the highest binding energy of the three species, Pu4+ exhibits a set of ‘shake-up’ satellites.
of the more appealing and powerful features of x-ray photoelectron spectroscopy. The
chemical shift of the binding energy can be correlated to the overall charge of the atom,
number of substituents, the electronegativity of substituents, and the formal oxidation
state of the atom. That last property of the atom may not be a reliable predictive factor in
chemical shift depending on the ionic/covalent character of the bond [3]. Thus, the spin
orbital splitting, the peak area ratio, and the binding energy value of a signal in a XP

21
spectrum assist in elemental identification and chemical environment of the atoms at the
surface.
Secondary structure is often observed along with core level photoelectron signal
in an XP spectrum. Multiplet splitting arises from the interaction of unpaired electrons in
the valence levels with the core level photoelectron. The multiplet splitting is strongest
when the electrons involved are in the same shell (i.e., 3p-3d, 4d-4f) but is also observed
for interactions of unpaired electrons of different shells. When the core level unpaired
electron has a spin parallel to the valence electrons, electrostatic interactions can occur
which will manifest as lower binding energy peak than when the core level unpaired
electron has anti-parallel spin relative to the valence electron. The energy different is
small; consequently the main effect of the multiplet splitting is the broadening of the XPS
peak resulting in asymmetry. Another common feature of the photoelectron spectrum is
occurrence of the “shake-up” satellites. The creation of a core electron hole via
photoelectron emission causes a major perturbation in an atom. The effect is an increase
in the effective nuclear charge experienced by the valence electrons. The excitation of
one (or more) of these electrons to a higher unoccupied level may be a result of the
reorganization of the valence electrons. The energy required for this transition accounts
for an additional peak observed at higher binding energy (lower kinetic energy) side of
the main photoelectron peak. An example of multiple shake-up satellites can be seen in
Figure 2.4. In a similar manner to ‘shake-up’ satellites, a valence electron can be ejected
from the atom, resulting in a doubly ionized atom with a core level and a valence level
vacancy. This ‘shake-off’ satellite typically occurs at a significantly lower kinetic energy

22
920 910 900 890 880 870
3d3/2 v'''u'''
u'' v''
u
Inte
nsity
(A
.U.)
Binding Energy(eV)
v
v'u'
3d5/2
Figure 2.4: The 3d XP spectrum of cerium oxide (CeO2) represents a striking example of shake-up satellites. The 3d5/2 and 3d3/2 doublets are labeled v & u, respectively (in red). The three pairs of primed peaks represent the three sets of shake-up satellites. The biding energy difference between the core photoelectrons (v & u) is the spin-orbit spitting. Notation of peaks follows previously assigned convention [7].
from the photoelectron peak than the ‘shake-up’ satellites and is not easily discernible
from the inelastic scattering background of the photoelectron signal.
A fourth type of XP spectra structure is the result of interactions between the
ejected photoelectron and the collective oscillation modes of electrons in the conduction
band of the metal. Similar to shake-up and shake off satellites, these plasmon loss
features are found at higher binding energies (lower electron kinetic energy) than the

23
main photoelectron peak. The energy difference is equal to the excitation energy of the
plasmon. Both bulk and surface plasmon may be detected [6].
The core level hole created by the ejected photoelectron is an excited and unstable
system. There are two mechanisms by which the core hole can be neutralized. In the
first, an electron from a higher level drops down and releases its excess energy in the
form of a photon. This process is the basis for x-ray fluorescence spectroscopy [8]. In the
1200 1000 800 600 400 200 0
Augerelectron
4p3/2
4d5/24d
3/2
6s, 6p
5f
5s
5p1/2, 3/2
5d5/2
Pu 4f5/2
Inte
nsity
(A
.U.)
Binding Energy (eV)
Pu 4f7/2
Figure 2.5: XP spectrum of a clean plutonium metal surface showing the photoelectrons emitted as well as the Auger electron transitions.

24
second, the excess energy, released by an electron to occupy the original core level hole,
may instead be transferred to another electron, which is then ejected from the atom. The
ejected electron is referred to as the Auger electron, after Pierre Auger who first
described the process [9, 10]. A series of peaks at a binding energy of ~1185 eV in the
XP spectrum of plutonium metal, shown in Figure 2.5, is due to the Auger electrons
emitted during the relaxation of the core hole [11]. The probability of either event
occurring is a function of the atomic number (Z) of the atom. Auger electron emission is
favored for elements with low Z (less than 33) while x-ray fluorescence has a higher
probability for elements with Z greater than 33. Electron core hole relaxation of a
plutonium atom, with Z = 94, occurs predominantly via x-ray fluorescence thus, the weak
Auger electron signal observed in Figure 2.5.
The photoelectrons that are detected via XPS analysis can be seen in the XP
spectrum in Figure 2.5. A cursory glance at the spectrum shows why the 4f photoelectron
is the signal of choice when analyzing plutonium with XPS: its large cross-section yields
the largest peaks facilitating analysis at low concentrations and minimizing data
acquisition times. An overview of positions for the characteristic plutonium lines in the
spectrum shown in Figure 2.5 is shown in Table 2.2. The Al K x-rays (1486.6 eV) only
has enough energy to probe the core levels of plutonium up to 4p level.

25
Table 2.2: Plutonium binding energies for the various photoelectron lines that are detected with XPS using Al K radiation. The most intense lines used for analysis throughout this thesis (Pu 4f) are shown in bold type. The 4p1/2 is not determined as it interferes with the Auger transition (NOV) at ~1185 eV (noted in Figure 2.5) [11].
Photoelecton Level
Binding Energy
(eV)
Photoelecton Level
Binding Energy
(eV)
4p1/2 N/A 5p1/2 284.2
4p3/2 1122.6 5p3/2 211.1
4d3/2 844.8 5d3/2 113.7
4d5/2 798.1 5d5/2 101.3
4f5/2 435.1 6s ~49
4f7/2 422.1 6p1/2 ~30.6
5s 366 6p3/2 ~17.2
2.3 Angle Dependent XPS
Earlier in this chapter, it was discussed how the surface sensitivity of the XPS
technique is an inherent characteristic, and advantage, of the technique due to the small
inelastic mean free path (IMFP or ) of the ejected photoelectron through the sample. By
varying the angle , between the sample surface and the analyzer, as illustrated in Figure
2.6, the surface sensitivity of the technique can be enhanced. At large angles, the
photoelectrons signal in the XP spectrum is generated at the outer-most atomic layer of
the surface or very near the surface. The equation for the intensity of the ejected

26
Figure 2.6: Schematic diagram for angle dependent XPS experiment.
photoelectron can be re-written as:
to account for the angle of analysis, ,where Io is the intensity of the electron emitted at a
depth d, IS is the intensity of the electron as it reaches the surface, and is the inelastic
mean free path (IMFP). Angle-resolved XPS has been used to determine the thickness of
oxide layers on metallic substrates [12-14] and metallic layers deposited on different
metallic substrates [15-17]. This technique will be employed, as part of this thesis, to
confirm the layered oxide model of the plutonium oxide films prepared.
2.4 Auger Electron Spectroscopy
The Auger process, illustrated in Figure 2.7 and described in the previous section
as one of the relaxation mechanisms for the core level hole created during XPS analysis,
forms the basis for Auger electron spectroscopy (AES). In this technique, rather than

27
Figure 2.7: Conceptual diagram of the Auger electron emission process after the creation of the core hole via electron ionization. Because of the number of electrons involved, the Auger process is described as a three electron process.
utilizing a photon to create the core hole in the atom, the sample is bombarded with an
electron beam of energies at least five times the core level energy. In the diagram shown
in Figure 2.7, the incident electron beam excites a core electron at the K level which is
consequently ejected from the atom. An electron at a higher core level (L1 level) drops to
fill the initial core hole transferring the excess energy to a third electron at the L2 level ,
the Auger electron, which is ejected creating a doubly-ionized atom. The kinetic energy
of the Auger electron is independent of the energy of the electron beam used to create the
initial core hole formation and can be written as
–
where EK is the energy of the K level, EL1 is the energy of the L1 level electron, EL2 is the
energy of the L2 level, and EAuger is the energy of the Auger electron. For the three
electronic levels in Figure 2.7, there are several possible Auger transitions:

28
thus, there may be several transitions of varying intensity observed for a given element.
For plutonium in particular, with 94 electrons, the number of possible permutations is
staggering. The most intense Auger transitions for plutonium metal are listed in Table
2.3; the differentiated Auger transition energies are listed in Table 2.4.
In an Auger electron (AE) spectrum, the signals are situated on a steeply-sloping
background of inelastic scattered electrons, as can be observed in Figure 2.8. The Auger
transition for carbon and oxygen appear at 501 eV and 275 eV, respectively. In order to
resolve the Auger peaks from the inelastic background and to increase the accuracy of
quantification, Auger spectra are often differentiated, as shown in Figure 2.9. The PVV
Auger transition yields the most intense signal of all the transitions thus, is might seem
like an ideal candidate to be utilized for quantification. However, Auger signals at low
kinetic energy of the spectrum are susceptible to drastic changes that are not solely due to
the quantity of the element. For instance, chemical changes at the surface, as is the case
in the oxidation of a metal, cause changes in the work function of the surface and in the
valence band. These changes are manifested in the low kinetic energy region of the AE
spectrum and can significantly decrease the accuracy of quantification. In fact, attempts
to develop a reliable sensitivity factor for quantification of Pu utilizing the PVV transition
were unsuccessful. The NOV transition, while less than a third as intense as the PVV
transition, yielded consistent and accurate quantifications of Pu. Thus, the signal at 317
eV has been chosen as the quantification transition for plutonium in this investigation.

29
Table 2.3: Kinetic energies of the Auger electron transitions for plutonium metal. These ten transitions are the most intense, although many more are possible due to the large number (94) of electrons. The values agree well with those previously published [18].
Auger Transition
Kinetic Energy
(eV)
Auger Transition
Kinetic Energy
(eV)
P1 VV O4 P3V
78 N7 O5V N6 O4V
313.5
O4VV 96 N6 O5V 326
O5VV 101.5 N6 P2V 400.5
O3VV 209 N7 P3V 416.5
N7 O4V 298 N7VV 428.5
Table 2.4: Kinetic energies of the differentiated Auger electron transitions for plutonium metal. The Auger transition line used for analysis throughout this thesis is shown in bold type.
Auger Transition
Kinetic Energy
(eV)
Auger Transition
Kinetic Energy
(eV)
P1VV O4 P3V
80.5 N7 O5V N6 O4V
317
O4VV 98.5 N6 O5V 329
O5VV 103 N6 P2V 403
O3VV 214 N7 P3V 418.5
N7 O4V 300 N7 VV 431.5

30
Figure 2.8: Auger electron (AE) spectrum of a clean plutonium metal sample. The dash lines mark the position of the AE transitions. An overview of the main transitions is in Table 2.3 [19].
A main disadvantage of AES for studying oxide layers of plutonium is its low
sensitivity. As mentioned previously, because of its high atomic number, x-ray
fluorescence is favored over the Auger process, resulting in a low sensitivity factor.
Additionally, AES is not particularly effective at probing the chemical state of atoms; it is
not able to differentiate between the oxidation states of plutonium, although it can discern
the Pu metal atom from oxidized Pu, since the two species have Auger kinetic energies of
80x103
60
40
20
0
N(E
) [c
ount
s/se
c]
500eV400300200100
Kinetic Energy [eV]
N67O45V
O45VV
PVV
N67P23V
N7VV
N7O5P3
O3VV

31
Figure 2.9: Differentiated Auger electron (AE) spectrum of a clean plutonium metal sample. The dash lines mark the position of the AE transitions. An overview of the main transitions is Table 2.4 [19].
slightly different values. Nevertheless, it can be useful for the detection of impurities, as
the relative sensitivity factors of carbon, oxygen, and gallium to Pu are larger than in
XPS. Because of the design of the instrument, AES data can be acquired while the
sample is being exposed to oxygen, allowing the investigation of the evolution of the
oxide film as it is being formed. This is only possible with XPS for very low pressures
(less than 5*10-8 Torr) as the x-ray generator cannot be operated at higher pressures. The
dN(E
)/dE
500400300200100
Kinetic Energy [eV]
N7VV
N67P23V
N67O45V
N7O5P3O3VV
O45VV
PVV

32
field emission gun used to initiate the Auger process forms a sharply focused electron
beam which allows the acquisition of electron micrographs of the metal surface and AES
analysis of very small areas of the sample, approximately 300 nm2.
2.5 Instrumentation
A critical requirement for performing any electron spectroscopy experiment is a
good ultra high vacuum (UHV) normally defined as a vacuum with a pressure of 10-9
Torr or lower [12]. Both the XPS and AES instruments utilized for acquiring the data in
this thesis exhibit a base pressure of less than 5*10-10 Torr. The low pressures are attained
will a combination of turbomolecular, ion, and titanium sublimator pumps.
The Kratos XPS is installed in a Category I nuclear facility in Los Alamos, NM
and thus its installation and operation must comply with the safety and security
operational requirements associated with the handling of nuclear materials. Many
instrument modifications had to be performed before authorization to introduce
plutonium into the instrument was issued. As a defense against the risk of instrument
damage from seismistic activity, the UHV chamber and components were securely
attached to the laboratory floor with ½ inch steel brackets and steel bolts that were drilled
to the floor. A back-up power supply was installed to prevent disruption of instrument
operation and to allow the safe and orderly shutdown of the instrument in the event of an
extended power outage.

33
Modifications were also performed in all the input and output outlets of the
system to prevent the accidental release of nuclear material into the laboratory and
environment. The exhaust lines of all the pumps attached to the system are equipped
with HEPA filters which in turn are connected to the controlled air circulation system of
the radiological facility. As a backup system to these HEPA filters, a pneumatically-
powered gate valve with a custom-made circuitry which automatically closes the valve in
the event of a power failure was installed between the UHV chamber and the main turbo
molecular pump. In the event of failure of the pumps’ HEPA filters, the gate valve
prevents the evacuated chamber (P ~10-10 Torr) from suctioning the air in the facility’s
controlled air circulation system into the system. The leak valves employed for
introducing gases into the analysis chamber during experiments are equipped with in-line
filters that prevent the movement of radioactive material into the gas manifolds.
Additionally, all the stainless steel lines that connect the XPS system to gas cylinders
were welded instead of using Swagelok® [20] connectors and also equipped with
redundant double gas regulators in order to decrease the risk of catastrophic gas regulator
failure. Such an event can, potentially positively pressurize the UHV chamber causing a
breach of containment as the excessive pressure damages the glass viewports releasing
radioactive material into the laboratory. These instrument hardware improvements do not
affect the analytical performance of the instrument, however they present challenges as
far as instrument maintenance is concern.
Sample handling and mounting protocols must also be adapted to maintain
compliance with the safety regulations. The Kratos Axis Ultra XPS is supplied from

34
Figure 2.10: Standard sample stub with spring clip supplied by Kratos Analytical [21].
Figure 2.11: Introduction of sample stub into the instrument loading dock with the loading tool (black rod to the left of picture) [21].

35
factory with a standard 15 mm diameter sample stubs made of copper or stainless steel.
The sample is attached to the stub with a spring clip that holds it in place, as illustrated in
Figure 2.10. The picture in Figure 2.11 illustrates how the sample is introduced into the
instrument through the loading dock. While this set-up method is versatile and simple, it
is not conducive for safe handling of radiological materials. It is not inconceivable to
imagine a scenario where the spring clip may dislodged inside the instrument causing the
sample to fall to the bottom of the chamber. Even more critical would be the dislodging
of the spring clip causing the radiological sample to fall to the floor creating and
undesirable situation in the laboratory. To mitigate the situation, the sample stub was
Figure 2.12: Modified sample “cup” holder designed for XPS analysis of nuclear materials in a Kratos Axis Ultra. The tapped holes allow the mounting of a mask to retain the sample firmly in place.

36
modified to create not only a more infallible manner of attaching the plutonium sample to
the stub, but to contain it as much as possible. Figure 2.12 shows a drawing of a sample
‘cup’ design to contain radiological samples safely. The design, with tapped holes on the
lip of the cup, allows the placement of a mask to keep the radiological material firmly in
place. The masks, made from tantalum disks, have a centered round hole with a diameter
of 5 mm to allow for analysis of the surface while holding the sample in place.
Because of its extreme reactivity toward most elements, an important
consideration when working with plutonium is materials compatibility. The sample
holders provided with the Kratos XPS are made from 316 stainless steel (316 SS) which
has a melting point ~1,400o C. Plutonium and iron, however, are known to form an
eutectic compound [22-23]. In a eutectic reaction, a small change in composition could
result in a very large change in the melting temperature [24]. In the case of plutonium and
iron, the compound Pu6Fe melts at ~ 400o C. Thus, heating a sample of Pu metal in a
sample holder made from 316 SS could potentially result in the Pu6Fe melting a hole
through the bottom of the container when heated to > 400o C. With a desire to avoid that
scenario, the sample cup holders used in this investigation were machined from a 16 mm
in diameter tantalum metal rod (99.95%) [25]. Tantalum (Ta) is one of the few elements
that does not form intermediate solid phases with Pu. The solubility of Pu in Ta is 0.5 at.
% at 1,000o C [26]. The favorable compatibility of Ta and its melting point (~3,010o C)
make it an ideal material for sample holders. However, Ta is a soft metal not unlike gold,
making machining of parts with tight tolerances particularly challenging.

37
2.5 .1 XPS Instrument
The instrument used in the experiments presented here is a Kratos Axis UltraDLD
instrument, shown in Figure 2.13. The vacuum chamber is fabricated from 316 non
Figure 2.13: Kratos Axis UltraDLD XPS instrument equipped with a hemispherical analyzer, dual Mg/Al x-ray anode, monochromatic Al x-ray anode and ion gun for sputter cleaning. The base pressure is typically less than 5*10-10 Torr [21].
magnetic stainless steel with all flanges sealed with CF copper gaskets. All materials
inside the chamber are UHV compatible allowing achievement of a base pressure of
<5*10-10 Torr. Achieving a good vacuum (< 10-9 Torr) is critical in order to avoid surface
reactions or contamination with the background residual gases inside the chamber. At a
pressure of 10-6 Torr, if every collision between a gas molecule and a surface results in
the gas molecule adsorbing to the surface (sticking coefficient of 1) a clean surface will
be covered with a monolayer of gas in 1 sec (e.g., 1 Langmuir (L) = 10-6 Torr*sec) [27].
At a pressure of 10-3 Torr, the surface will be covered with a monolayer of gas in 0.001

38
seconds. At 10-9 Torr, it takes 1000 seconds for the surface coverage to be one
monolayer. Thus, at UHV levels, the accumulation of contaminants on a surface is
minimal during the course of acquiring spectra. Other advantages of the UHV include:
minimized collisions of the electron with gas molecules allowing them to reach the
detector, the elimination of adsorption of the soft x-rays by air, and enabling the cleaning
of contaminants on the surface with an ion beam, typically argon.
Achieving UHV levels inside the instrument chamber is a time consuming
endeavor. Whenever instrument maintenance requires venting the instrument to
atmosphere to replace worn components, a common practice is to slowly introduce the
nitrogen gas bubbling from a liquid nitrogen container. This practice minimizes the
introduction of water vapor into the chamber. Safety regulations at the nuclear facilities
in Los Alamos, precludes the use of this technique as a way of preventing the over-
pressurization from accidental introduction of liquid nitrogen into the chamber. As an
alternative, laboratory air is introduced into the system through a gas manifold equipped
with a HEPA filter and a Drierite® Laboratory [28] that removes the water vapor from the
air.
The pumping station of the system is not sufficient to bring the vacuum down to
UHV by itself. A bake out process is necessary to remove adsorbed gases from the
chamber walls and internal components. There are integrated bake-out heaters located
between the chamber walls and the outer claddings at various places on the instrument
which heat the entire system to ~150o C. The high temperature enables the accelerated

39
desorption of the gases, mainly water, from the walls inside the chamber. The process
generally lasts 36-48 hours. After degassing all the filaments in the instrument, the base
pressure inside the chamber is ~2*10-10 Torr. During data acquisition, the operating
pressure is < 2*10-9 Torr.
The pressure inside the system is measured via an electron bombardment nude
gauge [29] equipped with a thorium coated iridium filament and an Edwards Active Ion
Gauge Controller [30]. The working pressure range of this gauge is 3*10-11 - 5*10-3 Torr.
The pumping system for the XPS includes a BOC Edwards 240 L/s turbo molecular
pump backed up with a BOC Edwards XDS-5 dry scroll pump. The main analysis
chamber also has a Varian ion pump with a MidiVac controller and titanium sublimation
pump (TSP) [31].
The Kratos Ultra XPS is equipped with a dual Al-Mg and an Al monochromatic
x-rays source. The dual source provides two different source energies, listed in Table 2.5:
the Al K line at 1486.6 eV and the Mg line at 1253.6 eV. The Mg line is slightly
narrower. The main advantage of having two x-ray sources is the ability to differentiate
between photoelectron and Auger peaks in an XP spectrum. Since Auger electrons are
independent of kinetic energy, the peaks will appear to shift by 233 eV (energy difference
of the two sources) in binding energy while the photoelectron peaks will remain constant
in an XP spectrum. In addition to the main lines, these sources also produce other
transition lines referred as x-ray satellites arising from less probable transition. The most

40
Table 2.5: Energies and widths (FWHM) for the two materials used as x-rays sources in XPS [3].
Source Line
Energy (eV)
FWHM (eV)
FWHM-Monochromatic (eV)
Mg 1253.6 0.7 N/A
Al 1486.6 0.85 < 0.26
Table 2.6: Relative position and intensity of the satellite lines for the Al and Mg x-ray sources [3].
Mg Al X-ray line
Separation from
Relative Intensity (
Separation from
Relative Intensity (
8.4 eV 9.2 % 9.6 eV 7.8 %
10.0 eV 5.1 % 11.5 eV 3.3 %
common transitions for both sources are listed in Table 2.6.
The advantage of a monochromatic source is a narrow x-ray line produced by
Bragg diffraction in a toroidal 1010 plane of a quartz crystal since only the major Al
component is diffracted. This results in an XP spectrum with narrower peaks without
the ghost peaks from the x-rays satellites, listed in Table 2.6, that are inherent to the dual
anode sources. The single anode, maintained at 15 kV is bombarded by electrons from a
filament heated by applying a ~4.0 Ampere current. The heat generated from the 15 keV
electron beam impinging the Al is dissipated by cooled water flow behind the anode. The

41
Al anode and the filament form the x-ray gun. The dual Al-Mg anode described above
has a similar set-up.
The x-rays generated at the gun are monochromatized with a quartz crystal
backplane set on a Rowland circle with a radius R. The larger the radius R, the smaller
the energy spread in the x-ray spot [3]. The Kratos XPS uses a 500 mm Rowland circle
monochromator, as shown in Figure 2.14. Overall, the monochromatized x-ray beam has
only a fraction of the intensity that is obtained from a dual x-ray source since the
monochromator filters all but the Al transition line. All the x-rays, however, are
focused on a spot at the sample surface approximately 350 m in diameter producing a
Figure 2.14: Schematic of the Al x-ray monochromator in the Kratos XPS [21]. The (1,0,-1,0) plane of quartz has the perfect lattice (4.25 Å, = 78.5o) to diffract the Al K radiation of 1486.6 eV (8.33 Å).

42
high-flux x-ray beam. The high flux can complicate the XPS analysis of insulating
materials that may accumulate surface charge while being irradiate with the intense
beam.
The Kratos XPS uses a charge neutralization system to counteract the surface
charging effects that may appear in the XP spectra of insulating materials. It consists of a
Figure 2.15: Diagram of the XPS experimental set-up. The emitted electrons, guided by the magnetic and electrostatic lenses, are focused at the slit plate of the electron analyzer (HAS). The HAS filters the electrons by kinetic energy as they enter the DLD detector [21].

43
filament to generate low energy thermionically emitted electrons and an electrode plate
above the sample to transport the electrons to the surface of the sample. The effectiveness
of the charge neutralizer in plutonium samples was investigated. Even though the oxides
of plutonium are insulating in nature, particularly PuO2, no charging effects were
observed in the XP spectra of the metal samples with thin oxides on the surface.
Nevertheless, the charge neutralizer was employ for data acquisition.
The electrons emitted from the sample are guided by a set of magnetic and
electrostatic lenses to the entrance slit of the electron energy analyzer. This particular
XPS system utilizes a 165 mm hemispherical sector analyzer (HSA) [32]. Figure 2.15
illustrates the experimental set-up of the components in the XPS instrument. The analyzer
consists of two concentric hemispherical electrodes between which the electrons pass on
their way to the delay line detector (DLD). The electrostatic fields within the (HSA) are
set to only allow electrons of a given pass energy to arrive at the detector slits. The
relationship of the pass energy E, and the applied potential V between the two concentric
electrodes is given by the equation,
where R1 is the radius of the inner hemisphere and R2 the radius of the outer hemisphere.
The term within the brackets is referred to as the spectrometer constant. For XPS
experiments, the analyzer and the lenses systems operated in the fixed analyzer
transmission (FAT) mode. In this mode, the pass energy of the analyzer is held constant

44
while the lenses system retards the kinetic energy of the electrons to the range accepted
by the analyzer. The pass energy setting determines the energy resolution of the analyzer.
Higher pass energies reduce the energy resolution but increase sensitivity, as can be
observed in Figure 2.16 and Figure 2.17. Figure 2.16 shows a set of XP spectra of a
plutonium oxide film with both Pu4+ and Pu3+. The binding energy difference between the
two signals is 1.6 eV (426.0 eV vs. 424.4 eV). At a pass energy of 80 eV, it is difficult to
460 450 440 430 420
PassEnergy
Pu 4f5/2
Inte
nsity
(A
. U.)
Binding Energy (eV)
Pass Energy
Acq. Time (min)
80 1.840 1.820 5.510 9.7
Pu 4f7/2
80 eV
40 eV
20 eV
10 eV
Figure 2.16: Pu 4f XP spectra of a plutonium oxide film as a function of analyzer pass energy. As the pass energy of the analyzer is decreased the energy resolution increases but the signal intensity decreases necessitating an increase in the data acquisition time (inset table) in order to maintain the signal to noise level.

45
see more than an inflection point in the line whereas at pass energies of 40, 20, and 10 eV
it can clearly be seen. The XP spectra acquired at pass energies of 20, and 10 eV, when
observed in the normalized plot in Figure 2.17, are practically identical indicating that the
line width of the x-ray source has become the limiting factor in the resolution. For this
work, the data acquired was collected at a pass energy of 40 eV, unless otherwise noted.
This was done as a compromise between the resolution of the data and the acquisition
time needed to obtain spectra of satisfactory signal to noise. While spectra collected at a
460 450 440 430 420
Pu 4f7/2 Pass
Energy
20 eV
40 eV
10 eVNor
mal
ized
Int
ensi
ty (
A. U
.)
Binding Energy (eV)
80 eV
Pu 4f5/2
Figure 2.17: Normalized Pu 4f XP spectra of a plutonium oxide film as a function of analyzer pass energy. Spectra are the same as those in Figure 2.16 that have been normalized to the Pu 4f7/2 signal to better illustrate the increased resolution with decreasing pass energy.

46
pass energy of 20 eV offers slightly better resolution, the collection time is more than
three times (5.5 vs. 1.8 minutes) longer than for spectra acquired at a pass energy of
40eV. The shorter collection time is vital for the experiments investigating a dynamic
process such as the auto-reduction of PuO2 to Pu2O3.
When a sample is introduced into an UHV system, it contains surface impurities
that must be removed in order to acquire XPS data of the material. Sample cleaning is
accomplished with ion sputtering of the surface. The Kratos XPS is equipped with a
Mini-Beam III ion source gun [21]. This ion gun can operate between 1.0 and 5.0 kV to
provide a high current density, scannable ion beam. The ion gun control provides the
power and voltages necessary to operate the ion gun. The ion source is differentially
pumped with a turbo molecular pump that allows the pressure inside the main analysis
chamber to remain 104 times lower inside the ion source. Normal operation involves
leaking argon gas into the gun where it is ionized by electron bombardment inside the
ionization chamber, diagramed in Figure 2.18. The electrons, which normally are 200 eV
in energy, are extracted from a rhenium filament through a grid. Ions generated in the
center of the grid cylinder, are accelerated though the grid into the middle of the
ionization region by the extraction electrode and extracted through a small aperture which
acts as the source. The ionization chamber is at a high voltage with the beam energy
equal to that of the filament. As the ions emerged from the extractor, they enter a set of
plates and lenses, shown in Figure 2.19, which control the beam’s direction and
coherence. The X deflectors direct the beam’s trajectory into the condenser lens, L1. This
lens determines the size of the beam; ions are focused near L1 for small size or on the

47
Figure 2.18: Diagram inside the ionization chamber of the Mini-Beam III ion source installed in the Kratos XPS [21].
Figure 2.19: Schematic of plates and lens to control the beam of ions emerging from the extractor [21].

48
final aperture for large beam size. The Y deflection plates guide the ion beam around a 2o
bend in the ion column which removes energetic neutral argon atoms from the beam
while guiding the ion beam toward the final lens. The octopole deflection plates raster the
beam across the sample surface while the focus lens L2 provides final adjustment of the
sharpness of the ion spot on the surface.
During normal operation of the Mini-Beam III ion source, argon gas is introduced
into the gun to a pressure of no more than 5*10-7 Torr. The energy of the beam is
adjusted between 1.0 and 5.0 kV, the ion emission current is set to 10-30 mA, and the
raster size and speed of the ion beam is selected. The ion filament current can vary
between 1.6 to 2.2 A, depending on conditions. The UHV chamber does not have a valve
between the analysis chamber and the ion pump. Thus, it is advisable to lower the ion
pump voltage from the normal operating value of 5.0 kV to 3.0 kV to prevent the pump
from overheating and shutting off during the sample cleaning cycles.
2.5 .2 AES Instrument
The Auger electron spectra were acquired in a JEOL Jamp‐7830F field emission
Auger microprobe with incident electron energy of 10 kV and in constant retarding ratio
mode (CRR=0.34). The sample was cleaned with 2 kV argon ion sputtering.
Differentiated peak positions were used for elemental identification as follows: Pu metal
at 317 eV, oxidized Pu peak at 314 eV, and oxygen at 511 eV [18]. Atomic
concentrations and O/Pu ratios were determined using the differentiated peak‐to‐peak
height and Pu (0.071), O (0.565), C (0.128), and Ga (0.451) sensitivity factors which

49
were optimized from the calculated values provided by the instrument manufacturer.
While the sample analyzed with AES was not the same one employed for the XPS
experiments, it was of similar composition. The sample preparation was similar for both
techniques.
2.6 Gas Handling Manifold and Dosing
The gas handling manifold was constructed of ¼ inch stainless steel welded to
Swagelok® VCR metal (silver platted SS) face seal fittings. The manifold system has a
dedicated turbo molecular pump that can evacuate the lines to a pressure of < 2*10-9 Torr
during bakeouts and in between gas fillings. Gases are introduced into the UHV chamber
via sapphire-sealed variable leak valves. Oxygen gas [33] is introduced into the gas
manifold via SS gas canister with no more than 80 psi of gas. A residual gas analyzer
(RGA) installed in the UHV chamber is employed to verify the purity of the gases
introduced into system prior to the dose experiments. Oxygen dosing pressures were
chosen to yield reasonable experimental exposure times, for the given dose. Gas doses
throughout this work are given in Langmuir (L) exposure units where 1L = 10-6 Torr*sec.
2.7 Plutonium Sample and Manipulator
The poly-crystalline metal [34] employed for the XPS experiments presented in
this thesis is a high-purity, electro-refined plutonium, stabilized in the phase with
gallium (~2 atom %). The metal was homogenized for 50 hours at 450o C followed by
cooling to room temperature at a rate of 6-8o C/min. An overview of the ICP-MS

50
elemental analysis, shown in Table 2.7, lists the impurities in the metal and the plutonium
isotopical composition. A 7 mm X 7 mm X 12 mm metal sample was polished with
decreasing sizes of diamond pastes down to 5 m prior to mounting on the sample cup
(illustrated in Figure 2.12) and introduction into the XPS instrument. Clean metal
surfaces were prepared by argon ion sputter (5.0 kV beam energy, ~0.7 mA sample
current, 15-30 min.) followed by heat annealing to 400-450o C for 15-30 minutes. This
ion sputter/heat-anneal cycles was repeated many times until the Pu 4f XP spectrum
Table 2.7: Elemental composition of the Pu sample utilized for the experiments presented in this work. Table 2.7a lists the amount of gallium, added to stabilize the -phase of Pu, and the main impurities. Table 2.7b lists the isotopic composition of plutonium [34].
a) Element
ppm (at/at)
b) Pu isotopes
% (at/at)
Ga 20414 238Pu 0.12 241Am 86.4 239Pu 93.956 237Np 38.9 240Pu 5.897
U 58.8 241Pu 0.095
Al 151 242Pu 0.041
Ca 107
Si 170
Fe 118
Ni 20
W 16.5
C 161

51
Figure 2.20: CAD drawing illustrating the results of a finite element simulation of the temperature gradient difference across the sample manipulator and sample holder with Pu sample. Dark blue indicated a temperature of -5o C; red indicates +2oC. The range of the gradient across the manipulator increases as the temperature at the left decreases.
indicated a metallic surface (binding energy of 422.2 eV) and the O 1s and C 1s regions
were minimized. Carbide contaminated metal surfaces were prepared by argon ion
sputter only.
Once the sample holder is introduced into the XPS system, it is attached to a
liquid nitrogen cooled sample manipulator capable of cooling to less than -160o C. The
temperature is measured by a type K thermocouple fastened to an end of the manipulator
than comes in contact with the sample holder. Hence, the temperature measured is not the
temperature of the actual sample but of the manipulator/sample holder. At ambient

52
temperature, it is reasonable to accept the temperature of the sample to be the same as
that of the manipulator. While cooling the manipulator with liquid nitrogen, this
assumption is not likely valid. Indeed, actual measurements in an instrument with a
similar setup indicated that the measured temperature of the sample manipulator and a
sample mounted onto the manipulator is -120o and -40o C respectively, i.e., a temperature
difference of 80o C [35]. This significant difference between thermocouple reading and
-200 -180 -160 -140 -120 -100 -80 -60 -40 -20 0 20
-120
-100
-80
-60
-40
-20
0
20
Data Fit Modeled TempCalculated Temp
Mo
de
led
Sa
mp
le T
em
p.
( o C
)
Measured Temp. at Manipulator ( oC)
Measured Manipulator Temp ( C)
Modeled Sample Temp (C)
22 25
5 9.6
-3 3.6
-5 1.9
-100 -70
Figure 2.21: Relationship between the measured temperatures at the manipulator and the sample temperatures obtained from the ANSYS simulation. The five simulated temperature gradients (solid blue squares) are listed in the inset table. The open blue squares are manipulator temperature readings that where calculated from the linear regression fit of the five modeled temperatures.

53
actual sample temperature is largely ignored by most people. In an effort to obtain a more
precise reading of the temperature of the actual sample in this experimental set-up, a
CAD drawing of the manipulator and the sample holder and the hemispherical emittance
of plutonium metal reported by Seery [36] were used in conjunction with the finite
element analysis program ANSYS [37] to model the temperature difference between the
Pu sample and the sample manipulator thermocouple reading. An additional factor
accounted for is the heat generated as part of the radioactive decay process of plutonium.
The heat output of the sample in this study was calculated [38] to be 4 mW/g based on
the measured isotope concentrations listed in Table 2.7b. Figure 2.20 shows the results
from a simulation of the temperature gradient across the sample manipulator. In this
particular case, the -5o C temperature would be the temperature reading of the
thermocouple; the analysis shows that the sample temperature is +2o C. As part of this
investigation, five temperature gradients were simulated.
Regressional analysis of this data set was performed. The result is plotted in
Figure 2.21. The lowest temperature modeled was -100o C. The results indicate that this
thermocouple reading is equivalent to a sample temperature of -70o C. The temperatures
given throughout this work will be the temperatures calculated from the fit of modeled
temperatures presented in Figure 2.21. Several oxidation experiments presented as part of
this thesis were performed at lower measured temperatures than the lowest modeled
manipulator temperature. For instance, utilizing the plotted fit in Figure 2.21, a measured
manipulator temperature of -150o C is equivalent to a sample temperature -102o C.

54
Regardless of the value obtained from the fit, these temperatures will be stated as “less
than -70o C” to stay within the temperature range that were actually modeled.
2.8 XPS Data Analysis
All data analysis presented in this thesis was performed with CasaXPS® [39]. The
separation of Pu 4f XP spectra into their individual components can be difficult and
subject to variation in the fitted values due to factors such as start and end of the
background region, full width-half max (FWHM) of each component peak, and
Gaussian/Lorentzian character of the component peaks, among other factors. Small
changes in these parameters can lead to variation in the determined values of Pu3+/Pu4+ as
well as the O/Pu concentration ratios. Great care has been taken to systematically analyze
all of the data presented here with the same model (i.e. same peak shapes, FWHM, etc.)
and boundary conditions.
The background intensity in XP spectra arises from the inelastic scattering of
photoelectrons within the surface region. In order to achieve accurate quantification of
the data, the background intensity in the XP spectra must be removed. The two types of
backgrounds typically employ for XPS modeling are linear and non-linear. The linear
background simply removes the background by approximating a straight line before and
after the peak resulting in the removal of all the area beneath the photoelectron peak.
While simple and efficient for symmetrical peaks with small background intensities, it is
not an accurate reflection of the physics that govern the background intensity in an XPS
spectrum. It is particularly ill-suited for large backgrounds and asymmetrical

55
photoelectron peaks, two characteristics that the 4f photoelectron signals of plutonium
possess. The second type of background modeling is the non-linear. Numerous non-linear
backgrounds have been developed [3], including Tougaard, Shirley, cubic spline, and
many ‘blended’ combinations. The varied selection of non-linear background to choose
from is an indication of the subjective manner with which surface scientists apply them.
Among these, the Shirley background [40] is among the most commonly used models as
it is realistic enough to allow for reproducible quantification of photoelectron signals. It is
the model chosen for quantification in this work.
The basic feature of the Shirley [40] algorithm is the iterative determination of the
background beneath the peak areas A1, and A2 to compute the background intensity S(E)
at energy E,
where κ is the step in the background and is equal to . Since A1(E) and A2(E) are
not known without knowing the background intensity S(E), The calculation of Shirley
background from spectral data is an iterative process. Once the calculated value for S(E)
converges, its area is subtracted from the spectrum and the peak areas A1(E) and A2(E) are
determined.
Core photoelectrons appear in XP spectra in a variety of line shapes. The
particular shape is a combination of the physics involve in the process and the
instrument’s resolution. Ideally, a convolution of a Gaussian and Lorentzian function can

56
be employed to model the line shape of an observed peak in a spectrum. The Gaussian
component describes the measurement process (x-ray line shape, instrument response)
and the Lorentzian component models the lifetime broadening of the transition due to the
uncertainty principle [41]. In reality, spectral signals are complex shapes that may have
theoretical justified asymmetry or be a function of the instrument’s inability to resolve
the line shape accurately. Additionally, the uncertainty of the background shape modeling
may also be a consideration. Thus, many synthetic line-shape functions are available to
fit XP spectra. It is up to data analyst to choose an appropriate line-shape and to apply it
as objectively as possible to the entire data set when attempting to draw conclusions from
XPS data.
After extensive evaluation of the plutonium 4f core photoelectron line shape, a
modified Lorentzian asymmetric function [41] was selected to fit the signal. The
Lorentzian line shape with FWHM F and energy E (in kinetic energy) is given by
1
1 4
The line shape is obtained from
,
where the parameters α and β
33
1 4 3
3
1 4

57
determine the spread of the tail for the Lorentzian curve at either side resulting in a
steeper edge of the line shape. The modified Lorentzian line shape utilized for fitting the
Pu 4f XPS signal in this work has the form LF (α, β, w, m). The function is identical to
the LA (α, β) presented above. The w damping parameter forces the tail to reduce toward
the limit of integration. The m parameter defines the width of the Gaussian component of
the function. The asymptotic form of the LF line shape is equivalent to the theoretical
Doniach-Sunjic (D-S) asymmetric line shape. Thus, this line shape is a practical solution
to the infinite nature of the D-S line shape.
Plutonium metal has a broad spectral feature at 284.2 eV corresponding to the
5p1/2 photoelectron [11, 42] and very little adventitious carbon due to the sputter cleaning
process, making use of the C 1s as an energy reference difficult. Thus, binding energies
for all data reported here were referenced to the Pu 4f7/2 transition for Pu3+ at 424.4 eV.
After referencing, binding energies for the remaining transitions of interest are as
follows: Pu 4f7/2 for the Pu4+ species at 426.0 eV and metal at 422.2 eV, O 1s at 530.2 eV
for the sesquioxide oxygen, 529.8 eV for the dioxide oxygen, and 532.2 eV for a possible
surface hydroxyl species or some other oxygen‐containing species. These binding
energies are consistent with values previously reported [11, 42-45].
A significant amount of effort was invested to consistently analyze, as a whole,
the data presented in this work in order to quantitatively and qualitatively compare the
results and reach valid conclusions regarding the stoichiometries of the prepared oxide
films. The plutonium oxide film stoichiometry was determined by: 1) Using only the

58
intensity of the oxide oxygen species at ~ 530 eV. 2) Subtracting any metallic plutonium
contribution from the Pu 4f envelope so that only the oxidized plutonium Puox (Pu3+ and
Pu4+) species are used. Accurate fitting of the Pu 4f spectral features is necessary for
quantification of the data. As has been illustrated elsewhere, it is difficult to do this
accurately [46]. The next figures, will present XPS Pu 4f regions of a variety of
plutonium surfaces and the contributions assigned (Pu0, Pu3+, and Pu4+) to each spectrum.
The Shirley background model and the modified asymmetric Lorentzian line shape “LF”
465 460 455 450 445 440 435 430 425 420 415 410
Pu 4f7/2
Inte
nsity
(A
. U.)
Binding Energy (eV)
Pu3+
Poor Data Fit
Pu 4f5/2
Figure 2.22: Plot of the plutonium 4f XP spectrum (grey squares) of a Pu2O3 surface showing two synthetic peaks (blue traces) and the Shirley background (gray trace) used to fit the data set. With only two synthetic peaks employed, there are two regions within the Pu 4f envelope where the fit to the data is poor (red arrows).

59
found in the CasaXPS® software [41] was employed to fit all the data discussed here.
Figure 2.22 shows the XP spectrum of the Pu 4f photoelectron for a Pu2O3 surface
as gray squares. The black trace over the experimental data points corresponds to the sum
of the background and the two asymmetrical Lorentzian synthetic peaks used to fit the
data (424.4 and 437.2 eV). The Pu 4f7/2 peaks exhibits excellent fit with a single LF
synthetic component. In the case of the Pu 4f5/2 which is also fitted with a single LF
synthetic component, the fit is adequate for most of the peak but there is a region at
approximately 440 eV where the fit is poor. Despite considerable efforts invested varying
the LF synthetic peak parameters (α, β, w, m discussed previously) in an attempt to find
the optimal combination, the area cannot be properly fitted without degrading the overall
fit of the peak. Additionally, there is a region at approximately 453 eV where the fit is
poor. Figure 2.23 shows the same data set as in Figure 2.22 with a different fit. The Pu
4f7/2 and 4f5/2 are fitted with a pair of LF synthetic peaks and an additional pair of
‘satellite’ peaks has been added at 440.2 eV and 453.0eV. It is unclear whether these
previously unreported low intensity features are due to satellites, such as the ‘shake-up’,
or some other process. The energy difference between the two synthetic peaks is 12.8 eV,
the same energy difference as the spin orbit splitting of the 4f7/2 and 4f5/2 peaks. The 12.8
eV energy difference of the two synthetic peaks is the right amount to result in a
satisfactory fit for the entire Pu 4f envelope. It is possible that the added intensity at 440.7
eV may be due to greater asymmetry of the 4f5/2 when compared to the 4f7/2. This
explanation, however, leaves the intensity at 453.0 eV as an unexplained phenomenon.

60
465 460 455 450 445 440 435 430 425 420 415 410
Pu 4f7/2
Inte
nsity
(A
. U.)
Binding Energy
Pu3+ sat.
Pu 4f5/2
Figure 2.23: Plot of the plutonium 4f XP spectrum (grey squares) of a Pu2O3 surface showing two main synthetic peaks, two satellite synthetic peaks (blue traces centered at 440.2 and 453.0 eV) and the Shirley background (gray trace) used to fit the data set. The addition of the two satellites affords a better overall fit than with just two components, as in Figure 2.22.
The intensity of all four synthetic peaks was taken into account during determination of
the relative atomic concentration of the Pu3+ species.
Figure 2.24 shows an XP spectrum of a surface with a Pu4+ film on top of a Pu3+
oxide film. The knowledge of the Pu3+ spectral envelope, discussed previously, allows for
reasonably accurate determination of the representative XP spectra and relative atomic

61
460 455 450 445 440 435 430 425 420 415 410
Pu 4f7/2
sat.
Pu4+
Inte
nsity
(A
. U.)
Binding Energy (eV)
Pu3+
Pu 4f5/2
Figure 2.24: Plot of the plutonium 4f XP spectrum (grey squares) of a PuO2/Pu2O3 (Pu4+/Pu3+) surface showing the data fit (black trace) as well as the synthetic peaks for the Pu3+ species (blue traces : 424.4 eV, 437.2 eV,440.2 eV, and 453.0 eV) , the Pu4+ species (green traces: 426.0 eV, 433.0 eV, 438.6 eV, and 445.5 eV), and the Shirley background (gray trace) used to fit the data set.
concentration of the Pu4+ species. The resulting fit of the Pu4+, with two main synthetic
peaks and a pair of satellites agrees with what has been previously observed [47].
Figure 2.25 shows the XP spectrum representative of the cleanest plutonium
surface prepared during the course of the work presented in this thesis. Nevertheless, two
features (blue trace) attributed to Pu3+ can be clearly observed. There is controversy

62
460 455 450 445 440 435 430 425 420 415 410
Pu 4f7/2
Inte
nsity
(A
. U.)
Binding Energy (eV)
Pu3+
Puo
Pu 4f5/2
Figure 2.25: Plot of the plutonium 4f XP spectrum (grey squares) of a Pu metal with a small amount of Pu3+ on the surface showing the data fit (black trace) as well as the synthetic peaks for the Pu3+ species (blue traces), the Pu metal species (red traces: 422.2 eV, and 435.1 eV), and the Shirley background (gray trace) used to fit the data set.
regarding the nature of this high binding energy shoulders on the main 4f photoelectron
doublet; they have been attributed to ‘poorly screen’ 4f photoelectrons from Pu metal
[47]. It has been observed in the course of this work, however, that the feature in
question is directly related to the amount of oxygen, and thus Pu3+, on the surface of the
metal. The source of the oxygen is likely due to the presence of small amounts of oxide in
the bulk or reaction of the surface with residual gas in the UHV chamber.

63
2.9 Plutonium Sensitivity Factor Determination
Accurate relative sensitivity factors (RSF) for transitions of interest are required
for quantification of surface species with XPS. Relative sensitivity factors take into
account variables such as the photoelectron cross-section and analyzer transmission
efficiency (i.e., transmission function). The RSF's for a given instrument are typically
provided by the instrument manufacturer. For the quantification of XP spectra in this
work, a value of 0.78 was used for the O 1s data and 0.278 for the C 1s data (both relative
to a F 1s value of 1), as provided by the instrument manufacturer [21]. However, no RSF
was provided for plutonium, as it is a hazardous and radioactive material with strict
access and handling requirements.
There are several reports of the Pu 4f RSF in previous studies. One such study
used calculated photoelectron cross-sections and a known sensitivity factor (U 4f) to
determine the RSF for Pu 4f and other transuranics [46]. A value of 17.87 was reported
for the Pu 4f region (10.21 for the Pu 4f7/2) relative to a F 1s value of 1. Another study in
which data from oxidized plutonium was used to experimentally determine the Pu 4f RSF
reported a value of 92.1 relative to a C 1s value of 1 [48]. These values, when referenced
to the same transition, are different by approximately 25% [48]. This would lead to a
corresponding relative concentration variation of 25% on Pu surfaces depending on the
RSF used. In order to be more confident in the oxygen to plutonium relative atomic
concentration ratios reported in this work, a RSF for the Pu 4f transition has been
determined as part of this work.

64
The RSF for plutonium used throughout this thesis was estimated by comparison
of calculated photoelectron cross-sections [49] to RSF’s for other 4f transitions provided
with the instrument from the manufacturer. This resulted in a value of 20.62 for the Pu 4f
transition relative to a F 1s value of 1.00. Using the RSF for the C 1s transition provided
with the instrument used here (0.278), a value of 74.18 for the Pu 4f transition is obtained
when setting the C 1s value at 1. The Pu 4f RSF obtained here is between the two values
previously reported [46, 48]. Further confidence can be gained in the RSF by comparing
quantification results from data with known stoichiometries.
For determination of relative atomic concentrations from XP spectra, a plutonium
relative sensitivity factor (RSF) of 22.68 (relative to a F 1s value of 1) was used. This
value was adjusted from the calculated 20.62 (discussed before) in order to most
accurately represent the stoichiometry of plutonium dioxide (assuming; for PuO2, O/Pu =
2.00) in all of the relevant data collected in our laboratory with this instrument. It is
possible that this determination of the RSF, and therefore the reported atomic
concentrations, may not be absolutely correct. However, all comparisons of relative
concentrations (stoichiometries) remain valid, as even if the RSF is incorrect, all O/Pu
ratios must be scaled equally.

65
References
[1] McNaught, A. D. and Wilkinson, A., Compendium of Chemical
Terminology, The Gold Book, 2nd Edition, (Blackwell Science, 1997).
[2] Koopmans, T., Physica, 1 (1933) 104.
[3] Briggs, D. and Seah, M. P., Practical Surface Analysis, Volume 1: Auger
and X-ray Photoelectron Spectroscopy, 2nd Edition (John Wiley & Sons,
New York: 1990), p. 114.
[4] Tougaard, S. and Sigmund, P., Phys. Rev. B, 25 (1982) 4452.
[5] Tougaard, S., Surf. Interface Anal., 11 (1988) 453.
[6] Briggs, D. and Seah, M. P., Practical Surface Analysis, Volume 1: Auger
and X-ray Photoelectron Spectroscopy, 2nd Edition (John Wiley & Sons,
New York: 1990), p.106.
[7] Burroughs, P., Hamnett, A., Orchard, A. F., Thomton, G., J. Chem. Soc.
Dalton Trans., 17 (1976) 1686.
[8] Fitton, G. , X-Ray fluorescence spectrometry, in Gill, R. (ed.), Modern
Analytical Geochemistry: An Introduction to Quantitative Chemical
Analysis for Earth, Environmental and Material Scientists, (Addison
Wesley, Longman, UK: 1997).
[9] Auger, P., Cr. Hebd. Acad. Sci., 177 (1923) 169.

66
[10] Auger, P., Cr. Hebd. Acad. Sci., 180 (1925) 65.
[11] Baptist, R., Courteix, D., Chayrouse, J., Heintz, L., J. Phys. F:Met. Phys.,
12 (1982) 2103.
[12] Muilenburg, G. E., Handbook of X-ray Photoelectron Spectroscopy,
(Perkin-Elmer, Eden Prairie, MN:1979)
[13] Semak, B. S., van der Marel, C., Tougaard, S., Surf. Interface Anal., 33
(2002) 238.
[14] Kover, L., Tougaard, S., Toth, J., Daroczi, L., Szabo, I., Langer, G.,
Menyhard, M., Surf. Interface Anal., 31 (2001) 271.
[15] Chaparro, A. M., Maffiotte, C., Herrero, J., Gutierrez, M. T., Surf.
Interface Anal., 30 (2000) 522.
[16] Butcher, K. S. A, Tansley, T. L., Li, X., Surf. Interface Anal., 25 (1997)
99.
[17] Arranz, A., Palacio, C., Surf. Interface Anal., 29 (2000) 392.
[18] Larson, D. T., Adams, R. O., Surface Science, 47 (1975) 413.
[19] Auger spectrum courtesy of Dr. D. P. Moore.
[20] Swagelok Corporation, www.swagelok.com.

67
[21] Operator’s Manual 39-306, Kratos Analytical, Wharfside, Trafford Wharf
Road, Manchester, M17 1GP, U. K.
[22] Haschke, J. M., Diffusion and Intermetallic Formation in the Pu-Fe
System, Memorandum NMT-5:98-001, Los Alamos National Laboratory,
OCT 1997.
[23] Pahl, R. G., Lahm, C. E., Hayes, S. L., J. Nucl. Mater., 204 (1993) 141.
[24] Chavarria, R., Koman, D., Actinide Research Quarterly, 1st/2nd Quarter
(2008) 14.
[25] Tantalum rod, 99.95%, 16 mm diameter. Part # 156-249-29; Goodfellow
Corporation, 305 High Tech Drive, Oakdale, PA 15071, USA.
[26] Wick, O. J., Plutonium Handbook- A Guide to the Technology, Vol. I &
II, (American Nuclear Society: 1980), p. 121.
[27] Mills, I., Cvitas, T., Homann, K., Kallay, N., Kuchitsu, K.,Eds.,
Quantities, Units, and Symbols in Physical Chemistry 2nd Edition,
(Blackwell Science: 1997).
[28] Gas Drying Unit (stock No. 26840); W. A. Hammond DRIERITE Co.
LTD., Xenia, OH 45385.
[29] BOC Edwards Item No. D029-00-390; BOC Edwards, Manor Royal,
Crawley, West Sussex, RH10 2LW, U.K.

68
[30] BOC Edwards Item No. D386-61-000; BOC Edwards, Manor Royal,
Crawley, West Sussex, RH10 2LW, U.K.
[31] Varian Vacuum Technologies, Lexington, MA 02421.
[32] Sar-El, H. Z., Nucl. Intrum. Methods., 42 (1966) 71.
[33] O2 gas, 99.99% ; Scotty Specialty Gases, Air Liquide America Specialty
Gases, 6141 Easton Road, Plumsteadville, PA 18949.
[34] Plutonium metal sample and the purity analysis provided by Dr. F. J.
Freibert.
[35] Dr. P. Roussel, private communication.
[36] Seery, W. N., J. Nucl. Mater., 25 (1968) 64.
[37] ANSYS, Inc., Southpointe, 275 Technology Dr., Canonsburg, PA 15317
USA.
[38] Wick, O. J., Plutonium Handbook- A Guide to the Technology, Vol. I &
II, (American Nuclear Society:1980), p. 8.
[39] Fairley N., CasaXPS®, Casa Software LTD., Bay House, 5 Grosvenor
Terrace, Teignmouth, Devon, TQ14 8NE, UK.
[40] Shirley, D. A., Phys. Rev. B, 5 (1972) 4709.

69
[41] Fairley, N. and Carrick, A., The Casa Cookbook: Recipes for XPS Data
Processing, (Acolyte Science, Manchester, England:2005).
[42] Tull, S., Ph.D. Thesis, University of Wales, Cadiff, U. K., 2003.
[43] Terry, J., Schulze, R. K., Farr, J. D., Zocco, T., Heinzelman, K.,
Rotenberg, E., Shuh, D. K., van der Laan, G., Arena, D. A., and Tobin, J.
G., Surf. Sci. Lett., 499 (2002) L141.
[44] Veal, B. W., Lam, D. J., Diamond, H., Hoekstra, H. R., Phys Rev. B, 15
(1977) 2929.
[45] Farr, J. D., Schulze, R. K., Neu, M. P., J. Nucl. Mater., 328 (2004) 124.
[46] Gouder, T. and Havela, L., Mikrochim. Acta, 138 (2002) 207.
[47] Courteix, D., Chayrouse, J., Heintz, L., Baptist, R., Solid State Comm., 39
(1981) 209.
[48] Morrall, P., Roussel, P., Jolly, L., Brevet, A., and Delaunay, F., J. Nucl.
Mater., 385 (2009) 15.
[49] Scofield, J. H., J. Electron Spectrosc., 8 (1976) 129.

70
Chapter 3: Early Stages of Plutonium Oxidation
While the oxidation states, stoichiometries and crystallographic structure of the
plutonium oxides (PuO2 & Pu2O3) in the bulk powder form have been studied and
elucidated [1-4], the body of knowledge regarding the nature of oxide films on the metal
surface is not as extensive. Using the results from these bulk oxides investigations as
justification, many studies on Pu oxidation and the Pu-oxide thin film system assumed
that the oxide is composed of plutonium sesquioxide as the stable oxide at the oxide-
metal interface on a plutonium metal surface [5-8]. However, there are practically no
published data investigating the earliest stages of plutonium oxidation, or how factors
such as temperature, pressure, and time may affect the oxide formed on a Pu metal
surface. If we are to expand our knowledge of the corrosion of plutonium, the earliest
stages of this process must be understood.
In this chapter, the effects of temperature, pressure, dose and time on very thin
plutonium oxide films on clean metal will be investigated in order to determine how the
oxide film composition is affected. The results show that extrapolation of behavior in
bulk oxides to thin films is not as straightforward as historically assumed for plutonium.
A new oxide, Pu2O3-y, will be proposed at the metal-oxide interface.
3.1 Oxygen Exposures of Clean Plutonium Metal
In order to investigate the initial stage of the oxidation of plutonium metal, XPS
was employed to construct oxygen uptake curves by determining the atomic

71
concentrations of plutonium and oxygen on the surface of a metal sample as a function of
oxygen gas exposure. The Pu 4f XP spectra obtained after each oxygen dose were fitted
to separate the Pu metal component (422.0 eV) from the oxidized Pu component (424.4
eV), which in these small oxygen exposures experiments is the Pu3+ species. The O 1s XP
spectra were fitted to separate the oxide signal (530.0eV) from possible surface hydroxyl
species (532.0 eV). The experimental details, including assumptions for the data analysis,
sensitivity factors, and data fitting parameters, were described in detail in the
experimental section. For these particular experiments presented below, a clean
plutonium metal surface was prepared by repeated cycles of argon ion sputtering and
annealing (450o C) until the carbon 1s and oxygen 1s signals were below the limits of
detection for the instrumental conditions employed here.
The results for the sequential oxygen exposure of a clean plutonium metal surface
at two different pressures, 10-7 and 10-8 Torr, are shown in Figure 3.1. For the exposures
performed at 10-7 Torr in 10 L increments (L = Langmuir = 1×10⁻⁶ Torr·s), nearly 100%
of the Pu 4f signal corresponds to Pu3+ at exposures greater than 30 L. The 10-8 Torr
exposure data (2 L increments) show that a small amount (~20%) of plutonium metal is
still observed at exposures of 30 L. The corresponding O:Puox stoichiometric values,
while similar for the two experiments, differ significantly from the value typically
assumed for plutonium sesquioxide (O:Pu =1.5), as illustrated in Figure 3.1a. The
average oxygen to oxidized plutonium atomic ratio for the 10-8 Torr incremental exposure
is ~1.1, regardless of total cumulative oxygen dose. Incremental exposures at 10-7 Torr of

72
0 10 20 30 40 50 60 70 80
0.0
0.2
0.4
0.6
0.8
1.0
0 10 20 30 40 50 60 70 800.6
0.8
1.0
1.2
1.4
1.6
b)
Pu3+
/PuTot
[10-7
Torr O2]
Pu3+
/PuTot
[10-8
Torr O2]
Pu0/Pu
Tot [10
-8 Torr O
2]
Pu0/Pu
Tot [10
-7 Torr O
2]Pu
sp/P
uT
ot
Langmuir
a) 10-7 Torr O2
10-8 Torr O2
O2-/P
u3
+
Langmuir
O2-/Pu3+: 1.11
Figure 3.1: Sequential oxygen exposure at 26o C. Results from XPS analysis of a clean plutonium metal surface exposed to O2 at 1x10⁻⁸ Torr (open symbols) and 1x10⁻⁷ Torr (solid symbols). The oxygen to oxidized plutonium (O2-/Pu3+) concentration ratios are shown in a) and the relative intensity ratios of metal (Puo/PuTot) and trivalent plutonium (Pu3+/PuTot) in b).
oxygen (up to 80 L) also show an O2-:Puox ratio of ~1.1. This value remains constant from
very thin oxide films at the lowest two exposures of 10 and 20 L, where the oxidized
plutonium accounts for ~65% and ~90% of the Pu 4f signal respectively, to the 80 L data
point where the Pu 4f signal is due entirely to oxidized plutonium. The C 1s region for
both experiments was monitored to ensure the absence of carbon, especially oxy-carbide
species, throughout the duration of the experiments to ensure that no surface carbon
contamination was occurring. Figure 3.1b indicates that the initial stage of oxidation is

73
faster at 10-8 Torr, as shown by the higher initial slope in the growth of the Pu3+ species.
However, when the pressure difference of the two experiments is considered (factor of
10), the oxidation of plutonium at 10-8 Torr occurs much more slowly than at 10-7 Torr.
Using the time elapsed for the Pu 4f XPS signal to be 50% Pu metal and 50% Pu3+ as a
point of reference, the 10-8 Torr exposures (220 seconds) is approximately thirteen times
slower than the 10-7 Torr exposure (17 seconds).
460 450 440 430 420 410544 540 536 532 528 524 520
Binding Energy (eV)
b)
Pu 4f
1.35
1.22Inte
nsi
ty (
A.U
.)
1.081x10⁻⁸Torr
5x10⁻⁸Torr
1x10⁻⁷Torr
O2-/Puox
O 1s
a)
Figure 3.2: 30 L oxygen exposure at different pressures. XP spectra from the a) O 1s and b) Pu 4f regions for three plutonium oxide films grown by exposure to 30 L of O2 at 1x10⁻⁷ Torr (green), 5x10⁻⁸ Torr (blue), and 1x10⁻⁸ Torr (red). All spectra are normalized to the Pu 4f area.

74
Figure 3.2 shows XPS data for the O 1s and Pu 4f spectral ranges, which contain
information about the chemical environment of the elements in the thin oxidized film.
The spectra shown are from another set of experiments in which clean plutonium metal
surfaces were exposed to a single dose of 30 L of oxygen at 1×10⁻⁸, 5×10⁻⁸, and 1×10⁻⁷
Torr. These include the same exposure pressures as were used for the studies presented in
Figure 3.1. The oxygen exposures in Figure 3.2 were performed in a single step, as
opposed to multiple steps used in Figure 3.1. The 30 L exposure at 1×10⁻⁸ Torr of oxygen
produced an oxide film with an O/Puox ratio of 1.08, close to the average value of 1.11
obtained for the films prepared in Figure 3.1. However, unlike Figure 3.1, this single-step
30 L exposure resulted in oxidation of nearly all (~95%) of the plutonium observed in the
near-surface region. For a single-step 30 L exposure at 1×10⁻⁷ Torr of oxygen, a O2-/Puox
value of 1.35 was observed, as opposed to an average value of 1.11 for the sequential 30
L exposure. The Pu 4f region also shows the absence of metallic Pu, indicating that the
analyzed surface is composed entirely of oxide. The exposure at 5×10⁻⁸ Torr resulted in
Table 3.1: Change in stoichiometry, with time, of a single-step 30 L oxygen exposure at varying pressures.
Exposure Pressure (Torr)
Stoichiometry (O2-/Pu3+)
Initial Analysis
After 12 hrs. in UHV
10-8 1.08 1.08
5*10-8 1.22 1.20
10-7 1.35 1.20
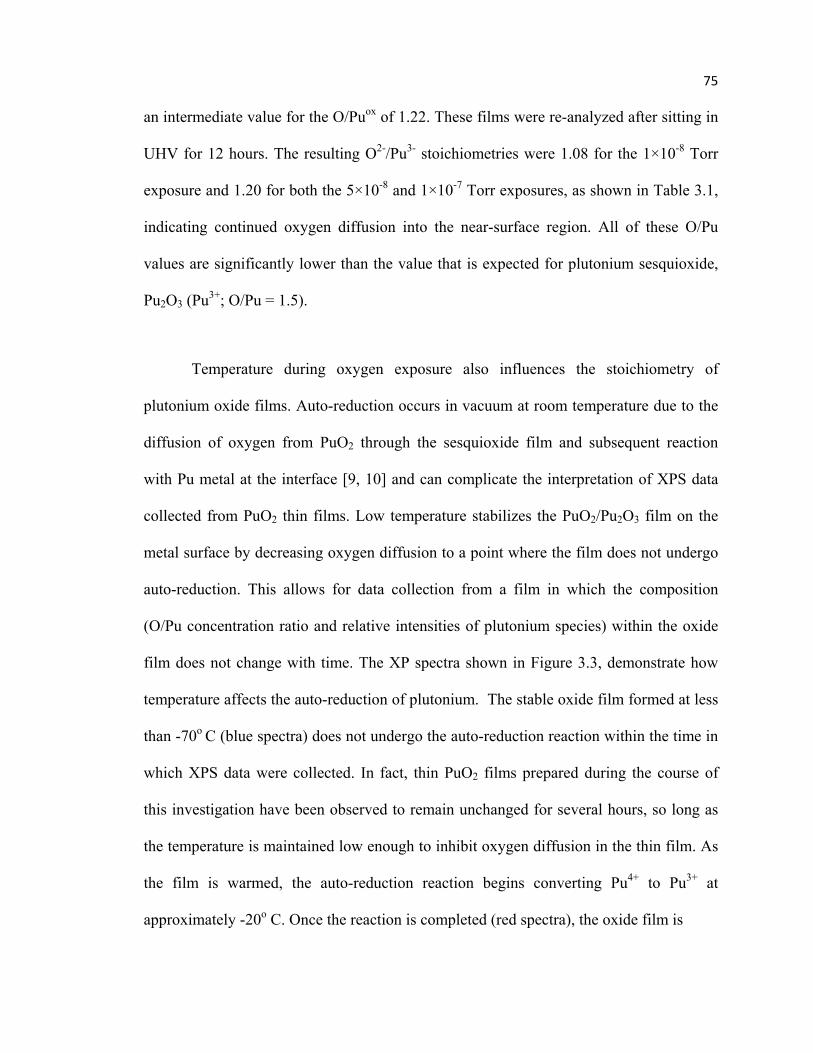
75
an intermediate value for the O/Puox of 1.22. These films were re-analyzed after sitting in
UHV for 12 hours. The resulting O2-/Pu3- stoichiometries were 1.08 for the 1×10⁻⁸ Torr
exposure and 1.20 for both the 5×10⁻⁸ and 1×10⁻⁷ Torr exposures, as shown in Table 3.1,
indicating continued oxygen diffusion into the near-surface region. All of these O/Pu
values are significantly lower than the value that is expected for plutonium sesquioxide,
Pu2O3 (Pu3+; O/Pu = 1.5).
Temperature during oxygen exposure also influences the stoichiometry of
plutonium oxide films. Auto-reduction occurs in vacuum at room temperature due to the
diffusion of oxygen from PuO2 through the sesquioxide film and subsequent reaction
with Pu metal at the interface [9, 10] and can complicate the interpretation of XPS data
collected from PuO2 thin films. Low temperature stabilizes the PuO2/Pu2O3 film on the
metal surface by decreasing oxygen diffusion to a point where the film does not undergo
auto-reduction. This allows for data collection from a film in which the composition
(O/Pu concentration ratio and relative intensities of plutonium species) within the oxide
film does not change with time. The XP spectra shown in Figure 3.3, demonstrate how
temperature affects the auto-reduction of plutonium. The stable oxide film formed at less
than -70o C (blue spectra) does not undergo the auto-reduction reaction within the time in
which XPS data were collected. In fact, thin PuO2 films prepared during the course of
this investigation have been observed to remain unchanged for several hours, so long as
the temperature is maintained low enough to inhibit oxygen diffusion in the thin film. As
the film is warmed, the auto-reduction reaction begins converting Pu4+ to Pu3+ at
approximately -20o C. Once the reaction is completed (red spectra), the oxide film is

76
540 536 532 528 524 460 450 440 430 420 410
Pu 4f
b)
Inte
nsity
(A
.U.) < -70oC
26oC
t
a)O 1s
3x
Binding Energy (eV)
Pu3+
Figure 3.3: Plutonium oxide film formed at low temperature (< -70o C, blue spectra). As the temperature increases, Pu4+ is converted to Pu3+. With time, equilibrium is reached (red spectra) at room temperature and the oxide film is 100% Pu3+. The peak at ~534 eV in the O 1s spectrum of the film at 26o C is due to surface contaminants that accumulated on the surface of the oxide film as it warmed.
composed entirely of Pu3+, as interpreted from the Pu 4f XP spectrum with signal at a
binding energy of 424.4 eV. When the sample reaches a temperature of 26o C and the Pu
4f region indicates 100% Pu3+, a peak at 534.0 eV appears in the O 1s XP spectra. This
signal is likely an adsorbed surface-contaminant from residual gases in the system.
Figure 3.4 illustrates the effects of low, as well as high, temperature on the
oxidation of plutonium. The exposure of Pu metal to 30 L of O2 at different temperatures

77
results in oxide films of varying composition. An oxide film of Pu4+ & Pu3+ with an O/Pu
stoichiometry of 1.8 forms at temperatures less than -70o C (blue spectra), representing
results in oxide films of varying composition. An oxide film of Pu4+ & Pu3+ with an O/Pu
stoichiometry of 1.8 forms at temperatures less than -100o C (blue spectra), representing
an overlayer of PuO2 with Pu2O3 beneath. At 75o C (red spectra), the same oxygen dose
results in an oxide film composed 100% of Pu3+ and O/Pu ratio of 1.37. At 26o C (green
spectra), the plutonium is mainly Pu3+ with a very small amount of metal observed,
540 536 532 528 524 460 450 440 430 420
Pu 4f
Inte
nsi
ty (
A.U
.)
4x
O 1s
a) b)
Binding Energy (eV)
< -70oC
26oC
75oC
Figure 3.4: 30 L oxygen exposure at different temperatures. XP spectra from the a) O 1s and b) Pu 4f regions for three plutonium oxide films grown by exposure to 30 L of O2 at < -70o C (blue), 75o C (red), and 26oC (green). All spectra are normalized to the Pu 4f area.

78
indicating a very thin oxide film. While the Pu 4f spectrum is identical to that of the film
grown at 75oC, the O/Pu is only 1.3.
Figure 3.5 shows the XP spectra of a plutonium metal surface exposed to 30 L of
O2 (at 10-7 Torr) at two different temperatures. The red trace shows the XP spectra from
an oxide film grown at 75o C with 30 L of O2. The O/Puox ratio is 1.37 and the
corresponding Pu 4f region shows 100% Pu3+. The black trace (as indicated in the figure)
illustrates the O 1s and the Pu 4f XPS regions of an oxide film grown at < -70o C. The
sample holder was cooled to -150o C, however, since plutonium produces heat due to
radioactive decay, the temperature of the sample is not directly known, but has been
modeled, as part of this thesis, to be < -70o C (a detailed description of the modeling can
be found in the experimental chapter). The oxide film prepared at sub-ambient
temperatures ( < -70o C) was composed of a Pu4+/Pu3+ ratio of approximately 1 with a
small amount of Pu metal (6%) and an oxygen to oxidized plutonium ratio (O2-/ Puox) of
1.71. Also shown as the blue trace in Figure 3.4, is the resulting spectra from allowing the
film obtained by a 30 L exposure at < -70 o C (black trace, discussed above) to warm to
room temperature and undergo auto-reduction. The Pu 4f spectrum now consists entirely
of the Pu3+ species with no metal or Pu4+ observed. The corresponding O 1s spectrum
yields an O/Pu concentration ratio for this film of 1.20. As seen in Figure 3.5, the Pu 4f
spectrum for the film grown at 75o C (red) and for the sub-ambient film warmed to room
temperature (blue) are identical, resembling what is expected for Pu2O3, yet the
corresponding O 1s spectra show that they have different oxygen to plutonium
stoichiometries.

79
460 455 450 445 440 435 430 425 420 415 410
Inte
nsity
(A
. U.)
Binding Energy (eV)
a)
30 L O2; < -70o C
warmed to 26o C
30 L O2; < -70o C
30 L O2; 75o C
538 536 534 532 530 528 526
Inte
nsity
(A
. U.)
Binding Energy (eV)
b)
4x
30 L O2 ; < -70o C
30 L O2 ; 75o C
30 L O2 ; < -100o C
warmed to 26o C
Figure 3.5: XP spectra from a) Pu 4f and b) O 1s regions for two plutonium oxide films grown by exposure to 30 L of O2 at < -70o C (black trace) and at 75o C (red trace).Also shown in blue is the data obtained after allowing the cooled sample to warm to room temperature. All spectra are normalized to the Pu 4f area.

80
The existence of an oxide of plutonium lower in stoichiometry than the
sesquioxide (Pu2O3) has previously been reported [11]. XRD studies of plutonium oxides
on metal indicated the conversion of Pu2O3 upon heating (>250o C) to a rocksalt structure
historically interpreted as the monoxide (PuO). Subsequent investigations employing
XPS concluded that the proposed conversion of Pu2O3 to PuO upon heating was likely
due to the formation of plutonium oxycarbide (PuO1-xCx, x~ 0.3) [12]. The thin oxide
films studied here were grown on clean plutonium surfaces at a variety of temperatures,
all of which are significantly below the temperatures required for the formation of the
oxycarbide. Analysis of the carbon 1s region of the XP spectrum shows no evidence of
carbide (~282 eV) before or after oxygen exposure. In addition, the O/Pu for these thin
films is significantly greater than what would be expected for PuO1-xCx.
3.2 Carbide within the Oxide Film
Figure 3.6 offers a comparison of the representative XP spectra for plutonium
oxycarbide and two plutonium (Pu3+) oxide thin films prepared from clean Pu metal
surfaces as part of this investigation. The black spectra in Figure 3.6 were obtained after
Ar+-ion sputtering to remove surface carbon contamination of a Pu metal sample that had
an oxy-carbide surface layer. While the exact nature of this film is not known, it clearly
exhibits the presence of a carbide-type carbon at 282.6 eV. Quantification of the O 1s and
C 1s data for this oxy-carbide film yield concentration ratios of O/Pu = 1.23 and C/Pu =
0.23. The absence of significant carbide peaks in the C 1s region for the higher
stoichiometry sesquioxide film (O/Pu = 1.37, blue spectra) as well as the lower
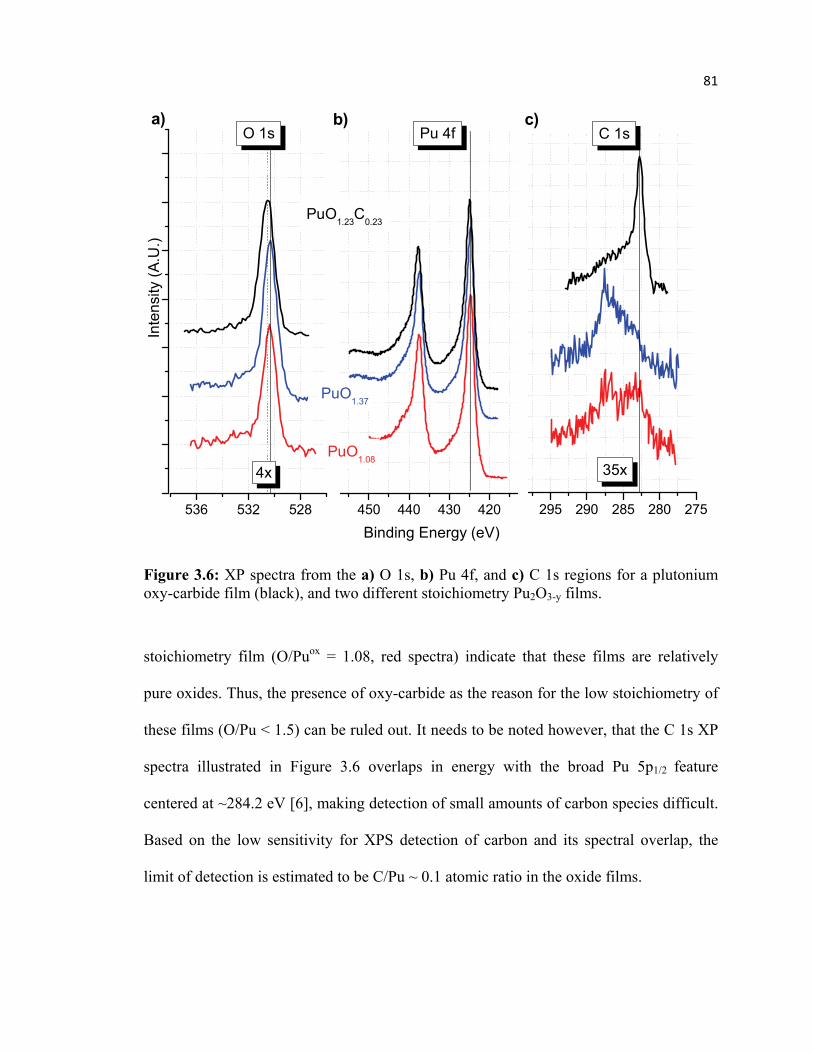
81
536 532 528 295 290 285 280 275450 440 430 420
c)b)Pu 4f C 1s
Inte
nsi
ty (
A.U
.)O 1s
a)
4x
Binding Energy (eV)
35xPuO
1.08
PuO1.37
PuO1.23
C0.23
Figure 3.6: XP spectra from the a) O 1s, b) Pu 4f, and c) C 1s regions for a plutonium oxy-carbide film (black), and two different stoichiometry Pu2O3-y films.
stoichiometry film (O/Puox = 1.08, red spectra) indicate that these films are relatively
pure oxides. Thus, the presence of oxy-carbide as the reason for the low stoichiometry of
these films (O/Pu < 1.5) can be ruled out. It needs to be noted however, that the C 1s XP
spectra illustrated in Figure 3.6 overlaps in energy with the broad Pu 5p1/2 feature
centered at ~284.2 eV [6], making detection of small amounts of carbon species difficult.
Based on the low sensitivity for XPS detection of carbon and its spectral overlap, the
limit of detection is estimated to be C/Pu ~ 0.1 atomic ratio in the oxide films.

82
3.3 Discussion
Another element has also been shown to exhibit uncommon and
thermodynamically unstable bulk oxide phases at the surface of the metal. Unlike
plutonium with its two stable bulk oxides (PuO2 & Pu2O3), neptunium has only one stable
bulk oxide (NpO2, Np4+). However, under a reducing environment (i.e., UHV) the
sesquioxide of neptunium (Np2O3, Np3+) has been shown to form at the surface of the
metal exposed to oxygen gas as a very thin oxide film between the neptunium metal and
thin oxide films that are nominally NpO2 [13]. The set of plutonium data presented in this
chapter clearly indicates that plutonium sesquioxide, under reducing environments,
exhibit a wide range of stoichiometries. The ~100% Pu3+ spectrum in Figure 3.4 (red)
shows the highest O/Pu atomic ratio (~1.4) observed for oxide-films, as measured by
XPS, not containing significant quantities of the Pu4+ species. This value is not
unreasonable, given the ability of films that are nominally Pu2O3 in oxygen content to
support a range of sub-stoichiometric oxygen concentrations under UHV conditions, as
shown here. Even if the relative sensitivity factor (RSF) used for quantification in this
work is not correct, resulting in a low O/Pu value, all O/Pu ratios observed must be scaled
accordingly. If it is assumed that the plutonium oxide film in Figure 3.2 (green trace)
must represent stoichiometric Pu2O3 (i.e., O/Pu = 1.5), the corresponding adjustment of
the Pu 4f RSF would still give low O/Pu ratios ranging from ~1.1-1.4 for all the oxide
films presented of 100% Pu3+ in . This adjustment to the Pu 4f RSF would also give a
concentration ratio for the film containing ~50% Pu4+ shown in Figure 3.4 and 3.5, of
approximately 1.85 -higher than expected stoichiometry based on the Pu 4+/Pu3+ ratio.

83
Although the films shown here exhibit a large range of O/Pu stoichiometries,
analysis of the Pu 4f region shows virtually identical spectra for the entire oxygen content
range. This indicates that, while the formal oxidation state of the plutonium cations in
Pu2O3 must be changing from predominantly 3+ to favor 2+, the electronic structure (as
observed with XPS) is not changing significantly. In the absence of data to help elucidate
differences in the crystallographic structure of the sub-stoichiometric plutonium oxide
films, and the similarity of the Pu 4f XP spectra, they are tentatively described as Pu2O3-y,
y~ 0.2-1 (PuO1.4 – PuO1.0).
An analogous behavior of the Pu 4f region has been observed in plutonium
hydride [14]. The hydride compound exhibits a Pu 4f XP spectrum that is very similar to
what is observed for Pu3+. In fact, the plutonium cation in the hydride is considered to be
trivalent (Pu3+) with a ground state of 5f 5 [15]. However, the hydride chemical formula is
written as PuH2. This oddity is normally explained as plutonium bonding to the
hydrogens with two electrons while the third electron is donated to the conduction band.
Given plutonium’s 5f electrons ability to move into the conduction band, it is reasonable
to expect the oxides of plutonium to exhibit varying stoichiometries as the extra electron
not being used in bonding moves to the conduction band.
3.4 Conclusion
The present data indicates that a sub-stoichiometric plutonium oxide (Pu2O3-y)
exists under reducing environments (i.e., UHV). Based on the high reactivity of
plutonium towards oxygen, it is not unreasonable to expect this sub-stoichiometric

84
behavior to occur near the oxide-metal interface in plutonium oxide thin films. The level
of contaminants, as tabulated in the experimental section of this thesis, of the plutonium
employed for these experiments is extremely low for Pu which may allow for a greater
degree of diffusion of oxygen into the sample. While shown to be stable in the bulk
phase, films of plutonium sesquioxide that are nominally Pu2O3 in composition on clean
plutonium metal show a significant level of stoichiometric instability under reducing
conditions, perhaps similar to what has been shown for plutonium dioxide (PuO2) films
on plutonium metal.

85
References
[1] Gardner, E. R., Markin, T. L., and Street, R. S., J. Inorg. Nuc. Chem., 27
(1965) 541.
[2] Schnizlein, J. G., and Fischer, D. F., J. Electrochem. Soc., 114 (1) (1967)
23.
[3] Raynor, J. B., and Sackman, J. F., J. Nucl. Mater., 23 (1967) 302.
[4] Colmenares, C. A., Prog. Solid St. Chem., 9 (1975) 139.
[5] Larson, D. T., J. Vac. Sci. Technol., 17 (1980) 55.
[6] Baptist, R., Courteix, D., Chayrouse, J., and Heintz, L., J. Phys. F:Met.
Phys., 12 (1982) 2103.
[7] Stakebake, J. L., Larson, D. T., and Haschke, J. M., J. Alloys Comp., 202
(1993) 251.
[8] Tull, S., 2003 Ph.D. Thesis, University of Wales, Cadiff, U.K.
[9] Morrall, P., Tull, S., Glascott, J., and Roussel, P., J. Alloy. Compd., 444-
445 (2007) 352.
[10] Haschke, J. M., Allen, J. C., and Martz, J., J. Alloys Compd., 271 (1998)
211.

86
[11] Terada, K., Meisel, R. L., Dringman, M. R., J. Nucl. Mater., 30 (1969)
340.
[12] Larson, D. T. and Haschke, J. M., Inorg. Chem., 20 (1981) 1145.
[13] Naegele, J. R., J. Nucl. Mater., 166 (1989) 59.
[14] Larson, D. T. and Motyl, K. M., J. Electr. Spectr. Rel. Phenom., 50 (1990)
67.
[15] Willis, J. O., Ward, J. W., Smith, J. L., Kosiewicz, S. T., Haschke, J. M.,
and Hodges III, A. E., Physica B, 130 (1985) 527.

87
Chapter 4: AR Reaction of Plutonium Dioxide Films
The oxidation of plutonium metal has received considerable attention [1-3] due to
its importance in the safe handling and storage of nuclear materials. Plutonium metal will
spontaneously ignite at 475o C, due to the highly exothermic nature of its reaction with
oxygen [4]
Pu (s) + O2 (g) → PuO2 (s) ΔHo = -1056 kJ/mol
Small metal particles, such as the metal shavings created from the machining and
processing of the metal, ignite at 150o C [5]. Because of the danger associated with its
unpredictable nature, the pyrophoricity of plutonium is a pressing concern when
establishing guidelines for different storage environments. Elucidation of the oxidation
kinetics of plutonium metal is crucial for understanding the pyrophoricity of plutonium.
In an attempt to investigate the process, Martz and co-workers have proposed a two step
mechanism [6] to qualitatively explain pyrophoricity in which at higher temperatures: (1)
the auto-reduction reaction (AR) of plutonium dioxide (PuO2) to plutonium sesquioxide
(Pu2O3 or PuO1.5)
½ Pu (s) + 3/2 PuO2 (s) → Pu2O3 (s) ΔHo = -73.5 kJ/mol
depletes the PuO2 layer to the point where (2) the reoxidation of Pu2O3 with air to PuO2
occurs
½ Pu2O3 (s) + 1/4O2 (g) → PuO2 (s) ΔHo = -226 kJ/mol

88
The heat generated from these two reactions further heats the sample which only speeds
up the cycle, eventually resulting in pyrophoricity. While this mechanism qualitatively
predicts the ignition temperature of plutonium, it is based on empirical data from
thermogravimetric studies of bulk plutonium metal at high temperatures. Most of the
assertions pertaining to the AR of PuO2, both in an atmosphere of O2 and in vacuum, are
extrapolated from the bulk studies of Pu oxidation. While the AR of PuO2 films to Pu2O3
has been noted in heated metal samples [7], cursorily mentioned at room temperature and
at -196o C [8], and utilized as a tool to ascertain the oxygen diffusion coefficient through
the Pu oxide [9], there has not been any published reports detailing the conditions and
parameters necessary for the AR of plutonium dioxide to occur. The following
investigation of the AR of PuO2 is aimed at understanding the factors affecting this
peculiar attribute of Pu oxidation, as well as an attempt to qualify the validity of the
published conjectures regarding it.
4.1 Current Understanding of the PuO2 AR Reaction
Figure 4.1 illustrates a model of plutonium metal surface oxidation and
subsequent AR reaction to Pu2O3 after removal of oxygen from the headspace, based on
the current knowledge available in the literature [7, 9-11]. Upon exposure to oxygen, a Pu
metal surface quickly oxidizes to Pu3+ which is then further oxidized to Pu4+. With time,
the oxide film is typically described as consisting of a thin Pu2O3 film between Pu metal
and a thick PuO2 film. [1]. Once PuO2 is exposed to a reducing atmosphere, such as
UHV, it quickly reduces to Pu2O3 as the oxygen diffuses through the Pu2O3 layer to react

89
Figure 4.1: Notional diagram of the oxidation of Pu metal and subsequent AR reaction of plutonium dioxide. PuO2 and Pu2O3 layers form on the metal surface when exposed to O2. When the oxygen is removed, PuO2 is converted to Pu2O3.
with Pu metal at the metal-oxide interface. As was the case for the proposed mechanism
regarding the pyrophoricity of Pu, the experimental data supporting this model, however,
was for the most part extrapolated from gravimetric measurements at elevated
temperatures, where the sample weight gains occur sufficiently rapid to be measured in a
reasonable amount of time [12].
4.2 In-situ XPS of Pu Metal Oxidation at Room Temperature
Because the oxidation and AR of PuO2 are dynamic processes, it would be
advantageous to observe the evolution of the oxidation state of plutonium from metal to
Pu3+ and Pu4+ oxidation and back to Pu3+ (the AR reaction), as a function of oxygen/UHV
exposure. To that end, a clean plutonium surface was exposed to oxygen while being
monitored by XPS. While the oxygen pressures that can be probed in-situ with XPS
without permanently disabling the instrument used in the present study are relatively low,
e.g., 10-8 and 5*10-8 Torr, valuable information can be obtained regarding the initial

90
stages of Pu oxidation. Figure 4.2 illustrates the in-situ analysis of a Pu metal surface as it
is exposed to 10-8 Torr O2. The Pu 4f XP spectrum was fitted with the components, as
described previously in chapter 2 of this thesis. Upon oxygen exposure, the Pu metal
(green trace) is converted to Pu3+ (red trace). At the end of the exposure (30.5 L), the Pu
4f signal is composed of 85% Pu3+ and 15% Pu metal, which corresponds to an oxide
0 5 10 15 20 25 30
0.0
0.2
0.4
0.6
0.8
1.0
Puo/PuTot
Pu4+/PuTot
Pusp
/PuT
ot
Oxygen Exposure (Langmuir)
Pu3+/PuTot
0 10 20 30 40 50Length of Exposure (min)
Figure 4.2: In-situ XPS analysis of a Pu metal surface exposed to 10-8 Torr O2 for ~51 min (30.5 L) at 27o C. The XPS Pu 4f peaks were fitted to extract the Pu metal (green), Pu3+ (red), and Pu4+ (blue) species from the signal envelope. The data is plotted as a ratio of the Pu species (Pusp) to the total Pu 4f signal area (PuTot). The lower abscissa is plotted in units of Langmuir (10-6 Torr*sec); the top is in minutes of oxygen exposure. A Pu 4f spectrum was acquired every ~2 minutes. No discernable amount of Pu4+ was observed. Oxygen exposure began at the end of the acquisition of the first XP spectrum (time and exposure = 0)

91
film thickness of approximately 43 Å [13]. Towards the end of the 30.5 L exposure the
rate of growth of the Pu3+ has decreased and the presence of Pu4+ is not detected. It
cannot be ruled out from this experiment, however, whether a Pu4+ oxide film would
form with longer exposures to oxygen.
Figure 4.3 illustrates a second in-situ XPS experiment in which the Pu metal
0 50 100 150 200
0.0
0.2
0.4
0.6
0.8
1.0
Puo/PuTot
Pu4+/PuTot
Pusp
/PuT
ot
Oxygen Exposure (Langmuir)
Pu3+/PuTot
0 10 20 30 40 50 60 70 Time (min)
Figure 4.3: In-situ XPS analysis of a Pu metal surface exposed to 5*10-8 Torr O2 for ~79 min (236 L) at 28o C. The XPS Pu 4f peaks were fitted to extract the Pu metal (green), Pu3+ (red), and Pu4+ (blue) species from the signal envelope. The data is plotted as a ratio of the Pu species (Pusp) to the total Pu 4f signal area (PuTot). The lower abscissa is plotted in units of Langmuir (10-6 Torr*sec); the top is in minutes of oxygen exposure. A Pu 4f spectrum was acquired every ~2 minutes. Oxygen exposure began at the end of the acquisition of the first XP spectrum (time and exposure = 0).

92
surface is exposed to 5*10-8 Torr of O2. At this pressure, the evolution and composition
of the oxide film is dramatically different to the oxygen exposure presented in Figure 4.2.
Upon exposure to oxygen, the metal surface quickly oxidizes to Pu3+, reaching a
maximum at 25 L. At this point PuO2 (Pu4+) begins growing, as the Pu3+ signal decreases.
The Pu4+ intensity reaches a maximum after 150 L of O2 and remains constant until the
exposure ends at 236 L. Figure 4.4 shows a representative XP Pu 4f spectrum acquired
460 450 440 430 420 410
Pu3+
Pu 4f5/2
Inte
nsity
(A
. U.)
Binding Energy (eV)
Pu 4f5/2
Pu4+
Figure 4.4: Typical XP Pu 4f spectrum (grey squares) of the Pu oxide film acquired during the final stage of the oxygen exposure (> 150 L) presented in Figure 4.3. The spectrum shown is the average of the last four spectra acquired (205-236 L). The data fit (black trace) is the sum of the Shirley background (gray trace), the Pu4+ (green traces) and the Pu3+ (blue traces) synthetic peaks.

93
during this exposure interval. The Pu 4f signal is 60% Pu4+ and 40% Pu3+ indicating a 15
Å thick PuO2 film [13]. At the binding energies being monitored during this experiment,
approximately 425 eV (electron kinetic energy of 1062 eV), the probing depth of XPS is
54 Å. Thus, only the uppermost 39 Å of the sesquioxide can be probed. Even though the
PuO2 film has clearly stopped growing during the oxygen exposure presented in Figure
4.3, the sesquioxide beneath the PuO2 most likely continues to grow as oxygen diffuses to
the metal-oxide interface.
Acquisition of the O 1s as well as the Pu 4f XP spectral regions allows for the
determination of the stoichiometry (O2-/PuTot) of an oxide film. Figure 4.5 shows the
stoichiometry of the Pu oxide film grown during the in-situ experiment presented in
Figure 4.3 as well as the subsequent AR of PuO2. Near the end of the 5*10-8 Torr O2
exposure, the stoichiometry was determined to be 1.81. This number agrees well with the
expected stoichiometry (1.80) obtained from the Pu 4f component ratio of Pu4+:Pu3+
(0.60/0.40), assuming O/Pu = 2 for Pu4+ and O/Pu = 1.5 for Pu3+. Once the 5*10-8 Torr O2
atmosphere above the plutonium sample is removed, shown in the second part of Figure
4.5, the 15 Å film of PuO2 immediately begins thinning as oxygen diffuses to the metal-
oxide interface. The oxide film is close to 100% Pu3+ after 600 min with O2-/PuTot = 1.43.
The swift auto reduction of the PuO2 film after the oxygen exposure is completed
indicates that while the PuO2 film remained at a constant thickness during the exposure,
oxygen is diffusing to the metal-oxide interface where the Pu2O3 continues to grow
during the exposure.

94
Fig
ure
4.5
: In-
situ
XP
S a
naly
sis
of a
Pu
met
al s
urfa
ce d
urin
g a
236
L O
2 ex
posu
re (
5*10
-8 T
orr/
78.7
min
) at
28o
C a
nd s
ubse
quen
t AR
of
PuO
2. I
mm
edia
tely
aft
er c
losi
ng t
he o
xyge
n ga
s le
ak v
alve
, th
e in
stru
men
t pr
essu
re d
rops
to
~1*1
0-9 T
orr,
and
the
AR
of
PuO
2 en
sues
.

95
4.3 Effect of Temperature on the AR of PuO2
At room temperature, the AR of PuO2 consumes the dioxide film in a matter of
hours. The same process only takes a few minutes at 70o C [14]. It stands to reason that at
0 20 40 60 80 100 120 140 1600.2
0.3
0.4
0.5
0.6
0.7
0.8
Pu4+/PuTot
Sa
mp
le Tem
peratu
re ( o C
)
Pu
sp/P
uT
ot
Time after O2 Exposure Ends (min)
Pu3+/PuTot
Temp
AR begins
at ~ -20o C
-120
-110
-100
-90
-80
-70
-60
-50
-40
-30
-20
-10
0
Figure 4.6: XPS Pu 4f region analysis as a function of temperature and time of an oxide film, grown by exposing a Pu metal surface at a temperature of < -70o C to 590 L O2. The XPS Pu 4f indicates the film to be ~65% Pu4+ (red trace, open triangles) and ~35% Pu3+ (blue trace, open squares). The left ordinate corresponds to the Pu species (Pusp) to total Pu 4f signal (PuTot) area ratio; the right ordinate corresponds to the sample temperature (green trace, open circles). The Pu species’ ratio start changing 64 minutes after the exposure ended indicating the beginning of the AR, at a temperature of approximately -20o C (horizontal green arrow). 1
1 Temperatures lower than -70o C, such as those in Figure 4.6, are stated simply as < -70o C throughout this thesis. See experimental section for details.

96
lower temperatures, the AR may slow down enough to render a PuO2 film on metal
substrate stable, at least within the timescales of an XPS experiment. Figure 4.6 shows
the behavior of an oxide film grown on a Pu metal surface at a temperature of < -70o C.
As the sample temperature slowly increases, the Pu species concentration ratio (Pu4+,
Pu3+/PuTot) remains constant, indicating a stable oxide film. 64 min after the end of the O2
exposure (vertical dashed line), the AR begins when the temperature reaches
460 450 440 430 420 410
Nor
mal
ized
Inte
nsity
(A
. U.)
Binding Energy (eV)
21 min at <-70o C
156 min at -23o C
Figure 4.7: XPS Pu 4f spectra of an oxide film grown by 249 L O2 exposure while cooling the metal sample. The first spectrum (red trace) was acquired 21 min after the end of the exposure at a temperature of < -70o C. The oxide film was continually analyzed while the temperature slowly increased. 156 min after exposure (blue trace), the temperature had reached -23o C; the film composition remained stable.

97
approximately -20o C.
During this particular experiment, the PuO2 remained stable for 64 minutes.
Temperature rather than time, however, is the critical factor in PuO2 film stability. As
long as the sample temperature remains below -20o C, the AR is not observed. Figure 4.7
shows two XP spectra of a different experiment where a Pu oxide film was grown by
exposing Pu metal to 249 L O2 while cooling from 26o C to < -70o C. The initial Pu 4f
spectrum acquired (red trace) at < -70o C shows an oxide film composed of ~70% Pu4+
and ~30% Pu3+. This is equivalent to a ~ 20 Å thick PuO2 film atop the sesquioxide [13].
XPS analysis continued while the sample temperature slowly increased, in order to
determine the stability of the film. After 156 min, the temperature had reached -23o C; the
Pu 4f spectrum (blue trace) remained unchanged, indicating a stable oxide film. Shortly
afterwards, while the temperature increased further, the film composition began changing
as the PuO2 decreased in thickness.
4.4 Effect of Temperature on the Growth of Pu Oxide Films
It has been established that the AR of PuO2 ceases at temperatures below -20o C.
This implies that below this temperature, classical diffusion of oxygen through the oxide
film does not occur. Oxidation of Pu metal, however, does occur at low temperatures.
Figure 4.8 shows a 380 L O2 exposure of a Pu metal surface at a temperature of < -70o C
(green trace). This film, grown at a low temperature, has a composition of 63% Pu4+, 34
% Pu3+ and a very small signal (< 2%) of what could be interpreted as metal. These

98
numbers correspond to a PuO2 film of ~17 Å thick [13]. A second oxygen exposure of
249 L O2 is shown in Figure 4.8 (red trace). In this case, the exposure began at 28o C and
continued while the sample was cooled to < -70o C. The composition of this film was
determined to be 69.8 % Pu4+ and 30.2 % Pu3+ which is equivalent to an approximately
19 Å thick PuO2. Dosing the sample while cooling produced the thicker film (~19 Å vs.
~17 Å) even though the oxygen dose was smaller (249 L vs. 380 L). This is not surprising
460 450 440 430 420 410
380 L
Nor
mal
ized
Inte
nsity
(A
.U.)
Binding Energy (eV)
Dosed while cooling to < -70 oC
249 L
Puo
Dosed at <-70oC
Figure 4.8: XP Pu 4f spectra of oxide films prepared under different temperature conditions. A pressure of 1*10-7 Torr was employed for both films. The green trace denotes an oxide film formed by a 380 L O2 exposure to a Pu metal sample at a temperature of < -70o C. The red trace represents a film formed by exposing Pu metal to 249 L at 28o C and continuing the exposure while the sample cooled to < -70o C. The dashed vertical line at 422.2 eV indicates the binding energy of the Pu metal 4f7/2 signal.

99
since the exposure that began at 28o C allows for thicker films as oxygen readily diffuses
through the oxide –until the temperature reaches ~ -20o C. At this point, oxygen diffusion
ceases. As long as the temperature is maintained below -20o C, the oxide film remains
stable facilitating XPS analysis of PuO2 film composition.
The question remains: How can oxidation of Pu occur, as evidenced by the
experiment shown in Figure 4.8 at a temperature where it has been established, diffusion
of oxygen does not occur? A possible explanation for this phenomenon is that there is
more than one type of diffusion mechanism. Classical diffusion, as described by
Wagner’s parabolic law [15, 16], is driven by the chemical potential gradient established
across the oxide by the oxygen anions on the oxide-gas interface and the metal cations at
the metal-oxide interface. Since the chemical potential of any process is temperature
dependent, Wagner Law’s diffusion is temperature dependent. Not all diffusion
mechanisms, however, depend on temperature. The Mott-Cabrera (M-C) model [17] of
diffusion describes the growth behavior of thin films that do not follow a parabolic rate
growth; the kinetic growth behavior follows an inverse-logarithmic growth expression. In
this case, diffusion of oxygen is driven by the electrostatic gradient established across the
oxide. The rate limiting step for this process is the tunneling of electrons across the oxide.
Consequently, this type of diffusion is temperature independent, below a critical
temperature. The probability of electron tunneling through a barrier decreases
exponentially and practically drops to zero at ~20 Å. Thus, the M-C model normally
applies to thin, protective oxides such as those formed on tantalum and aluminum metal.
The PuO2 films presented in Figure 4.8 reached a thickness of only 18 Å. Indeed, all the

100
PuO2 oxides presented here exhibit thicknesses no greater than 20 Å. This seems to
indicate that whether at room temperatures (in-situ experiments) or at temperatures below
-20o C, the growth of PuO2 films on metal may be governed by factors other than
chemical potential gradients (Wagner’s law).
4.5 Thick PuO2 films
As was mentioned, the oxide films prepared during this investigation consist of
very thin PuO2 films (< 20 Å). The low exposure pressures employed could be the reason
for the inability to produce thicker PuO2 films. XPS analysis, due to the reasons discussed
previously, is not conducive for “high” pressure (> 5*10-8 Torr) experiments. However,
the knowledge of the cessation of diffusion at temperatures below -20o C can be used to
grow oxide films that can be analyzed by XPS, as was shown in Figure 4.8 (red trace).
Figure 4.9 illustrates three oxide films grown under different conditions. The green
spectrum is representative of the film grown in the room temperature in-situ experiment
presented in Figure 4.3. The other two oxide films were grown by exposing the Pu metal
sample to oxygen while cooling in order to effectively “freeze” the film as it is during
room temperature oxidation and thus permit XPS analysis. The thicknesses for the three
films are presented in Table 4.1. The 249 L O2 exposure at 10-7 Torr (blue trace) produced
a ~19 Å PuO2 film while the larger dose of 20,000 L O2 at 10-5 Torr (red trace) yielded a
PuO2 film of ~20 Å. However, visual inspection of the XP Pu 4f spectra (blue and red
trace) corresponding to these two oxygen exposures (249 L and 20,000 L, respectively)

101
460 450 440 430 420 410
10-5 Torr
10-7 Torr
Nor
mal
ized
Inte
nsity
(A
.U.)
Binding Energy (eV)
5*10-8 Torr
Figure 4.9: Comparison of XPS Pu 4f spectra of three oxide films grown under different conditions. The green spectrum represents the room temperature in-situ experiment at 5*10-8 Torr (236 L), the blue spectrum corresponds to a film grown at 10-7 Torr (249 L) while cooling. The red spectrum is of a film grown at 10-5 Torr (20,000 L) while cooling the sample to < -70o C. The process of cooling the metal sample while exposing it oxygen effectively stops the diffusion of oxygen through the oxide film “freezing” the film and allowing for XPS analysis after the exposure ends.
Table 4.1: Overview of thicknesses calculated from the XPS spectra presented in Figure 4.9.
Pressure (Torr)
Exposure (Langmuir)
Pu3+/PuTot Pu4+/PuTot PuO2 Thickness
(Å)
5*10-8 236 40.8 % 59.2 % 14.9
10-7 249 32.3% 67.6 % 18.9
10-5 20,000 30.8 % 69.2% 19.8
102
makes it evident that these two films are essential identical in thickness with very little
difference in the relative intensities of the Pu species. These PuO2 films are representative
of the thickest dioxides prepared during the course of the experiments presented in this
work.
A larger oxygen exposure experiment was performed in the preliminary stages of
this investigation. A Pu metal surface was exposed to 10-4 Torr O2 for 90 min at 27o C
(540,000 L). A significant amount of time (~15 min) elapsed between the end of the
exposure and the start of the XPS analysis while the instrument’s operating pressure was
reached. XPS analysis showed an oxide film composed primarily of Pu3+ as the AR had
consumed most of the PuO2 indicating that the film grown was not much thicker than the
oxide films presented here.
4.6 Nature of the Pu Oxide System
There are three possible Pu oxide models that may be considered: 1) a mixed
valence (Pu3+/Pu4+) oxide film on top of the sesquioxide, 2) PuO2 and Pu2O3 islands
(according to the XPS analysis the composition would be 60-70% PuO2 and 40-30 %
Pu2O3), and 3) a thin PuO2 film on a Pu2O3. The oxygen-plutonium phase diagram has
been extensively studied [18, 19]. There is no evidence that a mixed valence Pu oxide
exists. The in-situ experiment presented in Figure 4.5 shows a kinetic growth process
were Pu2O3 acts as an intermediate for the formation of PuO2:
Pu Pu O PuO

103
PuO2 forms only after the metal, within the probing depth of the technique, has been
oxidized to Pu3+. An island growth mechanism would be expected to show simultaneous
growth of both Pu2O3 and PuO2:
Pu Pu O PuO
Additionally, the ratio of Pu3+:Pu4+ would be expected to exhibit greater variation for an
465 460 455 450 445 440 435 430 425 420 415 410
15o
30o
45o
Nor
mal
ized
Inte
nsity
(A
. U.)
Bindin Energy (eV)
0o
Pu3+ (424.4 eV)
Figure 4.10: Angle dependent XPS experiment of a Pu oxide film maintained at < -70o C. The spectra have been normalized to the Pu3+ signal at a binding energy of 424.4 eV. The angle listed is between the sample surface and the electron analyzer. (0o represents the sample surface normal to the analyzer). The intensity of the Pu4+ (426.0 eV) increases (relative to Pu3+) with increasing angle indicating that the PuO2 film is on the Pu3+ oxide film. The Shirley background has been subtracted from these spectra for clarity.

104
island oxide system [20]. The oxides prepared for this investigation exhibit little variation
of Pu3+:Pu4+ for large ranges of temperature, pressure and exposure (time) preparation
conditions.
Results from an angle dependent XPS (AD-XPS) experiment performed on Pu
oxide films are presented in Figure 4.10. At large angles of analysis, the signal from the
outer-most layer is enhanced at the expense of the signal from the layer beneath as the
probing depth of the technique decreases. The data shows that with increasing angle, the
signal corresponding to the Pu4+ increases, relative to the signal from Pu3+. Thus, the only
model consistent with the data presented here and previous studies is a PuO2 thin film at
the oxide-gas interface.
4.7 Conclusions
The AR has been shown to cease converting PuO2 to Pu2O3 at temperatures below
Figure 4.11: Notional diagram of the AR reaction of plutonium dioxide incorporating the results from this investigation. Upon oxygen exposure, a thin PuO2 layer (< 20 Å) forms at the oxide-gas interface. A thicker Pu2O3 layer form on the metal-oxide interface. When the oxygen is removed, PuO2 is converted to Pu2O3 by the AR of PuO2.
Probing Depth

105
-20o C. This finding contradicts previously published reports [8] which state that the AR
was observed at 77 K (-196o C!). The report did not describe how the temperature was
measured. It is likely that the sample temperature was reported as that of LN2 without
actual temperature measurement.
At the beginning of this chapter, Figure 4.1 was presented to illustrate the state of
knowledge of plutonium oxidation. Figure 4.11 incorporates the results presented in this
chapter regarding the oxidation behavior and oxide composition. The most noticeable
difference between the two diagrams is that the PuO2 film formed is unexpectedly thinner
than previously thought. The plutonium oxide film system consists of a thin PuO2 on a
thicker Pu2O3 film. Within the oxygen pressures investigated (up to 10-4 Torr), the PuO2
film thickness observed do not exceed ~20 Å, similar to the thickness expected for Mott-
Cabrera oxide growth, where electron transport is the rate limiting step. XPS analysis of
Pu oxide films grown during O2 exposure and cooled below -20o C before the exposure
ends, permits the determination of the stoichiometry of oxide without the effects of the
AR of PuO2. The newly found knowledge of the behavior of PuO2 films AR, will
facilitate the study of thin Pu oxide film composition and stoichiometry.
106
References
[1] Haschke, J. M., Allen, T. H., Morales, L. A., Los Alamos Science, 26
(2000) 252.
[2] Haire, R. G., Haschke, J. M., MRS Bulletin, Sep 2001, 689.
[3] Colmenares, C. A., Prog. Solid State Chem., 15 (1984) 257.
[4] Morss, L. R., in The Chemistry of the Actinide Elements, Vol. 2, Katz, J.
J., Seaborg, G. T., Morss, L. R., eds., 2nd edition, (Chapman and Hall,
New York:1986) chap. 17.
[5] Stakebake, J. L., Rocky Flats Report, RFP-4517, 1992.
[6] Martz, J. C., Haschke, J. M., Stakebake, J. L., J. Nucl. Mater., 210 (1994)
130.
[7] Larson, D. T., J. Vac. Sci. Technol., 17 (1980) 55.
[8] Almeida, T., Cox, L. E., Ward, J. W., and Naegele, J. R., Surface Science,
287-288 (1993) 141.
[9] Morrall, P., Tull, S., Glascott, J., Roussel, P., J. Alloy. Compd., 444-445
(2007) 352.
[10] Veal, B. W., Lam, D. J., Diamond, H., Hoekstra, H. R., Phys Rev. B, 15
(1977) 2929.

107
[11] Seibert, A., Gouder, T., Huber, F., Radiochim. Acta, 97 (2009) 247.
[12] Stakebake, J. L., Larson, D. T., Haschke, J. M., J. Alloys Comp., 202
(1993) 251.
[13] ARCtick Angle Resolved XPS Spreadsheet, National Physical Laboratory,
Ver. 1.0, March 1999.
[14] Dr. P. Roussel, A. W. E., private communication.
[15] Wagner, C., Z. Phys. Chem., 21(1933) 25.
[16] Wagner, C., Z. Phys. Chem., 32B (1936) 447.
[17] Cabrera, N., Mott, N. F., Rep.Prog. Phys., 12 (1948) 163.
[18] Chikalla, T. D., McNeilly, C. E., and Skavdahl, R. E., J. Nucl. Mater., 12
(1964) 131.
[19] Boivineau, J. C., J. Nucl. Mater., 60 (1976) 31.
[20] Hauffe, K., Oxidation of Metals, (Plenum Press, New York:1965).

108
Chapter 5: Composition of Oxide Films on Pu Metal Surfaces
As was pointed out in the introduction, plutonium metal readily oxidizes in air to
form a layered oxide system composed of plutonium dioxide (PuO2) at the air-oxide
interface and a plutonium sesquioxide (Pu2O3) at the oxide–metal interface [1-4]. Figure
5.1 illustrates how, at room temperature and in an inert environment such as an ultra high
vacuum (UHV) system, PuO2 undergoes a spontaneous, thermodynamically driven auto-
reduction (AR) reaction where Pu2O3 grows at the expense of the dioxide [5, 6].
Figure 5.1: Change in the plutonium oxide on the metal surface when exposed to reducing environment (UHV).
Given enough time in this environment, the dioxide will be completely converted to the
sesquioxide, as shown in Figure 5.2. The potential usefulness of the AR reaction as a tool
to study the oxidation of plutonium has been previously demonstrated [7]. By analyzing
the rate of dioxide to sesquioxide conversion, a coefficient of diffusion for oxygen
through the sesquioxide was estimated. This previous study relied on the detection of the
Pu3+ (Pu2O3) and Pu4+ (PuO2) cations, as observed with x-ray photoelectron spectroscopy
(XPS).

109
There is no information on the nature of the oxide and how its stoichiometry is
affected by the auto-reduction of PuO2. Generally, it is assumed that the only stable
oxides of plutonium at room temperature are the dioxide and sesquioxide, even for thin
oxide films on metal substrates. As was demonstrated in the previous chapter, very thin
plutonium sesquioxide films under reducing environments support considerable sub-
stoichiometry (Pu2O3-y; y= 0 to 1). It is unclear what role, if any, Pu2O3-y plays in the
oxidation/AR of plutonium. To that end, the AR of plutonium oxide films, both from a
dioxide to sesquioxide conversion, as well as an O/Pu stoichiometry perspective will be
discussed in this chapter.
0.0
0.2
0.4
0.6
0.8
1.0
0 50 100 150 200
Pu
sp/P
uTo
t
Time (min)
Pu3+/PuTot
Pu4+/PuTot
460 450 440 430 420 410
Binding Energy (eV)
PuO2
Pu2O
3
Figure 5.2: Typical behavior of the auto-reduction reaction of PuO2. Pu4+ (redtriangles) decreases with time as the Pu3+ (green diamonds) increases. The inset showsthe initial XP spectrum (red) with a mix of Pu4+ & Pu3+ as well as the XP spectrum(green line) from the end of the plot, around 150 minutes. The red spectrum wasacquired immediately after oxygen exposure of a clean Pu metal surface. The greenspectrum was acquires after the AR had run its course, converting Pu4+ to Pu3+

110
5.1 AR of Plutonium Dioxide on Clean Surfaces
Figure 5.3 shows the change with time, under UHV (<5*10-9 Torr), of a
plutonium oxide film prepared by exposing a clean plutonium metal surface to a 540 L
dose of oxygen. There is a small time delay of approximately 3 minutes between the
removal of the oxygen from the chamber and powering on the Al K x-ray source before
data acquisition begins. At the beginning of the acquisition, plutonium dioxide is
0 100 200 300 400 500 600 700 800 900 1000
0.0
0.2
0.4
0.6
0.8
1.0
1.2
1.4
1.6
1.8
O2
- /Pu
ox
O2-/Puox
Pu3+/Puox
Pu
sp/P
uo
x
Time (min)
Pu4+/Puox
Figure 5.3: Auto-reduction (AR) reaction of plutonium dioxide film on clean plutonium metal. Data acquisition began four minutes after 540 L oxygen exposure. As the AR reaction proceeds, the Pu4+(blue):Pu3+(green) ratio changes from 0.55:0.45 to 100% Pu3+. The O2-/Puox stoichiometry (red) decreases from 1.8 to 1.27 (dashed line), less than what is expected for plutonium sesquioxide (Pu2O3; O
2-/Puox = 1.5). The red line represents a 10-point Savitzky-Golay fit to the O2-/Puox data (red squares).

111
observed auto-reducing. Peak fitting of the Pu 4f XP spectra yields the amount of Pu4+
and Pu3+ relative to the total amount of oxidized plutonium (Puox = Pu3+ + Pu4+).
Pu4+/Puox decreases, with time, as Pu3+/Puox increases. Simultaneous acquisition of the
oxygen 1s photoelectron spectra allows for monitoring the changes in the stoichiometry
of the oxide film throughout the duration of the auto-reduction of PuO2 (Pu4+) until the
end, when only the sesquioxide (Pu3+) is present. Initially, the plutonium oxide film has a
composition of approximately 0.55:0.45 Pu4+:Pu3+ with an oxygen stoichiometry (O2-
/Puox) of 1.81, close to the 1.78 expected value calculated from the ratio of plutonium 4+
and 3+ cations for the dioxide and sesquioxide. At the end of the AR reaction, the oxide
film is essentially all Pu3+ with a stoichiometry (O2-/Puox) of 1.27, significantly less than
what is expected for a plutonium sesquioxide film (Pu2O3; O2-/Puox = 1.5).
AR reaction of two thin-film plutonium oxide samples grown from ~30 L oxygen
doses as observed with XPS and AES are displayed in Figures 5.4 and 5.5, respectively.
The AR of a plutonium oxide film formed after a 33 L oxygen exposure is shown in
Figure 5.4, as observed via AES. Although AES does not allow for differentiating
between the oxidation state of the plutonium cation species (4+ vs. 3+), it allows data
acquisition before, during, and after the oxygen exposure through a greater range of
oxygen dosing pressures than is normally feasible with XPS. As the surface is exposed to
oxygen, the stoichiometry (O/Pu) rises sharply, peaking at 1.55. As soon as the 33 L
oxygen dose is completed and the oxygen is removed from the system, the O/Puox rapidly
decreases to a final ratio of ~1.13 after 1,000 minutes, again lower than what is expected

112
0 100 200 300 400 500 600 700 800 900 1000
0.0
0.2
0.4
0.6
0.8
1.0
1.2
1.4
1.6
1.8
O/Pu
O/P
u S
toic
hio
met
ry
Time (min)
33 L O2 exposure completed
Figure 5.4: AES data plot of AR reaction of a thin oxide film on clean plutonium metal prepared with 33 L exposure of oxygen. The red line represents a 10-point Savitzky-Golay fit to the data (red squares).
for Pu2O3. A similar oxygen exposure and subsequent AR experiment was performed and
monitored with XPS. Figure 5.5 shows a 30 L oxygen dose of a plutonium metal surface.
Initially, the Pu 4f spectra acquired after the exposure show a small amount (~5%) of
Pu4+ and ~ 90% of the plutonium species in the 3+ state; the stoichiometry (O2-/Puox) of
this film is ~1.35. Plutonium metal (Puo) from the underlying substrate makes up the
remaining 5% of the Pu 4f spectra, indicating the thin nature of the oxide film produced
from the relatively small oxygen dose. After 600 minutes, all the plutonium is in the 3+

113
0 100 200 300 400 500 600 700 800 900 1000
0.0
0.2
0.4
0.6
0.8
1.0
1.2
1.4
1.6
1.8
O2-/P
uo
xP
usp
/Pu
Tot
Time (min)
Pu3+/PuTot
O2-/Puox
Pu4+/PuTot
Figure 5.5: XPS data plot of AR reaction of a thin oxide film on clean plutonium metal prepared with 30 L exposure of oxygen.
oxidation state and the final stoichiometry (O2-/Puox) of this oxide film is ~1.16, very
similar to what was observed with AES and shown in Figure 5.4. These two experiments
seem to indicate that like PuO2 films, very thin Pu2O3 oxide films are unstable under
reducing environments (UHV) and will auto reduce to form oxide films with O/Pu
stoichiometries as low as 1.1-1.2.

114
5.2 AR of PuO2 on Carbide-Contaminated Surfaces
Due to the strong reactivity of plutonium [8], it is often difficult to prepare clean
plutonium surfaces. Impurities of oxygen and carbon, in the form of oxycarbide and/or
carbide, are frequently observed. The XP spectra at the top of Figure 5.6 (red trace) are
characteristic of the cleanest surfaces prepared for this thesis. Small but detectable
amounts of oxide are observed along with a small amount of residual carbide, that when
quantified give Pu(O0.02)(C0.03). The oxide films presented earlier in this chapter in
537 534 531 528 525 450 440 430 420 410 295 290 285 280 275
C 1sPu 4f
75x
Inte
nsi
ty (
A.U
.)
20x
O 1s
a)
b)
Binding Energy (eV)
Pu(O0.02
)(C0.03
)
Pu(O0.10
)(C0.14
)
Figure 5.6: Representative XPS spectra for a) clean plutonium metal [Pu(O0.02)(C0.03)] (top in red) and b) carbide-contaminated metal [Pu(O0.10)(C0.14)] (bottom in blue) surfaces: O 1s (left), Pu 4f (center), and C 1s (right) spectra regions. The spectra are normalized to their respective Pu 4f area.

115
Figures 5.3, 5.4, and 5.5 were grown on surfaces with contamination levels similar to
this. The bottom spectra (blue trace) in Figure 5.6 illustrate a more typical carbide-
contaminated Pu surface [Pu(O0.10)(C0.14)] with a C 1s binding energy of 281.6 eV,
characteristic of carbidic carbon [9]. The oxide films shown in Figures 5.7-5.9 and
discussed below were grown on surfaces with these higher oxide/carbide contamination
levels, typical of most plutonium samples.
Figure 5.7 illustrates an oxide film grown after exposing a carbide-contaminated
Pu surface to a 235 L dose of oxygen. Analysis of this surface with XPS began towards
0 100 200 300 400 500 600 700 800 900 10000.0
0.2
0.4
0.6
0.8
1.0
1.2
1.4
1.6
1.8
2.0
O2-/P
uox
Time (min)
Pusp
/Pu
ox
Pu4+/Puox
Pu3+/Puox
O2-/Puox
235 L O2 exposure completed
Figure 5.7: Auto-reduction (AR) reaction of plutonium dioxide film grown on carbide-contaminated: 235 L exposure at 28o C.

116
the end of the oxygen dose. The data shows a plutonium oxide film with a composition of
approximately 0.60:0.40 Pu4+:Pu3+ with an oxygen stoichiometry (O2-/Puox) of 1.81. After
600 minutes, the oxide film is essentially all Pu3+ with an oxygen stoichiometry (O2-
/Puox) of 1.45, closer to the value expected for plutonium sesquioxide (Pu2O3; O2-/Puox =
1.5) and higher than was seen for similar experiments conducted on clean surfaces.
The diffusion needed to maintain the AR reaction of PuO2 is thought to be driven
by the chemical potential gradient across the oxide [6]. At a low enough temperature the
conversion of Pu4+ to Pu3+ ceases as the diffusion of oxygen through the oxide becomes
too slow to be measurable within the timescale of the experiment. As part of the work in
this investigation, this temperature has been determined to be ~ -20o C. Thus, cooling a
carbide-contaminated Pu surface below -70o C and exposing it to 590 L of oxygen forms
a stable PuO2 film (i.e. a dioxide film that does not undergo AR), as illustrated in the
initial stage (first ~60 minutes) of Figure 5.8. During the first 25 minutes of the
experimental run, the temperature was maintained below -70o C to confirm the stability
of the oxide film formed at this temperature. Afterwards, the temperature was slowly
increased to room temperature over a period of several hours. Initially, and through the
first ~160 minutes of the experiment, plutonium metal can still be observed in the Pu 4f
XP spectra indicating a thinner film than the one produced from the 235 L exposure at
room temperature. The initial oxide composition is not appreciably different than that of
the room temperature exposure: 0.65:0.35 Pu4+:Pu3+ with an oxygen stoichiometry (O2-
/Puox) of 1.83. As the temperature slowly increases, the AR reaction begins converting

117
0 100 200 300 400 500 600 700 800 900 10000.0
0.2
0.4
0.6
0.8
1.0
1.2
1.4
1.6
1.8
2.0
O2-/P
uoxP
usp/P
uTo
t
O2-/Puox
Time (min)
Temperature reaches ~ -20oC: AR begins
Pu3+/PuTot
Pu4+/PuTot
Puo/PuTot
Figure 5.8: Auto-reduction (AR) reactions of plutonium dioxide film grown on carbide-contaminated metal: 590 L exposure at < -70o C. Below a temperature of ~ -20o C (dashed line at ~70 minutes) the AR reduction does not occur and the dioxide film is stable.
plutonium from Pu4+ to Pu3+ at approximately -20o C (dashed line in Figure 5.8, ~70
minutes) with a concomitant decrease in O/Pu stoichiometry. When the reaction has
reached completion (> 400 minutes), all the plutonium is in the 3+ oxidation state with a
final stoichiometry of O2-/Puox = 1.35, lower than the final stoichiometry observed for the
undoubtedly thicker oxide film in Figure 5.7. When the experiment was repeated, a
second sub-ambient temperature oxygen exposure experiment (1000 L at < -70o C) on a
clean metal surface yielded comparable results: 0.68:0.32 Pu4+:Pu3+ with O2-/Puox of 1.84

118
and a final film composition of 100% Pu3+ with O2-/Puox of 1.30. The metallic component
(~4%) was observed in the Pu 4f XP spectra, indicating a thin oxide film, approximately
the same thickness (~50 Å) as the film formed from the 590 L exposure on the carbide-
contaminated Pu surface. The relatively thin nature of the plutonium oxide films
produced at low temperature exposures (< -70o C) on carbide-contaminated and clean
surfaces may be the reason for the similar final stoichiometries, 1.35 vs. 1.30,
respectively.
The initial Pu 4f and O 1s photoelectron spectra corresponding to the beginning of
536 534 532 530 528 526 460 450 440 430 420
Pu 4f
Inte
nsity
(A
.U.)
Binding Energy (eV)
2.75x
O 1s b)
235 L at 28o C
590 L at < -70o C
a)
Figure 5.9: Initial (a) O 1s and (b) Pu 4f XP spectra for AR reactions of 235 L O2 exposure at 28o C (red trace) and 590 L O2 exposure at < -70o C (blue trace) shown in Figure 5.7 and 5.8. The spectra are normalized to the Pu 4f area.

119
the AR reaction experimental runs of the 235 L (28o C) and 590 L (< -70o C) exposures
(Figure 5.7 and 5.8, respectively) are shown in Figure 5.9. The Pu 4f spectrum collected
during the end of the room temperature 235 L exposure has slightly less Pu4+ component
than the 590 L exposure (60% versus 65%), presumably because the latter occurred at a
higher dose and at low temperatures where diffusion/AR reaction does not proceed while
the former was at room temperature where the auto-reduction reaction readily occurs
converting Pu4+ to Pu3+. For both films, the O 1s spectra exhibit a similar oxide peak
536 534 532 530 528 526 460 450 440 430 420
2.75x
Inte
nsity
(A
.U.)
Binding Energy (eV)
Pu 4fO 1sb)a)
235 L 590 L
Figure 5.10: The final (a) O 1s and (b) Pu 4f XP spectra for oxide films after the completion of (600 minutes) the AR reactions shown in Figure 5.7 and 5.8: 235 L (red trace) and 590 L (blue trace). The spectra, acquired at 28o C, are normalized to the Pu 4f area.

120
shape (529.8 eV) while the low temperature exposure has a slightly more intense
shoulder at 532.2 eV, likely due to adsorption of more contaminants at the lower
temperature. The corresponding Pu 4f and O 1s spectra for these oxide films at the end of
the two AR reactions (~600 min.) are shown in Figure 5.10. While the Pu 4f spectra of
the two oxide films are very similar (so much so that it is difficult to differentiate the two
in Figure 5.10b), the corresponding O 1s spectra (Figure 5.10a) show identical surface
contaminant peaks at 532.2 eV (discussed below) but different intensities for the oxide
peak at 530.3 eV, indicating different stoichiometries, as shown in Figure 5.7 and 5.8.
The variable oxide oxygen intensity and identical surface contaminant intensity observed
here suggests that the peak at 532.2 eV is not the reason for these sub-stoichiometric
oxide films.
Figure 5.11 presents a comparison of O 1s, Pu 4f, and C 1s spectra of a carbide-
contaminated Pu surface exposed to an oxygen dose of 30 L immediately after the
exposure and six hours later. The two Pu 4f spectra are very similar, with both showing
Pu in the 3+ oxidation state. The spectrum acquired right after the exposures shows an
additional amount of intensity at ~433.1 eV between the Pu 4f5/2 and the 4f7/2 doublet.
The 4f7/2 satellite for Pu4+ is located at this binding energy [10]. Thus, this additional
intensity is likely indicative of the presence of a very small amount of Pu4+. The initial
oxygen stoichiometry (O2-/Puox) for the film is 1.49. After six hours, the stoichiometry
decreases to 1.36. Immediately after the oxygen exposure, the O 1s XP spectrum shows a
single peak at 530.2 eV corresponding to the oxide oxygen. Analysis of the same film six
hours later indicates that a new feature has appeared at 532.2 eV. That this additional

121
537 534 531 528 460 450 440 430 420 292 288 284 280
Inte
nsi
ty (
A.U
.)
5 X
After 30 L O2 Exposure
After 6 hrs.in UHV
Pu 4fO 1sb)a)
Binding Energy (eV)
70 X
C 1sc)
Figure 5.11: (a) O 1s, (b) Pu 4f, and (c) C 1s spectra of a carbide-contaminated Pu surface exposed to 30 L of oxygen. The blue trace indicates the spectra acquired five minutes after the dose was completed. The red trace represents the spectra obtained after an additional 6 hrs in UHV. The spectra are normalized to the Pu 4f area.
feature is not the cause of the changing stoichiometry of these oxide films was discussed
above. It should be noted that this small peak appearing at 532.2 eV is typically attributed
to surface hydroxyls [11]. However, upon examination of the corresponding C 1s XP
spectra for this oxide film, it is clear that the peak at 532.2 eV for oxygen appears
simultaneously with a carbon peak at 287.1 eV. The high binding energy of this feature
may suggest that these peaks are due to adsorption of a carbon-oxygen containing species
after exposure to UHV (~5*10-10 Torr) for six hours. Residual gas analysis (RGA) shows

122
the presence of CO (28 a.m.u.) as one of the main contaminants of the vacuum system.
Quantification of the oxygen peak at 532.2 eV and the carbon peak at 287.1 eV indicate a
C:O ratio of ~1. Both of these peaks have been observed to simultaneously disappear
after a light sputtering of the surface.
The presence of carbon within the oxide, as an oxy-carbide, has been shown to
result in significant sub-stoichiometry of plutonium oxide films [12]. XPS and AES data
for carbon acquired during these experiments show that the sub-stoichiometric plutonium
sesquioxide films prepared for this work do not contain carbide impurities within the
depth being analyzed, similar to the data of the sub-stoichiometric films presented in the
previous chapter. The carbide contamination initially observed on the plutonium metal
surfaces (C 1s region shown on Figure 5.6b, blue trace) quickly becomes undetectable
upon exposure to oxygen (blue trace in Figure 5.11c), as probed by XPS and AES,
indicating that the carbide likely remains at the metal-oxide interface and is not
distributed throughout the thickness of these prepared oxide films.
Carbidic impurities on Pu surfaces appear to affect the extent of reduction in the
AR reaction for similar oxygen exposures at room temperature. Clean metal surfaces
exhibiting very little carbide contamination yield oxide films (Figure 5.3-5.5) of even
lower stoichiometries (O/Pu=1.1-1.27), as observed by both AES and XPS, than those
observed on metal surfaces with larger amounts of carbide impurities, shown in Figure
5.8. The Pu 4f XP spectra of the oxide films produced by the AR reaction, regardless of

123
the level of contamination or extent of reduction, show a binding energy of 424.4 eV
(characteristic of trivalent Pu) and no discernable difference in peak shape.
The thermodynamic parameters of an oxide film on a metal substrate are clearly
different from bulk oxides. Specifically, PuO2 is a stable oxide in bulk whether in an air
[13] or in an inert atmosphere [11]. A PuO2 film on Pu metal, however, is stable in air but
not in an inert atmosphere, e.g., UHV, where rapid reduction from Pu4+ to Pu3+ occurs at
room temperature. Notwithstanding the different thermodynamic stability between a
bulk oxide and an oxide film, it can be useful to examine the oxygen-metal phase
diagram for insight into the oxidation of the metal. The phase diagram for the plutonium-
oxygen system has been extensively studied [13-17]. A diagram presented by Boivineau
[16] indicates the existence of a sub-stoichiometric Pu2O3-y species. Unfortunately, there
was little discussion on the nature of this oxide. Courteix published one of the first XPS
investigations of plutonium oxides [4] in which binding energy shifts were employed to
suggest that plutonium sesquioxide may exist in sub-stoichiometric form. In that study,
however, there was no attempt to measure the oxygen- plutonium atomic concentrations
of the oxide films. As was shown in the previous chapter of this work, sub-stoichiometric
oxide films of plutonium can be grown when the metal is subjected to small oxygen
exposures. Sub-stoichiometric oxides of metals have been reported to occur at the very
initial stages of oxidation [18]. The auto-reduction of oxide films can occur at elevated
temperatures which facilitates the diffusion of oxygen [19]. The work presented here
describes a stoichiometric plutonium dioxide auto-reducing not to the expected
sesquioxide (Pu2O3) but to a sub-stoichiometric sesquioxide (Pu2O3-y) during exposure to

124
UHV at room temperature. It is conceivable that the self-irradiation of plutonium by -
particle decay [20] may be the cause of this unusual behavior. However, it cannot be the
sole cause as radioactive decay is a process independent of temperature while the auto-
reduction of Pu has clearly been shown in this chapter to be temperature dependent.
5.3 Conclusions
The data presented in this chapter clearly show that sub-stoichiometric
sesquioxide (Pu2O3-y) can be obtained from AR of PuO2 films. While the stoichiometry of
the oxide film prepared is less than what is expected for plutonium sesquioxide (O/Pu =
1.5), the character of the plutonium cation appears to remain trivalent. In addition, there
is a range of observed stoichiometries from 1.15 to 1.5. These sub-stoichiometric
sesquioxide films observed during the oxidation of plutonium metal substrates may be
better described as Pu2O3-y rather than Pu2O3 to differentiate them from the plutonium
sesquioxides ( and -Pu2O3) observed in bulk oxides as powders [14]. It is clear now
that the plutonium oxide film on metal surface system is much more complex than
previously thought. The level of sub-stoichiometry depends on initial film thickness and
carbide contamination. Based on these results and the high reactivity of plutonium
towards oxygen, it is not unreasonable to expect this sub-stoichiometric behavior (Pu2O3-
y) near the oxide-metal interface of oxide films on Pu metal substrates.

125
References
[1] Butterfield, M. T., Durakiewicz, T., Guziewicz, E., Joyce, J. J., Arko, A.
J., Graham, K. S., Moore, D. P., Morales, L. A., Surface Science, 571
(2004) 74.
[2] Larson, D. T. and Cash, D. L., J. Phys. Chem., 73 (1969) 2814.
[3] Larson, D. T., J. Vac. Sci. Technol., 17 (1980) 55.
[4] Courteix, D., Chayrouse, J., Heintz, L., Baptist, R., Solid State Comm., 39
(1981) 209.
[5] Haschke, J. M., Allen, T. H., Morales, L. A., Los Alamos Science, 6
(2000) 252.
[6] Martz, J., Haschke, J. M., Stakebake, J. L., J. Nucl. Mater., 210 (1994)
130.
[7] Morrall, P., Tull, S., Glascott, J., Roussel, P., J. Alloy. Compd., 444-445
(2007) 352.
[8] Colmenares, C. A., Prog. Solid State Chem., 9 (1975), 139.
[9] Gouder, T., Havela, L., Schick, A. B., Huber, F., Wastin, F., and Rebizant
J., J. Phys.: Condens. Matter, 19 (2007) 476201.
[10] Baptist, R., Courteix, D., Chayrouse, J., Heintz, L., J. Phys. F:Met. Phys.,
12 (1982) 2103.

126
[11] Farr, J. D., Schulze, R. K., Neu, M. P., J. Nucl. Mater., 328 (2004) 124.
[12] Larson, D. T. and Haschke, J. M., Inorg. Chem., 20 (1981) 1145.
[13] Chikalla, T. D., McNeilly, C. E., and Skavdahl, R. E., J. Nucl. Mater., 12
(1964) 131.
[14] Gardner, E. R., Markin, T. L., and Street, R. S., J. Inorg. Nucl. Chem., 27
(1965) 541.
[15] Wriedt, H. A., Bull. Alloy Phase Diagr., 11 (1990) 184.
[16] Boivineau, J. C., J. Nucl. Mater., 60 (1976) 31.
[17] Predel, B., O-Pu (Oxygen-Plutonium). Madelung, O. (ed.). Springer
Materials: The Landolt-Börnstein Database- Group IV Physical
Chemistry. Numerical Data and Functional Relationship in Science and
Technology, 51.
[18] Kurth, M., Graat, P. C. J., Mittemeijer, E. J., Thin Solid Films, 500 (2006)
61.
[19] Roosendaal, S. J., Vredenberg, A. M., Habraken, F. H. P. M., Phys. Rev.
Lett., 84 (2000) 3366.
[20] Wick, O. J., Plutonium Handbook- A Guide to the Technology, Vol. I &
II, (American Nuclear Society: 1980).

127
Chapter 6: The Role and Fate of Impurities in Plutonium Oxidation
6.1 Gallium in Plutonium Metal
Impurities can have dramatic effects in the properties of a material. They can be
either intentionally included or an inherent consequence of a process. Small amounts of
impurities, or ‘dopants’, added to silicon or germanium produce dramatic changes in their
electrical property. Iron is susceptible to oxidation, which can compromise the structural
integrity of machined components, but forms alloys highly resistant to corrosion with the
addition of varying amounts of chromium, molybdenum and nickel [1]. The decay of
radioactive materials incorporates impurities in the metal in the form of daughter
products, americium and uranium in the case of Pu. Plutonium metal forms six crystalline
solid phases, yet the addition of a small percentage of gallium (Ga) renders the face-
Figure 6.1: Ga-Pu binary phase diagram illustrating the stabilization of the Pu –phase with the addition of Ga [2].

128
centered cubic phase stable over a range of over 500o C, as can be seen in the Ga-Pu
phase diagram presented in Figure 6.1.
There have been several studies investigating the effect of gallium in the
electronic configuration and structure of -Pu [4-7]. Gallium atoms have been confirmed
to be in substitution on the plutonium f.c.c. lattice where hybridization occurs between
the Ga 4p3/2 and Pu 5f5/2 bands. Very little is known, however, regarding the role of
gallium during the oxidation of -Pu. The low concentration of Ga (~2 at. %) makes it
difficult to be observed with XPS. In fact, the strongest Ga XPS signal, the Ga 2p3/2
transition lies very near the Pu 4p3/2 signal, as shown in Figure 6.2, complicating the
detection. Additionally, the gallium can only be detected with XPS when the Pu 4f peaks
are indicative of Pu metal and the C 1s and O 1s regions exhibit very little signal. Table
6.1 lists the binding energies for the 2p3/2 transition of pure gallium as well as various
compounds. While the electron spin orbit splitting (S.O.S) of the Ga-Pu alloy is the same
as pure Ga (27.0 eV), the binding energy of the 2p3/2 is lower for Ga-Pu than pure gallium
(1115.3 vs. 1116.5 eV) indicating less tightly bound Ga 2p core electrons for the Pu
alloy.
6.2 Gallium in Plutonium Oxide
Figure 6.3 shows the XP spectra of the Ga 2p3/2, O 1s, and Pu 4f regions of a ~2
at. % Ga-Pu metal surface as it is exposed to small amounts (0 to 4.0 L) of O2 at 10-8
Torr. With each exposure of O2, the O 1s signal increases and the Pu 4f region shows

129
1150 1140 1130 1120 1110 450 445 440 435 430 425 420 415
Inte
nsity
(A
. U.)
24x
b)
Ga 2p1/2
Ga 2p3/2
Pu 4p3/2
Binding Energy (eV)
Pu 4fa)
Figure 6.2: XP spectra of the a) Ga 2p and b) Pu 4f regions for clean ~2 at. % Ga-Pu metal surfaces. The Ga 2p doublet (red traces) occurs near the Pu 4p3/2 signal making quantification of the Ga 2p3/2 in the steep background challenging. The green traces shows another clean Pu surface XP spectrum where only the region near the Ga 2p signal was acquired, as a means of minimizing acquisition time.
Table 6.1: Binding energies for the 2p3/2 transition for various Ga compounds [8].
Binding Energy for
2p3/2 Transition (eV)
-Pu (2.0 at.% Ga) 1115.3 (S.O.S. = 27.0 eV)
Ga 1116.5 (S.O.S. = 27.0 eV)
GaP 1116.8
GaAs 1117.0
Ga2O3 1117.5
GaN 1117.8

130
Fig
ure
6.3
: X
PS
Ana
lysi
s of
a c
lean
met
al s
urfa
ce e
xpos
ed to
0-4
.0 L
O2
at 1
0-8 T
orr.
The
low
er tr
aces
(bl
ack)
in th
e th
ree
spec
tral
re
gion
s, a
) G
a 2p
3/2,
b)
O 1
s, a
nd c
) P
u 4f
, cor
resp
onds
to th
e cl
ean
met
al s
urfa
ce b
efor
e O
2 ex
posu
re. F
or th
e G
a 2p
, onl
y th
e 2p
3/2
sign
al w
as e
xam
ined
, to
min
imiz
e ac
quis
itio
n ti
mes
in th
e ex
peri
men
t.

131
increased intensity at 424.4 eV (Pu3+ species) at the expense of the peak intensity at 422.2
eV (Pu0 species). The Ga 2p3/2 signal at 1115.3 eV quickly decreases with increasing O2
exposure. After 4.0 L O2, the Pu 4f signal (magenta, upper traces) is composed of ~ 60%
Pu0 and ~40% Pu3+ while the Ga 2p3/2 peak is barely detectable. It must be noted that
because of the difference in electron binding energies of Pu and Ga, the XPS probing
depths are significantly different for each element. Utilizing the TTP-2M method of
calculating electron inelastic mean free path (IMFP), the probing depth for Pu (B.E. ~
424 eV; K.E. ~ 1063 eV) and Ga (B.E. ~ 1115 eV; K.E. ~ 372 eV) is 54 Å and 26 Å,
respectively [9]. Close inspection of the Ga 2p3/2 signal appears to show the emergence of
a signal at ~1116 eV with O2 exposure, particularly at the 1.0 L (green trace) and the 2.0
L (wine trace) perhaps indicating the oxidation of gallium. However, the lack of a
reference binding energy value for Ga3+ (in the Ga-Pu alloy system) and the weak Ga
2p3/2 signal strength are not conducive for allowing a determination of the oxidation state
of Ga with a reasonable degree of confidence.
While weak to begin with, the Ga 2p3/2 signal peak can unmistakably be observed
decreasing as an oxide layer grows on the clean Pu metal surface with O2 exposure. This
data can be used to determine what the fate of Ga is during the oxidation of Pu. There are
several possibilities: 1) Ga segregates to the surface during oxidation, 2) Ga remains in
the Pu oxide film, 3) Ga is enriched at the oxide-metal interface. If the Ga segregates to
the surface, the Ga 2p3/2 peak should increase with O2 exposure. The results presented in
Figure 6.3a show the Ga 2p3/2 signal is at a maximum when the amount of Pu oxide
present is at a minimum. A Pu oxide film with the same concentration of Ga as the metal

132
(~ 2 at. %), would exhibit a Ga 2p3/2 signal intensity independent of O2 exposure, after a
small initial signal decrease due to the lower relative atomic concentration of Ga in the
oxide than in the Pu metal. The only plausible explanation for the vanishing Ga 2p3/2
signal is for the Ga atoms to remain at the metal-oxide interface during oxidation of Pu
metal. It is also possible that while the oxide-metal interface becomes Ga enriched during
oxidation, some Ga remains within the oxide. AES investigations of Ga in Pu oxide films
indicate that while significantly depleted of Ga, the oxide does exhibit a weak, but
detectable Ga LMM Auger signal at a kinetic energy of ~1068 eV [10].
6.3 Carbon Impurities in Plutonium Metal
A second impurity, albeit unintended, commonly found in Pu metal is carbon,
typically in the form of an oxy-carbide, PuO0.5C0.5 [11, 12]. The carbon is an intrinsic
contaminant of the process of plutonium synthesis and manufacturing [13]. In an earlier
chapter, small amounts of carbide on the Pu metal surface were shown to influence the
level of sub-stoichiometry of the Pu sesquioxide. The sample used for those studies, was
a Pu research sample low in contaminants. It would be interesting to also investigate how
higher levels of carbon contaminants affect Pu oxidation.
Figure 6.4 shows the XP spectrum of a plutonium sample with a thin film of
carbon and oxygen quantified as PuO0.5C0.5. While the quantification implies that it is an
oxycarbide, there are two peaks in the C 1s region indicating two different carbon
species. In bulk phases, there are four stable Pu carbide species: Plutonium sesquicarbide
(Pu2C3), triplutonium dicarbide (Pu3C2), and PuC1-x. Plutonium dicarbide (PuC2) is only

133
537 534 531 528 460 450 440 430 420 410 296 292 288 284 280
C 1sPu 4fc)b)
Inte
nsity
(A
. U
.)
a)O 1s
9x
Binding Energy (eV)
40x282.6 eV
281.6 eV
Figure 6.4: XP spectra of the a) O 1s b) Pu 4f and c) C 1s regions for a Pu metal sample with a thin layer of oxy-carbide, PuO0.5C0.4. Both of the C 1s signals observed (282.6 eV and 281.6 eV) were included in the quantification. The Pu 4f region shows approximately 50% Pu0, 50% Pu3+.
stable above 1,660o C [14]. One XPS study investigating the 5f electronic states
variability of Pu carbides [15] reported the energy for the C 1s signal of PuC1-x as 282.6
eV. The energy for the Pu oxycarbide has been reported to be a broad peak centered on
281.0 eV. [11]. Figure 6.5 shows the XP spectrum of a Pu surface with small amounts of
carbon and oxygen (PuO0.12C0.18) contamination. The C 1s region exhibits a peak at
281.6 eV with a small shoulder at 282.6 eV peak. While both of these C 1s features are
observed in Figure 6.4 and Figure 6.5 at different intensities, the Pu 4f region presented

134
537 534 531 528 460 450 440 430 420 410 296 292 288 284 280
Inte
nsi
ty (
A. U
.)
9x 40x
Binding Energy (eV)
C 1sPu 4fc)b)a)
O 1s 281.6 eV
282.6 eV
Figure 6.5: XP spectra of the a) O 1s b) Pu 4f and c) C 1s regions for a Pu metal sample with a thin layer of oxygen-carbon contamination, PuO0.12C0.18. Both of the C 1s signals observed (282.6 eV and 281.6 eV) were included in the quantification. The Pu 4f region shows approximately 90% Pu0 with a small amount of oxidized Pu signal.
in Figure 6.4b indicates that the surface has a Pu composition approximately 50% Pu3+;
Figure 6.5b shows a surface predominantly metallic with very little Pu3+.
Figure 6.6 illustrates oxidation of a Pu metal surface, of similar composition to
the surface presented in Figure 6.5, with 30 L of O2. The initial spectra (red trace) exhibit
the two carbide species at 281.6 eV and 282.6 eV. After exposure to oxygen (green
trace), these features disappear. The Pu 4f and O 1s regions are indicative of an oxide
film with 100% Pu3+. This result has been confirmed with AES experiments. Figure 6.7

135
534 531 528 460 450 440 430 420 294 291 288 285 282 279 276
C 1sPu 4fc)b)
Inte
ns
ity
(A
. U.)
a) O 1s
4x80x
Binding Energy (eV)
Figure 6.6: XP spectra of the a) O 1s b) Pu 4f and c) C 1s regions for a Pu metal sample with a thin layer of oxygen-carbon contamination, before (red trace) and after (green trace) a 30 L O2 exposure . The Pu 4f region showing approximately 90% Pu0 initially, becomes 100% Pu3+. Both of the C 1s signals observed (282.6 eV and 281.6 eV) in Figure 6.4 and Figure 6.5, disappear after the O2 exposure.
presents the AES in-situ oxidation of a clean Pu metal surface (PuO0.01C0.03) with 30 L
O2. The Pu NOV signals exhibits a small kinetic energy shift from 317 eV to 314 eV. The
evolution of the O KLL signal highlights the growth of the oxide. The C KLL indicates
there is no carbon accumulation throughout the duration of the O2 exposure.
Figure 6.8 show the results of an AES in-situ experiment where a thin Pu
oxycarbide layer on metal (PuO0.5C0.5) was exposed to 30 L of O2. Carbon and oxygen
can be detected in the spectra before the beginning of the O2 exposure (red trace, labeled

136
Figure 6.7: Differentiated AE spectra of the a) carbon KLL b) Pu NOV and c) oxygen KLL transitions acquired during an in-situ 30 L O2 exposure of a clean Pu metal surface, PuO0.01C0.03. The Pu surface before O2 exposure is shown at the bottom of the figure (red trace). A set of spectra was collected at intervals of 6 L. There is a weak signal for carbon indicative of carbide. The Pu NOV exhibits a kinetic energy shift from 317 eV to 314 eV as the Pu metal surface is oxidized.

137
Figure 6.8: Differentiated AE spectra of the a) carbon KLL b) Pu NOV and c) oxygen KLL transitions acquired during an in-situ 30 L O2 exposure of a Pu oxy-carbide film on metal, PuO0.5C0.5. The Pu surface before O2 exposure is shown at the bottom of the figure (red trace). A set of spectra was collected at intervals of 6 L. The Pu NOV exhibits a kinetic energy shift from 316 eV to 314 eV as the surface is oxidized. The carbon signal decreased in intensity as an oxide film develops on the Pu metal surface.

138
‘0 L’). Once the oxidation begins, the O KLL signal increases, indicating the growth of an
oxide layer, while the C KLL signal decreases. At the end of the O2 exposure (top blue
trace), the Pu NOV and the O KLL indicate a Pu oxide film. The C KLL signal has
diminished considerably. The XPS and AES results indicate that the plutonium oxide
grows above the oxycarbide layer, which stays near the oxide-metal interface.
If the oxycarbide layer remains at the oxide-metal interface, it is reasonable to
0 100 200 300 400 500 600 700 800 900 1000 1100
0.0
0.4
0.8
1.2
1.6
2.0
2.4
PuO0.45
C0.52
PuO0.02
C0.07
O/P
u
Time (min)
Clean PuPuO
xC
y; x,y < 0.02
Figure 6.9: AES Pu oxide growth and evolution profile of Pu oxides. The three surfaces examined include a clean Pu metal surface (red trace), a Pu metal surface with a small oxycarbide contamination (blue trace), and a Pu oxycarbide layer on metal (green trace) exposed to 33, 30, and 30 L O2, respectively. After the exposures, the surfaces’ stoichiometries were monitored.

139
expect it to have an influence in the diffusion of oxygen into the metal. The AR of
plutonium oxide, driven by the diffusion of oxygen into the metal is an ideal vehicle to
probe the effect of an oxycarbide layer. Figure 6.9 shows the effect of the substrate on
final stoichiometry of thin Pu oxide films. The clean Pu metal surface (red trace)
exhibited a steady rise in stoichiometry (O/Pu) to 1.6. 450 min after the end of the
exposure, the stoichiometry decreased to ~1.2, indicating a sub-stoichiometric Pu
sesquioxide. The stoichiometry of the Pu surface with slight oxycarbide contamination
(blue trace) peaks at ~2.0 after exposure. Once the exposure ends, the final stoichiometry
of the film is O/Pu = 1.6. Upon exposure to oxygen, the oxycarbide surface (green trace)
quickly reaches an O/Pu stoichiometry of 2.0 and remains at that level. The AR of PuO2
does not occur to any appreciable extent. The fact that the oxycarbide layer remains near
the oxide-metal interface region and the oxide grown on it seems impervious to the AR,
suggest that the oxycarbide acts like a barrier to the diffusion of oxygen to the metal
substrate, thereby stabilizing PuO2 at the surface of Pu metal, under non-oxidizing
conditions.
6.4 Conclusions
The 2p3/2 transition in the Ga-Pu alloy has been measured for the first time to be
1115.3 eV with a S.O.S. of 27.0 eV. While the S.O.S. is the same as elemental Ga, the
binding energy for the transition is 1.2 eV lower in the Ga-Pu alloy. The binding energy
difference may be due to the hybridization of the Ga 4p3/2 and Pu 5f5/2 bands that occurs
in the Ga-Pu alloy, which is a different chemical environment than in elemental Ga. XPS
experiments show that the concentration of Ga is not the same in the oxide as in the Pu

140
metal. Upon oxidation, the Ga XP signal disappears indicating that the Ga remains near
the metal-oxide region.
Two peaks in the XPS C 1s region, carbide and oxy-carbide, have been resolved.
XPS and AES experiments show that the oxycarbide species remains near the oxide-
metal interface, upon oxidation of Pu. The presence of oxycarbide on the surface of Pu
seems to have a stabilizing effect on oxide films, presumably by forming a barrier against
oxygen diffusion through the oxide to the metal-oxide interface.

141
References
[1] Mathieu, H. J. and Landolt, D., Corrosion Science, 26 (1986) 547.
[2] Peterson, D. E., Kassner, M. E., Bull. Alloy Phase Diagr., 9 (1988) 261.
[3] Hecker, S. S., Los Alamos Science, 6 (2000) 16.
[4] Deloffre, P. D., Truffier, J. L., Falanga, A., J. Alloys Compd., 271 (1998)
370.
[5] Richard, N., Faure, Ph., Rofidal, P., Truffier, J. L., Bazin, D., J. Alloys
Compd., 271 (1998) 879.
[6] Faure, Ph., Deslandes, B., Bazin, D., Tailland, C., Doukhan, R., Fournier,
J. M., Falanga, A., J. Alloys Compd. 244 (1996) 131.
[7] Conradson, S. D., Appl. Spec., 52 (1999) 252.
[8] NIST X-ray Photoelectron Spectroscopy Database, NIST SRD 20, Ver.
3.5
[9] Tanuma, S., Powell, C. J., Penn, D. R., Surf. Interfac. Sci., 35 (2003) 268.
[10] Private communications with A. Broach and Dr. D. P. Moore.
[11] Larson, D. T. and Haschke, J. M., Inorg. Chem., 20 (1981) 1145.
[12] Terada, K., Meisel, R. L., Dringman, M. R., J. Nucl. Mater., 30 (1969)
340.

142
[13] Wick, O. J., Plutonium Handbook- A Guide to the Technology, Vol. I &
II, (American Nuclear Society:1980).
[14] Mulford, R. N. R., Ellinger, F. H., Hendrix, G. S., Albrecht, E. D.,
Plutonium 1960, (Cleaver-HumePress, London, U. K.: 1961) 301.
[15] Chemical Thermodynamics Vol. 4: Chemical Thermodynamics of
Neptunium and Plutonium, OECD Nuclear Energy Agency, ed. (Elsevier
Science B.V., The Netherlands: 2001) 427.
[16] Gouder T., Havela, L., Schick, A. B., Huber F., Wastin, F., and Rebizant,
J., J. Phys.: Condens. Matter, 19 (2007) 476201.

143
Chapter 7: Conclusions
Plutonium is an element with fascinating physical properties and an unusually
high reactivity toward other materials. Its peculiar behavior is attributed to the ability of
the 5f electrons to be either localized or itinerant [1]. Because of the implications to
safety, security, handling and storage stability, the oxidation of plutonium has been
extensively studied. Despite many studies dealing with bulk plutonium oxidation by air,
water vapor, and other gases, the dearth of fundamental knowledge regarding the
behavior, and stability, of oxide films on the surface of plutonium is striking.
Before any surface science investigations of plutonium could occur, a reliable
model for the analysis and quantification of XPS data had to be developed. The XPS 4f
transition for plutonium 3+ was found to consist of an asymmetrical set of peaks with a
set of satellites 16.4 eV from the main photoelectron signal. A relative sensitivity factor
(R.S.F.) for an aluminum x-ray source was determined to be 22.68 for Pu. A reliable data
fit model and an accurate RSF for analysis and quantification of plutonium is a
prerequisite for meaningful interpretation of XPS data from plutonium surfaces. The
model and RSF developed during the course of this thesis can be employed to analyze
XPS data by any scientist, provided the basic data collection conditions and parameters
that were used here are observed.
Sub-stoichiometric plutonium sesquioxide (Pu2O3-y) films on Pu metal surfaces
under reducing environments have been identified and characterized for the first time. It
has been established that the existence of sub-stoichiometric plutonium sesquioxides is

144
not due to carbon, in the form of an oxycarbide. The extent of sub-stoichiometry is a
function of oxide film thickness. Very thin films exhibit stoichiometries as low as PuO1.1.
The stoichiometry of the Pu oxide films may be as high as PuO1.5 for the thicker films.
The variability of oxide stoichiometries suggests there may exist a large concentration
gradient over the thickness of the Pu2O3-y rather than an uniform stoichiometry for the
Pu2O3 film, as had been previously assumed before this work.
A detailed analysis of the auto-reduction (AR) of plutonium dioxide (PuO2)
produced some unexpected results. At temperatures less than -20o C, the AR does not
occur and PuO2 thin films are stable. Within the O2 pressure and temperature ranges
investigated in the course of this dissertation (5*10-8 to 10-4 Torr, < -70o to 28o C), the
PuO2 films grown on the metal did not exceed 20 Å in thickness. The final product of the
AR of PuO2 is not the sesquioxide (Pu2O3) as previously thought, but sub-stoichiometric
sesquioxides (Pu2O3-y) where y = 0 - 0.7. The level of sub-stoichiometry depends on the
initial thickness and in the amount of carbide contamination present on the surface of the
metal.
During the oxidation of Pu, the gallium (Ga) added to stabilize the metal in the -
phase has been shown to become depleted in the oxide and concentrated at the oxide-
metal interface. The binding energy for the 2p3/2 transition of Ga found in the Ga-Pu alloy
has been measured to be 1115.3 eV, a value lower than the value for elemental Ga.
Oxycarbide and carbide contamination on the surface of Pu metal remains at the oxide-
metal interface during oxidation as the oxide grows above it. Samples with an oxycarbide

145
layer on the Pu metal surface were shown to be resistant to the AR reduction of PuO2, as
it appears that the oxycarbide acts like a barrier preventing the diffusion of oxygen to the
metal-oxide interface, thereby stabilizing the PuO2.
Interpreted as a whole, the findings of the work presented here indicate that the
nature of the oxide system on plutonium is far more complex than previously thought.
The thin PuO2 film on a thicker Pu2O3 layer becomes unstable under a reducing
environment, auto-reducing not to the expected Pu2O3, but to a sub-stoichiometric
sesquioxide (Pu2O3-y). The level of sub-stoichiometry depends on preparation, impurities
and thickness of oxide. The level of contamination on the surface of Pu is critical to the
stability of the oxide film.
Even though the findings of this investigation have advanced the understating of
the nature of plutonium oxides on metal surfaces, new questions have emerged. In
particular, why does the oxidation of plutonium yield PuO2 films whose thickness is
nearly constant (< 20 Å)? Under what conditions can this oxide form thicker films?
Application of the different oxidation theories that do not depend in chemical potentials
to drive the diffusion of oxygen, such as the Mott-Cabrera theory [2], or the Fromhold-
Cook theory of coupled currents [3, 4], may help to develop a predictive model of Pu
oxidation in the thin film regime. Carbon monoxide (CO) has been shown to readily
oxidize Pu metal forming oxycarbide [5, 6]. Controlled exposure with CO should
oxidized and cover the Pu metal surface with an oxycarbide layer. This could become a

146
controlled model system which can be employed to study the effect of oxycarbide on the
oxidation of plutonium.

147
References
[1] Wills, J. M., Erikson, O., Los Alamos Science, 6 (2000) 128.
[2] Cabrera, N., Mott, N. F., Rep. Prog. Phys., 12 (1948) 163.
[3] Roosendaal, S. J., Vredenberg, A. M., Habraken, F. H. P. M., Phys. Rev.
Lett., 84 (2000) 3366.
[4] Fromhold, A., Theory of Metal Oxidation, (North-Holland, Amsterdam,
1976)
[5] Larson, D. T. and Haschke, J. M., Inorg. Chem., 20 (1981) 1145.
[6] Tull, S., Ph.D. Thesis, University of Wales, Cadiff, U. K., 2003.