characterising the measurements made by sideways-force
TRANSCRIPT

PUBLISHED PROJECT REPORT PPR980
Characterising the measurements made by sideways-force skid resistance devices An experimental study
P D Sanders

Draft PPR980
Report details
Report prepared for: Highways England, Pavements
Project/customer reference: 1-407 Sub-task 2
Copyright: © TRL Limited
Report date: January 2021
Report status/version: Draft
Quality approval:
A Kaminski
(Project Manager)
Approved M Greene
(Technical Reviewer)
Approved
Disclaimer
This report has been produced by TRL Limited (TRL) under a contract with Highways England. Any views expressed in this report are not necessarily those of Highways England.
The information contained herein is the property of TRL Limited and does not necessarily reflect the views or policies of the customer for whom this report was prepared. Whilst every effort has been made to ensure that the matter presented in this report is relevant, accurate and up-to-date, TRL Limited cannot accept any liability for any error or omission, or reliance on part or all of the content in another context.
When purchased in hard copy, this publication is printed on paper that is FSC (Forest Stewardship Council) and TCF (Totally Chlorine Free) registered.
Contents amendment record
This report has been amended and issued as follows:
Version Date Description Editor Technical Reviewer
1.0 07/01/2021 Final version issued to client PS MG
Document last saved on: 11/01/2021 15:53
Document last saved by: Peter Sanders

Draft i PPR980
Executive summary
The effective management of road surface skid resistance is critical for providing a safe means of travel for all road users. The skid resistance on the English trunk road network is managed with the goal of normalising the skidding risk to motorists across areas of varying relative risk (known as site categories). Currently this is undertaken using a correlative approach which compares road surface skid resistance with the prevalence of wet skidding accidents for different site categories. Critically however, it is not understood, even at a fundamental level, how the skid resistance measurements made on the road network physically relate to the friction properties exploited by vehicles.
In this paradigm there exists a major potential benefit to road authorities, road users, and vehicle manufacturers, in generating this fundamental knowledge, especially in areas of high skid risk. The work reported in this document represents part of a programme of research which seeks to fully understand the relationship between the parameters outlined above. The overall result of this programme of work will provide advice to road owners as to how they can best use road surfacing materials in order to:
• Maximise the cost effectiveness of pavement materials used,
• Minimise the skidding risk to road users in areas of varying risk,
• Update the relevant management procedures in order to continually support the above points.
In the UK, the skid resistance properties of the trunk road network are assessed annually by devices utilising the sideways-force measurement principle, the Sideways-force Coefficient Routine Investigation Machine (SCRIM). Currently, a view of the measurement properties of SCRIM is in place. However, this is based on a theoretical analysis of the device, is unsupported by empirical evidence, and, in some cases is contradictory to historical literature. During recent years this view has been challenged and it is the aim of this work to investigate the measurement properties of SCRIM in order to confirm the currently held view, or to provide an alternative.
A desk study produced the following characterisations for SCRIM but was unable to identify a unique valid characterisation.
Summary of operating velocity and % slip predicted by characterisations
Characterisation operating velocity % slip
Current The vehicle speed 34.2
Scalar The vehicle speed 6.03
Vector The vehicle speed x Sin(20) 100
Co-Axial The vehicle speed 11.7
As a result, the following research questions were prompted:

Draft ii PPR980
• What is the speed of the SCRIM test tyre, and how does this relate to the vehicle speed?
• What factors influence the speed of the SCRIM test wheel?
• What is the operational velocity for SCRIM?
• At what percentage slip does SCRIM characterise road surface friction?
• What factors influence the operational velocity and percentage slip?
This report presents an experimental study which was designed to answer these questions. From the work carried out, the following conclusions can be made:
• SCRIM measurements are made at an operational velocity of 17.1 km/h and 100% Slip, when measurements are made at the standard vehicle speed of 50 km/h.
• Aquaplaning or near aquaplaning of the SCRIM tyre occurs on materials with a nominal low speed skid resistance.
• There is evidence that on materials with high nominal skid resistance levels, the critical wheel angle for SCRIM (i.e. the angle above which skid resistance measurements no longer increase) may not be being achieved.

Draft iii PPR980
Table of Contents
Executive summary i
1 Introduction 1
2 Background to pavement friction and its influence on vehicle safety and highway management 2
2.1 Friction as a multi-dimensional parameter 2
2.2 The influence of friction on vehicle safety 2
2.3 The implications for the management of road networks 3
3 Definition of parameters 4
3.1 Operational velocity 4
3.2 Wheel speed 4
3.3 Slip speed, Slip Ratio and Percentage Slip 5
3.4 Vertical and horizontal load 5
3.5 Critical wheel angle 6
4 Summary of the desk study 8
4.1 The currently accepted view, 34.2 % slip at 50 km/h operational velocity 8
4.2 Scalar characterisation, 6.04 % wheel slip at 50 km/h operational velocity 9
4.3 Vector characterisation, 100% wheel slip at 17.1 km/h operational velocity 10
4.4 Co-axial characterisation, 11.7% wheel slip at 50 km/h operational velocity 11
4.5 Summary 12
5 Measurement devices used 14
5.1 The Skid Resistance Development Platform 14
5.2 The Pavement Friction Tester 14
6 Materials assessed and measurements made 17
7 Data processing and analysis 19
7.1 The calculation of operational velocities for SkReDeP 19
7.2 The generation of friction profiles 19
7.3 The comparison of SkReDeP and PFT data 20
7.4 The calculation of test wheel speed 22

Draft iv PPR980
8 Results - Assessment of friction measurement characteristics 24
9 Results - Assessment of tyre rotational speed 31
10 Summary and conclusions 33
10.1 Characterising SCRIM measurements 33
10.2 Aquaplaning or near aquaplaning 33
10.3 Critical wheel angle 33
10.4 Conclusions 34
Bibliography 35
The double wheel experiment 37
Friction profiles 39

Author(s): P D Sanders 1 January 2021
Technical Reviewer: M Greene
1 Introduction
The effective management of road surface skid resistance properties is a critical factor in providing a safe means of travel for all road users. The measurement of skid resistance is a key component in the effective management of skid resistance. In the UK the skid resistance properties of the trunk road network, and many local road networks, are assessed annually using devices utilising the sideways-force measurement principle.
At the time of writing, all of the devices used for charactering the skid resistance properties of the UK motorway and trunk road network are Sideways-force Coefficient Routine Investigation Machines (SCRIMs). However, in Germany the SeitenKraftMessverfahren (SKM) is used and in Belgium the Odoliograph is used, both of which operate under the same sideways-force principles as SCRIM. Understanding the fundamental measurement properties of sideways-force devices would therefore provide a major benefit to UK and international road authorities in better interpreting the measurements made and how they relate to manoeuvres and friction demand of the vehicle fleet.
Currently, a view of the measurement properties of SCRIM is in place and is widely accepted. However, this view is based on a theoretical analysis of the device, is unsupported by practical assessment, and in some cases could be considered contradictory to historical works. During recent years, research into road surface skid resistance and friction has progressed in such a way that the specific measurement characteristics of SCRIM have become of particular interest. Owing to this interest, the current view of SCRIM has been challenged and it is the aim of this work to investigate the measurement properties of SCRIM and to undertake experimental programme of measurements by which the measurement properties of SCRIM can be confirmed.

Author(s): P D Sanders 2 January 2021
Technical Reviewer: M Greene
2 Background to pavement friction and its influence on vehicle safety and highway management
2.1 Friction as a multi-dimensional parameter
The friction generated between a road surface and vehicle tyre is highly variable; the concept of a ubiquitous “level of grip” is a misnomer. This is because the friction between a road surface and vehicle tyre, is dependant upon, amongst other variables, the speed at which the surface is being traversed, and the amount of slip between the tyre and road surface. Friction is therefore a three-dimensional parameter1. This is illustrated in Figure 2-1 which presents the typical relationship between friction, operating velocity, and wheel slip.
Figure 2-1 An example of the relationship between friction (Fn), operating velocity (km/h) and wheel slip (% Slip), the friction profile.
Efforts to normalise the measurement of road friction using standardised devices and test procedures, can allow for the measurement of the road’s contribution to friction, the “skid resistance”. Skid resistance measurements can be made with reference to the speed and % slip at which the measurement was made for some devices for which these parameters are defined. For SCRIM this is not the case, as the speed and % slip of SCRIM measurements are not known.
2.2 The influence of friction on vehicle safety
Work reported in TRL report PPR 815 (Sanders, Militzer, & Viner, 2017) demonstrated that vehicles undertaking a straight line braking manoeuvre use friction at a range of wheel slips and speeds. In other words, vehicles undertaking this manoeuvre use friction values at many
1 In the same way that a map co-ordinate is a two dimensional parameter and that the knowledge of one of the
co-ordinates is not meaningful without knowledge of the other.

Author(s): P D Sanders 3 January 2021
Technical Reviewer: M Greene
different points on the profile presented in Figure 2-1. Furthermore, the work demonstrated that if Anti-lock Braking Systems (ABS) are activated, the areas of the friction profile used are markedly different to those used when ABS is not activated. This is illustrated in Figure 2-2 which shows an idealised view of the areas on the friction profile used.
Figure 2-2 Friction used by a vehicle undertaking straight line braking, the solid line represents ABS use and the broken line represents braking without ABS
It is likely that different manoeuvres, will use different areas of the friction profile than those illustrated for straight line braking. Gaining an understanding of the areas on the friction profile demanded by vehicles, and the ability of a road surface to deliver friction in these areas is therefore an important consideration to highways authorities in delivering a safe network.
2.3 The implications for the management of road networks
The UK trunk road network is managed such as to broadly normalise the risk of skidding across the network. To achieve this, the road network is split up into various site categories, which relate to the level of risk posed to road users. Each site category is assigned a skid resistance Investigatory Level (IL).
Investigatory Levels are based on measurements made with SCRIM and their relationship to collision risk, with locations which fall at or below their IL being subject to investigation to determine whether treatment to improve the skid resistance would be beneficial. Based on the factors outlined in section 2.2, it may be the case that SCRIM measurements are more reflective of the friction demanded by vehicles in some areas of the network than others.
This view is supported by the outcomes of studies to assess the relationship between skid resistance and collision risk on the network; (Wallbank, Viner, Smith, & Smith, 2016) showed that the relationships were stronger for some situations, such as bends, than others, e.g. non-event motorway. Therefore a better understanding of where SCRIM measurements sit on the friction, slip, speed profile would lead to improvements in how skid resistance is managed on the network.

Author(s): P D Sanders 4 January 2021
Technical Reviewer: M Greene
3 Definition of parameters
Skid resistance measurement tools are typically characterised based on their operating principle:
• Longitudinal fixed slip devices. Devices with a test wheel mounted in the same orientation as the vehicle wheels which is forced to rotate at a fixed percentage of the operating velocity.
• Longitudinal variable slip devices. Devices with a test wheel mounted in the same orientation as the vehicle wheels which during testing alternates between a freely rotating and a locked-wheel (or peak friction) state.
• Sideways-force devices. Devices with a test wheel mounted at an angle to the vehicle wheels. SCRIM operates under this principle.
Skid resistance measurement devices can be further characterised using the terminology outlined in the following sub sections. The definitions of the parameters detailed in these sub-sections will be used throughout the rest of this document.
3.1 Operational velocity
Operational velocity is often referred to as the vehicle speed, and the two terms are frequently used interchangeably. However, for the purposes of this work it is necessary to introduce a subtle difference. For this work, vehicle speed (Vv) is defined as the speed at which the test device traverses the test surface.
In PPR 957 (Sanders & Browne, 2020) operational velocity was described as operating speed with the following definition:
“Operating speed is defined as the effective vehicle speed of the test device.” - (Sanders & Browne, 2020)
To add further clarity, a more detailed definition of operational velocity2 is given below. The practical use of the terms “Operational velocity” in this report and “Operating speed” in PPR 957 are identical.
Operational velocity (Vo) is the speed at which the rotational axis of the test tyre moves with respect to the direction of friction measurement.
3.2 Wheel speed
Wheel speed (Vw) is defined as the tangential linear speed of the circumference of the test tyre.
2 The term “velocity” is used in preference to “speed” as the definition of operating velocity makes reference to
a specific direction.

Author(s): P D Sanders 5 January 2021
Technical Reviewer: M Greene
3.3 Slip speed, Slip Ratio and Percentage Slip
Slip speed (Vs) is defined as “relative speed between the test tyre and the travelled surface in the contact area (British Standards Institution, 2009). This definition can be expressed formulaically using Equation 3-1.
𝑉𝑠 = 𝑉𝑜 − 𝑉𝑤
Where:
• Vs = Slip Speed
• Vo = Operational velocity
• Vw = Wheel speed
Equation 3-1 Definition of slip speed
Slip speed is often expressed as either slip ratio or slip percentage in order to be expressed a relative function of the operational velocity. Percentage slip (% Slip) is defined in Equation 3-2. For the purposes of this work, percentage slip will be used in preference to slip ratio.
% 𝑆𝑙𝑖𝑝 =100 × 𝑉𝑠
𝑉𝑣
Where:
• Vs is the slip speed
• Vv is the vehicle speed
Equation 3-2 Definition of % Slip
3.4 Vertical and horizontal load
Skid resistance is a unit-less parameter calculated as the ratio between vertical and horizontal load. For all skid resistance measurement systems, vertical load is the load acting on the test wheel in the direction of gravity. The definition of horizontal load however differs depending on the specific measurement device. In the case of SCRIM, horizontal load is defined as the load acting on the test tyre along the axis of test wheel rotation (Figure 3-1).

Author(s): P D Sanders 6 January 2021
Technical Reviewer: M Greene
Figure 3-1 Image of the SCRIM measurement system with annotations (Left), diagram of the SCRIM measurement system in plan view
3.5 Critical wheel angle
Whist the wheel angle for SCRIM is fixed at 20 degrees, for some of the later discussion in this report, the concept of Critical Wheel Angle (CWA) is important. The CWA for SCRIM devices was derived by Bird and Miller in their 1937 work (Bird & Miller, 1937) which assessed the skid resistance of various surfaces and at different wheel angles. The results of this work have been replicated in Figure 3-2. As wheel angle increases the Skid Resistance (SR) value increases linearly, until such point as no further substantial change is observed. This point is the CWA.
It should be noted that the CWA is surface dependant and appears to be related to the nominal SR of the surface. For example, on the Rock Asphalt surface, the CWA is met at approximately 8 degrees, and on the Single Coat Asphalt it is met at approximately 20 degrees.

Author(s): P D Sanders 7 January 2021
Technical Reviewer: M Greene
Figure 3-2 Replication of results presented in (Bird & Miller, 1937)

Author(s): P D Sanders 8 January 2021
Technical Reviewer: M Greene
4 Summary of the desk study
The desk study preceding this experimental work is presented in full in (Sanders & Browne, 2020). The characterisations of sideways-force skid resistance measurements devices derived from that work have been summarised in this chapter. It is important to note that these characterisations were based on the assumption that SCRIM is always operating above the CWA. The goal of this desk study was to derive different characterisations of the operation of SCRIM, using the language of operational velocity, slip speed, and slip percentage. Hence the different characterisations arise from considering the impact of varying which aspects of the wheel motion are treated as the operational velocity and slip speed.
4.1 The currently accepted view, 34.2 % slip at 50 km/h operational velocity
In the currently accepted view, the operational velocity is considered to be the vehicle speed, and the slip speed is considered to be the vehicle speed resolved orthogonal to the direction of wheel rotation. Figure 4-1 presents the currently accepted view of SCRIM in graphical and mathematical forms, these are based on the definitions provided by (Henry, 2000).
Figure 4-1 Derivation of the currently accepted view

Author(s): P D Sanders 9 January 2021
Technical Reviewer: M Greene
4.2 Scalar characterisation, 6.04 % wheel slip at 50 km/h operational velocity
The scalar characterisation applies the definitions presented in Chapter 2 directly. The operational velocity is therefore considered as the vehicle speed, and the slip speed is calculated from the wheel speed (which is calculated by resolving the vehicle speed in line with the direction of wheel rotation), and vehicle speed (Figure 4-2).
Figure 4-2 Derivation of the scalar characterisation

Author(s): P D Sanders 10 January 2021
Technical Reviewer: M Greene
4.3 Vector characterisation, 100% wheel slip at 17.1 km/h operational velocity
The vector characterisation considers the operational velocity and slip speed to act in the direction orthogonal to the direction of wheel rotation. This is owing to the direction of measurement of horizontal force for the majority of side-force skid resistance measurement devices (Figure 4-3).
Figure 4-3 Derivation of the vector characterisation

Author(s): P D Sanders 11 January 2021
Technical Reviewer: M Greene
4.4 Co-axial characterisation, 11.7% wheel slip at 50 km/h operational velocity
The co-axial characterisation ‘re-resolves’ the velocities of interest to be co-axial with the direction of interest. Here the operational velocity is defined as the velocity of the vehicle and the wheel speed re-resolved into the direction of travel (Figure 4-4).
Figure 4-4 Derivation of the co-axial characterisation

Author(s): P D Sanders 12 January 2021
Technical Reviewer: M Greene
4.5 Summary
The results of the desk study are summarised in Table 4-1, the relative positions of these results are presented on an idealised friction profile in Figure 4-5. When presenting the results in this way, the importance in understanding the measurement characteristics of SCRIM, with regard to manoeuvres carried out by motor vehicles, becomes clear.
Table 4-1 Summary of desk study
Characterisation Operational velocity % slip
Current The vehicle speed 34.2
Scalar The vehicle speed 6.03
Vector The vehicle speed x Sin(20) 100
Co-axial The vehicle speed 11.7
Figure 4-5 Results of desk study as positions on friction profile
As clear conclusions could not be drawn from the results of the desk study, the following research questions were prompted:
• What is the speed of the SCRIM test tyre, and how does this relate to the vehicle speed?
• What factors influence the speed of the SCRIM test wheel?
• What is the operational velocity for SCRIM?
• At what percentage slip does SCRIM characterise road surface friction?
• What factors influence the operational velocity and percentage slip?
The remainder of this document presents an experimental study which was designed to answer these questions, the approach to which can be summarised as follows:

Author(s): P D Sanders 13 January 2021
Technical Reviewer: M Greene
• A wheel speed rotation sensor was installed on the Highways England Skid Resistance Development Platform (SkReDeP),
• SCRIM wheels and tyres were installed on the Highways England Pavement Friction Tester (PFT) and the trailer weight adjusted to reflect that of the vertical load on SkReDeP,
• Friction measurements were made using the PFT at different operational velocities on surfaces with different nominal friction levels,
• Comparable measurements were made using SkReDeP on the same surfaces and at the same vehicle speeds as those carried out by the PFT.

Author(s): P D Sanders 14 January 2021
Technical Reviewer: M Greene
5 Measurement devices used
5.1 The Skid Resistance Development Platform
Sideway-force Coefficient Route Investigation Machines (SCRIMs) are used for routine monitoring of the skid resistance of the English strategic road network. Figure 5-1 shows the Highways England’s Skid Resistance Development Platform (SkReDeP), which incorporates sideway-force measurement equipment.
Figure 5-1 SkReDeP
SCRIM uses a smooth test tyre installed in the nearside wheel path angled at 20 degrees to the direction of travel, which is mounted on an instrumented axle. The Skid Resistance (SR) value is the average ratio between the measured horizontal and vertical force, multiplied by 100.
For this work, SkReDeP was used in its standard configuration with the only modification being the addition of a wheel speed rotation sensor, measurements were therefore made in accordance with BS 7941-1-2006 (British Standards Institution, 2006).
5.2 The Pavement Friction Tester
The Pavement Friction Tester (PFT) (Figure 5-2) is a locked-wheel road surface friction testing device owned by Highways England and operated on their behalf by TRL. The PFT is comprised of a tow vehicle and trailer. The trailer holds the test wheel, which is mounted on an instrumented axle. The test wheel can be independently braked and the forces acting upon it measured to determine the friction between the test tyre and road surface.
During testing, the load and drag forces on the tyre are measured every 0.01 seconds throughout the braking cycle and from this the friction provided at each percentage slip can

Author(s): P D Sanders 15 January 2021
Technical Reviewer: M Greene
be determined. Combining tests made at different operational velocities can yield data that can be combined to create friction profiles such as that presented in Figure 2-1.
Figure 5-2 Pavement friction tester
As alluded to in the previous chapter, substantial modifications were made to the PFT trailer and as such, measurements made with the PFT did not follow the standards required for PFT tests. These modifications were made in order to make the PFT “look” as much like a SCRIM device as possible (same test tyre and vertical load) such that a direct comparison between the measurements made by both devices could be made. The modifications made are detailed in the following sections.
5.2.1 The addition of SCRIM wheels and tyres
For direct comparison of PFT and SkReDeP measurements, it was necessary to fit the PFT with SCRIM tyres and to set the vertical load on the test wheel to 200kg. To achieve this, interference plates were designed to allow two SCRIM tyres to be installed on to the PFT side by side3. These alterations are shown in Figure 5-3.
3 Four SCRIM tyres were therefore installed on the PFT, two per side.

Author(s): P D Sanders 16 January 2021
Technical Reviewer: M Greene
Figure 5-3 SCRIM tyres installed on the PFT
Two SCRIM tyres were required to be used on the PFT because the PFT trailer weight could not be reduced sufficiently to achieve the 200 kg per tyre weight used on SCRIM (see following section). To this end it was necessary to use two tyres, per side, on the PFT with a 400 kg vertical load on each pair of tyres. Note that in its standard operating mode, there is a 500kg vertical load on each of the wheels on the PFT trailer.
5.2.2 Alteration of trailer weight
As stated in the previous section, the PFT trailer weight was adjusted to reflect the weight on a SCRIM wheel; this was achieved by the removal of steel ballast plates within the trailer and a warning sign assembly that is required for on road testing. To this end the trailer weight was adjusted until 400 kg was applied to each trailer wheel assembly (i.e. set of two SCRIM tyres).
To ensure that this setup would not introduce error in the results, a preliminary study was carried out comparing the friction measurements made with the PFT using one SCRIM tyre at 300 kg per wheel load, with measurements made using two SCRIM tyres at 600 kg load. This study is detailed in 0 and the conclusions can be expressed as the relationship shown in Equation 5-1.
𝑭𝒏𝒎 𝒕 = 𝑭𝒏𝒎𝟐 𝒕𝟐
Where:
• Fnm t is the friction measured on surface x at mass m and using one tyre, and,
• Fnm2 t2 is the friction measured on surface x at mass 2m and using two tyres.
Equation 5-1 Relationship between friction measurements made with one tyre and x1 mass, and two tyres and x2 mass

Author(s): P D Sanders 17 January 2021
Technical Reviewer: M Greene
6 Materials assessed and measurements made
The experimental work required the determination of the friction properties of materials with different nominal friction levels, at a wide range of vehicle speeds, and with multiple measurements being made at each vehicle speed. To this end measurements were made on a closed test track such that the experimental conditions could be controlled, and multiple measurements made in a safe and efficient manner.
The straight line wet grip area at the HORIBA-MIRA proving ground was selected as the test site as it met all of the necessary experimental requirements. This facility has the additional benefit of containing surfaces used in the annual accreditation of sideways-force skid resistance devices in the UK.
Figure 6-1 shows the layout of the straight line wet grip area with the nominal friction values4 of the materials assessed. For this study, measurements were made on the following materials using the regime summarised in Table 6-1:
• Basalt tiles (BT) – A smooth surface constructed from basalt tiles,
• DeluGrip 1 (DG1) – An asphalt surface designed to have high friction values,
• ISO Braking asphalt 1 (ISO1) – An asphalt surface used in standardised braking tests,
• Bridport Pebble (BP) – An asphalt material with bridport pebble aggregate,
• ISO Braking asphalt 2 (ISO2) - An asphalt surface used in standardised braking tests,
• DeluGrip 2 (DG2) - An asphalt surface designed to have high friction values,
4 Reported as values of SC, the standard friction characterisation for SCRIM devices.

Author(s): P D Sanders 18 January 2021
Technical Reviewer: M Greene
Lane 1 Asphalt Ceramic tiles
Lane 2 Basalt tiles SC = 0.131
Lane 3 DeluGrip 1 SC = 0.383 ISO Braking asphalt 1 SC =
0.365
Lane 4 Bridport Pebble SC = 0.215 ISO Braking asphalt 2 SC =
0.376
Deli grip 2 SC = 0.491
Lane 5 Glass plate Smooth Concrete Aquaplaning
area
Figure 6-1 Layout of the HORIBA-MIRA straight line wet grip area
Table 6-1 Summary of measurements made
Mat
eri
al
Measurement runs made with SkReDeP at the following vehicle speeds:
Measurements made with the PFT at the following vehicle speeds:
30 50 80 30 50 80
BT 8 10 8 24 28 43
DG1 8 8 7 27 26 22
ISO1 8 8 8 20 26 25
BP 8 8 8 16 13 4
ISO2 8 8 8 27 27 18
DG2 6 5 6 39 46 42
Measurements were made in such a way as to minimise the effects of track conditioning5. This was achieved by using an alternating test programme where measurements were made in rotation such that track conditioning effects would be averaged out in the data analysis.
5 The act of making a friction measurement alters the friction of the surface.

Author(s): P D Sanders 19 January 2021
Technical Reviewer: M Greene
7 Data processing and analysis
7.1 The calculation of operational velocities for SkReDeP
Data collected using SkReDeP was used as the main data set for this work and against which data collected using the PFT were compared. Comparisons were made in line with the characterisations of SCRIM derived from the desk study (Table 4-1). In order to make these comparisons it is necessary to calculate the operational velocity of the SkReDeP measurements made in line with these characterisations.
For the current, scalar and co-axial characterisations of SCRIM, the operational velocity is equal to the vehicle speed and so no calculation of operational velocity is required. For the vector characterisation, operational velocity is defined as Sin(20) of the vehicle speed. As part of the data analysis an additional column of data was calculated for the measurements made using SkReDeP which performed this operation.
7.2 The generation of friction profiles
To generate comparative data, it was necessary to calculate the friction provided by each surface at each operational velocity / % slip combination, this calculation is referred to as a friction profile. The procedure for generating friction profiles from data collected using the PFT is detailed in Chapter 5 of TRL report PPR 815 (Sanders, Militzer, & Viner, 2017). This procedure can be summarised as:
• Consider the individual measurements made on a given surface at different vehicle speeds,
• interpolate the % slip / friction relationship for each individual measurement to a resolution of 1 % slip,
• interpolate the operational velocity / friction relationship at each % slip using a line of best fit adhering to the power relationship and calculate the friction measurement at each 1 km/h interval using the coefficients of the line of best fit.
The results of this process yielded a friction profile for each material tested. These profiles are presented in 0 and, as an example, the profile generated for the ISO2 material is presented in Figure 7-1.

Author(s): P D Sanders 20 January 2021
Technical Reviewer: M Greene
Figure 7-1 Friction profile generated for the ISO 2 material
7.3 The comparison of SkReDeP and PFT data
To compare data collected using SkReDeP and the PFT, measurements of SR were averaged for each target speed and plotted with respect to the operational velocity for each of the characterisations identified in PPR 957 (Sanders & Browne, 2020). Alongside these data, friction measurements collected using the PFT were plotted which corresponded to the locations on the friction profile representative of the characterisations identified in PPR 957 (Sanders & Browne, 2020).
An example of this for the ISO 2 material and the vector characterisation is shown in Figure 7-2 where:
• the solid series markers represent the average friction or SR value for the operational velocity,
• the shaded series markers represent the individual friction or SR data,
• the solid lines represent lines of best fit through the average friction and SR values individually (the solid series markers), and
• the broken black line represents the line of best fit through all average data collectively.
When assessing the figures comparing measurements made with SkReDeP and the PFT, the R2 value of the lines of best for the broken black lines are primarily used to assess the amount of agreement between the two datasets.

Author(s): P D Sanders 21 January 2021
Technical Reviewer: M Greene
Figure 7-2 A comparison of SR and Friction data for the ISO 2 material and vector characterisation of SCRIM6
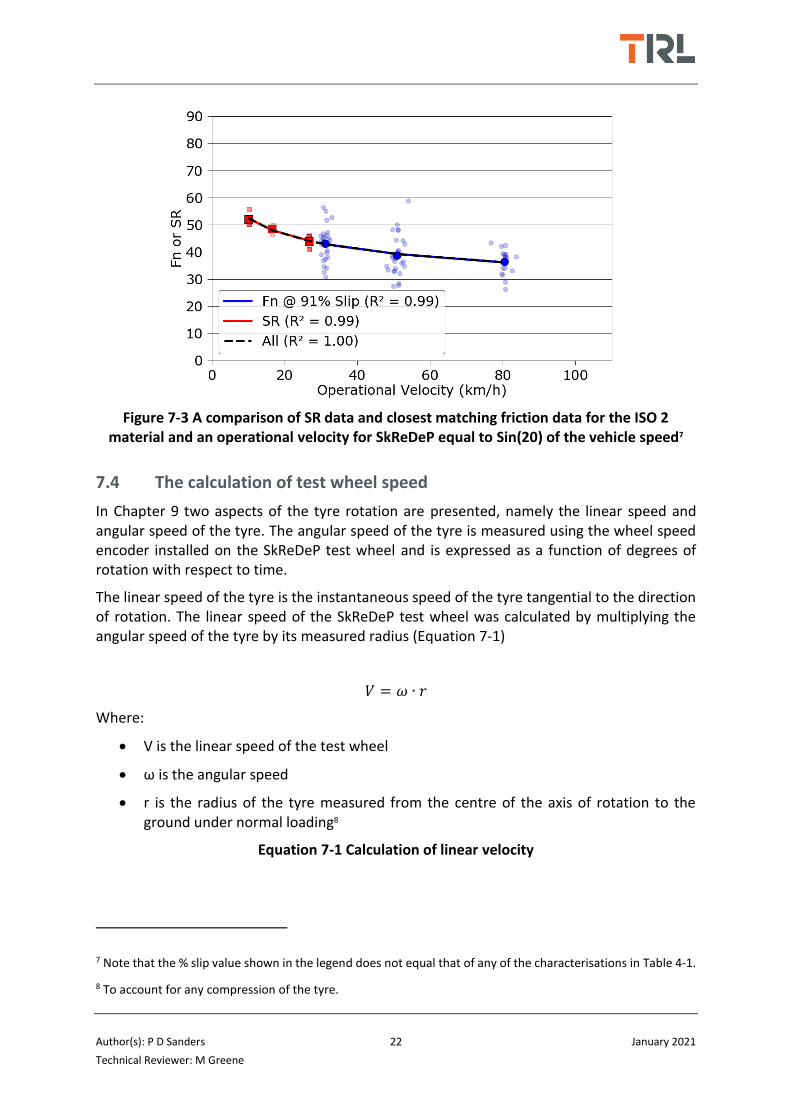
Comparisons of friction and SR data were carried out for each of the characterisations listed in Table 4-1. To contextualise these data, comparisons were also made between SR data (at both operational velocities) and the closest matching friction data.
To achieve this, a regression analysis was carried out whereby friction measurements made at each % Slip were compared to SR data. The R2 value of the line of best fit for all average data (the black broken line) was calculated for each SR / friction data pairing, the data relating to the greatest R2 value were considered the closest matching data. An example of this is shown in Figure 7-3.
The case shown in Figure 7-3 shows SR data where the operational velocity is equal to Sin20 of the vehicle speed. In these cases, the operational velocity of the SR data and friction data do not overlap. This is owing to the limitations on vehicle speeds of the SkReDeP and PFT devices. The minimum vehicle speed of the PFT (for which valid measurements are produced) is 30 km/h. The maximum vehicle speed of SkReDeP is 90 km/h; Sin20 of this speed is 31 km/h.
6 Note that the data presented refer to the operational velocity, not the vehicle speed and as such the SR data
range between 10 km/h and 27 km/h despite measurements having been made at vehicle speeds between
30 km/h and 80 km/h.
Author(s): P D Sanders 22 January 2021
Technical Reviewer: M Greene
Figure 7-3 A comparison of SR data and closest matching friction data for the ISO 2 material and an operational velocity for SkReDeP equal to Sin(20) of the vehicle speed7
7.4 The calculation of test wheel speed
In Chapter 9 two aspects of the tyre rotation are presented, namely the linear speed and angular speed of the tyre. The angular speed of the tyre is measured using the wheel speed encoder installed on the SkReDeP test wheel and is expressed as a function of degrees of rotation with respect to time.
The linear speed of the tyre is the instantaneous speed of the tyre tangential to the direction of rotation. The linear speed of the SkReDeP test wheel was calculated by multiplying the angular speed of the tyre by its measured radius (Equation 7-1)
𝑉 = 𝜔 ∙ 𝑟
Where:
• V is the linear speed of the test wheel
• ω is the angular speed
• r is the radius of the tyre measured from the centre of the axis of rotation to the ground under normal loading8
Equation 7-1 Calculation of linear velocity
7 Note that the % slip value shown in the legend does not equal that of any of the characterisations in Table 4-1.
8 To account for any compression of the tyre.

Author(s): P D Sanders 23 January 2021
Technical Reviewer: M Greene
The calculated linear wheel speeds were compared with the estimated wheel speeds for each material and each test speed. The difference between these two speeds is presented in Chapter 9 as a percentage of the vehicle speed9. For clarity the equation used to derive these values is presented in Equation 7-2
% 𝑟𝑒𝑠 = 100 ∙𝑉𝑤 − 𝑉𝑣𝑆𝑖𝑛(20)
𝑉𝑣
Where:
• % res (residual value) is the difference between the measured and estimated wheel linear speeds as a percentage of the vehicle speed
• Vw is the linear speed of the wheel (Equation 7-1)
• Vv is the speed of the vehicle
Equation 7-2 Calculation of the difference between the measured and estimated wheel linear speeds as a percentage of the vehicle speed
9 To remove the scaling effects of higher vehicle speeds.

Author(s): P D Sanders 24 January 2021
Technical Reviewer: M Greene
8 Results - Assessment of friction measurement characteristics
This chapter presents the friction measurements as described in the previous chapter. Owing to the amount of data presented, and for clarity, each group of six plots generated for each material have been presented as single figures.
Figure 8-1 Friction measurements made on the Basalt Tiles material
Figure 8-1 shows that, with an R2 value of 0.88, of the 4 characterisations assessed, the Vector characterisation provided the closest agreement between the two test devices. The closest matching data were observed at a SkReDeP operational velocity equal to Sin(20) of the vehicle speed and at 28% slip.

Author(s): P D Sanders 25 January 2021
Technical Reviewer: M Greene
Figure 8-2 Friction measurements made on the DeluGrip 1 material
Figure 8-2 shows that, with an R2 value of 0.99, of the 4 characterisations assessed, the
Vector characterisation provided the closest agreement between the two test devices. The
closest matching data were observed at a SkReDeP operational velocity equal to Sin(20) of
the vehicle speed and at 91% slip.

Author(s): P D Sanders 26 January 2021
Technical Reviewer: M Greene
Figure 8-3 Friction measurements made on the ISO Asphalt 1 material
Figure 8-3 shows that, with an R2 value of 0.96, of the 4 characterisations assessed, the Vector characterisation provided the closest agreement between the two test devices. The closest matching data were observed at a SkReDeP operational velocity equal to Sin(20) of the vehicle speed and at 96% slip, and at a SkReDeP operational velocity equal to the vehicle speed and 82% slip.

Author(s): P D Sanders 27 January 2021
Technical Reviewer: M Greene
Figure 8-4 Friction measurements made on the Bridport Pebble material
Figure 8-4 shows that, with an R2 value of 0.90, of the 4 characterisations assessed, the Vector characterisation provided the closest agreement between the two test devices. The closest matching data were observed at a SkReDeP operational velocity equal to Sin(20) of the vehicle speed and at 95% slip.

Author(s): P D Sanders 28 January 2021
Technical Reviewer: M Greene
Figure 8-5 Friction measurements made on the ISO Asphalt 2 material
Figure 8-5 shows that, with an R2 value of 0.96, of the 4 characterisations assessed, the Vector characterisation provided the closest agreement between the two test devices. The closest matching data were observed at a SkReDeP operational velocity equal to Sin(20) of the vehicle speed and at 91% slip.

Author(s): P D Sanders 29 January 2021
Technical Reviewer: M Greene
Figure 8-6 Friction measurements made on the DeluGrip 2 material
Figure 8-6 shows that, with an R2 value of 0.93, of the 4 characterisations assessed, the Current characterisation provided the closest agreement between the two test devices. The closest matching data were observed at a SkReDeP operational velocity equal to Sin(20) of the vehicle speed and at 71% slip.
This is the only case of the 6 where the vector characterisation did not provide the closest match and may demonstrate something fundamental about the measurements made by side-force skid resistance measurement devices on this type of surfacing.

Author(s): P D Sanders 30 January 2021
Technical Reviewer: M Greene
From the results presented in this chapter, the following observations can be made:
• The vector characterisation provides the closest agreement between measurements
made using the PFT and SkReDeP on all but one of the surfaces assessed.
• Of these surfaces, the agreement observed by the vector characterisation is markedly
greater than the agreement observed by the next closest characterisation.
• On the DeluGrip2 surface (the highest friction surface) the closest agreement between
data collected using the PFT and SkReDeP was observed at % slips lower than 100%.

Author(s): P D Sanders 31 January 2021
Technical Reviewer: M Greene
9 Results - Assessment of tyre rotational speed
This chapter presents the results of the test wheel rotational speed measurements. Figure 9-1 presents the Average % res10 of the tyre rotational speed for each material assessed and each vehicle speed. The data have been presented with the sites ordered relating to their nominal friction values.
Figure 9-1 shows that on the Basalt Tiles (BT) material the actual rotational speed of the tyre is markedly lower than its expected rotational speed, and, that this discrepancy increases with vehicle speed. This may provide evidence that the tyre is aquaplaning, or near to aquaplaning. The physical explanation for this is that the friction between the tyre and surface is not great enough to force the tyre to spin at the estimated rotational speed, rather that the tyre is slipping relative to the surface (in addition to the slipping in the direction of the axis of rotation).
Figure 9-1 also shows that for measurements made at 30 km/h, the average % res for the majority of the materials tested, namely the BP, ISO1, ISO2 and DG1 materials, here forth referred to as “the middle four” is approximately zero. However, with increasing speed, the average % res decreases. At 50 km/h the middle four produce an average % res of -0.14 and at 80 km/h, -0.81%.
Figure 9-1 The average residual values for wheel linear speed as a percentage of vehicle speed
The final key observation from Figure 9-1 is that the average % res measured on the DG2 material, the highest friction material, is greater than the middle four for each vehicle speed. Pertinent to this observation are the data presented in Figure 9-2 which show the
10 The difference between measured and predicted linear wheel speed as a percentage of the vehicle speed.

Author(s): P D Sanders 32 January 2021
Technical Reviewer: M Greene
average rotational speed of the test wheel for each material and vehicle speed, expressed as a percentage of the average rotational speed for all materials at each speed.
Figure 9-2 Average rotational speed of the test wheel for each material and speed, expressed as a percentage of the average rotational speed for all materials at each speed.
Figure 9-2 shows that the rotational speed of the tyre on the Basalt Tiles material is markedly lower than that measured on all other materials. This is consistent with the theory that aquaplaning, or near aquaplaning, occurred on this material.
Figure 9-2 also shows that the rotational speed of the tyre on the DeluGrip 2 material is similar to that measured on the middle four. Combining this observation with that showing lower comparative linear speeds, the following argument can be formed:
1. Linear wheel speeds on the DG2 material were greater than those of the middle 4,
2. rotational wheel speeds on the DG2 material were similar to those of the middle 4,
3. linear wheel speed is dependent upon the radius of the tyre,
4. the radius of the tyre can change if the tyre deforms due to vertical load, or stretching due to the friction between tyre and the road,
5. given the relationship between tyre rotational and linear speed given in Equation 7-111, to satisfy points 1 and 2, the conclusion follows that the tyre stretched less (producing a greater radius) on the DeluGrip2 materials than on the middle four.
6. a hypothesis for this conclusion is that the tyre is in a pre-locked condition, in other words, measurements are being made below the critical angle for this material.
11 Linear speed = Rotational speed x Radius

Author(s): P D Sanders 33 January 2021
Technical Reviewer: M Greene
10 Summary and conclusions
10.1 Characterising SCRIM measurements
Comparative measurements made using a modified PFT and SkReDeP have shown that in five of the six cases tested, the characterisation produced by the literature review which most closely matched observation was the 17.1 km/h operational velocity and 100% Slip case. For the sixth case, where measurements were made on the material with the highest skid resistance of those assessed, a markedly different pattern to the friction data, and wheel rotation data were observed; this is discussed further in Section 10.3.
10.2 Aquaplaning or near aquaplaning
The use of an encoder allowed the wheel rotational speed to be measured, and compared to the predicted value which was calculated as wheel speed = vehicle speed x Sin(20). The results for the tests carried out at 30 km/h and 50 km/h showed for materials BP, ISO1, ISO2, and DG1 that this relationship held, indicating the wheel was experiencing the full friction of the road and was not sliding in the direction of travel.
However, for all of the tests carried out on surface BT and for the tests carried out at 80 km/h the measured wheel speed was lower than the predicted wheel speed. This indicates that the friction between the tyre and road surface is not sufficient to cause the tyre to rotate at the predicted speed, and instead it is (partially) sliding in the direction of travel, i.e. it is aquaplaning or nearly aquaplaning.
10.3 Critical wheel angle
The measurements carried out on surface DG2 exhibited a markedly different relationship between the measured friction and vehicle speed to the other surfaces. This was further investigated by considering the linear wheel speed as calculated from the measured rotational wheel speed, and the differences between measured rotational wheel speeds between surfaces.
At low speeds the measured linear wheel speed exceeded the value that would be predicted from the vehicle operational velocity – this indicates that either the angle between vehicle and tyre has changed (unlikely to consistently occur only on surface DG2) or that the radius used in calculating the linear wheel speed from the measured rotational wheel speed is incorrect. As the measured rotational wheel speeds for the materials were similar it can be concluded that the latter is most likely to be the reason for the different behaviour on DG2, and hence the radius of the tyre was greater than expected.
The radius of the tyre results from the combination of the deformation of the tyre due to the vertical load and the stretching of the tyre that results from friction between the tyre and pavement surface. Since the vertical load was kept constant for all tests we can conclude that the tyre must have experienced a different degree of stretching, which we hypothesise is due to the tyre being in a pre-locked condition – i.e. the measurements have been made below the critical angle for this surface.

Author(s): P D Sanders 34 January 2021
Technical Reviewer: M Greene
10.4 Conclusions
From the work carried out, the following conclusions can be made:
• SCRIM measurements are made at an operational velocity of 17.1 km/h and 100% Slip, at the standard vehicle test speed of 50 km/h.
• Aquaplaning or near aquaplaning of the SCRIM tyre occurs on materials with a nominal low skid resistance.
• There is evidence showing that on materials with high nominal skid resistance levels, the critical wheel angle, above which skid resistance measurements no longer increase, may not be being achieved.

Author(s): P D Sanders 35 January 2021
Technical Reviewer: M Greene
Bibliography
ASTM. (2008). ASTM E1337 - 90 Standard Test Method for Determining Longitudinal Peak
Braking Coefficient of Paved Surfaces Using Standard Reference Test Tire. ASTM.
ASTM. (2011). ASTM E274 E274M-11 Standard Test Method for Skid Resistance of Paved
Surfaces Using a Full-Scale Tire. ASTM.
ASTM. (2012). ASTM E524 - 08 Standard smooth tyre for pavement skid resistance tests.
ASTM.
Bird, G., & Miller, R. A. (1937). TP2 Studies in road friction II. An analysis of the factors
affecting measurement. Department of scientific and industrial research and
Ministry of Transport.
Bradley, J., & Allen, R. F. (1930-31). Factors affecting the behaviour of rubber-tyred wheels
on road surfaces. Institute of automobile engineers proceedings, pp. 63-92.
British Standards Institution. (2006). BS 7941-1-2006 Methods for measuring the skid
resistance of pavement surfaces – Part 1 SCRIM. London: BSi.
British Standards Institution. (2009). DD CEN/TS 1509-6:2009 Part 6: Procedure for
determining the skid resistance of a pavement surface by measurement of the
sideway force coefficient (SFCS): SCRIM. London: British Standards Institution.
Department for Transport. (2004). HD 28/04 - Skid resistance (DMRB 7.3.1). London: The
Stationery Office.
Department for Transport. (2004). HD 28/04 Skidding resistance. London: DfT.
Department for Transport. (2015). HD 28/15 - Skid resistance (DMRB 7.3.1). London: The
Stationery Office.
Greene, M., Viner, H., Cerezo, V., Kokot, D., & Schmidt, B. (2014). ROSANNE Deliverable D1.1
Definition of boundaries and requirements for the common scale for harmonisation
of skid resistance measurements. N/A: ROSANNE.
Grime, G. (1953). RN_2029_GG The interpretation of measurements made with the road
research laboratory's motorcycle skidding machine. Road research laboratory.
Henry, J. J. (2000). Evaluation of pavement friction characteristics. NCHRP.
Highways England, Transport Scotland, Welsh Government, Department for Infrastructure.
(2019). CS 228 Pavement inspection and assessment - Skidding resistance. London:
Highways England.

Author(s): P D Sanders 36 January 2021
Technical Reviewer: M Greene
Nordström, O., & Åström, H. (2001). Upgrading of VTI friction test vehicle BV12 for combined
braking and steering tests under aquaplaning and winter conditions . Florence: 2nd
International Coloquium on Vehicle Tyre Road Interaction .
NSW Roads and Maritime Services. (2013). QA Specification R423 Measurement of surface
friction by sideways-force coefficient routine investigation machine (SCRIM). NSW
Roads and Maritime Services.
Roe, P. G., & Dunford, A. (2012). PPR564 The skid resistance behaviour of thin surface course
systems. Wokingham: TRL.
Sanders, P. D., & Browne, C. (2020). PPR957 Characterising the measurements made by
sideways-force skid resistance devices - A desk study and proposal for an
experimental study. Wokingham: TRL.
Sanders, P. D., Militzer, M., & Viner, H. E. (2017). PPR815 Better understanding of the
surface tyre interface. Wokingham: TRL.
Wallbank, C., Viner, H., Smith, L., & Smith, R. (2016). The relationship between collisions and
skid resistance on the Strategic Road Network. TRL Published Project Report PPR806.
Wokingham: TRL.

Author(s): P D Sanders 37 January 2021
Technical Reviewer: M Greene
The double wheel experiment
The aim of the double wheel experiment was to test the assumption that the friction generated between a surface and a vehicle comprising a given mass and given number of tyres per axle, is the same as the friction generated between the same surface and a vehicle with twice the mass and twice the number of tyres per axle. This is shown in Equation A - 1.
𝐹𝑚𝑡 = 𝐹2𝑚2𝑡
Where:
• F = The friction generated between a vehicle and surface
• m = The mass of a vehicle
• t = the number of tyres per axle of a vehicle
Equation A - 1 Definition of the null hypothesis Ho for the double wheel experiment
A.1 Experimental procedure
The experiment was carried out with the PFT modified to accept SCRIM wheels. The study consisted of making multiple measurements of friction on a single surface at the Longcross test track with the PFT trailer in two configurations, namely:
1. With a single SCRIM wheel per axle, and a per axle weight of 260 kg, and,
2. With two SCRIM wheels per axle, and a per axle weight of 520 kg.
The PFT measurements were made at a range of test speeds. Table A - 1 summarises the measurements made.
Table A - 1 Measurements made
Configuration Number of measurements Test speed (km/h)
1 (tyre “A”) Eight tests at each speed 30, 50 and 80
1 (tyre “B”) Eight tests at each speed 30, 50 and 80
2 (tyres “A” and “B”) Eight tests at each speed 30, 50 and 80
To account for variations in tyre performance the same tyres were used for all of the measurements. Both the “A” and “B” tyres were used for the configuration 2 testing, and, configuration 1 testing was carried out with the “A” and “B” tyres separately.
The SCRIM tyres used in configuration 2 were mounted to the PFT in a “back to back” configuration such that the wheel offsets force the tyres away from the PFT trailer hub. Furthermore, during the configuration 1 testing, the positions of the “A” and “B” tyres matched the positions of those tyres in configuration 2.

Author(s): P D Sanders 38 January 2021
Technical Reviewer: M Greene
A.2 Data handling and assessment
Data from both configurations, were plotted on a single graph and a one sample student’s t-test using an alpha level of 5% was carried out. The t-test was carried out for each friction type (P-Fn and L-Fn) and speed pair. This was achieved using Equation A - 2.
𝑡 = �̅�2 − �̅�1
(𝜎2
√𝑛2⁄ )
Where:
• t = the “t” value, a separate t-value will be calculated for each speed
• �̅�1 = the population mean, the mean value from the configuration 1 testing
• �̅�2 = the sample mean, the mean value from the configuration 2 testing
• 𝜎2 = the sample standard deviation, the standard deviation from the configuration 2 testing
• 𝑛2 = the number of tests carried out during the configuration 2 testing
Equation A - 2 Calculation of students t-test “t” value
The t values were compared with the appropriate statistical critical values in order to accept or reject the hypothesis that mesurements made in configuration 1 and 2 are the same (Ho).
The results of this study are presented in Figure A - 1 which shows that in all cases Ho was accepted. It is possible to state with some confidence therefore that 𝐹𝑚𝑎𝑡𝑏
= 𝐹𝑚2𝑎𝑡2𝑏.
Figure A - 1 Results of the double wheel experiment

Author(s): P D Sanders 39 January 2021
Technical Reviewer: M Greene
Friction profiles
Figure B - 1 Friction profile generated for the Bridport pebble material
Figure B - 2 Friction profile generated for the Basalt tiles material

Author(s): P D Sanders 40 January 2021
Technical Reviewer: M Greene
Figure B - 3 Friction profile generated for the DeluGrip 1 material
Figure B - 4 Friction profile generated for the ISO2 material

Author(s): P D Sanders 41 January 2021
Technical Reviewer: M Greene
Figure B - 5 Friction profile generated for the ISO1 material
Figure B - 6 Friction profile generated for the DeluGrip 2 material

Author(s): P D Sanders 42 January 2021
Technical Reviewer: M Greene

Characterising the measurements made by sideways-force skid resistance devices
The effective management of road surface skid resistance is critical in providing a safe means of road travel. The measurement of skid resistance is a key component in the effective management of road surface skid resistance. In the UK the skid resistance properties of the trunk road network are assessed annually using devices utilising the sideways-force measurement principle, the Sideways-force Coefficient Routine Investigation Machine (SCRIM).
Currently, the fundamental measurement characteristics of SCRIM, its percentage slip and operational velocity, are not known. This document presents the results of an experimental study which characterises the measurement properties of SCRIM in terms of percentage slip and operational velocity.
Other titles from this subject area
PPR957 Characterising the measurement characteristics of sideways-force skid resistance mea-surement devices - A desk study and proposal for an experimental study. P D Sanders and C Browne. 2020.
PPR768 Performance review of skid measurementdevices. P D Sanders, S Brittain and A Premathilaka. 2017.
PPR815 Better understanding of the tyre surface interface. P D Sanders, M Militzer and H E Viner. 2017
PPR727 Road surface properties and high speedfriction. P D Sanders, K Morosiuk and J R Peeling. 2014.
TRL
Crowthorne House, Nine Mile Ride, Wokingham, Berkshire, RG40 3GA, United Kingdom T: +44 (0) 1344 773131 F: +44 (0) 1344 770356 E: [email protected] W: www.trl.co.uk
ISSN 2514-9652
ISBN 978-1-913246-90-7
PPR980