characterisation of fresh surface oxidation films formed...
TRANSCRIPT

Corrosion Science 52 (2010) 1992–2000
Contents lists available at ScienceDirect
Corrosion Science
journal homepage: www.elsevier .com/locate /corsc i
Characterisation of fresh surface oxidation films formed on pure moltenmagnesium in different atmospheres
A. Mirak a,1, C.J. Davidson b,*, J.A. Taylor a
a CAST CRC, School of Mechanical and Mining Engineering, The University of Queensland, Brisbane QLD 4072, Australiab CAST CRC, CSIRO Materials Science and Engineering, P.O. Box 883, Kenmore QLD 4069, Australia
a r t i c l e i n f o
Article history:Received 2 October 2009Accepted 2 February 2010Available online 14 February 2010
Keywords:A. MagnesiumB. SEMB. XRDC. Oxide coatingsC. OxidationC. Fluoridation
0010-938X/$ - see front matter � 2010 Elsevier Ltd. Adoi:10.1016/j.corsci.2010.02.003
* Corresponding author. Tel.: +61 7 3327 4535; faxE-mail address: [email protected] (C.J. D
1 Permanent address: University of Science andTehran, Iran.
a b s t r a c t
This paper examines the early stages of surface oxidation of liquid magnesium under argon, air, and airmixed with protective fluorine-bearing gases. Surface film characteristics such as morphology, thicknessand composition are determined. In all cases except argon the film was locally uniform with no evidenceof specific nuclei.
In air, the film thickness was 15–150 nm. Under fluorine-bearing gas mixtures the surface film was amixed fluoride and oxide and more even: 70–100 nm thick under SF6 and 30–50 nm under 1,1,1,2-tetra-fluoroethane. The latter had a substantially lower O:F ratio. Complete conversion of available fluorine intothe film was indicated.
� 2010 Elsevier Ltd. All rights reserved.
1. Introduction
Molten magnesium oxidises readily in an atmosphere contain-ing oxygen, often leading to combustion on the melt surface. In or-der to process molten magnesium safely and efficiently, the melt isnormally protected either by exclusion of oxygen (e.g. coveringwith salt flux or inert gas) or by changing the nature of the surfaceoxide with a cover gas, to slow the oxidation rate down to anacceptable level. The surface film of the melt may have protectiveproperties, and the efficacy of this varies with alloy and cover gascompositions. Several studies, which will be detailed below, havebeen carried out on the oxidation behaviour of molten magnesiumalloys in stagnant melts held isothermally. These studies have typ-ically looked at oxidation after many minutes or even hours, andlittle information is available on the early stages of oxidation.
During the casting process, the molten metal is in motion ratherthan remaining stagnant and fresh surfaces are often exposed.Therefore, the oxide layer is continually subjected to deformationforces and may buckle or fold in compression or, since the oxidefilm is expected to have little or no plasticity, it may tear whensubjected to excessive tension. Tearing will expose more freshmagnesium, which will quickly re-oxidise. Clearly, both fresh aswell as older, thicker oxide films can exist in a casting and the nat-
ll rights reserved.
: +61 7 3327 4455.avidson).
Technology of Iran, Narmak,
ure of the oxide can have a strong influence on the mechanicalproperties of castings.
In this paper, we present a relatively simple methodology thatcan provide information about the early stages of oxidation andfluoridation of freshly exposed magnesium. This should have rele-vance to improving the understanding of both static melt protec-tion and of oxidation during melt handling and casting.
1.1. Previous work on melt protection
As early as 1934, Reimers [1] suggested a number of fluorine-containing compounds that could be used for magnesium meltprotection. However, the use of SF6 in melt protection of magne-sium did not begin until after the work of Fruehling [2] in 1970.Melt protection was attributed to the formation of a thin, continu-ous reaction film that reduced further oxidation and vapourisationof the melt. Fruehling found that the film formed under SF6 wascomprised mainly of MgO with traces of fluorine. It was suggestedthat the mechanism whereby SF6 protected the melt surface wasvia gas adsorption onto the melt surface, with the consequentboundary film forming a diffusion/vapourisation barrier.
Couling and co-workers [3,4] also studied the protection affor-ded by SF6-containing atmospheres to melts of pure magnesiumand AZ91B alloy. They found that CO2 additions improved the pro-tective action of SF6. In their experiments they noted that the SF6
was consumed and suggested two possible mechanisms: theadsorption of SF6 species into the MgO surface film and/or directreaction of the gas with the melt to form MgF2.

A. Mirak et al. / Corrosion Science 52 (2010) 1992–2000 1993
Cashion [5] more recently has used X-ray Photoelectron Spec-troscopy and Auger Spectroscopy along with SEM to study andcharacterise the surface films formed during controlled exposureof molten magnesium to SF6 mixtures. He found the surface filmsconsisted of MgO and MgF2, with the amount of fluoride increasingwith increasing concentration of SF6. Using ion beam sputtering, hefound that the film thickness increased from 80 to 500 nm after1 min and 1 h exposure to air/0.3% SF6, respectively. He also notedthat the composition of the film was uniform throughout the thick-ness. Cashion proposed that SF6 decomposes into SF4, F and SO2F2
and that these species were active in the formation of the protec-tive MgO/MgF2 film. He further proposed that SF6-containingatmospheres improved the wetting between MgO particles andmolten magnesium, allowing the MgO and MgF2 particles to forma dense, flexible surface film under the effect of capillary forces.
Recently, Chen et al. [6] showed that a protective film forms onmolten magnesium surface exposed to HFC-R134a.2 The surfacefilm contained primarily four elements: magnesium, fluorine, oxy-gen and carbon. X-ray Diffraction (XRD) was used to identify the fol-lowing phases: MgF2, MgO and C (unspecified form). The filmproperties depended on the R134a concentration in the gaseous mix-ture and exposure time. The thickness of the film formed after expo-sure to air containing 0.5% R134a for 10 min was about 1–2 lm.
Liu et al. [7] examined the influence at 760 �C of concentrationof R134a mixed in air on both oxidation rate and film composition.The concentration of R134a was varied over the range 0.001–5%.Increasing concentration of R134a was associated with bothdecreasing oxidation rate, measured as weight gain, and increasingratio of MgF2 to MgO in the surface layer. Both pure Mg and anAZ91D alloy were studied, and both the oxidation rates and oxida-tion product were shown to vary significantly with meltcomposition.
In the experiments of Pettersen et al. [8], a small amount of sul-phur was found in the surface oxide film when the melt was pro-tected by SO2; however, fluorine was the only additional elementdetected in the surface film when SF6, NF3 or ICEON93 were usedfor melt protection. In each case the reported structure was identi-fied as microcrystalline MgO, with elements present in a consistentatomic ratio near Mg:O:F = 58:25:17. Film thicknesses were of theorder of 100 nm after several minutes exposure. MgF2 was also iden-tified in some samples, particularly at longer exposure times.
Aarstad et al. [9] used various techniques to study the surface ofmagnesium protected by SF6. They found that the thickness of thefilm increased from 0.3 to 3 lm as holding time increased over therange 5 min to many hours. A trend of thickness increasing withholding temperature was also reported. Large spots containingMgF2 formed on the interface between the oxide film and the bulkmolten magnesium. These spots grew until they covered 25–50% ofthe total surface area.
This current research was conducted in order to extend theunderstanding of the early stages of surface oxide formation andgrowth under conditions similar to those occurring during castingor melt handling. The aim was to compare the morphology andcomposition of these oxide films formed in different atmospheresvia the introduction of different bubble gases into a melt solidify-ing in a permanent mould.
2. Experimental procedure
Commercial purity magnesium ingot was used, with a statedpurity of >99.9% and major impurities of Al and Si each at�0.03 wt%, and Mn � 0.02 wt%. It was melted in an electrical resis-
2 HFC-R134a is the standard designation of the refrigerant gas which is a poly-fluorinated hydrocarbon: (1,1,1,2 tetrafluoroethane).
3 ICEON9 is a poly-fluorinated hydrocarbon blend containing mainly HFC-R134a.
tance furnace under the protection of an SO2/air mixture. This wasused to avoid any possibility of contamination from residual fluo-rine that might happen if a fluorine-bearing cover gas was used atthis stage. The holding temperature was 700 ± 5 �C. Each melt wascast into a preheated permanent mould (at 450 ± 10 �C) to producea simple plate casting via a bottom gating system. The base of thecasting was 14 mm thick, tapering linearly to 7 mm near the top. Adisposable thin stainless steel tube (1 mm ID, 1.6 mm OD) was in-serted horizontally into the base of the mould cavity. Differentgases were metered, mixed and introduced through these tubesto provide a short burst of bubbles into the plate casting. Most orall of the bubbles were trapped during the solidification process.The following gas mixtures were used to create the bubbles: ultrahigh purity (UHP) argon; industrial dry air; 3.5% SF6 in dry air; and3.5% HFC-R134a in dry air. The feed gas purities and significantimpurities are as follows:
(i) UHP argon, min 99.999%, O2 < 1 ppm, H2O < 2 ppm.(ii) Industrial dry air: 20.9% O2. H2O typically 25 ppm.
(iii) SF6: min 99.8%; CF4 < 1000 ppm; H2O < 120 ppm; typicalacidity (HF) 0.3 mg/kg; hydrolysable fluorides 1 mg/kg.
(iv) 1,1,1,2 Tetrafluoroethane (HFC-R134a): min 99.5%. H2O <10 ppm; acidity (HF) 1 ppm; other refrigerants 0.5 ppm.
A schematic diagram of the experimental set-up is shown inFig. 1; while Fig. 2 shows a section through a plate casting with atrapped bubble and the inside surface exposed to the gas beingthe object of study.
After changing gas mixtures, the gas lines were purged. Beforeeach casting, the solenoid was opened for approximately 5 minto flush the gas feed line. The gas flow was stopped just beforethe casting was poured and as soon as the casting was filled thesolenoid was manually operated for about 2 s to let in a small flowof gas. The operating parameters (reservoir overpressure, feed pipediameter and feed duration) were initially determined by watermodelling, although the influence of surface tension was not ac-counted for. Preliminary castings verified that the bubble forma-tion was occurring as expected.
For each experimental condition, four castings were made. X-ray radiography on each plate was used: (a) to ensure that the bub-ble cavity had not been exposed to ambient air during casting; and(b) to enable the bubble to be exposed by cutting away at the edge.Samples were cut manually with a dry saw under ambient labora-tory conditions. The possible influence of subsequent exposure toroom-temperature air was of concern, and will be discussed below.
A section of the bubble surface was transferred to a scanningelectron microscope model JEOL 6460 LA, for imaging and for anal-ysis of the chemical constituents using an attached energy disper-sive X-ray (EDX) spectrometer. This spectrometer had an ultra-thinwindow suitable for light element analysis. All analyses were car-ried out at 12 kV.
2.1. Film thickness measurement
Early measurements of oxygen X-ray intensity of these samplessuggested that the local film thickness was quite variable at differ-ent locations on the bubble surface. Surface analysis techniquesthat rely on destructive sputtering require an assumption of filmuniformity over the area of analysis to determine the depth profile,and so are not suitable where samples vary on such a local scale. Asuitable micro-scale technique involves repeated EDS analysis inthe SEM using measurements at a range of accelerating voltages.This would be quite a suitable technique for these samples, how-ever it can be quite time-consuming and good accuracy requires alocally flat sample at a known, preferably normal, orientation tothe electron beam. Therefore it was decided that the best

Fig. 3. Typical calibration curves of X-ray intensity ratio against film thickness. Thefilm material labelled MgOF was the composition given by Pettersen et al. [7] asMg:O:F = 58:25:17.
Fig. 4. Calculated calibration curves of X-ray intensity ratio against film thicknessfor various ratios of Mg, O and F. The trends in O/F ratio are plotted on the right-hand scale and indicate near-independence on film thickness. The ‘‘thicknesses” arenotional as there are no known phases of those compositions and are based on anassumption that density scales to the ratio of MgO to MgF2.
Fig. 1. A schematic diagram of the experimental set-up.
Fig. 2. A schematic diagram showing a section of a plate casting with a trappedbubble, and the surface of interest for studying the formed surface films.
1994 A. Mirak et al. / Corrosion Science 52 (2010) 1992–2000
compromise would be a simple semi-quantitative technique to ade-quately characterise the local film thickness, while allowing time tomore thoroughly examine the spatial variation. The procedure wasto prepare calibration curves of Mg/O and Mg/F X-ray intensity ra-tios against film thickness, for various film materials. These curveswere produced by Monte-Carlo simulation of X-ray generation un-der an electron beam, using the Casino software package [10]. Thedetector efficiency for each element of interest was scaled by com-paring the predicted and measured responses for known standardssuch as pure Mg, MgO, CaF2 and dolomite. The influence of the car-bon coating of the reference materials was included in the model-ling, but bubble samples were not carbon coated, because thefilms were sufficiently thin that charge build-up was not apparentin the presence of the conductive substrate.
Typical calibration curves are shown in Figs. 3 and 4. The linearregions for thinner films up to 200 nm thick could be fitted to anequation of the form:
RI ¼ A� tb ð1Þ
where RI is intensity ratio, t is the thickness and A and b are fittedparameters. The value of b was always found to be in the range�1.1 to �1.2. The value of A is determined by surface layercomposition.
The typical bubble surface is not flat, and cannot be placed to beexactly normal to the incident electron beam. This introduces fur-ther uncertainty into the analysis. Modelling the effect of sampletilt showed that for a 50 nm film of MgO, tilting generally de-creased the Mg/O intensity ratio, which is equivalent to an increasein apparent film thickness. For tilt ranges between �15� and +20�the thickness error was less than 10%, where a negative anglewas defined as one away from the X-ray detector. This amount oferror was considered acceptably small, as most samples could bemounted such that the average surface was within that range.
There remain small features within the sample that exhibited largelocalised changes in surface angle, but analysis of these wasavoided.

A. Mirak et al. / Corrosion Science 52 (2010) 1992–2000 1995
The literature is not consistent as to the film compositions.While MgO and MgF2 crystal structures have been consistently re-ported, there is disagreement as to whether significant F is presentin the MgO lattice. A set of simulations was made to compare theresponse expected from a uniform layer of compositionsx(MgO)�MgF2 (with x varying from 1 to 3) against the responsesof separate layers of MgO and MgF2, one on top of the other. Thedensity of these composite phases was assumed to be the meanof the other known crystals, and equivalent layer thicknesses werecomputed to give the same number of atoms per unit area of filmfor each element. For a 100 nm film, an incorrect assumption oflayer structure would give maximum thickness error of ±5% fromthe oxygen intensity and ±1% from the fluorine. An alternativeinterpretation is that a 10% error in oxygen to fluorine ratio wouldarise from an incorrect assumption of MgO/MgF2 layer ordering.Thus, determining the exact disposition of O and F is not possiblein the simplified approach taken here.
2.2. Film thickness limit
The following calculation presents a simple method of estimat-ing the maximum thickness of a surface film formed by assumingcomplete conversion of gaseous oxygen to oxide of a uniformthickness. Eq. (2) gives the film thickness, in the units matchingvolume and area, to be
t ¼ FO;air � qair � VFO;MgO � qMgO � A
ð2Þ
where, FO,x is the mass fraction of oxygen in material x, qx is thedensity of material x, V is the bubble volume and A is the surface
Fig. 5. Optical photographs of the reaction films produced under different atmospheres orotated 90�, with region C being closest to the top), (c) air/3.5% SF6, and (d) air/3.5% R13
area. This equation ignores changes in the bubble dimensions. Thebubble shape was approximately an oblate spheroid, with a minordiameter between 3 and 6 mm, and major diameter about 20 mm.
This yields thickness predictions in the range 50–120 nm,depending on bubble dimensions, with typical bubble sizes givingpredictions of 100 nm or more. Of course other uncertainties, suchas incomplete conversion or uneven film thickness, will extend therange somewhat.
3. Results and discussion
3.1. Surface film morphology
Fig. 5 shows optical photographs of the typical surface filmsformed under different bubble atmospheres. As can be seen inFig. 5a, many tiny black regions form on an otherwise greyish sur-face in the presence of the 100% argon atmosphere. The surfacefilm formed under dry air was quite variable: appearing dark withmany visible bands in some areas (arrowed), while being quiteshiny in other areas (Fig. 5b). The film showed colouration that ischaracteristic of interference effects, although it was dominatedby absorption in the thicker regions. The surface films that formunder dilute SF6 and HFC-R134a atmospheres (Fig. 5c and d,respectively) are moderately shiny, with a colour that suggeststhe formation of a relatively uniform protective film on the surface.
3.2. Phase analysis
X-ray diffraction analysis was performed using a Bruker GADDSmicrodiffractometer. The analysed area was approximately 0.8 mm
n the inside surface of bubbles: (a) UHP argon, (b) industrial dry air (note: sample is4a. The different areas labelled in (b) are described below under SEM observations.

1996 A. Mirak et al. / Corrosion Science 52 (2010) 1992–2000
diameter. The surface film was generally finely crystalline, and gaverise to diffraction rings, while the underlying Mg crystals usuallycaused a small number of spots, with some streaking attributed tosmall-angle grain boundaries. The presence of MgF2 was confirmedon all surfaces created under fluorine-bearing atmospheres. No sur-face phase was identified in the areas of thinnest oxide (A and B ofFig. 5b), and the film formed under argon was not examined.
Oxygen was present either as MgO and/or Mg(OH)2, where thelatter is thought to have formed after casting, by reaction betweenMgO and ambient water vapour. While the SEM analysis was car-ried out very soon after the exposing the bubble, the samples werethen stored in a sealed container for some months before XRDanalysis. The Mg(OH)2 was invariably finely crystalline, but theMgO was only observed in that form when grown under air. UnderSF6, MgO was only detected occasionally, and in those cases, MgOwas represented by single diffraction spots, indicating a coarsegrain size. A preferred growth orientation may have made the pres-ence of MgO more difficult to detect by this technique.
A small number of other unidentified peaks were observed.
3.3. X-ray elemental analysis – qualitative
A total of nearly 50 spectra were collected, both from areas rep-resentative of large fractions of the surface as well as from lessabundant features. The representative spectra, as shown in Fig. 6,showed characteristics that were distinct for each gas condition.As would be expected, the bubbles of air resulted in surfaces withthe largest oxygen peaks, and fluorine was a constant feature ofbubbles formed using either SF6 or R134a.
There are a number of other features that deserve comment.The carbon peak appears significant; however the X-ray detectorwindow is of a material that absorbs O and F X-rays more heavilythan C X-rays, thus making it far more sensitive to C than to O or F.The intensity of the C peak in these samples is a factor of 10 lowerthan observed from the carbon film that was evaporated onto theMgO standard to aid electrical conductivity. It is concluded thatthe carbon comes from the breakdown of residual gasses in thevacuum chamber under the electron beam, rather than from con-tamination of the feed gas with CO2 or some other C-bearing gas.There was no evidence of higher carbon intensity when the bubblecontained HFC-R134a than the other gases.
Silicon is the major impurity of the source ingot, at approxi-mately 0.03 wt%. It is assumed that the levels of Si observed underargon, air and R134a are consistent with this, but the peak inten-sity under SF6 is consistently higher than for the other gases, sug-
Fig. 6. Representative EDX spectra of the surface films of bubbles formed in pureMg with different bubble gases atmospheres. These spectra have been normalisedto the Mg Ka peak.
gesting some minor preferential diffusion to the surface under SF6.This was not investigated in any more detail.
3.4. Film observations under SEM
Figs. 7–10 show various SEM images of the physical structure ofthe surface films observed on the inside surfaces of entrapped bub-bles in pure magnesium formed under the different atmospheres. Arange of macro and microstructures is apparent and can be under-stood only by viewing cross-sections as well as the surfaces (how-ever these have not been included here). There are irregularities onthe bubble surface, most of which protrude into the gas cavity,while some are depressions in the surface. The microstructure ap-pears dendritic, but is better described as cellular, with the growthdirection generally from the mould wall towards the bubble.Hence, when viewing normal to the surface, the growth directionwould have been towards the viewer. There is a mixture of grainstructures, with large floating equiaxed grains, as well as the direc-tional cellular grains. Grain size was generally of the order of mm,although was not specifically measured.
3.4.1. ArgonThe primary purpose of using pure argon was to ascertain the
limits of the technique, in terms of contamination in the gas deliv-
Fig. 7. SEM images of the inside surface of an entrapped argon bubble in a pure Mgplate casting: (a) secondary electron image of the typical microstructure showingthicker oxide patches and smooth surface over the dendritic/cellular structure; (b)back scattered electron (BSE) image of the region shown in (a). Darker intensitypatches result from the slightly lower mean atomic number of oxides; thedarkening at the cell boundaries is most likely a topographic effect.
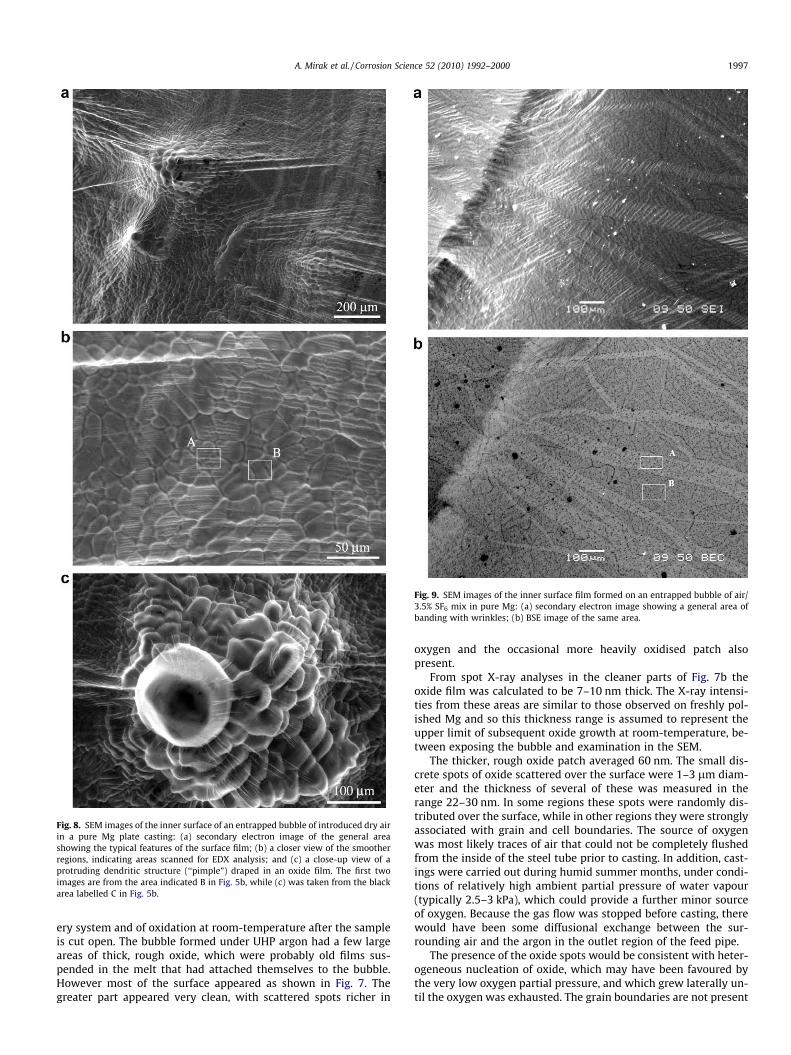
Fig. 8. SEM images of the inner surface of an entrapped bubble of introduced dry airin a pure Mg plate casting: (a) secondary electron image of the general areashowing the typical features of the surface film; (b) a closer view of the smootherregions, indicating areas scanned for EDX analysis; and (c) a close-up view of aprotruding dendritic structure (‘‘pimple”) draped in an oxide film. The first twoimages are from the area indicated B in Fig. 5b, while (c) was taken from the blackarea labelled C in Fig. 5b.
Fig. 9. SEM images of the inner surface film formed on an entrapped bubble of air/3.5% SF6 mix in pure Mg: (a) secondary electron image showing a general area ofbanding with wrinkles; (b) BSE image of the same area.
A. Mirak et al. / Corrosion Science 52 (2010) 1992–2000 1997
ery system and of oxidation at room-temperature after the sampleis cut open. The bubble formed under UHP argon had a few largeareas of thick, rough oxide, which were probably old films sus-pended in the melt that had attached themselves to the bubble.However most of the surface appeared as shown in Fig. 7. Thegreater part appeared very clean, with scattered spots richer in
oxygen and the occasional more heavily oxidised patch alsopresent.
From spot X-ray analyses in the cleaner parts of Fig. 7b theoxide film was calculated to be 7–10 nm thick. The X-ray intensi-ties from these areas are similar to those observed on freshly pol-ished Mg and so this thickness range is assumed to represent theupper limit of subsequent oxide growth at room-temperature, be-tween exposing the bubble and examination in the SEM.
The thicker, rough oxide patch averaged 60 nm. The small dis-crete spots of oxide scattered over the surface were 1–3 lm diam-eter and the thickness of several of these was measured in therange 22–30 nm. In some regions these spots were randomly dis-tributed over the surface, while in other regions they were stronglyassociated with grain and cell boundaries. The source of oxygenwas most likely traces of air that could not be completely flushedfrom the inside of the steel tube prior to casting. In addition, cast-ings were carried out during humid summer months, under condi-tions of relatively high ambient partial pressure of water vapour(typically 2.5–3 kPa), which could provide a further minor sourceof oxygen. Because the gas flow was stopped before casting, therewould have been some diffusional exchange between the sur-rounding air and the argon in the outlet region of the feed pipe.
The presence of the oxide spots would be consistent with heter-ogeneous nucleation of oxide, which may have been favoured bythe very low oxygen partial pressure, and which grew laterally un-til the oxygen was exhausted. The grain boundaries are not present
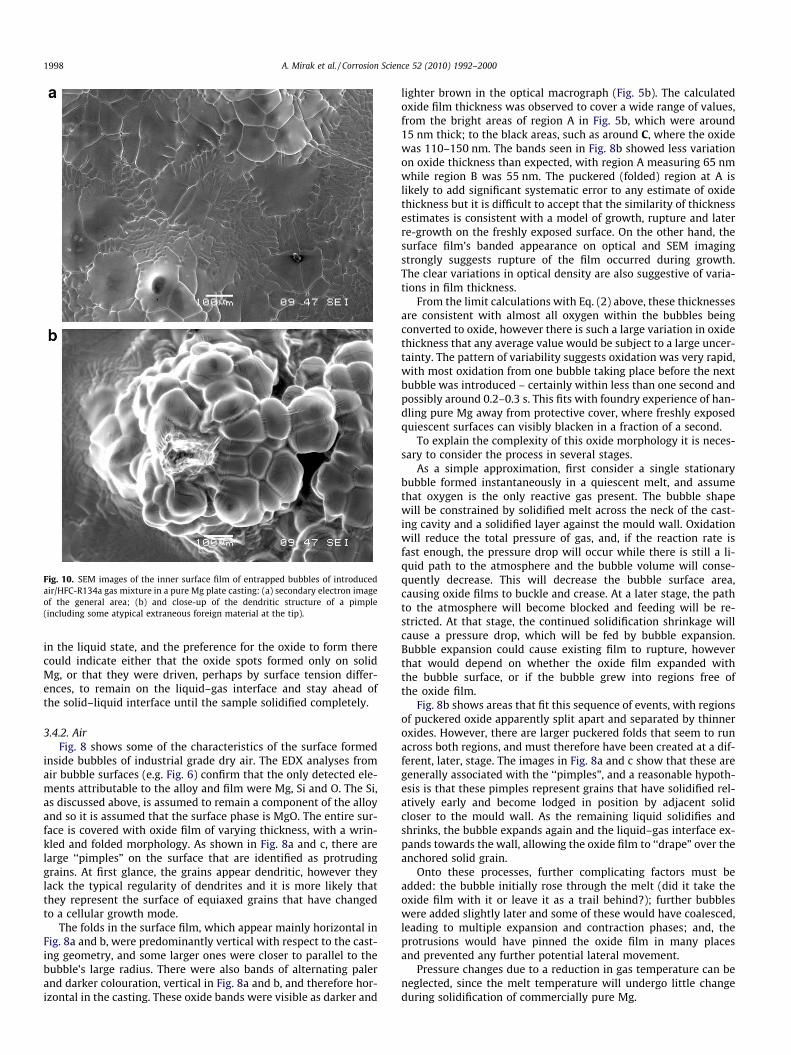
Fig. 10. SEM images of the inner surface film of entrapped bubbles of introducedair/HFC-R134a gas mixture in a pure Mg plate casting: (a) secondary electron imageof the general area; (b) and close-up of the dendritic structure of a pimple(including some atypical extraneous foreign material at the tip).
1998 A. Mirak et al. / Corrosion Science 52 (2010) 1992–2000
in the liquid state, and the preference for the oxide to form therecould indicate either that the oxide spots formed only on solidMg, or that they were driven, perhaps by surface tension differ-ences, to remain on the liquid–gas interface and stay ahead ofthe solid–liquid interface until the sample solidified completely.
3.4.2. AirFig. 8 shows some of the characteristics of the surface formed
inside bubbles of industrial grade dry air. The EDX analyses fromair bubble surfaces (e.g. Fig. 6) confirm that the only detected ele-ments attributable to the alloy and film were Mg, Si and O. The Si,as discussed above, is assumed to remain a component of the alloyand so it is assumed that the surface phase is MgO. The entire sur-face is covered with oxide film of varying thickness, with a wrin-kled and folded morphology. As shown in Fig. 8a and c, there arelarge ‘‘pimples” on the surface that are identified as protrudinggrains. At first glance, the grains appear dendritic, however theylack the typical regularity of dendrites and it is more likely thatthey represent the surface of equiaxed grains that have changedto a cellular growth mode.
The folds in the surface film, which appear mainly horizontal inFig. 8a and b, were predominantly vertical with respect to the cast-ing geometry, and some larger ones were closer to parallel to thebubble’s large radius. There were also bands of alternating palerand darker colouration, vertical in Fig. 8a and b, and therefore hor-izontal in the casting. These oxide bands were visible as darker and
lighter brown in the optical macrograph (Fig. 5b). The calculatedoxide film thickness was observed to cover a wide range of values,from the bright areas of region A in Fig. 5b, which were around15 nm thick; to the black areas, such as around C, where the oxidewas 110–150 nm. The bands seen in Fig. 8b showed less variationon oxide thickness than expected, with region A measuring 65 nmwhile region B was 55 nm. The puckered (folded) region at A islikely to add significant systematic error to any estimate of oxidethickness but it is difficult to accept that the similarity of thicknessestimates is consistent with a model of growth, rupture and laterre-growth on the freshly exposed surface. On the other hand, thesurface film’s banded appearance on optical and SEM imagingstrongly suggests rupture of the film occurred during growth.The clear variations in optical density are also suggestive of varia-tions in film thickness.
From the limit calculations with Eq. (2) above, these thicknessesare consistent with almost all oxygen within the bubbles beingconverted to oxide, however there is such a large variation in oxidethickness that any average value would be subject to a large uncer-tainty. The pattern of variability suggests oxidation was very rapid,with most oxidation from one bubble taking place before the nextbubble was introduced – certainly within less than one second andpossibly around 0.2–0.3 s. This fits with foundry experience of han-dling pure Mg away from protective cover, where freshly exposedquiescent surfaces can visibly blacken in a fraction of a second.
To explain the complexity of this oxide morphology it is neces-sary to consider the process in several stages.
As a simple approximation, first consider a single stationarybubble formed instantaneously in a quiescent melt, and assumethat oxygen is the only reactive gas present. The bubble shapewill be constrained by solidified melt across the neck of the cast-ing cavity and a solidified layer against the mould wall. Oxidationwill reduce the total pressure of gas, and, if the reaction rate isfast enough, the pressure drop will occur while there is still a li-quid path to the atmosphere and the bubble volume will conse-quently decrease. This will decrease the bubble surface area,causing oxide films to buckle and crease. At a later stage, the pathto the atmosphere will become blocked and feeding will be re-stricted. At that stage, the continued solidification shrinkage willcause a pressure drop, which will be fed by bubble expansion.Bubble expansion could cause existing film to rupture, howeverthat would depend on whether the oxide film expanded withthe bubble surface, or if the bubble grew into regions free ofthe oxide film.
Fig. 8b shows areas that fit this sequence of events, with regionsof puckered oxide apparently split apart and separated by thinneroxides. However, there are larger puckered folds that seem to runacross both regions, and must therefore have been created at a dif-ferent, later, stage. The images in Fig. 8a and c show that these aregenerally associated with the ‘‘pimples”, and a reasonable hypoth-esis is that these pimples represent grains that have solidified rel-atively early and become lodged in position by adjacent solidcloser to the mould wall. As the remaining liquid solidifies andshrinks, the bubble expands again and the liquid–gas interface ex-pands towards the wall, allowing the oxide film to ‘‘drape” over theanchored solid grain.
Onto these processes, further complicating factors must beadded: the bubble initially rose through the melt (did it take theoxide film with it or leave it as a trail behind?); further bubbleswere added slightly later and some of these would have coalesced,leading to multiple expansion and contraction phases; and, theprotrusions would have pinned the oxide film in many placesand prevented any further potential lateral movement.
Pressure changes due to a reduction in gas temperature can beneglected, since the melt temperature will undergo little changeduring solidification of commercially pure Mg.

Fig. 11. Correlation between equivalent thicknesses of MgO and MgF2 for thesamples formed using SF6 and HFC-R134a. The reference lines are the simulatedlines for 2MgO.MgF2, (dashed) and the composition of Pettersen et al. [3].
A. Mirak et al. / Corrosion Science 52 (2010) 1992–2000 1999
3.4.3. Sulphur hexafluoride, SF6
Fig. 9 shows the typical characteristics of the bubble surfacefilm formed under an atmosphere of air containing 3.5% SF6. Thereare many bands orientated in various directions, typically of the or-der of a 100 lm broad and several millimetres long. These bandshave a wrinkled topography compared with the flatter surround-ings of the islands (Fig. 9a). There are other regions however,where these bands are not evident, and the surface is relativelyuniform.
The EDX analysis shows, in general, a very consistent O/F inten-sity ratio in the range 0.64–0.67, which is very close to an equi-atomic oxygen:fluorine ratio, according to the calibration inFig. 4. The one atypical intensity ratio was a measurement in thewrinkled band in region A of Fig. 9b, which gave a ratio of 2.4. Ifwe instead express the O and F measurements as equivalent thick-nesses of independent MgO and MgF2 layers, then all oxide thick-nesses are in the range 37–57 nm, while fluoride thicknesses are inthe range 33–51 nm, except for region A in Fig. 9b, where theequivalent thickness is only 12 nm. By using Eq. (2), with adapta-tions for SF6, it is evident that the average layer thickness indicatesapproximately complete conversion of all available fluorine to thefilm compound. Furthermore, the intensity of the S peak in the EDXspectrum is also consistent with most of the sulphur being presentin the film. There is no indication as to what chemical form thistakes.
The backscattered electron image in Fig. 9b confirms thereduced amount of total O + F in the wrinkled bands (region A)– the brighter image indicating a higher mean atomic number. Thisis the opposite of observations on the bands formed in air, wherethe wrinkled bands were calculated to be thicker and were darkerin back scattered electron (BSE) images (not shown). It seems thatthese bands might have a different formation sequence under SF6
than in air. One plausible explanation is that the fluoride formsfirst, the film cracks due to excessive tensile strain, and the oxidegrows later, at a time when the bubbles are no longer changing sizeas much. The low fluoride content of these regions might be simplybecause most of the available fluorine has already reacted. Thefresher film formed in these cracks, being thinner, would be moreprone to folding/wrinkling to accommodate shear or compressivestrains.
A plausible reason for the differing observed effects of bubblegas composition could be simply that there are different oxidationrates in each case, and that the various strains imposed during thestages of the bubbles rising, i.e. contracting and expanding, occurduring different film growth stages. This would mean that the ob-served morphology may be more dependent on experimental con-ditions and less on being a property of the gas reaction.
3.4.4. HFC-R134aFig. 10 shows a smoother (and apparently very thin) surface
film that forms over the granular/dendritic structure under theinfluence of an air/3.5% R134a mix. The surface film appears uni-form and largely undamaged. The underlying microstructure isclearly visible with both coarse and small grains (ranging from10 to 500 lm diameter) with a wide range of cell size also. Again,pimple-like structures are evident at low magnification (Figs. 5dand 10a) and these turn out to be protruding grains when observedat higher magnification (Fig. 10b).
The EDX spectra (Fig. 6) show very similar levels of fluorine tothe samples prepared using an air/SF6 mixture. Oxygen levels, onthe other hand are consistently lower with R134a than with SF6.The O/F ratio was in the range 0–0.2, with higher values only ob-served in unusual circumstances. This suggests that the film is pre-dominantly MgF2, with a small amount of MgO. Furthermore, itsuggests that the reaction with fluorine must be quite rapid, sup-pressing oxide formation at a very early stage. The calculated value
of average MgF2 thickness was 34 nm. As with SF6, this is consis-tent with conversion of all fluorine in the HFC-R134a to MgF2.
The film composition agrees with the results presented by Liuet al. [7] after long term exposure to a similar gas composition at760 �C. They were able to confirm MgF2 using X-ray diffraction,but could detect the presence of oxygen only in the XPSmeasurements.
A comparative plot of the equivalent film thicknesses for allmeasured samples under SF6 and R134a gas mixtures is shown inFig. 11. There is clear, non-overlapping discrimination betweenthe films formed under each gas mixture. This analysis is basedon typical surface measurements and ignores the R134a outliers,which is reasonable, as they were measurements from uncommon,atypical features such as the rough particle shown in Fig. 10b. Thefilms formed under R134a form a cluster showing scatter thatwould be expected in a typical situation where fluorine contentis independent of oxygen. Most SF6 results, on the other hand,show a strong correlation between oxygen and fluorine content.Moreover, this correlation is very close to that predicted for amaterial with a stoichiometry of oxygen and fluorine being presentin equal atomic fractions. It is unlikely that two independent filmscould grow with such a strong correlation, but there are no knownmagnesium oxy-fluoride compounds [11]. A phase, intermediatesellaite, is known with the composition Mg(F,OH)2, with fluo-rine � oxygen [12], but the presence of sufficient hydrogen for thisto form is considered unlikely in these experiments. The GADDSanalysis was not sensitive enough to discriminate between thevery similar crystallographies of Mg(F,OH)2 and MgF2, but the factthat neither MgO nor Mg(OH)2 was detected means that the ques-tion remains unresolved. A preferred stoichiometry is contradictedby the measured composition of the films in the wrinkled areas,which have much lower fluorine levels, however that may be ex-plained by the films forming later, after the majority of the avail-able F has been exhausted.
These observations were not consistent with the compositionsuggested by Pettersen et al. [8], irrespective of whether the anal-ysis here treats the surface as separate films or a homogeneouslayer.
4. Conclusions
1. The introduction of a gas via a bubble stream into a melt is anovel and safe method for the study of the early stages of sur-face film formation without the complicating issue of exposed

2000 A. Mirak et al. / Corrosion Science 52 (2010) 1992–2000
melt contamination in furnaces. The technique would needsome improvements to be reliable at very low oxygen partialpressures.
2. The composition of the bubble atmosphere strongly affects thecharacteristics of the surface film formed in pure magnesium:in terms of thickness, morphology and composition. However,the morphology that is observed is likely to be sensitive to spe-cific details of experimental casting design rather than the gascomposition directly. Thicker oxide and fluoride films showedwrinkling and puckering effects such as might have beencaused by shear or compression caused by bubble size changesor flow of the underlying melt.
3. The argon atmosphere apparently became contaminated withtraces of oxygen or water that allowed the formation of nucleiof oxide on the melt surface. The small numbers of discreteoxide films, around 60 nm thick, are assumed to have grownlaterally over the melt surface, but most nuclei remained nomore than 3 lm diameter.
4. Under all atmospheres except argon, there was no evidence forindividual oxide or fluoride nucleation sites – the films wereuniform, at least on a local scale.
5. The reaction in dry air consumed all available oxygen. Therewas an order of magnitude variation in oxide thickness, from15 to 150 nm, approximately from bottom to top of the bubblevolume. This variation was interpreted as indicating that mostoxidation occurred within the time of bubble formation and ris-ing to its final position – i.e. no more than a few hundred ms.
6. A thin, smooth and coherent surface film forms in the presenceof the two fluorine-bearing gases, SF6 and HFC-R134a. At theconcentrations used in this work (i.e. 3.5 vol.%), the gases areentirely consumed and, within the measurement uncertainty,all fluorine and sulphur reports to the surface film.
7. The films formed under R134a are approximately half the thick-ness of those formed under SF6 (40 nm vs. 70–100 nm). Some ofthe difference is simply due to the smaller amount of available Fin R134a, but most is due to the substantially lower fraction ofoxygen present in films formed under R134a.
8. The fluorine level in the SF6 case is strongly correlated to theoxygen level, suggesting a stoichiometric compound, but nopossible compounds were identified.
9. Some of the results presented here contradict some findingspublished on longer term melt exposures. The thinner filmsare to be expected, but the lack of identified nucleation sites,and the complete reduction of fluorine-bearing materials sug-
gests that early stage mechanisms and reactions may be quitedifferent from those involved with the growth of establishedsurface films.
Acknowledgements
The authors wish to thank the Ministry of Science, Research andTechnology of the Islamic Republic of Iran for the scholarship thatenabled A.R. Mirak to travel to Brisbane to carry out the researchprogram with the CAST CRC. CAST CRC was established underand is funded in part by the Australian Federal Government’s Coop-erative Research Centre’s scheme.
We are grateful to Craig Korn for helping design and carry outthe experimental program and to Aaron Seeber of CSIRO MaterialsScience and Engineering for his perseverance in obtaining detailedGADDS analysis results.
References
[1] H.A. Reimers, Method for Inhibiting the Oxidation of Readily OxidizableMetals, US Patent 1,972,317, 1934.
[2] J.F. Fruehling, Protective Atmospheres for Molten Magnesium, Ph.D. Thesis,The University of Michigan, USA, 1970.
[3] S.L. Couling, F.C. Bennett, T.E. Leontis, Melting magnesium under air/SF6
protective atmospheres, Light Metal Age 35 (1977) 12–21.[4] S.L. Couling, Use of air/CO2/SF6 gas mixtures for improved protection of molten
magnesium, in: Proceedings 36th Annual World Conference on Magnesium,24–28th, IMA, Norway, 1979, pp. 54–57.
[5] S.P. Cashion, The Use of Sulphur Hexafluoride (SF6) for Protecting MoltenMagnesium, Ph.D. Thesis, Department of Mining, Minerals and MaterialsEngineering, University of Queensland, Australia, 1998.
[6] H.K. Chen, J.R. Liu, W.D. Huang, Characterization of the protective surface filmsformed on molten magnesium in air/R134a atmospheres, MaterialsCharacterization 58 (2007) 51–58.
[7] J.R. Liu, H.K. Chen, L. Zhao, W.D. Huang, Oxidation behaviour of moltenmagnesium alloy in 1,1,1,2-tetrafluoroethane/air atmospheres, CorrosionScience 51 (2009) 129–134.
[8] G. Pettersen, E. Øvrelid, G. Tranell, J. Fenstad, H. Gjestland, Characterization ofthe surface films formed on molten magnesium in different protectiveatmospheres, Materials Science and Engineering A332 (2002) 285–294.
[9] K. Aarstad, G. Tranell, G. Pettersen, T.A. Engh, Various techniques to study thesurface of magnesium protected by SF6, Magnesium Technology 2003, TMS(The Minerals, Metals and Materials Society), 2003, pp. 5–10.
[10] D. Drouin, A.R. Couture, D. Joly, X. Tastet, V. Aimez, R. Gauvin, CASINO V2.42 –a fast and easy-to-use modeling tool for scanning electron microscopy andmicroanalysis users, Scanning 29 (2007) 92–101.
[11] H. Putz, J.C. Schön, M. Jansen, Investigation of the energy landscape of Mg2OF2,Computational Materials Science 11 (1998) 309–322.
[12] C.J. Duffy, H.J. Greenwood, Phase equilibria in the system MgO–MgF2–SiO2–H2O, American Mineralogist 64 (1979) 1156–1174.