character networks for narrative...
TRANSCRIPT
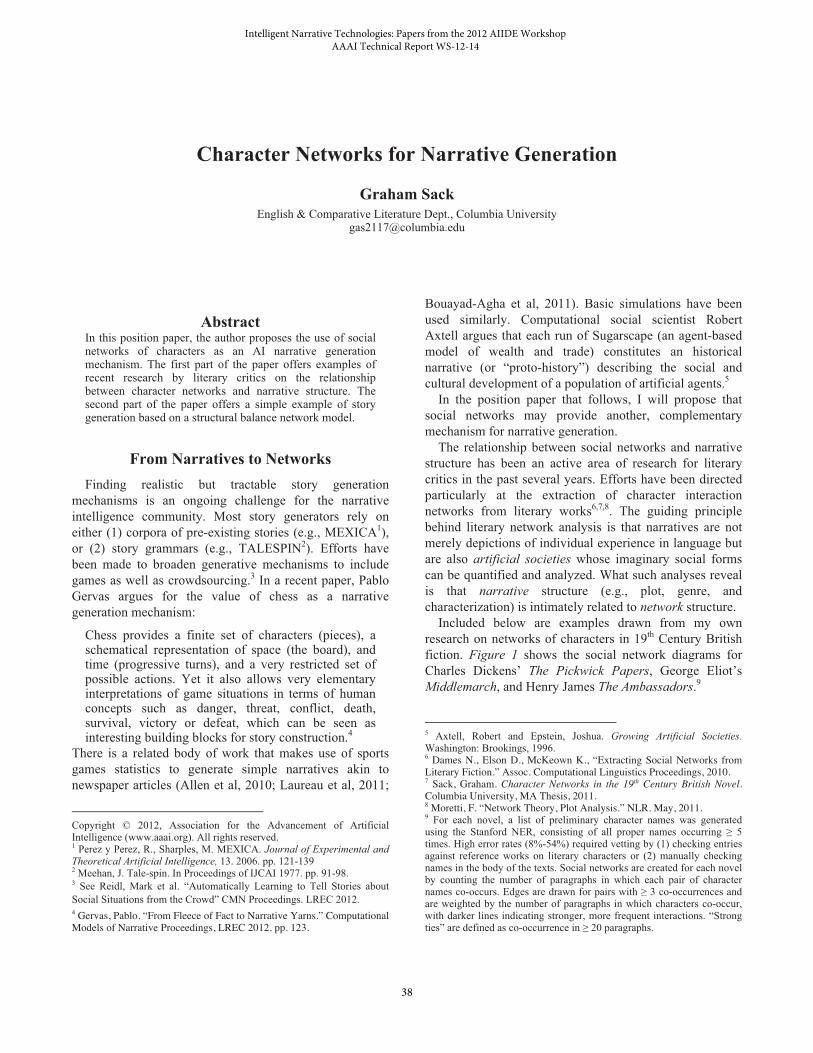
Character Networks for Narrative Generation
Graham Sack English & Comparative Literature Dept., Columbia University
Abstract In this position paper, the author proposes the use of social networks of characters as an AI narrative generation mechanism. The first part of the paper offers examples of recent research by literary critics on the relationship between character networks and narrative structure. The second part of the paper offers a simple example of story generation based on a structural balance network model.
From Narratives to Networks Finding realistic but tractable story generation
mechanisms is an ongoing challenge for the narrative intelligence community. Most story generators rely on either (1) corpora of pre-existing stories (e.g., MEXICA1), or (2) story grammars (e.g., TALESPIN2). Efforts have been made to broaden generative mechanisms to include games as well as crowdsourcing.3 In a recent paper, Pablo Gervas argues for the value of chess as a narrative generation mechanism:
Chess provides a finite set of characters (pieces), a schematical representation of space (the board), and time (progressive turns), and a very restricted set of possible actions. Yet it also allows very elementary interpretations of game situations in terms of human concepts such as danger, threat, conflict, death, survival, victory or defeat, which can be seen as interesting building blocks for story construction.4
There is a related body of work that makes use of sports games statistics to generate simple narratives akin to newspaper articles (Allen et al, 2010; Laureau et al, 2011;
Copyright © 2012, Association for the Advancement of Artificial Intelligence (www.aaai.org). All rights reserved. 1 Perez y Perez, R., Sharples, M. MEXICA. Journal of Experimental and Theoretical Artificial Intelligence, 13. 2006. pp. 121-139 2 Meehan, J. Tale-spin. In Proceedings of IJCAI 1977. pp. 91-98. 3 See Reidl, Mark et al. “Automatically Learning to Tell Stories about Social Situations from the Crowd” CMN Proceedings. LREC 2012. 4 Gervas, Pablo. “From Fleece of Fact to Narrative Yarns.” Computational Models of Narrative Proceedings, LREC 2012. pp. 123.
Bouayad-Agha et al, 2011). Basic simulations have been used similarly. Computational social scientist Robert Axtell argues that each run of Sugarscape (an agent-based model of wealth and trade) constitutes an historical narrative (or “proto-history”) describing the social and cultural development of a population of artificial agents.5 In the position paper that follows, I will propose that social networks may provide another, complementary mechanism for narrative generation. The relationship between social networks and narrative structure has been an active area of research for literary critics in the past several years. Efforts have been directed particularly at the extraction of character interaction networks from literary works6,7,8. The guiding principle behind literary network analysis is that narratives are not merely depictions of individual experience in language but are also artificial societies whose imaginary social forms can be quantified and analyzed. What such analyses reveal is that narrative structure (e.g., plot, genre, and characterization) is intimately related to network structure. Included below are examples drawn from my own research on networks of characters in 19th Century British fiction. Figure 1 shows the social network diagrams for Charles Dickens’ The Pickwick Papers, George Eliot’s Middlemarch, and Henry James The Ambassadors.9
5 Axtell, Robert and Epstein, Joshua. Growing Artificial Societies. Washington: Brookings, 1996. 6 Dames N., Elson D., McKeown K., “Extracting Social Networks from Literary Fiction.” Assoc. Computational Linguistics Proceedings, 2010. 7 Sack, Graham. Character Networks in the 19th Century British Novel. Columbia University, MA Thesis, 2011. 8 Moretti, F. “Network Theory, Plot Analysis.” NLR. May, 2011. 9 For each novel, a list of preliminary character names was generated using the Stanford NER, consisting of all proper names occurring � 5 times. High error rates (8%-54%) required vetting by (1) checking entries against reference works on literary characters or (2) manually checking names in the body of the texts. Social networks are created for each novel by counting the number of paragraphs in which each pair of character names co-occurs. Edges are drawn for pairs with � 3 co-occurrences and are weighted by the number of paragraphs in which characters co-occur, with darker lines indicating stronger, more frequent interactions. “Strong ties” are defined as co-occurrence in � 20 paragraphs.
38
Intelligent Narrative Technologies: Papers from the 2012 AIIDE Workshop AAAI Technical Report WS-12-14
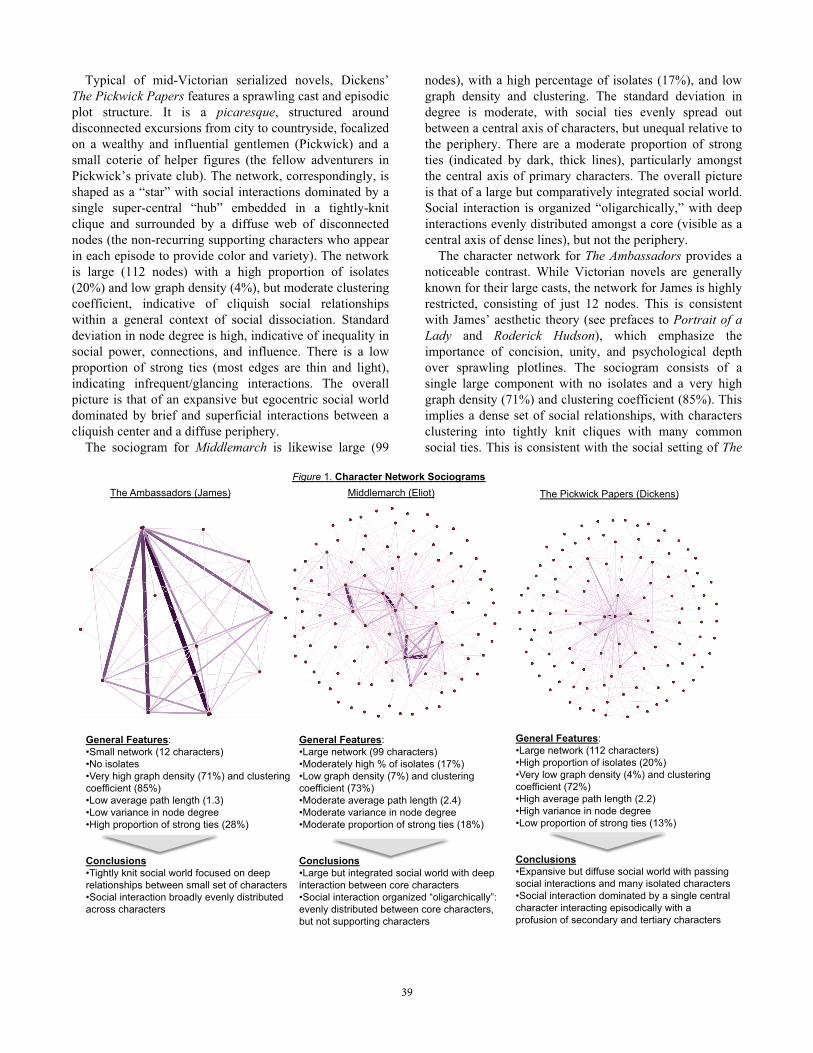
Typical of mid-Victorian serialized novels, Dickens’ The Pickwick Papers features a sprawling cast and episodic plot structure. It is a picaresque, structured around disconnected excursions from city to countryside, focalized on a wealthy and influential gentlemen (Pickwick) and a small coterie of helper figures (the fellow adventurers in Pickwick’s private club). The network, correspondingly, is shaped as a “star” with social interactions dominated by a single super-central “hub” embedded in a tightly-knit clique and surrounded by a diffuse web of disconnected nodes (the non-recurring supporting characters who appear in each episode to provide color and variety). The network is large (112 nodes) with a high proportion of isolates (20%) and low graph density (4%), but moderate clustering coefficient, indicative of cliquish social relationships within a general context of social dissociation. Standard deviation in node degree is high, indicative of inequality in social power, connections, and influence. There is a low proportion of strong ties (most edges are thin and light), indicating infrequent/glancing interactions. The overall picture is that of an expansive but egocentric social world dominated by brief and superficial interactions between a cliquish center and a diffuse periphery.
The sociogram for Middlemarch is likewise large (99
nodes), with a high percentage of isolates (17%), and lowgraph density and clustering. The standard deviation in degree is moderate, with social ties evenly spread out between a central axis of characters, but unequal relative to the periphery. There are a moderate proportion of strong ties (indicated by dark, thick lines), particularly amongst the central axis of primary characters. The overall picture is that of a large but comparatively integrated social world. Social interaction is organized “oligarchically,” with deep interactions evenly distributed amongst a core (visible as a central axis of dense lines), but not the periphery. The character network for The Ambassadors provides a noticeable contrast. While Victorian novels are generally known for their large casts, the network for James is highlyrestricted, consisting of just 12 nodes. This is consistent with James’ aesthetic theory (see prefaces to Portrait of a Lady and Roderick Hudson), which emphasize the importance of concision, unity, and psychological depthover sprawling plotlines. The sociogram consists of a single large component with no isolates and a very high graph density (71%) and clustering coefficient (85%). This implies a dense set of social relationships, with characters clustering into tightly knit cliques with many commonsocial ties. This is consistent with the social setting of The
The Ambassadors (James) The Pickwick Papers (Dickens) Middlemarch (Eliot)
General Features: •�Small network (12 characters) •�No isolates •�Very high graph density (71%) and clustering coefficient (85%) •�Low average path length (1.3) •�Low variance in node degree •�High proportion of strong ties (28%)
Conclusions •�Tightly knit social world focused on deep relationships between small set of characters •�Social interaction broadly evenly distributed across characters
l i
General Features: •�Large network (112 characters) •�High proportion of isolates (20%) •�Very low graph density (4%) and clustering coefficient (72%) •�High average path length (2.2) •�High variance in node degree •�Low proportion of strong ties (13%)
Conclusions •�Expansive but diffuse social world with passing social interactions and many isolated characters •�Social interaction dominated by a single central character interacting episodically with a profusion of secondary and tertiary characters
i
General Features: •�Large network (99 characters) •�Moderately high % of isolates (17%) •�Low graph density (7%) and clustering coefficient (73%) •�Moderate average path length (2.4) •�Moderate variance in node degree •�Moderate proportion of strong ties (18%)
Conclusions •�Large but integrated social world with deep interaction between core characters •�Social interaction organized “oligarchically”: evenly distributed between core characters, but not supporting characters
usions
Figure 1. Character Network Sociograms
39
Ambassadors, which revolves around garden parties and Parisian salons. The network has a low average path length (1.3), conducive to the rapid transmission and propagation of information, rumors, norms, and peer influence, all of which are relevant to The Ambassadors’ themes of social pressure and conformity. The novel has a low standard deviation in node degree, indicating that social interaction is broadly and evenly distributed, with no single protagonist possessing disproportionate influence. Lastly, the diagram exhibits a high proportion (28%) of strong ties, indicated by dark, thick edges. This is reflective of a social world that is based on ongoing, frequent, deep interactions between the characters, rather than brief, infrequent, or glancing interactions. The overall picture is that of a tightly knit social world focused on deep relationships between a small set of intimately related and equally significant characters. As these brief examples suggest, there is a close association between narrative structure (e.g., episodic vs. linear plot, character development conventions, etc.) and network structure. The proposal of this position paper is therefore the following: if literary critics can benefit in understanding sophisticated narrative structures by extracting networks from stories, perhaps narrative intelligence researchers can benefit by inverting the process, that is, by generating narratives from networks.
From Networks to Narratives In the remainder of this paper, I offer a simple example of how social networks may be used to generate narratives. It is worth noting that while the sociograms above describe character interactions after the fact, depicting what narrative events took place but not why, in the following pages I will be concerned with a generative mechanism that is capable of motivating interaction events before the fact. While these two network types (generative, descriptive) may at first appear quite different, they are related insofar as generative networks produce interaction-event sequences that can then be converted into descriptive sociograms of the type shown above. The direct connection will be established towards the end of this section.
Background: Structural Balance Model The model I will describe is based on ideas from structural balance theory (also known as social balance theory). SBT was originated in the mid-1940s by Fritz Heider, who studied patterns of belief coherence in individual psychology. In the mid-1950s, Cartwright and Harary generalized Heider’s theory of coherence and applied it to social relations, representing stable and unstable configurations with basic graph theory. SBT has since become a sub-branch of social network theory.
Consider a set of nodes representing, for example, people or countries. Each node may be joined to each other node by an edge, which represents their relationship. If two nodes are joined, they are either (1) friends or (2) enemies. The fundamental unit of analysis in SBT is a triad (complete triangle) of three mutually linked nodes. A triad is considered unstable if there is social pressure to change one of the relationship links. It is considered stable if there is no social pressure to change. Let (+) represent friendship and (-) represent enmity. There are several possible configurations: - (+)(+)(+): If all 3 nodes are friends / allies, the triad is
considered stable. - (-)(-)(-): If all 3 nodes are enemies, the triad is
unstable, since two nodes have an incentive to ally against the third (thereby becoming friends with each other).
- (+)(+)(-) or (+)(-)(+) or (-)(+)(+): If one node is friends with two that are enemies with one another, it will be pressured to pick a side, and therefore the triad is unstable.
- (+)(-)(-) or (-)(+)(-) or (-)(-)(+): If two nodes are friends with each other and both are enemies against a third, the triad is stable.
The rule for stability can be summarized as follows: a triad is stable if the multiplicative product of the signs is positive (Cartwright & Harary, 1956). The stability of the various triads conforms to the following simplified social principles: (1) my friend’s friend is my friend; (2) my friend’s enemy is my enemy; (3) my enemy’s friend is my enemy; (4) my enemy’s enemy is my friend. Note that changing any single link in an unstable triad will make it stable: (-)(-)(-) becomes any cyclical permutation of (-)(-)(+); (+)(+)(-) becomes either (+)(+)(+) or any cyclical permutation of (-)(-)(+). Likewise, changing any link in a stable triad will make it unstable: (+)(+)(+) becomes any cyclical permutation of (-)(+)(+); (-)(-)(+) becomes either (-)(-)(-) or any cyclical permutation (-)(+)(+). The stability of 3 mutually connected nodes is easy enough to evaluate, but the complexity increases as nodes are added to create larger graphs and interdependent triads proliferate. Nevertheless, global patterns emerge from the local interactions. One such pattern is social mitosis: it can be proven that there are only two ways for a complete graph (i.e., a graph with no missing edges) to be structurally balanced: (1) everyone is friends (universal harmony) or (2) there are two factions of friends with total enmity between them (bi-polar factions).10 While the
10 In the case of an incomplete graph with missing edges, two more outcomes are possible: (3) multi-polar factions: the nodes are divided into three or more groups of friends with total enmity between them; (4) mixed outcome: some nodes are enemies but no polarized factions form.
40

general properties of the equilibrium state of any graph are deterministic, the dynamic process by which that graph will evolve towards an equilibrium solution is not. This is, of course, what makes it interesting and useful as a narrative generation mechanism.
Model Implementation The next several pages describe a version of the
structural balance model I have implemented in NetLogo, an IDE for agent-based modeling. Unsurprisingly, I am not the first person to have built a computer simulation of the structural balance model (see Doreian & Hummon (2003) and Wang & Thorngate (2003) for alternative implementations). The crucial difference is that my intention is not to study structural balance in its own right, but rather to motivate a series of observations about the narrative generating potential of social-network-based simulations. Towards this end, in line with Axtell’s work on Sugarscape, my emphasis is on the “proto-narratives” generated by the model’s dynamics, namely, the event history, node history, and relationship-link history discussed further below.
At set-up, the user specifies the number of nodes, the number of links, and the percentage of links that will be red (enmity), as opposed to blue (friendship). Each time step, the model’s algorithm checks whether there are any unstable triads. If so, the algorithm randomly selects one of the unstable triads and randomly changes one of its links (red�blue or blue�red). Changing a link’s color stabilizes the selected triad, but may inadvertently
destabilize other triads. The model continues stepping forward in time until all triads in the graph have been made stable.
As it runs, the model generates several types of output. First, global network statistics, i.e., graph density and
clustering coefficient. Since clustering coefficient measures the prevalence of complete triads, which are the basic unit of analysis in SBT, the greater its value, the more complex the balancing problem and the more time-steps generally required to reach stability. Second, the model tracks link and triad statistics. These include: (1) # and % of friendship vs. enmity ties and (2) # and % of stable vs. unstable triads (the program halts when # unstable = 0).
These metrics merely provide basic information about the state of the network. Of greater relevance for narrative generation are the outputs involving events, nodes, and relationships.
An “event” is defined as a change in link color. There are two types of events: (1) befriending: when a red link changes to blue, meaning that the two end-nodes have changed from enemies to friends; (2) betrayal: when a blue link changes to red, meaning that the two end-nodes have changed from friends to enemies. One event occurs each time step until the network reaches global stability. Each event is logged in the event history and is listed as “At t = T, node X befriended / betrayed node Y.” As the model runs, it produces a simple proto-narrative, represented by the list of events that has occurred up to the current time step. This proto-narrative is akin to the “proto-histories” that Robert Axtell generates with the Sugarscape model: it
(i) Initial Structural Balance Network (iv) Interaction-Event Network (iii) Event History (ii) Change in %-Stable-Triads & %-Friendship-vs-Enmity-Links
Figure 3. Synopsis of Model Run – (i) an initial structural balance network is constructed with the user-specified # of nodes, # of links, and percentage of friendship vs. enmity ties; (ii) as the model runs, the percentage of friendship and enmity ties varies as does the percentage of stable-triads until it reaches 100%; (iii) an event history is generated, and (iv) a network based on the relationship-events between nodes
41
is a sequence of events that progress forward in time and are causally linked.
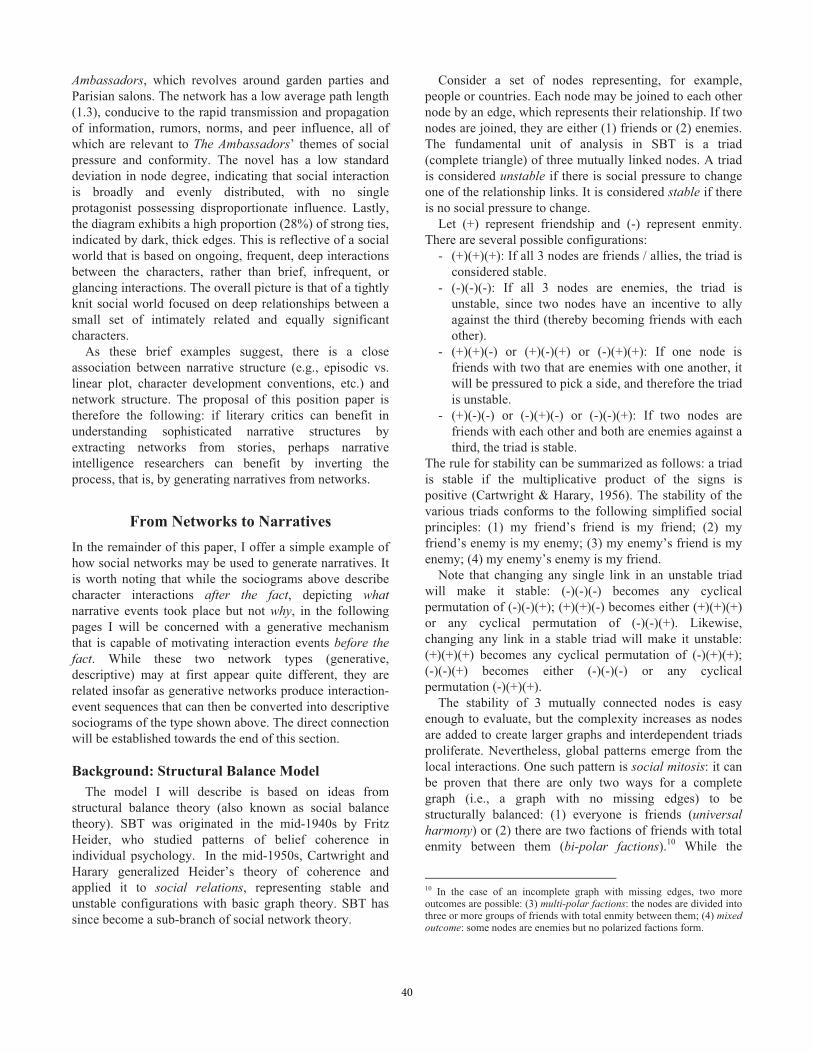
The network topography constitutes a rudimentary setting. Like the setting of a novel, the geometric configuration of nodes and links in a network defines the environment in which the character interaction-events will unfold. Different settings engender different event sequences. However, unlike Gervas’ chess example, in which the setting is spatial, for our structural balance simulation the setting is social. In particular, the degree distribution—how equal vs. unequal the initial allocation of social ties is—is a function of the network’s topology: a preferential attachment network, for example, will have a power-law degree distribution (highly skewed social connectivity), while a uniform network will have a degree distribution that approximates a flat line.
Nodes may be thought of as rudimentary characters. Like characters, nodes have a set of basic attributes including their degree, initial number of friends and enemies, and location in the network’s topography (e.g., central vs. peripheral). Nodes with high degree (a.k.a., “hubs”) may be thought of as socially central and as wielding greater social power, while nodes with low degree are comparatively isolated and socially peripheral.
Nodes likewise have what we might think of as “character development.” As mentioned above, each event involves a switch in affinity between two nodes. As the model runs, then, each individual node accumulates a personal history represented by the events in which it is involved. As in more sophisticated narratives, character-nodes vary in their importance to the proto-narrative. Some nodes will be involved in many events—indicating their importance to the “story” being told—while other nodes will be involved in comparatively few events and therefore marginal to the proto-narrative.
As the model runs, it draws two distributions that summarize the roles of these proto-characters. First, the degree distribution at set-up. Second, the time-evolving node event distribution, which represents the number of events in which each node has been involved. The event distribution shows how skewed the history of the model has been. A flat distribution suggests that the nodes have been equally important to the events composing the proto-narrative, while a skewed distribution indicates that a few nodes have been disproportionately important in the history of the model. These two distributions are imperfectly correlated. Highly connected nodes generally have more opportunities to figure in a large number of events, however, it is possible to have highly connected nodes that are embedded in only stable triads: such nodes are central to the network, but peripheral to its narrative of development.
Link-switchings constitute rudimentary character interactions. As noted, switchings may be thought as “befriending” (a switch from enmity to friendship) or “betrayal” (a switch from friendship to enmity). Just as each node has a history, each relationship-link has a history. Some relationships are very active / tumultuous, with many switchings between friendship and enmity, while other relationships are stable / uneventful.
The relationship history is represented by a symmetric matrix. The (i,j) entry indicates the number of character interaction-events between nodes i and j. The value of this entry is analogous to the edge weightings I showed above for character interactions in novels. We can use these entries to construct a sociogram that summarizes the character interactions described by our proto-narrative. Figure 2.iv shows an example of the interaction-event network generated by one run of the social balance model. It is worth pointing out that the generating network shown
�� ��� ��� ��� ��� ��� ���
�����
������
������
������
������
������
� ����
������
������
����
�� �
����
��
� ����������
������� ����
������������
������������
������������
������������
������������
Number of Links
Initial Percentage of
Enmity (Red) Ties
Leng
th o
f Eve
nt H
isto
ry
���
����
����
����
����
����
����
����
����
����
�����
�� ��������� ��������� ��������� ��������� ��������� ��������� ��������� ��������� ��������� ����� ��
������� ��������� ���
���!��� "�����"#��
��� "��� ��
Initial Percentage of Enmity (Red) Ties
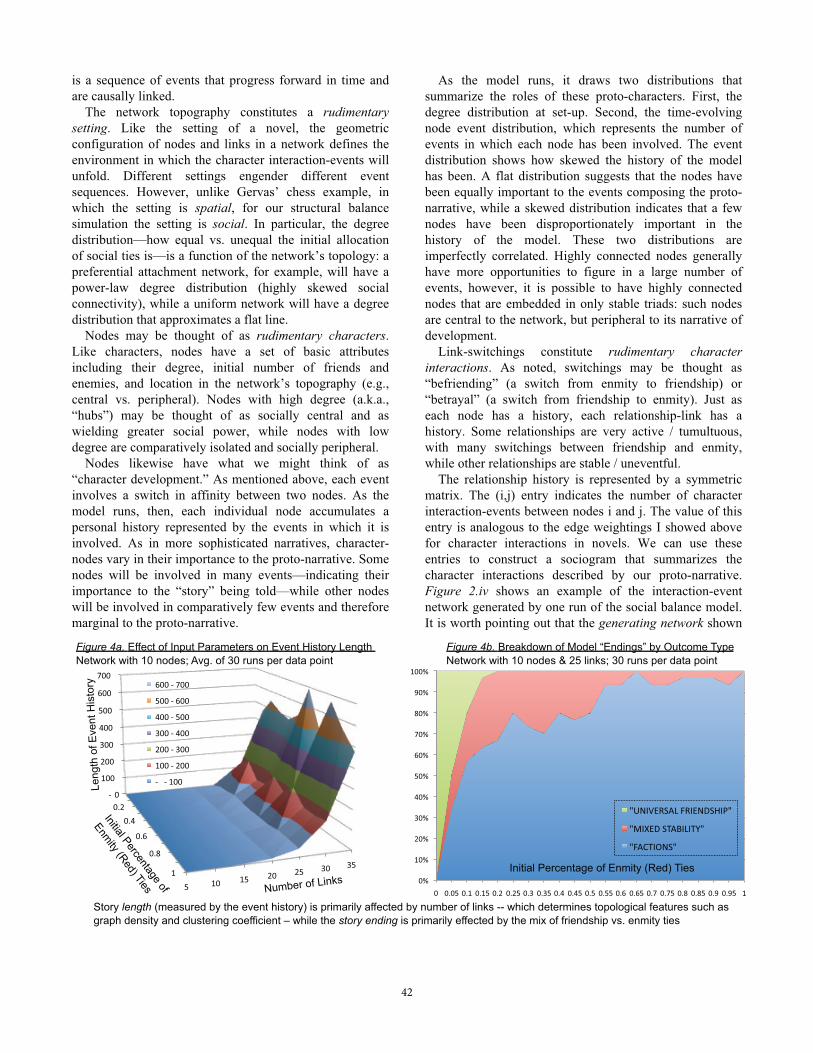
Story length (measured by the event history) is primarily affected by number of links -- which determines topological features such as graph density and clustering coefficient – while the story ending is primarily effected by the mix of friendship vs. enmity ties
Figure 4b. Breakdown of Model “Endings” by Outcome Type Network with 10 nodes & 25 links; 30 runs per data point
Figure 4a. Effect of Input Parameters on Event History Length Network with 10 nodes; Avg. of 30 runs per data point
42
in figure 2.i and the resulting interaction-event network shown in figure 2.iv have different topological features. The interaction-event network is more centralized and has a lower clustering coefficient and graph density.11 Last, the model’s progression from instability to stability provides both a rudimentary narrative arc and sense of closure. The SBT simulation tells a simple but meaningful story: it is the story of how a community journeys from an initially unstable configuration to a stable configuration. This story possesses an Aristotelian structure, with a clear beginning, middle, and end. To roughly paraphrase Aristotle’s Poetics, a narrative begins when an initially stable situation is disturbed by an inciting incident. The resulting disequilibrium constitutes the central problem of the narrative, towards which all actions must aim according to the principle of unity. The narrative ends when the problem is resolved, providing a sense of closure through the re-establishment of stability at a new equilibrium. The network simulation conforms to the Aristotelian schema: it traces the trajectory of the community represented by the network from instability to stability and provides narrative closure with the achievement of structural equilibrium. Like a real narrative, each event either advances the narrative towards resolution (by increasing in the percentage of stable triads) or constitutes a reversal (represented by a decrease in the percentage of stable triads). Likewise, each node has a role to play in the proto-narrative: some are major players with many link switchings, while others play a minor players with few link switchings, but all contribute to the central action or plot in a manner consistent with Aristotle’s principle of unity.
While the model will eventually find an ending represented by a stable outcome, when and what type of ending are indeterminate. There are three possibilities for an incomplete graph: (i) universal harmony (what we might consider a “happy ending”); (2) polarized factions (what we might consider an “unhappy ending”); (3) mixed outcome. The indeterminacy of the ending provides a rudimentary version of narrative suspense.12 Figure 3 shows the effect of different input parameters on the length and ending of the proto-narrative.
11 As future research, the interaction-event networks generated by the SBT model should be calibrated against actual narrative networks. For the run shown in figure 2.iv the clustering coefficient is much lower than that observed for 19th Century British novels (0.42 vs. 0.72-0.85). It will be worth exploring whether changes to the topology of the initial generating network are adequate to yield interaction-event networks that more closely match real narratives. 12 A complete graph with n nodes, has nC2 = n(n-1)/2 edges, each of which can be in 2 states, (+) or (-); thus, there are 2n(n-1)/2 states for the network. It can be shown that (2n–1) of these are stable outcomes. This corresponds to the number of ways to divide a group with n members into two factions of size m and (n-m). The non-polarized solution (“universal harmony”) is simply the trivial solution where m = 0. An incomplete graph has more stable configurations since multi-polar and mixed outcomes are permitted.
Conclusion Lest this “proto-narrative” strike us as overly simplistic, it is worth noting that the acts of betraying and befriending and the reconfiguring of friendship and enmity ties form the substance of many canonical narratives.
In a recent paper entitled “Facebook for Vikings,” folklorist Tim Tangherlini argues that the plot structures of Scandanavian story cycles can be understood in terms of shifting alliances and enmities consistent with SBT:
In a great deal of saga scholarship there is an understandable emphasis on understanding enmity, with friendship acting as a powerful counter force (Byock 1982; Miller 1983 and 1990). Network analysis allows one to consider friendly interactions and antagonistic relationships both as individual features of the saga narrative and in concert with each other… Perhaps one of the most complicated aspects of social interaction considered in the sagas is the selection of friends and its inverse, the selection of enemies (Tangherlini, 25).
Tangherlini analyzes the famous “Höfu�lausn” or head ransom episode in Egil’s Saga in terms of interdependent triads between four characters—Egil, Eirik, Arinbjorn, and Gunnhild. All friendship and enmity ties are determined prior to the episode except for the relationship between Arinbjorn and Gunnhild. Tangherlini argues that the dramatic arc of the head ransom episode consists in the determination of the Arinbjorn-Gunnhild relationship and the reconfiguring of Egil-Eirik relationship based on the stability requirements of SBT. Given the narrative generation community’s historical focus on folktales and fairy tales, Tangherlini’s analysis suggests that SBT may provide a relevant generation mechanism to complement corpus analysis. Moreover, SBT and other dynamic network models may prove valuable in generating more complex narrative structures. Contemporary social dramas, for example, are organized around befriending, betrayal, and the reconfiguring of social allegiances. Notable examples range from French court novels such as Le Princesse de Cleves and Les Liaisons Dangerouse to contemporary soap operas such as Gossip Girl.
References Cartwright, D & Harary, F. “Structural Balance: A Generalization of Heider’s Theory.” Psych. Review. V. 63, No. 5. Sept, 1956. Heider, Fritz. “Attitudes and Cognitive Organization.” The Journal of Psychology, 21, 107-112. 1946. Hummon, N & Doreian P. “Some dynamics of social balance processes.” Social Networks Vol. 25 (2003) 17–49. Tangherlini, Timothy. “Facebook for Vikings.” Society for the Advancement of Scandinavian Study. April 2011.
43