chapter5 · chapter5 tv personalization system ... such as tivo™ and replaytv™ has begun to...
TRANSCRIPT

Chapter 5
TV PERSONALIZATION SYSTEMDesign of a TV Show Recommender Engine and Interface
John Zimmerman1*, Kaushal Kurapati2*, Anna L. Buczak3*, Dave Schaffer4,Srinivas Gutta4, and Jacquelyn Martino5*
1 Carnegie Mellon University2 IBM Corporation3 Lockheed Martin Corporation4 Philips Research5 MIT* Work done while at Philips Research
Abstract: The arrival of PVRs (Personal Video Recorders)—tape less devices that allowfor easy navigation and storage of TV content—and the availability ofhundreds of TV channels in US homes have made the task of findingsomething good to watch increasingly difficult. In order to ease this contentselection overload problem, we pursued three related research themes. First,we developed a recommender engine that tracks users’ TV-preferences anddelivers accurate content recommendations. Second, we designed a userinterface that allows easy navigation of selections and easily affords inputsrequired by the recommender engine. Third, we explored the importance ofgaining users’ trust in the recommender by automatically generatingexplanations for content recommendations. In evaluation with users, our smartinterface came out on top beating TiVo’s interface and TV Guide Magazine, interms of usability, fun, and quick access to TV shows of interest. Further, ourapproach of combining multiple recommender ratings—resulting from variousmachine-learning methods—using neural networks has produced very accuratecontent recommendations.
Key words: Personalization, TV recommender, Interactive TV, User Interface, TVInterface, Electronic Program Guide (EPG), Trust
2 Chapter 5
1. INTRODUCTION
The increase in TV viewing options from digital cable and digitalsatellite has created a world where many US homes have access to hundredsof channels. In addition, the arrival of Personal Video Recorders (PVRs)such as TiVo™ and ReplayTV™ has begun to change how people watchTV. PVRs allow easy navigation of TV-show schedules through electronicprogram guides (EPG) for selection and storage on hard disks. In observingPVR users, we noticed that within two to three days they shifted fromwatching live to stored TV programs almost exclusively. So now, instead ofhaving to select a single program to watch from hundreds of channels, PVRusers instead select a small set of TV shows to store from the tens ofthousands broadcast each week.
In order to address this looming content selection overload issue andimprove the TV show selection and viewing experience, we created a TVshow recommender to help users find something “good” to watch. During itscreation we pursued three related research themes. First, we developed arecommender engine that could track users’ TV-preferences and deliveraccurate content recommendations. An accurate recommender can extractshows users want to see from an ocean of less interesting fare. Second, wedesigned a user interface that allows easy navigation of selections andsupports inputs required of the recommender engine. A recommenderwithout an easy to use interface can potentially make finding somethinggood to watch more difficult than not using a recommender. Finally, weexplored the importance of gaining users’ trust in the recommender, becauseif users don’t trust a recommender, they will not use it or pay for it as afeature or service.
Our recommender engine combines two user information streams:explicit and implicit. The explicit stream allows users to take control byspecifying their preferences and enables the system to begin working rightaway. The implicit stream unobtrusively observes users to learn theirpreferences. Implicit methods reduce the amount of work required of usersto get recommendations and allow for changes in taste to be captured overtime. We obtain accurate recommendations by fusing both recommenders’outputs using neural networks. Our interface runs on a touch-screen remotecontrol. The use of a finger as a floating cursor greatly improves efficiencyover traditional remote control interfaces that employ jumping highlights. Inaddition, our interface allows users to select how much or how littleinteraction they want with the recommender, making them feel in control.Finally, we build user trust by providing (i) accurate recommendations, (ii)flexible access to the recommender, and (iii) appropriate feedback on whyusers might want to try a new TV show.

5. TV Personalization System 3
Our research on both the engine and interface follows a user-centerediterative design process: analyze, design, and evaluate (repeat). At this pointour work is still in the preliminary stages. We have focused on a longer-termevaluation with a small set of test subjects instead of a larger, statisticallysignificant study.
2. RELATED WORK
2.1 Related Work on TV Recommender Systems
With respect to recommendation engines, the TV Advisor of Das & Horst(1998), PTV system of Cotter & Smyth (2000), EPG work of Ardissono etal. (in this volume), and our prior work Gutta et al. (2000), and Kurapati etal. (2001) stand out as some of the earliest TV recommender systems. Inaddition, TiVo and Predictive Networks offer commercially availablesystems that provide TV recommendations. For a history of the evolution ofpersonalized electronic program guides, refer to Smyth & Cotter (in thisvolume).
The TV Advisor of Das & Horst (1998) employs explicit techniques togenerate recommendations for a TV viewer. Such techniques requireindividual users to take the initiative and explicitly specify their interests inorder to get high quality recommendations. Although this method is a goodfirst step and one that is easy to implement in a set-top box, it burdens userswho want minimal interaction with the recommender. Moreover the systemis static and does not allow evolution of user profiles over time.
Cotter & Smyth's PTV (2000) uses a mixture of case-based reasoning andcollaborative filtering as a means of learning users' preferences in order togenerate recommendations. Initially users state their preferences aboutchannel, genre, and viewing time while registering with the system, similarto the explicit recommender of Das & Horst. However, the heart of the PTVrecommender infers users’ preferences as they enter their feedback on TVshows they have watched. Also, PTV is Internet based, requiring the users tolog on to a web site in order to see their recommendations. This approachremoves users from the TV viewing environment thereby questioning thesystem’s ability to be useful in the real setting.
Case-based recommendation relies on input of programs that users likedin the past (Balabanovic & Shoham 1997, Hammond et al. 1996, Smyth &Cotter 1999). Collaborative filtering (Balabanovic & Shoham 1997, Billsus& Pazzani 1998) recommends TV shows that other users, havingcharacteristics similar to a given user's profile, liked. The advantage of

4 Chapter 5
collaborative filtering is that it does not need content descriptions (titles aresufficient). However, collaborative filtering does not completely protectusers' privacy since information about a user’s likes and dislikes is used tomake recommendations to other users. Additionally, collaborative filteringcannot work for programs that are completely new, not known to at least oneof the viewers. This often happens with TV when new programs and made-for-TV movies are broadcast.
Ardissono et al. (in this volume) created the Personalized EPG thatemploys an agent-based system designed for set-top box operation. Threeuser modeling modules collaborate in preparing the final recommendations:Explicit Preferences Expert, Stereotypical Expert, and Dynamic Expert. TheExplicit Preferences Expert deals with preferences declared by the usersduring initial setup. The Stereotypical Expert exploits users’ personal dataknown to the system and the explicit preferences stated in order to classifyindividual users into one of the lifestyle (stereotypical) groups. The DynamicExpert analyzes users’ watching behaviors, and based on it builds and adaptsits model of the user. The Personalized EPG recommender is a veryinteresting mixture of explicit, stereotypical and implicit user preferencesallowing the final recommendation to take advantage of the threecomplementary methodologies involved. This work further validates hybridapproaches to generating content recommendations.
One of the earliest commercially available TV recommenders comesfrom TiVo, Inc. TiVos generate personalized recommendations that aredisplayed to users. Their recommender learns by tracking which programsusers choose to record and user feedback of “thumbs-up” or “thumbs-down”to indicate how they feel about TV shows (on a 1 to 7 scale).
Predictive Media, Inc. provides another commercially availablerecommender system. They use a mixed model approach that combinesstatistical analysis, expert systems, and neural networks to generate contentrecommendations. Their system is primarily implicit in nature. PredictiveMedia’s recommender results can be plugged into any UI for presentation.This decoupling lessens the usefulness of a TV recommender in our opinion.
All of the techniques described above share one common characteristic:users only see a very limited number of recommendations. A unique featureof our system is that it creates a prioritized list of all TV shows. This allowsusers to browse both highly rated and lowly rated programs, and to activelytune the recommender and improve its performance.
2.2 Related Work on Interface Design
With respect to TV recommender interfaces, Double Agents byMeuleman et al. (1998), Personalized Contents Guide by Lee et al. (2001),

5. TV Personalization System 5
TV Scout by Baudisch & Brueckner (2001), Time-pillars by Pittarello (inthis volume), the interface explorations of Barneveld and Setten (in thisvolume), and the commercial PVR by TiVo all stand out.
Double Agents, designed by Meuleman et al. (1998) employs animatedcharacters to help users find programs of interest. Each character representsa different genre. When a highly recommended program is being broadcast,the character representing the genre of this program changes its postureusing human-like behavioral characteristics to let users know somethinggood is on. This model can work well when working with the relativelysmall number of shows being broadcast live, however, unlike our interface itwould have a problem with the one to two weeks worth of shows that PVRspresent.
The Advanced Contents Guide of Lee et al. (2001) offers an interfacewhere users can select from recommended TV shows. This interface usesuser inputs such as selection, fast-forward, and rewind to learn userpreferences, but unlike our system it offers users no direct input to therecommender. The interface presents a list of recommended programs bygenre. However, the interface at present has only been used with data fromfour channels based on two weeks of data. It would be interesting to see if itcan support hundreds of channels.
The TV Scout interface by Baudisch & Bruekner (2001) offers a fullyfeatured TV show recommender interface that progressively reveals itsfiltering features to users over time. Users produce queries to find shows ofinterest, and the system learns what they like by tracking their queries.Unlike our interface, TV Scout only allows users to organize programs bytime. However, this limitation may be only an artifact of a limitedimplementation as opposed to a limitation of the actual interface design. Amore difficult problem is that the interface runs on a PC and has a verystrong PC look and feel.
Time-pillars by Pittarello (in this volume) provides users with a 3D worldpopulated by pillars that appear similar to architectural wonder, Traian’scolumn, found in Rome. Each pillar represents a TV channel, with individualshows ordered by broadcast time spiraling up from the bottom to the top ofthe pillar. The Time-pillars interface seems most concerned with generatinga pleasurable user experience where as our interface focus more onbalancing a pleasurable user experience that also reduces the amount of timespent searching for something interesting to watch.
The interface explorations by Barneveld and Setten (in this volume) offergreat insights into users’ expectations. The conducted user research throughparticipatory design and surveys to help clarify both which features userswant and what those features might look like. They specifically looked atPredictions (how recommendations appear on the screen), Feedback (how

6 Chapter 5
users explicitly enter preferences to the recommender), and Explanations(how recommendations are justified to users). Their designs for feedback donot support the flexible interaction with the recommender our participantsdemanded (Section 5.2); however, their evaluation of explanationscompletely supports our design of the reflective history interface element(Section 7.1).
TiVo currently offers a TV show recommender interface as a commercialproduct in the United States and in England. Users can enter up to threethumbs up or thumbs down to indicate how much they like or dislike a TVprogram. To see what programs have been recommended, users have twooptions. First, they can check the hard disk contents and view programsTiVo has recorded for them that they did not explicitly request. Second,users can navigate to a list of highly recommended programs coming up inthe next two weeks. This list never exceeds 100 program titles.
TiVo’s recommender interface has two limitations. First, the interfacedoes not allow users to access the recommender when filtering programs bygenre such as Action-Movies, or by time such as show me the recommendedprograms that are on now. Second, the interface does not offer users anyindication of why a program has been recommended. While there is much tocomplain about the limitations of TiVo’s recommender interface, it must benoted that the interface is quite easy to use, and it is available on storeshelves today.
2.3 Related Work on Trust
Related work with respect to trust literature includes Herlocker et al.’s(2000) visualization of collaborative filtering recommendation; Lerch &Prietula’s (1989) work on trust of machine advice; Fogg & Tseng’s (1999)elaboration on the elements of computer credibility; Cassel & Bickmore’s(2001) exploration of trust of virtual characters that participate in small talk;and Wheeless & Grotz’s (1977) research on the use of self disclosure indeveloping trust.
Herlocker et al. (2000) built on the theory that providing explanations tocollaborative filtering recommenders increases users acceptance. Theyprototyped and user tested several visualizations explaining howcollaborative filtering works. They found that bar charts showing nearestneighbors were very effective in communicating how a recommender systemworks and in offering confidence in the recommendation.
Looking more abstractly at the relationship between computers andpeople, Lerch & Prietula (1989) conducted a study to measure the differencebetween people’s trust of machines and their trust of people. They found thatpeople trusted advice from expert computer systems about as much as advice
5. TV Personalization System 7
from novice humans. Expert humans were the most trusted. They also notedthat bad advice given early in the use of a system had a strong, adverse effecton trust.
Fogg & Tseng (1999) synthesized the research done on computercredibility. They noticed that in the past people thought of computers as“virtually infallible” but that people’s trust in machines had greatly eroded.They proposed new conceptual frameworks for and offered methods forevaluating computer credibility.
Bickmore & Cassel (2001) explored the use of conversational agents tohelp people trust computers. They created a virtual reality realtor who wouldengage people in small talk before trying to sell a house. They discoveredthat small talk was effective in increasing the trust of extroverted people butthat it had almost no effect on introverts.
Wheeless & Grotz (1977) researched the relationship between trust andself-disclosure. They created a method for measuring individualized trustand compared it to many different kinds of self-disclosure. Their resultsindicate that both intentional disclosure and increased amounts of disclosurecreate a higher level of trust.
3. RECOMMENDER ENGINE
Our recommender engine contains several components (Figure 5-1). Wecurrently use both Bayesian and Decision Tree (DT) methods to produceimplicit recommendations. Test subjects keep paper diaries detailing theirviewing histories and based on these implicit recommendations arecalculated. The explicit recommender allows users to directly input theirpreferences using two different interfaces (see Section 5.2). When we feedmeta-data describing upcoming shows into the system, each of the differentrecommenders generates a rating for each show. An artificial neural networkfuses the outputs of the different recommenders into a single set of improvedrecommendations.

8 Chapter 5
Figure 5-1. Recommender system architecture.
3.1 Metadata
Our recommender engine relies on metadata from Tribune MediaServices. Everyday we downloaded an updated TV-schedule for the next 12days with channels (85+) and times associated with the Briarcliff Manor,New York area. Currently we have approximately four years of data,enabling us to re-run our recommenders on historic data as needed.
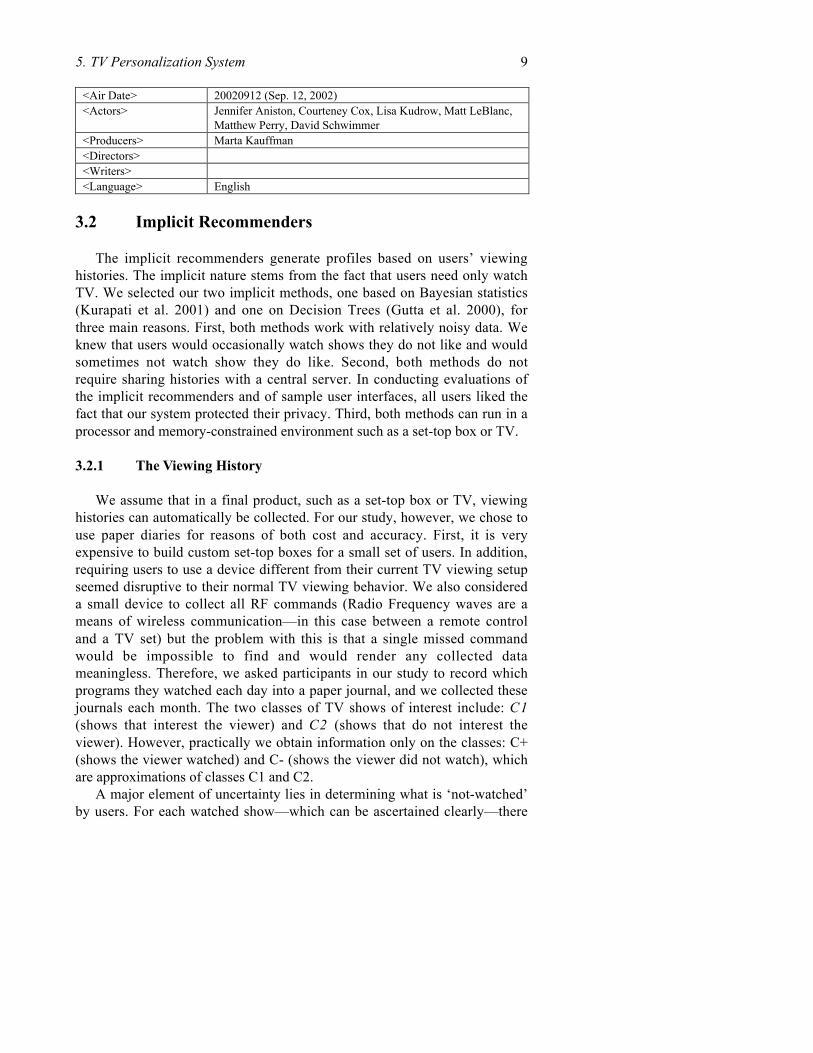
The metadata describes each TV-show using 205 fields, many of whichare often not populated or relevant. We selected 21 fields for the implicitrecommender, including: title, broadcaster, air time, air date, unique showkey (indicating format such as series, movie, etc.), genres (comedy, action,adventure, news, etc.), actors, producers, directors, writers, hosts, synopsis,year, language, and content rating (mature, children, etc.). A subset of 14fields from the 21 inputs to the implicit recommender is shown in Table 5-1.
Table 5-1. Metadata sampleField Value<Program Code> EP1151270151<Title> Friends<Short Title> Friends<Episode Title> The One With the Wedding<Synopsis> Rachel serves as a bridesmaid in her ex-fiancé Barry's wedding.<Genres> Situation, Comedy<Channel> WPIX (NBC Affiliate)<Air Time> 2000
5. TV Personalization System 9
<Air Date> 20020912 (Sep. 12, 2002)<Actors> Jennifer Aniston, Courteney Cox, Lisa Kudrow, Matt LeBlanc,
Matthew Perry, David Schwimmer<Producers> Marta Kauffman<Directors><Writers><Language> English
3.2 Implicit Recommenders
The implicit recommenders generate profiles based on users’ viewinghistories. The implicit nature stems from the fact that users need only watchTV. We selected our two implicit methods, one based on Bayesian statistics(Kurapati et al. 2001) and one on Decision Trees (Gutta et al. 2000), forthree main reasons. First, both methods work with relatively noisy data. Weknew that users would occasionally watch shows they do not like and wouldsometimes not watch show they do like. Second, both methods do notrequire sharing histories with a central server. In conducting evaluations ofthe implicit recommenders and of sample user interfaces, all users liked thefact that our system protected their privacy. Third, both methods can run in aprocessor and memory-constrained environment such as a set-top box or TV.
3.2.1 The Viewing History
We assume that in a final product, such as a set-top box or TV, viewinghistories can automatically be collected. For our study, however, we chose touse paper diaries for reasons of both cost and accuracy. First, it is veryexpensive to build custom set-top boxes for a small set of users. In addition,requiring users to use a device different from their current TV viewing setupseemed disruptive to their normal TV viewing behavior. We also considereda small device to collect all RF commands (Radio Frequency waves are ameans of wireless communication—in this case between a remote controland a TV set) but the problem with this is that a single missed commandwould be impossible to find and would render any collected datameaningless. Therefore, we asked participants in our study to record whichprograms they watched each day into a paper journal, and we collected thesejournals each month. The two classes of TV shows of interest include: C1(shows that interest the viewer) and C2 (shows that do not interest theviewer). However, practically we obtain information only on the classes: C+(shows the viewer watched) and C- (shows the viewer did not watch), whichare approximations of classes C1 and C2.
A major element of uncertainty lies in determining what is ‘not-watched’by users. For each watched show—which can be ascertained clearly—there
10 Chapter 5
are numerous ones ‘not-watched’. The key question is how to sample theuniverse of shows to appropriately populate the ‘not-watched’ class, C-. Werecognize that users could be asked to provide information on shows they donot like, thus gathering information directly on shows belonging to class, C2(shows disliked by the user). However, when we consider the pure implicitmethod, we have to rely on a sampling technique to populate class C-. Toapproximate class C-, one option is to select a not-watched show broadcastin the same time-slot as the watched show. An inference that the watchedshow is preferable to the not-watched shows seems reasonable in this case.Unfortunately, this scheme prevents learning preferred viewing times.
We chose instead to sample one not-watched show for each watchedshow from the previous week of shows, randomly selecting the day, time,and channel. This helped preferred viewing times to become statisticallydiscernable; however, the issue of how many not-watched shows to sampleis one that could profit from more research. We chose a one-to-one samplingratio because it makes the Bayesian a priori probability of each class equal.Since we sample uniformly in time, the not-watched class represents asample of the general run of shows being broadcast and therefore theimplicit recommenders should find patterns of features that distinguish whatis liked from this general run of material.
For three years we collected viewing histories on eight participants.However, because participants relocated during the study we do not have afull three years for each individual. Participants were recruited from thecommunity around Briarcliff Manor, New York. They ranged in age fromlate teens to early sixties and were of mixed gender. None of the participantsworked for Philips Research. Because of the small number of subjects, theresults presented in this paper are preliminary in nature.
3.2.2 Bayesian Recommender
Our Bayesian implicit recommender uses the Bayesian classifier (Billus& Pazzani 1998, Duda & Hart 1973) approach to compute the likelihood thatthe user will like or dislike a particular TV program. We approached theproblem with a 2-class Bayesian decision model, where a show eitherbelongs to the class “watched”, or the class “not watched”. Ideally, wewould like to have ground truth information on whether a TV-show wasliked or not liked by the user, but the implicit profiling technique allows us tohave information only on the classes watched and not watched. The userprofile, in the Bayesian context, is a collection of features together with acount of how many times each occurs in the positive and negative examples(i.e. classes C+ and C-). An excerpt from a user profile is shown in Table 5-

5. TV Personalization System 11
2. Note that a feature is an attribute-value pair and that only a small samplehas been shown.
Table 5-2. User profile excerptFeature Watched (C+) not-watched (C-)Total_programs 66 66Station: ABC 10 56Station: BBC 20 10Title: BBC News 10 2Actor: Jim Carrie 2 0Genre: comedy 1 7Keyword: murder 5 1
Our Bayesian model computes the prior probabilities directly from thecounts in the viewer profile. Then we compute the conditional probabilitiesthat a given feature, fi, will be present if a show is in class C + or C- :P(fi|C+) = k(fi|C+)/k(C+), where k(fi|C+) represents the number of showsin which feature fi is present given that the show belongs to class watched(C+) and k(C+) represents the count of all shows belonging to class watched(C+). The recommendation scores for upcoming shows are computed byestimating the aposteriori probabilities, i.e. the probability that a show is inclass C+ and C- given its features: P(C+|x), where x is the feature vector.For details on the computation, we refer to Kurapati et al. (2001)
3.2.3 Decision Tree Recommender
Like the Bayesian recommender, our Decision Tree (DT) recommenderuses the “watched” and “not watched” shows. The decision tree employsQuinlan’s C4.5 (Quinlan 1983, 1991) and uses an information-theoreticalapproach based on entropy. C4.5 builds the decision tree using a top-down,divide-and-conquer approach: select an attribute, divide the training set intosubsets characterized by the possible values of the attribute, and follow thesame procedure recursively with each subset until no subset contains objectsfrom more than one class. The single-class subsets correspond to leaves ofthe decision tree.
The DT has nodes and leaves where nodes correspond to some test to beperformed and leaves correspond to the two classes: “watched” and “notwatched”. Testing an unknown show involves parsing the tree to determinewhich class the unknown show belongs to. When computing arecommendation for each TV show, a probability is computed that the showwill be in the class “watched” and the class “not watched” based on theshows it correctly classified during training. However, if at a particulardecision node we encounter an unknown attribute value, so that the outcomeof the test cannot be determined, the system then explores all possible
12 Chapter 5
outcomes and combines the resulting classifications: the class with thehighest probability is assigned as the predicted class.
As decision trees become large, with increasing viewing histories, theybecome difficult to understand because each node in the tree has a specificcontext established by the outcomes of tests at antecedent nodes. We thenrewrite the tree as a collection of rules, which is usually more accurate than adecision tree (Gutta et al. 2000).
3.3 Explicit Recommender
Based on participants’ request for interaction with the recommender andour need for a recommender that could work quickly “out of the box”, wedeveloped an explicit recommender (Kurapati et al. 2001) that relies on userinputs. By default our system assigns a neutral 4 for all channels, genres,days, and times of day. Individual users can then indicate their preference ona 1 to 7 scale (1 for “hate the feature”, 7 for “love the feature”) for as manyor as few features as they prefer. We compute an explicit recommender scoreas follows:
E = wDayT * rDayT + wCh * rCh + (1/K) * ∑ wGenrei * rGenrei (1)
where rDayT is the profile rating for the feature daytime, rCh - profile ratingfor channel, rGenrei - profile rating for i-th genre describing a given show(from K genres describing it; in Tribune Media Services metadata up to sixgenres describe a show) and the corresponding heuristically determinedweights are: wDayT = 0.1, wCh = 0.2 and wGenrei = 0.7 (for each genre).Users have two methods of inputting their preferences as described inSection 5.2.
4. INCREASING ACCURACY THROUGH FUSION
Results of testing the explicit and two implicit recommenders with realusers (Kurapati et al. 2001) suggested reasonable recommender accuracy.However different recommenders seemed to perform well for different userswith no easy way to pre-match individual recommenders to individual users.Further analysis revealed that different recommenders performed well forvery different sets of shows. As a follow-up we attempted to improveaccuracy by fusing (combining) recommender outputs using a neuralnetwork. We chose to use a neural network because it might detectcorrelations that simple heuristics cannot. We believe that such an approachimproves the robustness of our system.

5. TV Personalization System 13
The fusion system combines the following individual recommenders:1. Implicit Bayesian based on individual view history2. Implicit Bayesian based on household view history3. Implicit Decision Tree based on individual view history4. Implicit Decision Tree based on household view history5. Explicit
The individual and household view histories were used separately inorder to determine whether a TV recommender could just do with oneprofile per box in a household or if we needed to make fine grain distinctionsbetween individual household members.
We developed two approaches to fusion. The first method uses a singleRadial Basis Function (RBF) neural network for all the users. We trainedthis network on partial data from a subset of our eight viewing historyparticipants. This approach has the advantage that it can be developed usingground truth data from a small set of participants to improve accuracy for alarge set of users in a deployed product. The second approach uses a customnetwork for each user. This neural network was trained on each of ourviewing history participants. This approach ensures that the network isresponsive to a particular user’s characteristics. For example, certainparticipants obtained better recommendations using an individual profilewhile others did better using a household profile. Also the importance ofexplicit recommenders varied from participant to participant. A challengethis second approach faces is that it requires ground truth data from all users.This is not likely in a final product as we do not expect users to be willing toinform the system if they actually liked each show they watched and did notwant to see each show the system selects as “not-watched”.
4.1 Radial Basis Function Neural Networks
We chose Artificial Neural Networks because of their ability to recognizepatterns in the presence of noise and from sparse and/or incomplete data.They perform matching in high-dimensional spaces, effectively interpolatingand extrapolating from learned data. We chose Radial Basis Function (RBF)networks (Moody & Darken 1989) because they are universal approximatorsand train rapidly; usually orders of magnitude faster than back propagation.Their rapid training makes them suitable for applications where on-line,incremental learning is desired such as a set-top box observing TV viewing.The ways we used RBF networks are explained in Sections 4.3 and 4.4.

14 Chapter 5
4.2 Evaluation
In order to generate a set of ground truth data, we asked our eightviewing history participants to rate a set of approximately 300 TV shows. Atthe time of this evaluation one of our participants had recently relocated, sowe have data on seven people, referred to as A, C, D, F, G, H and I. UsingLikert scales—an attitude measurement method that allows users to rate on adiscreet scale of “strongly agree” to “strongly disagree”—participants ratedeach show as “would watch” (1), “may watch” (0.5) and “wouldn’t watch”(0). In addition, participants could rate a show as “do not know” (DNK)when they were not familiar with its title. Only the shows known to the userwere utilized (there were 1348 such shows).
We compared fusion results using three metrics: Hit Rate (HR), FalsePositive Rate (FPR), and Mean Squared Error (MSE). Hit Rate and FalsePositive Rate were computed for only those shows that were crisplyclassified by the user either as 0 (wouldn’t watch) or 1 (would watch). Forthe shows classified as 0.5 (may watch) it is disputable whether they shouldbe recommended or not. For computing Hit Rate and False Positive Rate, athreshold value needs to be chosen. A higher threshold value will lead toboth lower Hit Rate and False Positive Rate, and a lower threshold willresult in higher Hit Rate and False Positive Rate.
The main advantage of using the Mean Squared Error is that it can becomputed for shows with any ground truth rating (yes-1, no-0, and may be-0.5). Its additional advantage is that it does not require a determination of athreshold value, which can be quite cumbersome. This metric suits our goalof producing a ‘degree of match’ for each show with a profile, rather than ahard yes or a no vote on a particular show. In the end, based on userevaluation, our recommender interface displays all shows, ordering themfrom most to least recommended.
4.3 Fusion Method 1: Single RBF Net for All Users
RBF networks with five inputs, one output and a varying number ofhidden nodes were trained. We used scores from the five individualrecommenders—listed at the beginning of Section 4—as inputs to the RBFnetwork, which produces fused recommendations as the output. The higherthe output value, the higher the recommender rating assigned to a show. Weused 15% to 40% of data from subjects A, C, and D as a training set. Thisrepresents 26% of the whole data set. For the networks’ cross-validation, weused 14% to 45% of data from subjects D, F, and G. This represents 13% ofthe whole data set. The remaining data was employed for the end tests(testing recall). Data from users H and I were neither used in training nor in
5. TV Personalization System 15
cross-validation as these users had no household values. The bestperformance of RBF networks in terms of Hit Rate (HR) and False PositiveRate (FPR) was obtained by cross-validation for a network with 15 hiddennodes. A threshold of 0.5 was used to compute HR and FPR.
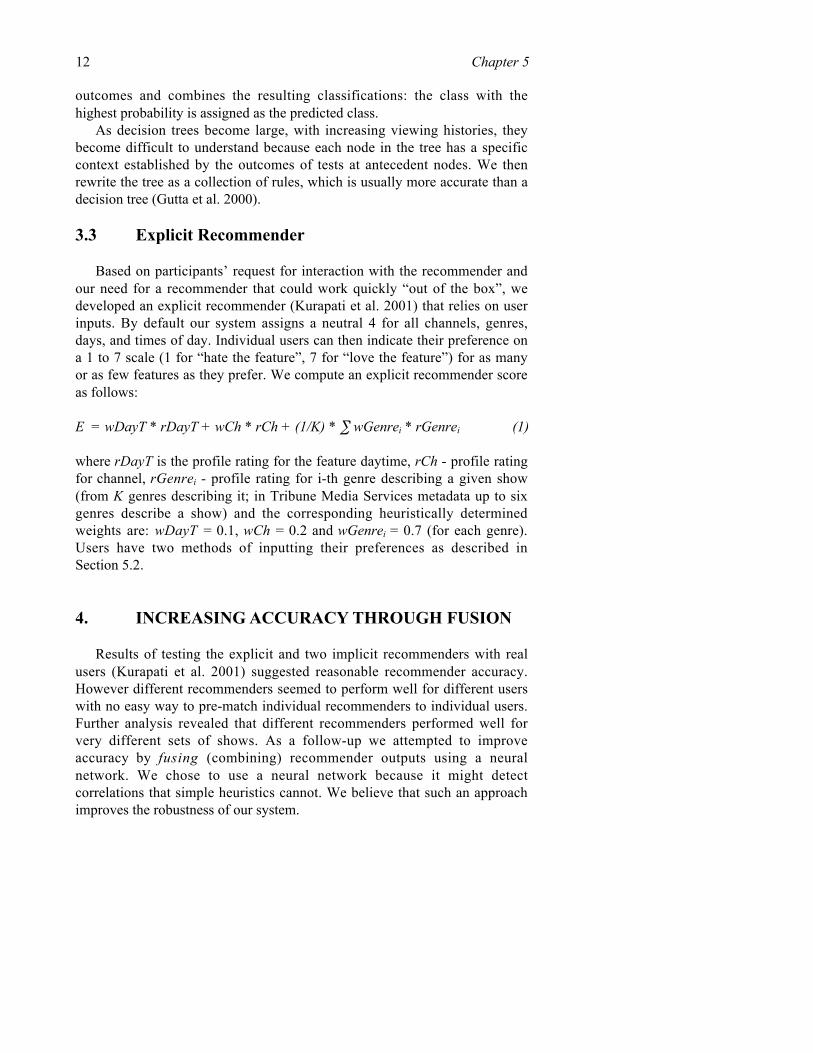
Figure 5-2 depicts the hit rate for all the subjects. Hit rate obtained byfusion is on average 29% higher then the average of the hit rates from nineseparate recommenders.
Figure 5-2. Comparison of no fusion Hit Rate and one RBF net Hit Rate.
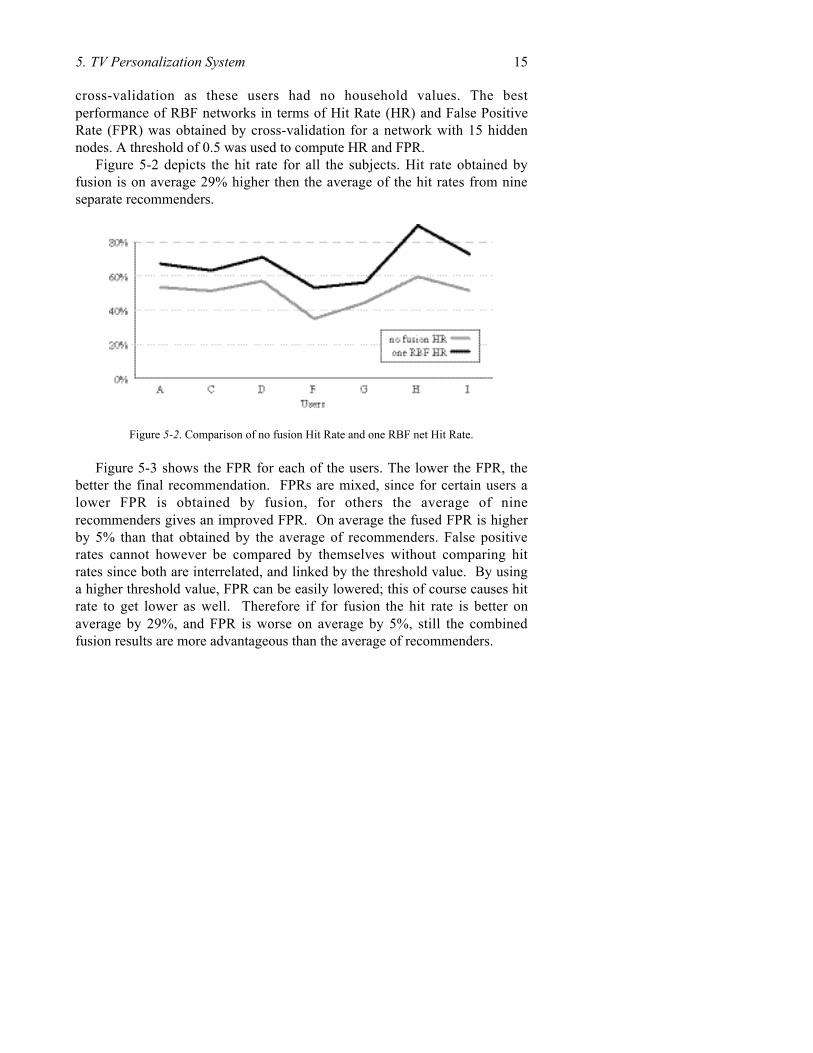
Figure 5-3 shows the FPR for each of the users. The lower the FPR, thebetter the final recommendation. FPRs are mixed, since for certain users alower FPR is obtained by fusion, for others the average of ninerecommenders gives an improved FPR. On average the fused FPR is higherby 5% than that obtained by the average of recommenders. False positiverates cannot however be compared by themselves without comparing hitrates since both are interrelated, and linked by the threshold value. By usinga higher threshold value, FPR can be easily lowered; this of course causes hitrate to get lower as well. Therefore if for fusion the hit rate is better onaverage by 29%, and FPR is worse on average by 5%, still the combinedfusion results are more advantageous than the average of recommenders.
16 Chapter 5
Figure 5-3. Comparison of no fusion FPR and one RBF net FPR.
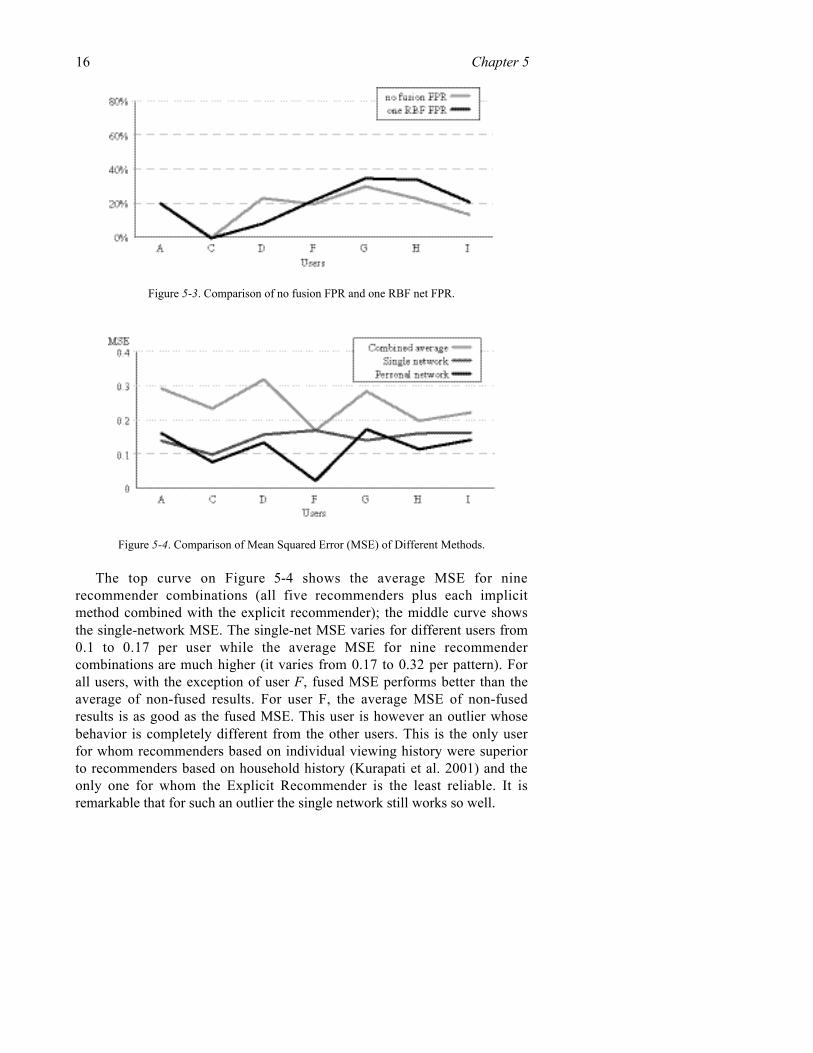
Figure 5-4. Comparison of Mean Squared Error (MSE) of Different Methods.
The top curve on Figure 5-4 shows the average MSE for ninerecommender combinations (all five recommenders plus each implicitmethod combined with the explicit recommender); the middle curve showsthe single-network MSE. The single-net MSE varies for different users from0.1 to 0.17 per user while the average MSE for nine recommendercombinations are much higher (it varies from 0.17 to 0.32 per pattern). Forall users, with the exception of user F, fused MSE performs better than theaverage of non-fused results. For user F, the average MSE of non-fusedresults is as good as the fused MSE. This user is however an outlier whosebehavior is completely different from the other users. This is the only userfor whom recommenders based on individual viewing history were superiorto recommenders based on household history (Kurapati et al. 2001) and theonly one for whom the Explicit Recommender is the least reliable. It isremarkable that for such an outlier the single network still works so well.

5. TV Personalization System 17
4.4 Fusion Method 2: Separate RBF Network per User
We also trained a separate RDF network for each individual participant.Approximately 40% of the data were used for training, 15% for cross-validation, and the rest for testing. The number of hidden units for eachuser's fusion network was determined by checking the performance of a setof trained RBF networks on the cross-validation set. The network that gavethe best performance in terms of HR and FPR on the cross-validation set wasthe one chosen.
The overall performance of fusion can be characterized by MSE that isshown as the bottom curve in Figure 5-2. The separate networks giveexcellent results, consistently better than the average of recommendations:MSE of the fused results varies for different users from 0.02 to 0.17(compared with 0.17 to 0.32 for the average of individual recommenders).
It is worth noting the superior performance of fusion for user F. Sincetraining took place on the data from this outlier, RBF network weights havestabilized to better describe this user, resulting in the smallest MSE of all.This shows that separate networks work especially well for outliers whocannot be well described by a common (stereotype) network.
5. INTERFACE DESIGN
We began our design by reviewing participant feedback from evaluationsof two previous interfaces. Three issues emerged. First, users complainedthat both our earlier designs and current commercial products required toomany button clicks and navigation of too many screens to complete a singletask. Second, users wanted more flexible interaction with the recommender.Some users wanted to have almost no interaction; some users wanted to takecomplete control; and some users wanted to have more limited interactionwith the recommender. Third, users displayed a lack of trust with therecommender. When we recommended shows they regularly watched, theyfelt the recommender worked well. However, when we recommended ashow they had never heard of, instead of thinking the recommender hadfound something new to watch, they assumed it was broken. The design ofthe Touch and Drag interface focused on addressing these three userinterface issues.
5.1 Ease of Use
Traditional TV interfaces, including our two previous designs, forceusers to maneuver a jumping highlight across a series of screens making the
18 Chapter 5
completion of a single task quite time consuming. For example, if users wantthe fifth item on a list, they must press the cursor-down button four timesand then press OK. We chose to address this problem by (i) placing ourinterface on a touch-screen remote control where users could employ theirfinger as a floating cursor, and (ii) designing a series of expanding andcollapsing interface elements so individual tasks could be solved on a singlescreen.
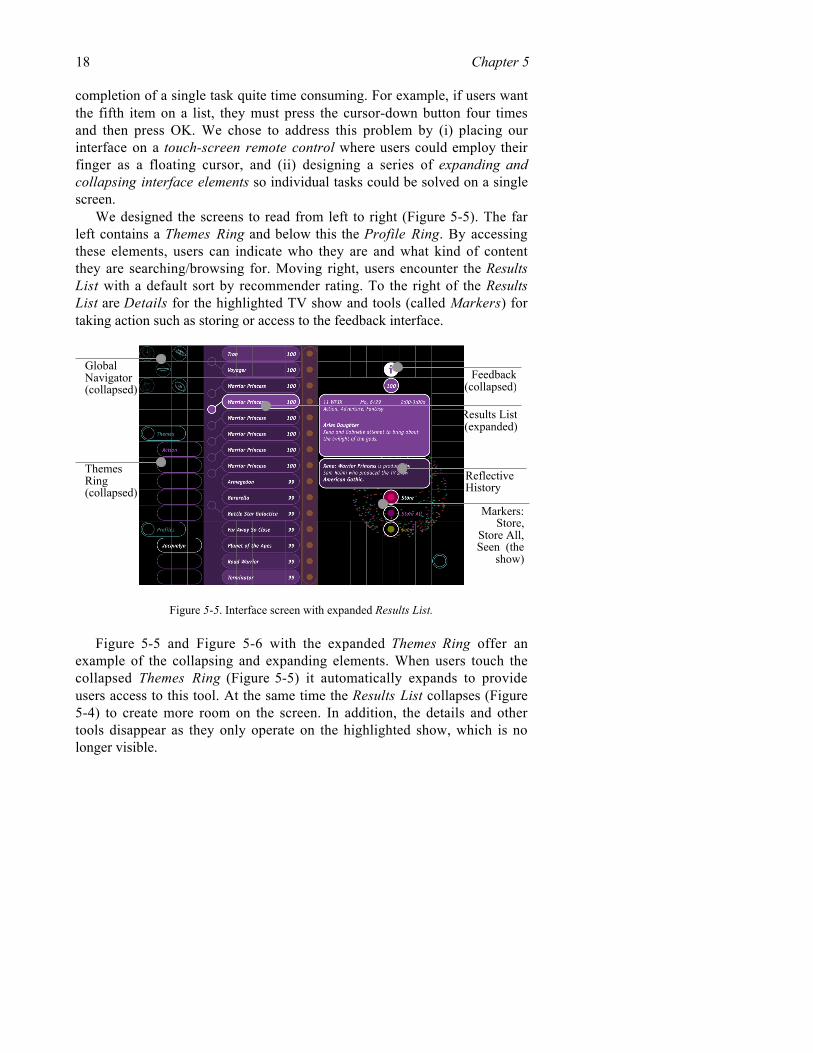
We designed the screens to read from left to right (Figure 5-5). The farleft contains a Themes Ring and below this the Profile Ring. By accessingthese elements, users can indicate who they are and what kind of contentthey are searching/browsing for. Moving right, users encounter the ResultsList with a default sort by recommender rating. To the right of the ResultsList are Details for the highlighted TV show and tools (called Markers) fortaking action such as storing or access to the feedback interface.
Figure 5-5. Interface screen with expanded Results List.
Figure 5-5 and Figure 5-6 with the expanded Themes Ring offer anexample of the collapsing and expanding elements. When users touch thecollapsed Themes Ring (Figure 5-5) it automatically expands to provideusers access to this tool. At the same time the Results List collapses (Figure5-4) to create more room on the screen. In addition, the details and othertools disappear as they only operate on the highlighted show, which is nolonger visible.
GlobalNavigator(collapsed)
Feedback(collapsed)
Results List(expanded)
ReflectiveHistory
ThemesRing(collapsed)
Markers:Store,
Store All,Seen (the
show)

5. TV Personalization System 19
Figure 5-6. Screen with expanded Themes Ring.
5.1.1 Touch, Drag, and Stroke
The design offers three interaction methods: “Touch”, “Drag”, and“Stroke”. Touch allows users to select different elements on the screen. Forexample, if users want to record a TV show, they can touch the Markerelement labeled “Store” (Figure 5-5). To record multiple episodes of thesame show, users can touch the Marker labeled “Store All.”
Figure 5-6 offers an example of the Drag interaction. In order to see all ofthe items on the Themes Ring, users drag their finger clockwise or counterclockwise, causing the ring to rotate. When they find a desired theme, theydrag it onto the collapsed Results List. The Drag action not only reduces thenumber of steps needed to complete a task, it also creates a more naturalisticinteraction. If users wish to see Action shows on the Results List, they dragthe Action element there.
Many other recommenders address the problem of long lists of shows byhiding shows that fall below a threshold or by displaying only the top Nnumber of shows. However, our view history participants wereuncomfortable with this approach. They did not trust any recommenderenough for it to eliminate possible selections. Therefore our interfacepresents all of the next weeks shows matching the Themes Ring selection,sorted from highest to lowest rated. This means users often must deal withvery long lists. To address this problem we developed the Stroke interaction.When users want to rapidly scroll the list, they stroke their finger up or downon the list. When the finger is lifted, the system sets a velocity and thenslowly decelerates. If users see an item they are interested in scroll by, they
Themes Ring(expanded)
Results List(collapsed)

20 Chapter 5
touch the list to stop it from moving. This idea works somewhat like thewheel of a bicycle that has been turned upside down. People can Stroke thewheel to make it spin. They can then either watch it decelerate or touch thewheel to stop it.
Use of expanding and collapsing elements combined with the use of afinger as a pointing device greatly reduces the number of screens users needto navigate and the number of steps (button clicks) needed to complete asingle task. For example, consider the task of browsing for movies. Usingthe Touch and Drag interface, users navigate two screens (Global Navigatorand Find TV) and perform three Touches and three Drags in order toproduce a personalized list of movies. Using TiVo, users need to visit fivescreens and perform a minimum of fourteen button clicks in order to see aalphabetical listing of movies.
5.2 Flexible Recommender Interaction
During evaluation of the earlier designs and of the implicitrecommenders, some users expressed a desire to interact more directly withthe system. This led in turn to our definition of three different user groupsand two interfaces to communicate with the explicit recommender.
5.2.1 Do it For Me Users
The implicit recommender works well for the Do it for me users. Thisrecommender monitors viewing history and then makes recommendations.All a user needs to do is watch TV. In addition, the Touch and Drag interfaceautomatically displays upcoming programs sorted by recommender rating.Placing highly recommended programs at the top of the list reduces thenumber of shows users need to browse.
5.2.2 Let’s Do it Together Users
The Feedback interface (Figure 5-7) supports the Let’s do it togetherusers and the Let me drive users. This interface allows users to access thepart of their explicit profile that corresponds to the currently highlightedshow. When users see a recommendation they disagree with or when theyjust want to better understand why a show has a certain rating, they canexpand the Feedback interface and view or modify the ratings.

5. TV Personalization System 21
Figure 5-7. Feedback interface expanded.
5.2.3 Let Me Drive Users
Let me drive users can take more control by selecting Profiles on theGlobal Navigator. This transitions them to the Profiles interface (Figure 5-8). Here they can rate all program attributes on a 0 to 100 scale. The systeminitially gives all items a neutral rating of 50. Users can quickly look throughthe listed items and change as few or as many as they want.
Figure 5-8. Profiles interface.
22 Chapter 5
The interface supports flexible access to the recommender without theneed for users to select a novice or expert mode. Users that want little or nointeraction are free to simply watch TV. Users that want some interactioncan choose how much or how little control they want to take by using theFeedback interface and the Profiles screen.
6. TESTING EASE-OF-USE
After completing the Touch and Drag interface design, we performed aproof of concept test. Our questions included:1. Does the use of collapsing and expanding elements improve ease of use
over nested menu systems?2. Does the use of a finger as a floating cursor improve ease-of-use over a
jumping highlight and traditional four-cursor remote control?3. How do users feel about a large touch-screen remote control?
For this evaluation we recruited six subjects (not the participants in ourviewing history study), three men and three women, ranging in age from 21to 60. They were all moderate to heavy TV viewers. Each participant rateditems for the explicit recommender in order to generate individualrecommendations.
We chose a task-based approach to the test, asking subjects to completetwo common TV tasks using TV Guide Magazine™, Touch and Drag, andTiVo™. Task 1 asked users to find three upcoming movies they wanted towatch. Task 2 asked participants to find the next broadcast of the TV showRoseanne. Participants tested only one system at a time, starting first withTV Guide, then Touch and Drag, and finally TiVo. They were each allowedto play with one of the systems and then asked to complete both tasks. Whenall tasks had been completed on all systems, we asked subjects to answerqualitative questions about the three systems. One of the challenges oftesting came from the recommender. TV guide magazine clearly has norecommender, and in addition, since TiVo does not employ an explicitrecommender, we had no way of tuning this device to personalize thecontent for users.
Subjects found the Touch and Drag interface much easier than either TVGuide magazine or TiVo at finding a list of movies they wanted to watch.The reduced number of screens and clicks along with the personalized listingof movies significantly reduced the amount of time users spent with oursystem compared to TiVo. TiVo was also handicapped by the fact that thelist of movies and individual descriptions of movies appear on separatescreens, forcing users to constantly move back and forth between screens.
5. TV Personalization System 23
TV guide was most significantly handicapped by a lack of a single listing forall movies and offered no method of filtering for the channels an individualparticipant received.
Finding the next broadcast of Roseanne proved easiest on TiVo;however, Touch and Drag took only slightly longer. TiVo’s on screenkeyboard made title input quite easy. Our system suffered from lack oflabeling on our Sort tool that allows users to resort the Results List by titleinstead of the default sort by rating. Once participants discovered this tool,they had no problems completing the task. TV Guide proved nearlyimpossible for this task. Only one of the six participants completed this, andhe ended up looking at every page until he found Roseanne.
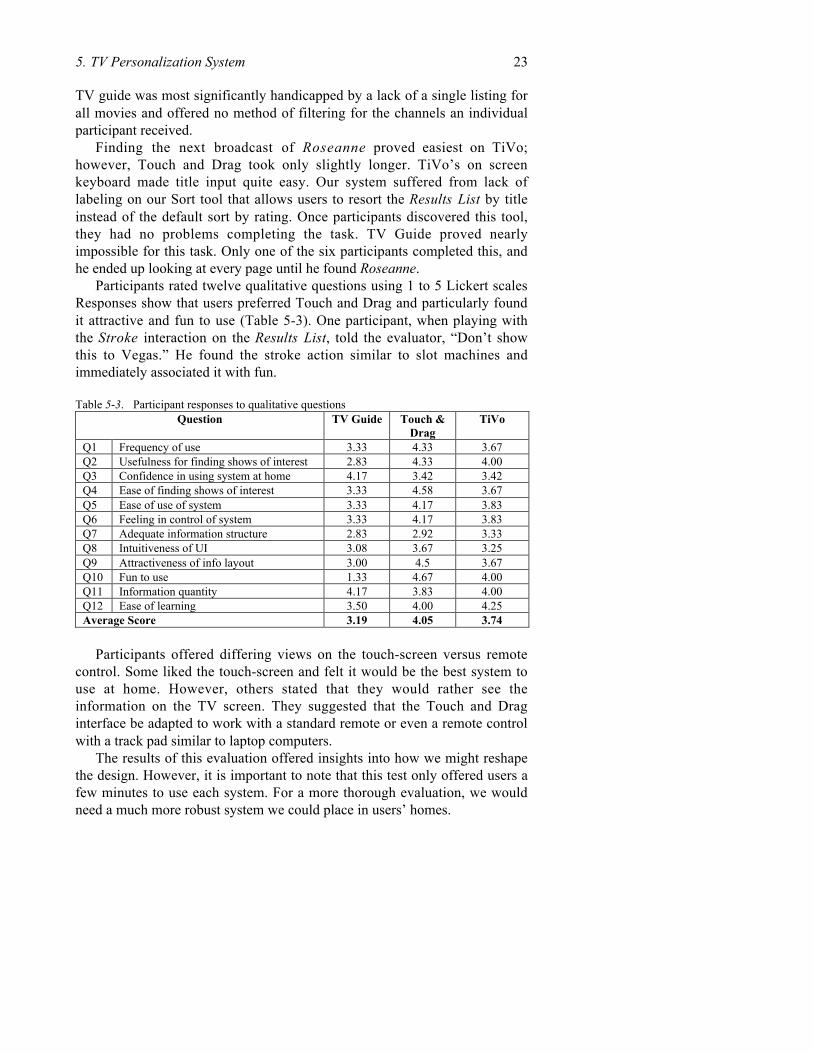
Participants rated twelve qualitative questions using 1 to 5 Lickert scalesResponses show that users preferred Touch and Drag and particularly foundit attractive and fun to use (Table 5-3). One participant, when playing withthe Stroke interaction on the Results List, told the evaluator, “Don’t showthis to Vegas.” He found the stroke action similar to slot machines andimmediately associated it with fun.
Table 5-3. Participant responses to qualitative questionsQuestion TV Guide Touch &
DragTiVo
Q1 Frequency of use 3.33 4.33 3.67Q2 Usefulness for finding shows of interest 2.83 4.33 4.00Q3 Confidence in using system at home 4.17 3.42 3.42Q4 Ease of finding shows of interest 3.33 4.58 3.67Q5 Ease of use of system 3.33 4.17 3.83Q6 Feeling in control of system 3.33 4.17 3.83Q7 Adequate information structure 2.83 2.92 3.33Q8 Intuitiveness of UI 3.08 3.67 3.25Q9 Attractiveness of info layout 3.00 4.5 3.67Q10 Fun to use 1.33 4.67 4.00Q11 Information quantity 4.17 3.83 4.00Q12 Ease of learning 3.50 4.00 4.25Average Score 3.19 4.05 3.74
Participants offered differing views on the touch-screen versus remotecontrol. Some liked the touch-screen and felt it would be the best system touse at home. However, others stated that they would rather see theinformation on the TV screen. They suggested that the Touch and Draginterface be adapted to work with a standard remote or even a remote controlwith a track pad similar to laptop computers.
The results of this evaluation offered insights into how we might reshapethe design. However, it is important to note that this test only offered users afew minutes to use each system. For a more thorough evaluation, we wouldneed a much more robust system we could place in users’ homes.

24 Chapter 5
7. IMPROVING TRUST
During evaluation of our earlier recommenders and interfaces weencountered a difficult problem. When our system recommended programsparticipants regularly watched, they thought it worked great. However, whenthe system recommended programs they did not know, participants felt therecommender was “broken”. This created a serious problem. Arecommender that only finds programs users know they like will havelimited value. In order to create a recommender that provides real value itmust help users find new shows to watch and present these new shows in away that they might try them.
Experimental evidence has shown that providing explanations of how arecommender works can help to improve user acceptance of a recommendersystem (Herlocker et al 2000). The Touch and Drag interface allows users toglimpse how the recommender is working through the feedback interface(Figure 5-5) and the Profiles screen (Figure 5-6). However, these interfacesdo not specifically address new shows.
Looking deeper into the value of new shows we were quite surprised todiscover that people generally do not want to be challenged when selectingprograms to watch. The majority of television viewing takes place in theevening (Kubey & Csikszentmihalyi 1990), at a time when people want torelax after a hard day. People often choose to watch television at this timebecause it makes them feel relaxed (Kubey & Csikszentmihalyi 1990). Inaddition, much of television watching is nonselective (Lull 1990). Viewerscoast from one show to another, watching whatever program comes on.
We found a good analogy in food. People do not want to try new food ateach meal. Often they want comfort food, particularly when they are stressedsuch as at the end of a workday. Menus offer people a chance to trysomething new by listing the main ingredients. When people try a new food,they have some expectation of what it will be like based on foods they haveeaten in the past.
7.1 Reflective History
Based on the food analogy we developed the Reflective History (Figure5-3), an interface element designed to motivate people to try a new TV showwhen they were in the mood. The element needed to be subtle, since themood to try new things is rare. We wanted it to tempt the user as opposed tocramming new programs down their throats. This element appears when“new” and “highly rated shows” are highlighted in the results list.
We generate these conversational sentences by comparing users’ viewinghistories used by the implicit recommender with the metadata about

5. TV Personalization System 25
upcoming TV shows. Our system looks for highly rated new programs(programs not already in a user's viewing history). Next, it searches for acommon person between the new TV show and TV shows the user hasalready seen. When it finds an appropriate match, the system generates aconversational sentence using the following structure: <NewProgram><NewTask> <Person> who <OldTask> <OldProgram>. Table 5-4 offersexamples of the text strings for <Task>, <NewTask>, and <OldTask>.
Table 5-4. Text strings used in reflective historyTask NewTask OldTaskDirector is directed by directed the TV showProducer is produced by Produced the TV showWriter is written by wroteActor stars plays <Character> in
Example: Boston Public stars Jeri Ryan who plays Seven of Nine in StarTrek: Voyager.
The reflective history sentence uses a conversational structure; making itsound like something one friend might say to another. This builds on Reevesand Nash’s theory that people interact with computers as if they were people(Reeves & Nass 1999). The sentence reveals some of what the system knowsabout the user. This is a type of self-disclosure, which can help to build trust(Wheeless & Grotz 1977). The short, conversational sentence also workswell with our interface design. Its size and location make it easy for users toignore. However, its appearance and disappearance as new shows move intothe highlight position on the results list make it easy to find for users who arein the mood to try something new.
8. CONCLUSIONS
The Touch and Drag personalization system integrates an accurate TVshow recommender engine and an easy to use interface that supports the waypeople want to watch and store TV shows. In addition, our interface designoffers appropriate insights into how the recommender engine works, helpingpeople both refine and trust the recommendations they receive. Preliminarytesting of the previous and current recommender engines and interfacesindicate that we are moving in the right direction.
Our recommender engine employs a robust design, combining both anexplicit and implicit recommender. Our explicit recommender allows usersto enter and modify their preferences to allow for both a system that can runout of the box, and to allow users to feel in control. The interface offers twomethods for entering and modifying preferences and in addition, preloads allratable items with a neutral value of fifty. The combination of the two

26 Chapter 5
interfaces and the pre-rated items allows the interface to seamlessly supportusers that want very little interaction with the recommender as well as usersthat want to really take control. This easy access encourages users to slowlytweak the explicit recommender until they get the results they want.
Our implicit recommender monitors all TV shows users watch, adjustingrecommendations based on current and changing tastes. This recommendersupports users that want no interaction with the recommender. By simplywatching TV the system can learn their likes and dislikes. The viewinghistory also provides an opportunity for increasing user trust. By mining theviewing history, the user interface can subtly recommend new programsbased on people that the programs have in common. Our conversationalapproach builds on the person-to-person model of self-disclosure to improveusers trust.
Our touch-screen based interaction makes both browsing and profilemanagement easy, efficient, and fun. The collapsing and expanding interfaceelements along with the use of a finger as a floating cursor help users tocomplete tasks on a single screen. The improvement in efficiency allowsusers to get back to doing what they like most: watching TV. The naturalisticstyle through the Touch, Drag, and Stroke interactions helps to clarify therelationships between the different interface elements and to make theinterface as entertaining to use as watching an actual TV show.
Finally, we generate accurate recommendations by fusing the results ofboth the implicit and explicit recommenders using a radial basis neuralnetwork. We developed two RBF network-based approaches to fusingrecommendations. The first method trains the network to be responsive to allusers while the second one employs a separate RBF net for each user. Bothmethods achieve a beneficial combination of the strengths of individualrecommenders.
The results of both approaches are very encouraging and superior to theaverage of recommendations. For most users separate networks perform thebest because they are well adapted to a given user’s characteristics. The mostremarkable separate network performance is obtained for an outlier whoseindividual recommender characteristics were almost the opposite from themainstream user. For this user a separate net gives much superior results tothe single (stereotype) network. For the mainstream users the differencebetween separate and single nets is much less pronounced.
The power of the single-network method is that such a fusion networkcan be developed based solely on the data from subjects in our study, whosebehavior conforms to the mainstream, and then deployed in the field where itcan perform well for users it has not encountered earlier. Later it could betuned to a specific user behavior by using feedback data collected by thesystem. We should however stress that the method developed is a proof-of-

5. TV Personalization System 27
concept demonstration and testing on a larger user population is needed toobtain statistically significant results.
This increased accuracy works with the whole interface design to helpimprove user trust of the recommender. In addition, the improved accuracyhelps bring the best TV shows for users to the top of long lists of shows,making it much faster and more interesting for users to find something theywant to watch.
ACKNOWLEDGEMENTS
We would like to thank Jeanne de Bont, Henk Lamers, Guy Roberts, LiraNikolovska, Lesh Parameswaran, John Milanski, and Jenny Weston ofPhilips Design for their assistance in design and evaluation of the interface.We would also like to thank Henk van der Weij of Big Camp in Eindhoven,the Netherlands, for his assistance with the implementation of the Touch andDrag interface.
REFERENCES
1. L. Ardissono, C. Gena, P. Torasso, F. Bellifemine, A. Chiarotto, A. Difino, B Negro: ‘UserModeling and Recommendation Techniques for Personalized Electronic Program Guides’.This Volume.
2. B. Smyth and P. Cotter: ‘The Evolution of the Personalized Electronic Program Guide’.This Volume.
3. M. Balabanovic and Y. Shoham: 1997, ‘FAB: Content-Based CollaborativeRecommender’. Communications of the ACM 40(3), pp. 66-72.
4. J. V. Barneveld and M. V. Setten: ‘Designing Usable Interfaces for TV Recommender’.This Volume.
5. P. Baudisch and L. Bruekner: 2001, ‘TV Scout: Guiding Users from Printed TV ProgramGuides to Personalized TV Recommendation’. Second International Conference onAdaptive Hypermedia and Adaptive Web Based Systems: Workshop on Personalization inFuture TV, Malaga, Spain, pp. 151-160.
6. T. Bickmore and J. Cassell: 2001, ‘Relational Agents: A Model and Implementation ofBuilding User Trust’. Conference on Human Factors in Computing, Seattle, WA, USA,pp. 80-87.
7. D. Billsus and M. J. Pazzani: 1998, ‘Learning Collaborative Information Filters’, FifteenthInternational Conference on Machine Learning, Wisconsin, USA, pp. 46-54.
8. P. Cotter and B. Smyth: 2000, ‘PTV: Intelligent Personalized TV Guides’. SeventeenthNational Conference on Artificial Intelligence, Austin, TX, USA, pp. 957-964.
9. D. Das and H. ter Horst: 1998, ‘Recommender Systems for TV’. Technical Report WS-98-08 Recommender System, Papers from the 1998 Workshop, Madison, WI. Menlo Park,CA: AAAI Press, pp. 35-36.
10. R. Duda and P. Hart: 1973, Pattern Recognition and Scene Analysis. New York: JohnWiley & Sons.

28 Chapter 5
11. B.J. Fogg, H. Tseng: 1999, ‘The Elements of Computer Credibility’. Conference onHuman Factors in Computing Systems, Pittsburgh, PA, USA, pp. 80-86.
12. S. Gutta, K. Kurapati, K.P. Lee, J. Martino, J. Milanski, D. Schaffer and J. Zimmerman:2000, ‘TV Content Recommender System’. Seventeenth National Conference on ArtificialIntelligence, Austin, TX, USA, pp. 1121-1122.
13. K.J. Hammond, R. Burke and K. Schmitt: 1996, ‘A Case-Based Approach to KnowledgeNavigation’. In D. Leake (eds.): Case-Based Reasoning Experiences, Lessons and FutureDirections. Cambridge, MA: MIT Press, pp.125-136.
14. J. Herlocker, J. Konstan and J. Riedl: 2000, ‘Explaining Collaborative FilteringRecommendations’. Conference on Computer Supported Cooperative Work, Philadelphia,PA, USA, pp. 241-250.
15. R. Kubey, M. Csikszentmihalyi: 1990, Television and the Quality of Life: How ViewingShapes Everyday Experiences. Hillsdale, NJ: Lawrence Erlbaum Associates.
16. K. Kurapati, S. Gutta, D. Schaffer, J. Martino and J. Zimmerman: 2001, ‘A Multi-AgentTV Recommender’. Eighth International Conference on User Modeling: Workshop onP e r s o n a l i z a t i o n i n F u t u r e T V , Son thofen , Germany ,http://www.di.unito.it/~liliana/UM01/kurapati.pdf.
17. H. Lee, J. Nam, B. Bae, M. Kim, K. Kang and J. Kim: 2001, ‘Personalized Contents Guideand Browsing based on User Preference’. Second International Conference on AdaptiveHypermedia and Adaptive Web Based Systems: Workshop on Personalization in FutureTV, Malaga, Spain, pp.131-150.
18. F. J. Lerch and M. J. Prietula: 1989, ‘How do we Trust Machine Advice?’. In G. Salvendyand M. J. Smith (eds.): Designing and Using Human-Computer Interfaces and KnowledgeBased Systems. Amsterdam, the Netherlands: Elsevier Science Publishers B. V., pp. 410-419.
19. J. Lull: 1990, Inside Family Viewing: Ethnographic Research on Television's Audiences.New York: Routledge.
20. J. Moody, C.J. Darken: 1989, ‘Fast Learning in Networks of Locally Tuned ProcessingUnits’. Neural Computation 1(2), pp. 281-294.
21. P. Mueleman, A. Heister, H. Kohar and D. Tedd: 1998, ‘Double Agents - Presentation andFiltering Agents for a Digital Television Recording System’. Conference on HumanFactors in Computing Systems, Los Angeles, CA, USA, pp. 3-4.
22. F. Pittarello, ‘Time-pillars World: A 3D Paradigm for the New Enlarged TV InformationDomain’. This Volume.
23. Predictive Media, Inc. - http://www.predictivemedia.com/24. J. R. Quinlan: 1983, ‘Learning Efficient Classification Procedures and their Application to
Chess End Games’. In R. S. Michalski, J. G. Carbonell and T. M. Mitchell (eds.): MachineLearning: An Artificial Approach, Vol. 1. Palo Alto, California: Morgan KaufmannPublishers Inc.
25. J. R. Quinlan: 1991, C4.5: Machine Learning Programs, Palo Alto, California: MorganKaufmann Publishers.
26. B. Smyth and P. Cotter: 1999, ‘Surfing the Digital Wave: Generating Personalised TVListings using Collaborative Case-Based Recommendations’. International Conference onCase-Based Reasoning, Springer-Verlag, Germany, pp. 561-571.
27. B. Smyth and P. Cotter: ‘The Evolution of the Personalized Electronic Program Guide’.This Volume.
28. TiVo, Inc. - http://www.TiVo.com29. Tribune Media Services - http://www.tms.tribune.com/30. L. Wheeless and J. Grotz: 1977, ‘The Measurement of Trust and Its Relationship to Self-
disclosure’. Communication Research 3(3), pp. 250-257.

5. TV Personalization System 29
31. J. Zimmerman and K. Kurapati: 2002, ‘Exposing Profiles to Build Trust in aRecommender’. Conference on Human Factors in Computing Systems, Minneapolis, MN,pp. 608-609.