chapter - viii functioning and impact 8.1 functioning of...
TRANSCRIPT
CHAPTER - VIII
FUNCTIONING AND IMPACT
8.1 Functioning of WUAs
Range of Functions Performed
8.1.1 The WUAs performed a diverse range of functions which varied not only from state to state
but sometimes also from association to association even within a state. The associations in
Tamilnadu worked mainly as pressure groups for release of water in adequate quantity to
their members from government canals whose operation remained in the hands of the
government. These associations did not fix or collect water rates which continued to be the
responsibility of the Revenue Department. Some contrib utions, however were made by
them for maintenance of field channels. Interest on capital fund kept in fixed deposits was
another source of their income. One gets the impression as if the chief motive for forming the
associations was to avail of the one time grant from the government agencies. But even in
Tamilnadu one of the associations (North Kodai Melazhian) had functions which went beyond
irrigation. These included marketing of produce, informing revenue officials regarding damages
to the crops either by flood or by drought etc. The WUAs in Maharashtra, however,
performed a wide range of functions which included not only maintenance of field channels
but also delivery of water to members and collection of charges. These worked as WUAs in
the real sense of the term. In Bihar, functions varied from association to association. Paliganj
had several functions while Asarganj very few. Vaishali was a class by itself. It undertook
functions which went even beyond irrigation also.
Management
8.1.2 Election to the management committee was either unanimous or through consensus. In Paliganj
election was through an informal process bordering on nomination of generally acceptable
persons by local leaders/ founder of the association. Such a consensus is expected in the
initial stages when there is much enthusiasm, little scope for personal gain and need for
sacrifice on the part of office bearers, Politics tends to enter later on and some evidence of
this had started emerging in some of the associations. A disturbing trend was the tendency of
the management committee members to continue even after their term was over. For example,
the management committee of Asarganj continued beyond the stipulated period of 3 years
and in Vaishali, elections were not held regularly, while the same Dalpatis continued for
years. In Anaikupam also, the management committee elected in 1990 continued even though
218
its term ended in 1993. While continuance of a few key persons in any voluntary organisation
may be needed to provide stability, continuance beyond a long period goes against the
interest of generating self renewing leadership. There is, therefore, need for ensuing that
elections are held at regular intervals.
8.1.3 Members of the associations were more or less satisfied with the manner in which the
respective associations were being managed. They felt that they has adequate voice in running
the affairs of the associations. Decisions were taken through consensus. They had no grouse
except in the case of Loni in Maharashtra which could be treated as an exception. This can
be viewed as an important achievement since it is a basic condition for the success of any
community based effort.
8.1.4 Some of the WUAs functioned from separate office premises acquired for the purpose. But
many of them worked from the residences of President or Secretary a Treasurer. Most of
the associations were maintaining accounts. Some of them had paid employees for keeping
record of decisions in meetings and maintenance of accounts. In other associations, the
WUA took the help of office bearers or some few members for the purpose.
Financial Aspects
8.1.5 In order to be sustainable, WUA must become financially viable. Their revenue from supply
of water to member farmers as well as from other sources must be higher than their expenses
including payments made to government as charges for water bought or as irrigation rates.
Not all WUAs, however, performed the revenue collection function. In Asarganj distributory
in Bihar, irrigation charges were not collected due to a pending court case. In karzon project
in Gujarat, MOU had not been signed. Hence WUA had no hand in collection of water
charges which were paid directly to Irrigation Department. In Kodai project also, water
charges were collected directly by the Irrigation Department. But in a majority of cases
studied in this report, WUAs were engaged in collection of water charges. There were
different models. In Paliganj in Bihar, WUA collected the government prescribed water
rates from farmers. Of this, 70 percent was to be retained for meeting expenses and the
remaining 30 percent was to be handed over to the government. Collection was better than
that in the earlier system but much less than the amount demanded. The Association was not
financially viable, Far from generating a surplus, the association was not even able to meet
the 30 percent payment obligation to the government. Elsewhere, specially in Gujarat and
Maharashtra, a different model was in vogue. In these cases WUAs bought irrigation water
on a wholesale volumetric basis from the government and supplied it to farmers on crop area
219
season basis. In most cases in Gujarat and Maharashtra, water charges received from farmers
were higher than those paid to government, thereby resulting in surplus because of which the
associations were financially viable. In Vaishali in Bihar, there was full cost recovery from
farmers but there was no surplus. Hence the association had to depend on outside sources
for replacement of tubewells.
8.1.6 In order to encourage timely payment of water charges by WUAs to government, states of
Maharashtra and Gujarat had prescribed rebates and penalties. In Maharashtra, 10 percent
extra charge was levied in case water charges were not paid in time whereas for timely
payment a rebate of 5 percent was allowed. In Gujarat a rebate of 20 percent was allowed
on full payment of water charges within the stipulated date. As a result, there were limited
cases of default in these associations. In Kodai, arrears were collected by Executive
Committee members having same social profile.
8.1.7 Some of the associations permitted supply of water to non-members but at higher rates e.g.in
Parunde in Maharashtra and Vaishali in Bihar. The extra charges were as high as 30 percent
in Palkhed.
8.1.8 Water charges collected from farmers were the principal source of revenue for the WUAs.
Interest on accumulated funds was a supplementary source for some of them. These funds
had two sources. First several associations had been given initial grant by the government
e.g. a grant of Rs.26000/- per year for two years in Mohini, or a grant of Rs. 100 per acre
of ICA for three years in Parunde and Loni, or a one time grant of Rs 450/- per hectare of
ICA in Thindal and Rs. 250/- per hectare in Anialkupam. In one of the associations namely
Anaikupam detailed rules on utilisation of this amount as well as of the interest income had
been laid down. Second, associations in Maharashtra and Gujarat had accumulated some
surplus out of annual savings from their operations and interest from it was a source of
Income. Some associations also derived income from additional activities undertaken by
them like marketing services provided.
8.1.9 The model prevailing in Maharashtra and Gujarat was found to be the best from the point of
view of financial viability and we would like to recommend the same. The rates prescribed
and concessions and rebates should, of course, vary from area to area depending on local
conditions. This model implied giving freedom to WUA to determine rates of water charges
to be collected from farmers. These rates might be different from or higher than the rates
prescribed by the government or the rates paid by them to the government. This is in contrast
to what prevailed in Paliganj where the rates to be charged by WUA from farmers were the
220
rates prescribed by the government. At the same time, the recovery rates must be cent
percent or quite high. WUA must devise suitable mechanisms to ensure high recovery rates.
In addition, the expenses to be incurred on repair and maintenance as well as running of the
office must be kept under control. The willingness of farmers to pay their dues in time and to
agree for higher water rates would depend on their own financial viability related to use of
irrigation water. For this purpose, their income from water must be higher than their expenditure
on it. Improvements in cropping patterns and crop yields are necessary for this to happen.
Such an outcome is indeed a basic condition for financial viability of WUAs. This may also
imply freedom in using saved water of one season to another specially in summer as was the
case in Maharashtra. Finally, financial viability of WUAs would also depend on their ability
to take profitable non-irrigation activities.
Training
8.1.10 Training is supposed to be an important component of better water management and improved
agricultural practices. Training is also useful for better management of any association.
Assumption of the responsibility of managing irrigation system by farmers themselves,
therefore, requires proper training in water management so as to derive optimum benefit out
of available water. Most of the WUAs, however, did not give much importance to training.
Very few of the sample respondents across all the 13 experiments had got an opportunity for
training. It is rather surprising that not a single respondent from Lakhigam association went
for training despite the association's claim that 40 farmers were sent for training in 1997. On
the other hand 25 percent of the selected respondents of Palkhed association 17 percent of
Parunde had attended training. The number of trainees claimed by WUAs or by officials
were few e.g. 7 in Paliganj, 5 in Mohini, 2 in Karjon over a period of 3 to 5 years. Most of
them were Executive Committee members or some selected farmers presumably close to
the management. Since training involved free trips to distant places, it might have been treated
as source of patronage. In several associations as in Mohini, Thindal, karjon and Kodai,
concerned irrigation officials were also sent on training.
8.1.11 The respondents who had attended training reportedly derived benefits like reduction of
water loss, increase in area under irrigation, better water management, improved agricultural
practices, higher yields etc. This was as per perception of the farmers trained. The actual
data collected at the beneficiary level, however did not indicate any difference between
practices followed by farmers trained and those not trained.
8.1.12 The subjects and methodology of training varied from association to association. Subjects
221
included optimum use of water, importance of timely irrigation, better water management,
prevention of water losses, improved agricultural practices, drip and sprinkler irrigation,
formation of WUA, jusicious distribution of water, management practices including accounts
keeping etc. Most of the training programmes involved attending formal courses for 2 to 4
days in training institutions like WALMI. Training also included visits to successful experiments
in PIM either within the state or even outside and farmers meetings in the villages.
8.1.13 It can be seen from the above that training so far has been taken in a casual manner even
though most of the respondents have suggested that it should be treated as important.
Appropriate training modules for farmers, executive committee members and officials be
evolved. Our suggestions in this respect are given later on.
Water Scheduling
8.1.14 There were no set rules for delivery of water to different farmers and different crops. Each
association worked out guidelines by consensus among members to suit local requirements.
In Mohini, water was released to farmers in accordance with a scheme of priority. Vegetable
crops were accorded top most priority. Sugarcane also received a high priority. Water was
released first to farmers in the middle followed by those in the tail-end and lastly to those at
the head reach. In Palkhed in Maharashtra, the first priority in the delivery of water was
given to tailenders, followed by those in the middle reach and then to those in the head reach.
In Anaikuppam scheduling of water was worked out by Irrigation wing in consultation with
farmers and as per needs of the area. More water was released at the time preparation of
nurseries.The scheduling of water was a very important item for discussion in meetings of the
managing committees in all WUAs. The objective was to meet the water requirements of all
the members as far as possible.
Maintenance
8.1.15 Diverse practices prevailed with respect to maintenance of the distributaries and field channels.
In Kodai WUA associated itself with repair and maintenance of field channels below 10
hect. limit. This work was undertaken on payment by a members of the Executive Committee.
Repair and Maintenance of main canal was, however, done by the I.D. through contractors.
In associations where MOU had been signed as in Palkhed and Parunde in Maharashtra, the
WUA was responsible for maintenance. In others, maintenance was done by I.D. In Palkhed
member farmers were responsible for maintaining field channel alonside their respective plots.
On the whole maintenance by members was more satisfactory. The physical condition of the
distributaries and channels improved in such cases.
222
8.1.16 Inadequacy of funds provided by government was a major constraint in proper maintenance.
In Maharashtra, for example, for maintenance of main channel, I.D. provided funds at the
rate of Rs. 20 per hect. of ICA every year. to the association whose responsiblity was to
undertake repair work including extration of grass and sand. As can be seen from paras
5.2.4.14, 5.3.4.8 and 5.3.4.9 expenditure incurred by WUA on maintenance was more
than that provided by government. The excess expenditure was met out of excess water
charges received by these WUAs from members. In Thindal in Tamilnadu the field channels
were maitained and repaired by the WUA from the interest earned from the deposited
amount. But the interest amount was not sufficient. Hence the remaining funds were collected
from members. In Asarganj, the Irrigation Department spent only Rs. 2 lakhs during the last
three years on maintenance as against got the estimated requirement of Rs. 6 lakhs. The
quality of maintenance of irrigation system could well be well with such meagre amount.
Opinion on Overall Performance
8.1.17 With regard to members' perception of performance of the associations, there was overall
satisfaction in Paliganj, Asarganj, Vaishali, Karzon, Baldeva, Lakhigam, Palkhed, Parunde,
Kodai, and Anaikupam. They were getting adequate and timely supply of water which is
what they needed. Decisions taken regarding delivery of water were enforced presumably
because there was no problem in getting adequate supply of water. They were saved from
the hastle of approaching I.D staff which they were doing before. Loni, however, was an
exception. Most of the farmer members of this WUA were dissatisfied. Reaction was mixed
in Mohini and Thindal. Loni was the case where the problem of water scarcity was the most
acute.
8.1.18 The perception of non-members towards overall performance of WUAs was quite positive.
Members of several control groups expressed their willingness to form WUAs even though
they were getting adequate water as in Karjan, Baldeva and Lakhigam in Gujarat. They
hoped that WUA would further improve their position.
8.2 Socio Economic Impact
8.2.1 Successful WUAs produce direct and indirect impacts on social and economic life in rural
areas. The most significant direct effect is rise in agricultural production due to improvement in
water availability. This was the combined result of increase in area under irrigation, improvement
in quality of irrigation indicated by its adequacy and timeless, better cropping pattern including
introduction of new crops and higher yields. Most of these effects are quantifiable and can be
223
attributed to better water management brought about by successful WUAs. Higher production
resulting in rise in income may bring about indirect and secondary effects like development of
rural infrastructure, establishment of processing industries, increase in tertiary services, changes
in education, health care and other aspects of quality of life, higher social consciousness etc.
The occurance of these effects, however, is quite problematic. These may or may not happen.
Besides, most of these elements are affected also by other factors which work simultaneously
in rural areas because of several programmes of the government and other agencies. Hence, it
is almost impossible to identify the precise effect of WUAs on them specially in the short run.
In view of this consideration, the study analysed only those impacts of WUAs which could be
attributed as directly to their influence.
Social Impact
8.2.2 Most of the WUAs studied helped in the promotion of social equity which is an important
national objective. This had several facets. One was the more equitable distribution of water
between head, middle and tailenders. Thus is Paliganj, farmers appreciated the problems of
tail enders and the deliveries to lower reaches of the canal improved over time. In Palkhed and
Parunde, distribution of water started with tailenders. In Kodai, special rules for meeting the
requirements of tail-enders had been made. Another facet was distribution of water within a
reach itself. Distribution was more equitable in the case also. Most of the farmers expressed
satisfaction over delivery schedules worked out by members of WUA through common con-
sent. WUAs had been specially helpful to small and marginal farmers who generally constitute
the majority in most of the associations and who thereby got adequate and timely supply of
water. In VASFA in Bihar, small and marginal farmers were the only beneficiaries. This is not
to say that the problem of inequitous distribution of water was solved entirely in all WUAs. As
stated in the text, it still prescribed as in Paliganj. But even here, it was better than before.
8.2.3 Provision of assured water to members brought about a change in social environment. It
reduced social tension in the villages. Tension persisted only in those few WUAs like Karjon
in Gujarat or Loni in Maharashtra which were facing acute problem of water scarcity. The
settlement of disputes related to water at the local level through formal or informal consulta-
tions and discussions among the members of a WUA also contributed to reduction in social
tension and in generating an atmosphere of social harmony and mutual cooperation. If contin-
ued for a long period, the above trend might result in a more cohesive social order in rural
areas.
224
8.2.4 Functioning of WUAs also helped in increasing farmers' capability in managing irrigation sys-
tem which aspect was altogether new for them. This also increased their self confidence. This
should be viewed as an important gain from social point of view because of the emerging
national commitment to empower village community as self governing institutions under the
Panchayati. Raj. It was observed that most of the WUAs studied in this report functioned in
the true democratic spirit, without dominance by any group.
8.2.5 Finally, the transfer of management responsibilities to WUAs reduced the scope for corrup-
tion which reportedlly prevailed in the earlier system. Most of the farmer respondents of this
study mentioned this as a factor which facilitated their acceptance of the new system.
Economic Impact
8.2.6 Assessment of economic impact was made on the basis of data related to area under irrigation,
quality of irrigation, yield per hectare, changes in cropping pattern, and value of produce at
constant prices. For this purpose both 'before' and 'after' as well as 'with' and 'without'
methodologies were used. Application of both the methodologies however, encountered
problems in some cases. There was a long time gap between 'before' and 'after' in a few
cases as in Mohini (20 years). Moreover the time gap was different in different cases as for
example, it was only 3 years in Paliganj as against 20 years in Mohini. This aspect, therefore,
was also taken into account while judging the inter se performance of different associations.
As regards 'with' and 'without' methodology, the problem in a few cases was one of finding
a suitable control group in the vicinity of the project area, because in some cases surrounding
areas were also irrigated and were having Water Users Associations. Such problems,
however, are not peculiar to this study alone. These are usually faced in any impact study.
Because of this reason, a combination of both the methodologies was used to assess the
impact.
8.2.7 Subject to the observations made above, we may compare the performance of different WUAs.
Table 7.2 to 7.6 give the data. The performance was a mixed one. It was excellant in the case
of Palkhed and Parunde associations in Maharashtra. Mohini in Gujarat, and poor in Loni in
Maharashtra, Karjon in Gujarat and Paliganj in Bihar and somewhat satisfactory in Lakhigam
in Gujarat and the three associations of Tamilnadu. Impact was a mixed one even within a state.
PIM is thus not a magic wand which could automatically bring about a change in irrigated
agricultural scenario. Much would depend on how it is brought about and how it functions and
whether the rules governing its operations are satisfactory. This study identified some of these
225
rules and conditions and these would be discussed subsequently.
Area Irrigated
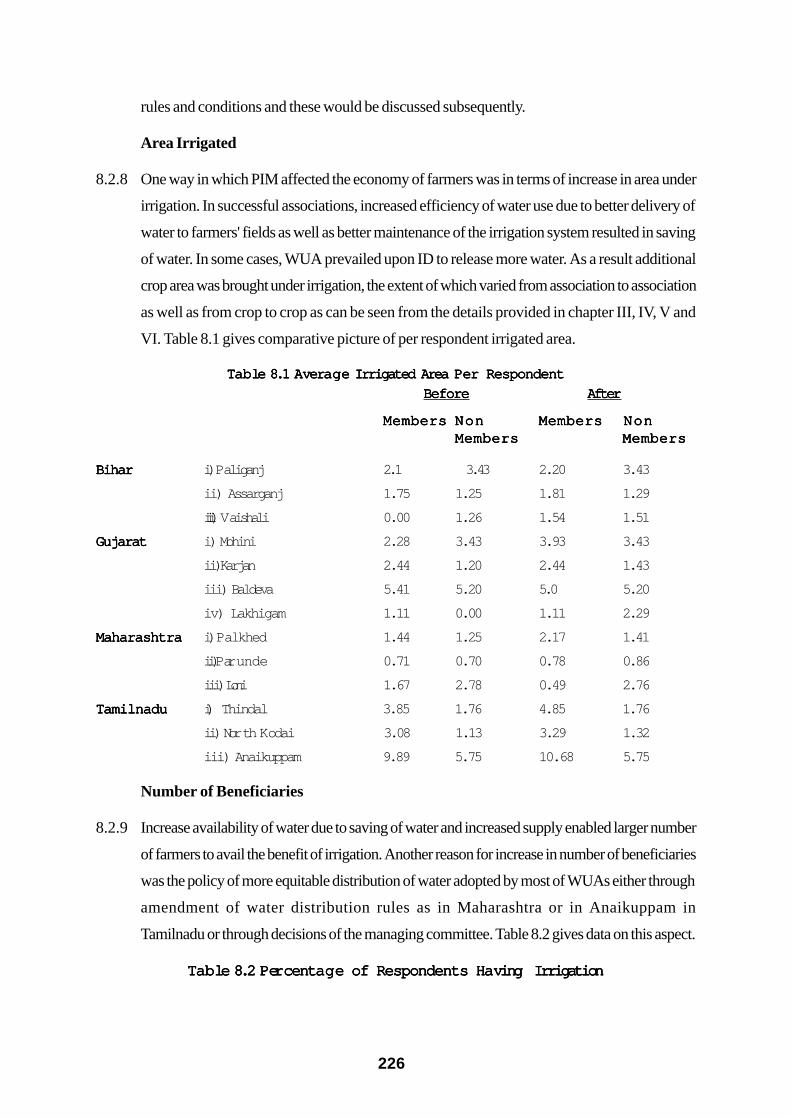
8.2.8 One way in which PIM affected the economy of farmers was in terms of increase in area under
irrigation. In successful associations, increased efficiency of water use due to better delivery of
water to farmers' fields as well as better maintenance of the irrigation system resulted in saving
of water. In some cases, WUA prevailed upon ID to release more water. As a result additional
crop area was brought under irrigation, the extent of which varied from association to association
as well as from crop to crop as can be seen from the details provided in chapter III, IV, V and
VI. Table 8.1 gives comparative picture of per respondent irrigated area.
TTTTTababababable 8.1 Ale 8.1 Ale 8.1 Ale 8.1 Ale 8.1 A veraveraveraveravera ggggge Irrigated Area Pe Irrigated Area Pe Irrigated Area Pe Irrigated Area Pe Irrigated Area P er Respondenter Respondenter Respondenter Respondenter Respondent
BeforeBeforeBeforeBeforeBefore AfterAfterAfterAfterAfter
MembersMembersMembersMembersMembers NonNonNonNonNon MembersMembersMembersMembersMembers NonNonNonNonNonMembersMembersMembersMembersMembers MembersMembersMembersMembersMembers
BiharBiharBiharBiharBihar i ) Paliganj 2.1 3.43 2.20 3.43
ii) Assarganj 1.75 1.25 1.81 1.29
iii) Vaishali 0.00 1.26 1.54 1.51
GujaratGujaratGujaratGujaratGujarat i) Mohini 2.28 3.43 3.93 3.43
ii)Karjan 2.44 1.20 2.44 1.43
iii) Baldeva 5.41 5.20 5.0 5.20
iv) Lakhigam 1.11 0.00 1.11 2.29
MaharashtraMaharashtraMaharashtraMaharashtraMaharashtra i ) Palkhed 1.44 1.25 2.17 1.41
ii)Parunde 0.71 0.70 0.78 0.86
i i i ) Loni 1.67 2.78 0.49 2.76
TTTTTamilnaduamilnaduamilnaduamilnaduamilnadu i ) Thindal 3.85 1.76 4.85 1.76
i i ) North Kodai 3.08 1.13 3.29 1.32
iii) Anaikuppam 9.89 5.75 10.68 5.75
Number of Beneficiaries
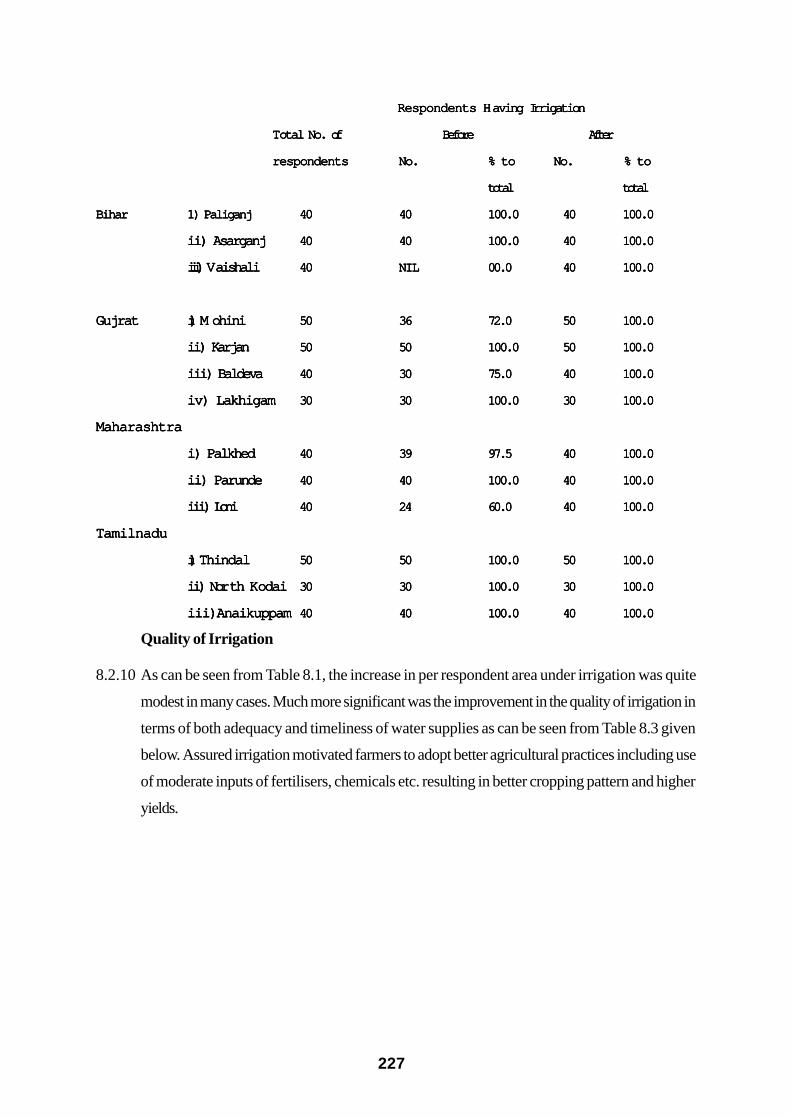
8.2.9 Increase availability of water due to saving of water and increased supply enabled larger number
of farmers to avail the benefit of irrigation. Another reason for increase in number of beneficiaries
was the policy of more equitable distribution of water adopted by most of WUAs either through
amendment of water distribution rules as in Maharashtra or in Anaikuppam in
Tamilnadu or through decisions of the managing committee. Table 8.2 gives data on this aspect.
TTTTTababababable 8.2 Ple 8.2 Ple 8.2 Ple 8.2 Ple 8.2 P ererererer centacentacentacentacenta ggggge of Respondents Hae of Respondents Hae of Respondents Hae of Respondents Hae of Respondents Ha ving Irrigationving Irrigationving Irrigationving Irrigationving Irrigation
226
Respondents Respondents Respondents Respondents Respondents HHHHHaving aving aving aving aving IIIIIrrigationrrigationrrigationrrigationrrigation
TTTTTotal No.otal No.otal No.otal No.otal No. of of of of of Before Before Before Before Before After After After After After
respondentsrespondentsrespondentsrespondentsrespondents No.No.No.No.No. % to% to% to% to% to No.No.No.No.No. % to% to% to% to% to
totaltotaltotaltotaltotal totaltotaltotaltotaltotal
BiharBiharBiharBiharBihar 1) Paliganj1) Paliganj1) Paliganj1) Paliganj1) Paliganj 4040404040 4040404040 100.0100.0100.0100.0100.0 4040404040 100.0100.0100.0100.0100.0
ii) Asarganjii) Asarganjii) Asarganjii) Asarganjii) Asarganj 4040404040 4040404040 100.0100.0100.0100.0100.0 4040404040 100.0100.0100.0100.0100.0
iii) iii) iii) iii) iii) VVVVVaishaliaishaliaishaliaishaliaishali 4040404040 NILNILNILNILNIL 00.000.000.000.000.0 4040404040 100.0100.0100.0100.0100.0
GujratGujratGujratGujratGujrat i) i) i) i) i) MMMMMohiniohiniohiniohiniohini 5050505050 3636363636 72.072.072.072.072.0 5050505050 100.0100.0100.0100.0100.0
ii) Karjanii) Karjanii) Karjanii) Karjanii) Karjan 5050505050 5050505050 100.0100.0100.0100.0100.0 5050505050 100.0100.0100.0100.0100.0
iii) Baldevaiii) Baldevaiii) Baldevaiii) Baldevaiii) Baldeva 4040404040 3030303030 75.075.075.075.075.0 4040404040 100.0100.0100.0100.0100.0
iv) Lakhigamiv) Lakhigamiv) Lakhigamiv) Lakhigamiv) Lakhigam 3030303030 3030303030 100.0100.0100.0100.0100.0 3030303030 100.0100.0100.0100.0100.0
MaharashtraMaharashtraMaharashtraMaharashtraMaharashtra
i) Palkhedi) Palkhedi) Palkhedi) Palkhedi) Palkhed 4040404040 3939393939 97.597.597.597.597.5 4040404040 100.0100.0100.0100.0100.0
ii) Parundeii) Parundeii) Parundeii) Parundeii) Parunde 4040404040 4040404040 100.0100.0100.0100.0100.0 4040404040 100.0100.0100.0100.0100.0
iii) Loniiii) Loniiii) Loniiii) Loniiii) Loni 4040404040 2424242424 60.060.060.060.060.0 4040404040 100.0100.0100.0100.0100.0
TTTTTamilnaduamilnaduamilnaduamilnaduamilnadu
i) i) i) i) i) ThindalThindalThindalThindalThindal 5050505050 5050505050 100.0100.0100.0100.0100.0 5050505050 100.0100.0100.0100.0100.0
ii) Norii) Norii) Norii) Norii) Nor th Kth Kth Kth Kth K odaiodaiodaiodaiodai 3030303030 3030303030 100.0100.0100.0100.0100.0 3030303030 100.0100.0100.0100.0100.0
iii)Anaikuppamiii)Anaikuppamiii)Anaikuppamiii)Anaikuppamiii)Anaikuppam 4040404040 4040404040 100.0100.0100.0100.0100.0 4040404040 100.0100.0100.0100.0100.0
Quality of Irrigation
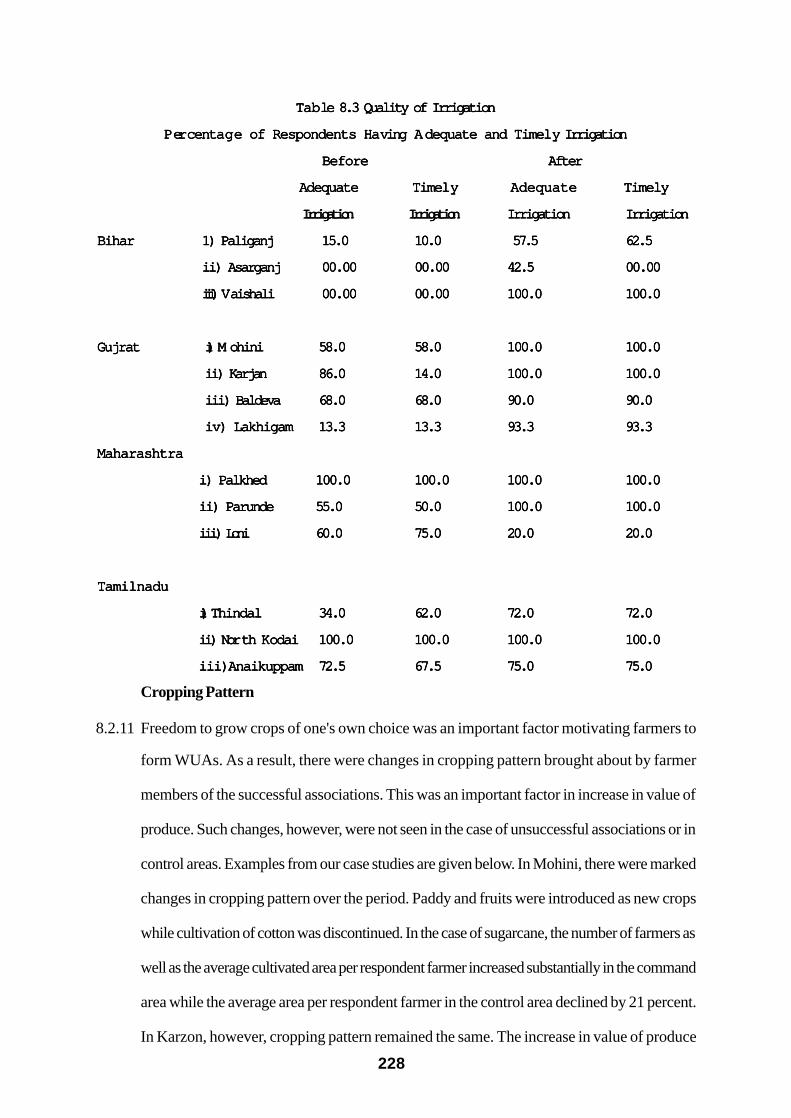
8.2.10 As can be seen from Table 8.1, the increase in per respondent area under irrigation was quite
modest in many cases. Much more significant was the improvement in the quality of irrigation in
terms of both adequacy and timeliness of water supplies as can be seen from Table 8.3 given
below. Assured irrigation motivated farmers to adopt better agricultural practices including use
of moderate inputs of fertilisers, chemicals etc. resulting in better cropping pattern and higher
yields.
227
TTTTTababababable 8.3 Quality of Irrigationle 8.3 Quality of Irrigationle 8.3 Quality of Irrigationle 8.3 Quality of Irrigationle 8.3 Quality of Irrigation
PPPPPererererer centacentacentacentacenta ggggge of Respondents Hae of Respondents Hae of Respondents Hae of Respondents Hae of Respondents Ha ving ving ving ving ving AAAAAdequate and dequate and dequate and dequate and dequate and TimelTimelTimelTimelTimel y Irrigationy Irrigationy Irrigationy Irrigationy Irrigation
BeforeBeforeBeforeBeforeBefore AfterAfterAfterAfterAfter
Adequate Adequate Adequate Adequate Adequate TimelTimelTimelTimelTimel yyyyy AdequateAdequateAdequateAdequateAdequate TimelyTimelyTimelyTimelyTimely
Irrigation Irrigation Irrigation Irrigation Irrigation Irrigation Irrigation Irrigation Irrigation Irrigation IrrigationIrrigationIrrigationIrrigationIrrigation IrrigationIrrigationIrrigationIrrigationIrrigation
BiharBiharBiharBiharBihar 1) Paliganj1) Paliganj1) Paliganj1) Paliganj1) Paliganj 15.015.015.015.015.0 10.010.010.010.010.0 57.5 57.5 57.5 57.5 57.5 62.562.562.562.562.5
ii) Asarganjii) Asarganjii) Asarganjii) Asarganjii) Asarganj 00.0000.0000.0000.0000.00 00.0000.0000.0000.0000.00 42.542.542.542.542.5 00.0000.0000.0000.0000.00
iii) iii) iii) iii) iii) VVVVVaishaliaishaliaishaliaishaliaishali 00.0000.0000.0000.0000.00 00.0000.0000.0000.0000.00 100.0100.0100.0100.0100.0 100.0100.0100.0100.0100.0
GujratGujratGujratGujratGujrat i) i) i) i) i) MMMMMohiniohiniohiniohiniohini 58.058.058.058.058.0 58.058.058.058.058.0 100.0100.0100.0100.0100.0 100.0100.0100.0100.0100.0
ii) Karjanii) Karjanii) Karjanii) Karjanii) Karjan 86.086.086.086.086.0 14.014.014.014.014.0 100.0100.0100.0100.0100.0 100.0100.0100.0100.0100.0
iii) Baldevaiii) Baldevaiii) Baldevaiii) Baldevaiii) Baldeva 68.068.068.068.068.0 68.068.068.068.068.0 90.090.090.090.090.0 90.090.090.090.090.0
iv) Lakhigamiv) Lakhigamiv) Lakhigamiv) Lakhigamiv) Lakhigam 13.313.313.313.313.3 13.313.313.313.313.3 93.393.393.393.393.3 93.393.393.393.393.3
MaharashtraMaharashtraMaharashtraMaharashtraMaharashtra
i) Palkhedi) Palkhedi) Palkhedi) Palkhedi) Palkhed 100.0100.0100.0100.0100.0 100.0100.0100.0100.0100.0 100.0100.0100.0100.0100.0 100.0100.0100.0100.0100.0
ii) Parundeii) Parundeii) Parundeii) Parundeii) Parunde 55.055.055.055.055.0 50.050.050.050.050.0 100.0100.0100.0100.0100.0 100.0100.0100.0100.0100.0
iii) Loniiii) Loniiii) Loniiii) Loniiii) Loni 60.060.060.060.060.0 75.075.075.075.075.0 20.020.020.020.020.0 20.020.020.020.020.0
TTTTTamilnaduamilnaduamilnaduamilnaduamilnadu
i) i) i) i) i) ThindalThindalThindalThindalThindal 34.034.034.034.034.0 62.062.062.062.062.0 72.072.072.072.072.0 72.072.072.072.072.0
ii) Norii) Norii) Norii) Norii) Nor th Kth Kth Kth Kth K odaiodaiodaiodaiodai 100.0100.0100.0100.0100.0 100.0100.0100.0100.0100.0 100.0100.0100.0100.0100.0 100.0100.0100.0100.0100.0
iii)Anaikuppamiii)Anaikuppamiii)Anaikuppamiii)Anaikuppamiii)Anaikuppam 72.572.572.572.572.5 67.567.567.567.567.5 75.075.075.075.075.0 75.075.075.075.075.0
Cropping Pattern
8.2.11 Freedom to grow crops of one's own choice was an important factor motivating farmers to
form WUAs. As a result, there were changes in cropping pattern brought about by farmer
members of the successful associations. This was an important factor in increase in value of
produce. Such changes, however, were not seen in the case of unsuccessful associations or in
control areas. Examples from our case studies are given below. In Mohini, there were marked
changes in cropping pattern over the period. Paddy and fruits were introduced as new crops
while cultivation of cotton was discontinued. In the case of sugarcane, the number of farmers as
well as the average cultivated area per respondent farmer increased substantially in the command
area while the average area per respondent farmer in the control area declined by 21 percent.
In Karzon, however, cropping pattern remained the same. The increase in value of produce
228
was mainly due to increase in per hectare yield. In Baldeva, area under wheat and sugarcane
declined while cotton and arhar were introduced as new crops. But, in control area the cropping
pattern remained the same. In Lakhigam, there was no change in cropping pattern, the increase
in value of produce was mainly due to increase in per hectare yield. Palkhed project area
witnessed substantial changes in cropping pattern after the formation of WUA. Onion. Potato
grape and sugarcane were introduced as new crops at the cost of bajra and wheat, area under
which declined. The substantial increase in value of produce that took place here was contributed
by all the three elements e.g. change in cropping pattern, increase in yield and increase in area
under irrigation. Cropping pattern in the control area, however, remained more or less the
same. And there was not much change in other relevant variables including average value of
produce. Parunde area also witnessed substantial changes in cropping pattern which included
introduction of new crops of onion, potato and rabi vegetables. This happened despite the fact
that the yield of the earlier crops of wheat and gram increased. Cultivation of the new crops
was obviously more profitable by the farmers. Here also, the average value of produce increased
substantially. In the case of all the three Tamilnadu experiments, there were only moderate
changes in cropping pattern without introduction of any new crop. The growth in average value
of produce was also moderate.
Crop Yields
8.2.12 Increased availability of water in terms of adequacy and timeliness alongwith improved
agricultural practices led to rise in crop yields the figures on which are presented in table 8.4
below. The crops grown varied from association to association. Hence a uniform table could
not be made. Instead yield figures important crops of each association have been given. In
some cases a particular crop grown in 'before' period was not grown in 'after' period.
229
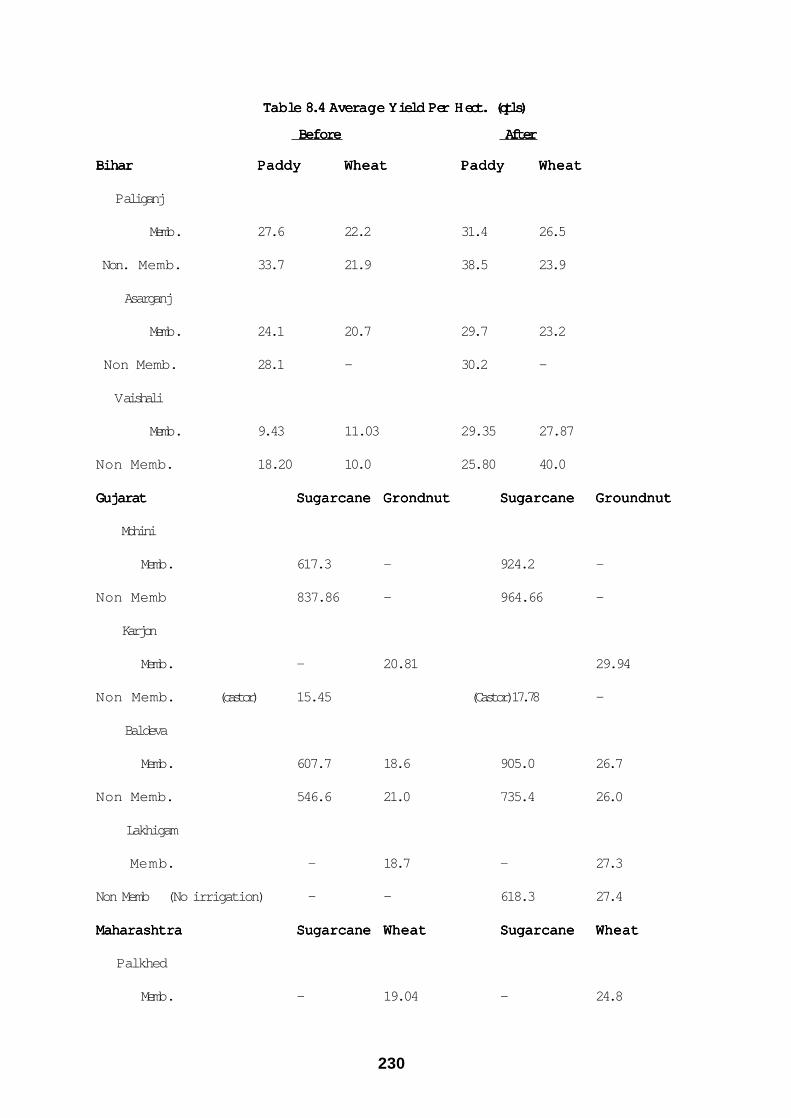
TTTTTababababable 8.4 Ale 8.4 Ale 8.4 Ale 8.4 Ale 8.4 A veraveraveraveravera ggggge e e e e YYYYYield Pield Pield Pield Pield P er er er er er HHHHHect.ect.ect.ect.ect. (qtls) (qtls) (qtls) (qtls) (qtls)
Before Before Before Before Before After After After After After
BiharBiharBiharBiharBihar PaddyPaddyPaddyPaddyPaddy WheatWheatWheatWheatWheat PaddyPaddyPaddyPaddyPaddy WheatWheatWheatWheatWheat
Paliganj
Memb. 27.6 22.2 31.4 26.5
Non. Memb. 33.7 21.9 38.5 23.9
Asarganj
Memb. 24.1 20.7 29.7 23.2
Non Memb. 28.1 – 30.2 –
Vaishali
Memb. 9.43 11.03 29.35 27.87
Non Memb. 18.20 10.0 25.80 40.0
GujaratGujaratGujaratGujaratGujarat SugarcaneSugarcaneSugarcaneSugarcaneSugarcane GrondnutGrondnutGrondnutGrondnutGrondnut SugarcaneSugarcaneSugarcaneSugarcaneSugarcane GroundnutGroundnutGroundnutGroundnutGroundnut
Mohini
Memb. 617.3 – 924.2 –
Non Memb 837.86 – 964.66 –
Karjon
Memb. – 20.81 29.94
Non Memb. (castor) 15.45 (Castor)17.78 –
Baldeva
Memb. 607.7 18.6 905.0 26.7
Non Memb. 546.6 21.0 735.4 26.0
Lakhigam
Memb. – 18.7 – 27.3
Non Memb (No irrigation) – – 618.3 27.4
MaharashtraMaharashtraMaharashtraMaharashtraMaharashtra SugarcaneSugarcaneSugarcaneSugarcaneSugarcane WheatWheatWheatWheatWheat SugarcaneSugarcaneSugarcaneSugarcaneSugarcane WheatWheatWheatWheatWheat
Palkhed
Memb. – 19.04 – 24.8
230
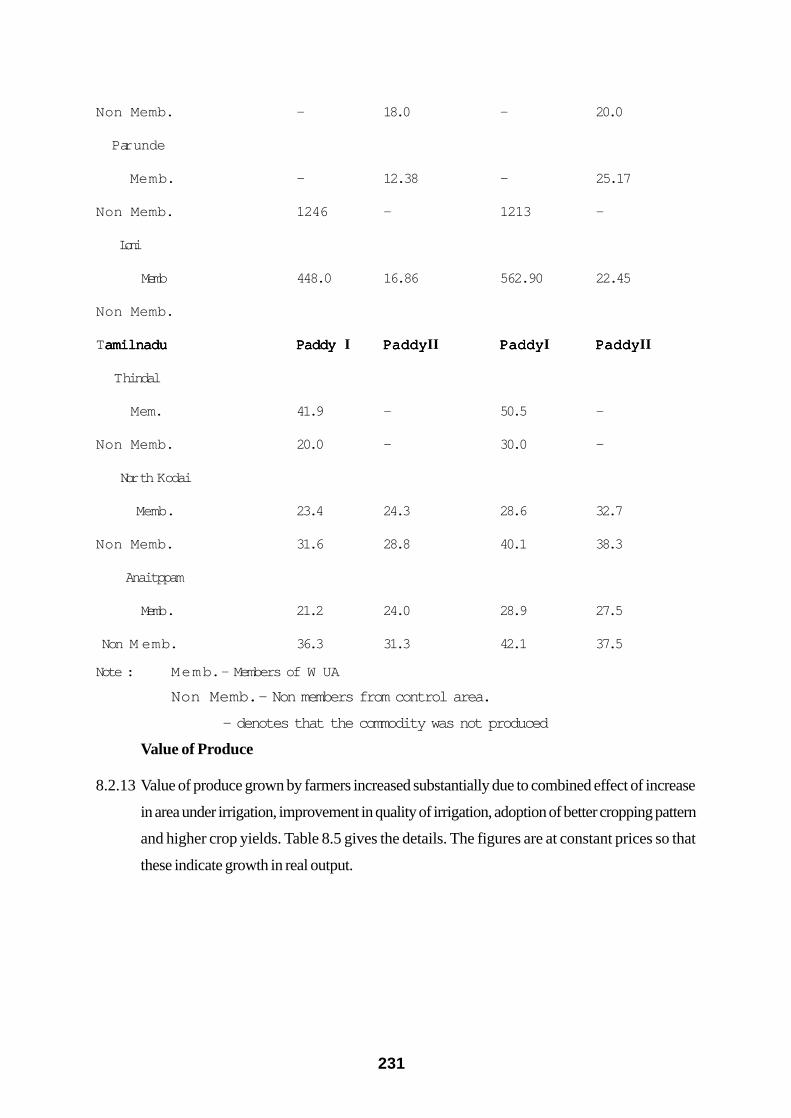
Non Memb. – 18.0 – 20.0
Parunde
Memb. – 12.38 – 25.17
Non Memb. 1246 – 1213 –
Loni
Memb 448.0 16.86 562.90 22.45
Non Memb.
Tamilnaduamilnaduamilnaduamilnaduamilnadu Paddy Paddy Paddy Paddy Paddy I PaddyPaddyPaddyPaddyPaddy II PaddyPaddyPaddyPaddyPaddy I PaddyPaddyPaddyPaddyPaddy II
Thindal
Mem. 41.9 – 50.5 –
Non Memb. 20.0 – 30.0 –
North Kodai
Memb. 23.4 24.3 28.6 32.7
Non Memb. 31.6 28.8 40.1 38.3
Anaitppam
Memb. 21.2 24.0 28.9 27.5
Non M emb. 36.3 31.3 42.1 37.5
Note : Memb. - Members of W UA
Non Memb. - Non members from control area.
- denotes that the commodity was not produced
Value of Produce
8.2.13 Value of produce grown by farmers increased substantially due to combined effect of increase
in area under irrigation, improvement in quality of irrigation, adoption of better cropping pattern
and higher crop yields. Table 8.5 gives the details. The figures are at constant prices so that
these indicate growth in real output.
231
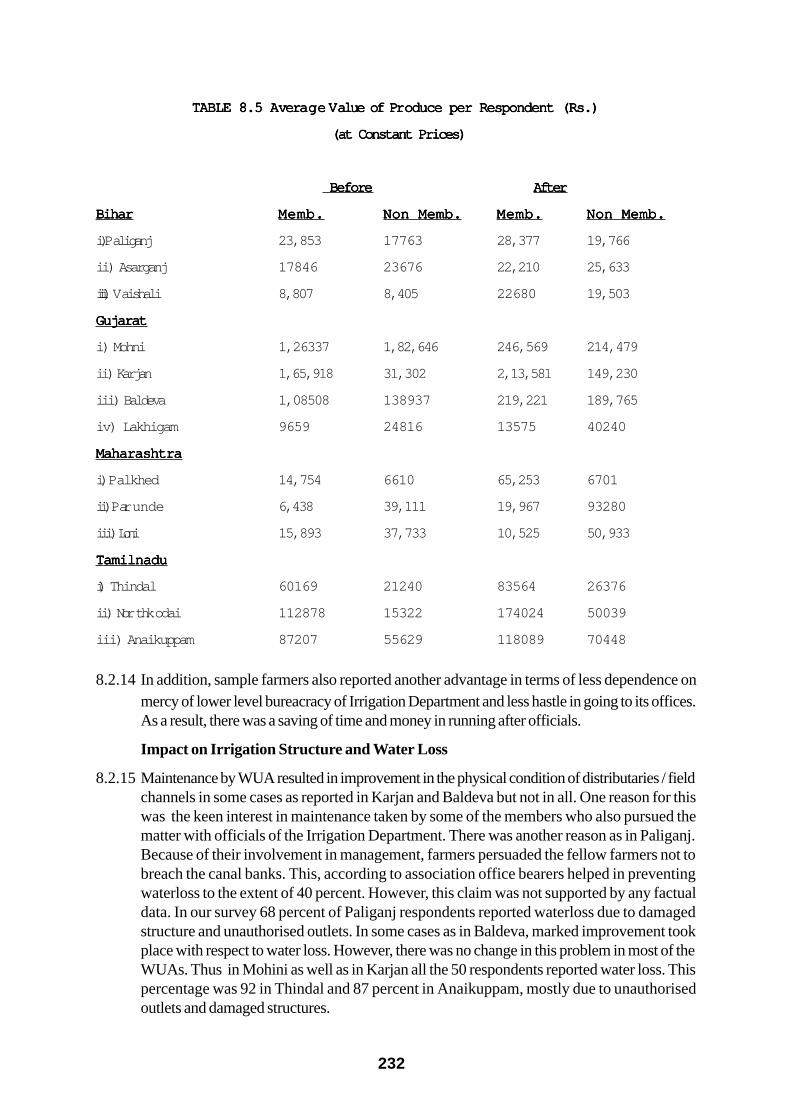
TTTTTABLE 8.5 AABLE 8.5 AABLE 8.5 AABLE 8.5 AABLE 8.5 A veraveraveraveravera ggggge e e e e VVVVValue of Pralue of Pralue of Pralue of Pralue of Pr oduce per Respondent (Rs.)oduce per Respondent (Rs.)oduce per Respondent (Rs.)oduce per Respondent (Rs.)oduce per Respondent (Rs.)
(at Constant Prices) (at Constant Prices) (at Constant Prices) (at Constant Prices) (at Constant Prices)
Before Before Before Before Before AfterAfterAfterAfterAfter
BiharBiharBiharBiharBihar Memb.Memb.Memb.Memb.Memb. Non Memb.Non Memb.Non Memb.Non Memb.Non Memb. Memb.Memb.Memb.Memb.Memb. Non Memb.Non Memb.Non Memb.Non Memb.Non Memb.
i)Paliganj 23,853 17763 28,377 19,766
ii) Asarganj 17846 23676 22,210 25,633
iii) Vaishali 8,807 8,405 22680 19,503
GujaratGujaratGujaratGujaratGujarat
i) Mohni 1,26337 1,82,646 246,569 214,479
ii) Karjan 1,65,918 31,302 2,13,581 149,230
iii) Baldeva 1,08508 138937 219,221 189,765
iv) Lakhigam 9659 24816 13575 40240
MaharashtraMaharashtraMaharashtraMaharashtraMaharashtra
i) Palkhed 14,754 6610 65,253 6701
ii) Parunde 6,438 39,111 19,967 93280
i i i ) Loni 15,893 37,733 10,525 50,933
TTTTTamilnaduamilnaduamilnaduamilnaduamilnadu
i) Thindal 60169 21240 83564 26376
i i ) Northkodai 112878 15322 174024 50039
iii) Anaikuppam 87207 55629 118089 70448
8.2.14 In addition, sample farmers also reported another advantage in terms of less dependence onmercy of lower level bureacracy of Irrigation Department and less hastle in going to its offices.As a result, there was a saving of time and money in running after officials.
Impact on Irrigation Structure and Water Loss
8.2.15Maintenance by WUA resulted in improvement in the physical condition of distributaries / fieldchannels in some cases as reported in Karjan and Baldeva but not in all. One reason for thiswas the keen interest in maintenance taken by some of the members who also pursued thematter with officials of the Irrigation Department. There was another reason as in Paliganj.Because of their involvement in management, farmers persuaded the fellow farmers not tobreach the canal banks. This, according to association office bearers helped in preventingwaterloss to the extent of 40 percent. However, this claim was not supported by any factualdata. In our survey 68 percent of Paliganj respondents reported waterloss due to damagedstructure and unauthorised outlets. In some cases as in Baldeva, marked improvement tookplace with respect to water loss. However, there was no change in this problem in most of theWUAs. Thus in Mohini as well as in Karjan all the 50 respondents reported water loss. Thispercentage was 92 in Thindal and 87 percent in Anaikuppam, mostly due to unauthorisedoutlets and damaged structures.
232