chapter vi v ermitecnology in recycling of distillery...
TRANSCRIPT

Page | 84
CChhaapptteerr VVII
VERMITECNOLOGY IN RECYCLING OF DISTILLERY SLUDGE
OVERVIEW
Heavy metals are one of the prime factor that affects the agro industry polluted
by the distillery sludge, with decreased nutrients they go vain also make them as potent
environmental pollutant. In this study efforts have been taken in a range of sugarcane
distillery sludge treated in bioreactor using three epigenic earthworm Eudrilus
eugeniae, Eisenia fetida and Perionyx excavatus to find out which would best balance
the needs of the distilleries, farmers and the environment. The goal was to find a
treatment option that would exploit the biological resource for the distillery waste
management, produce maximum increases in crop yields for farmers, and have as little
pollution impact on the environment as possible. Results show significant decrease in
the toxic compounds and/or heavy metals such as Zn, Cr, Cu, Mn, Ni, Co, and Cd.
Adding to this detoxification, the nutrient availability of the distillery sludge have
increased largely, permitting us to suggest the technology in distillery bio-recycling
treatment process. So as the farmers would be benefited to greater extent on the one
hand and on another, the environmental pollution can be controlled significantly.
INTRODUCTION
As industrialization is inevitable and progress with rapid acceleration, the need
for innovative ways to get rid of waste has increased. Recent advancement in
bioresource technology paves novel ideas for recycling of factory waste that been
polluting the agro industry, soil and water bodies. This can be turned into a valuable
resource that can facilitate farmers improve their productivity (Selladurai et al., 2010).
Distillery units in India are in a considerable number, where molasses and impure
alcohol are still being used as raw materials for production of liquor. The wastewater or
spillage products from such distilleries contain huge quantity of dissolved organic
matter, heavy metals, dyes etc., along with other pollutants. These discharge into water
bodies, sombre the aquatic life in consonance with decrease in the quality of water and
irrigation land (Morin and Payot, 2006). Sugarcane is one of the most common raw

CHAPTER-I Introduction
Page | 85
materials used in sugar industry and ethanol production. More than 30 billion litters of
spent wash are generated annually by 254 cane molasses-based distilleries in India
alone (0.2 to 1.8 m3 of wastewater per ton of sugarcane produced (Mukeshand Anil,
2005). As per the Central Pollution Control Board, Ministry of Environment and
Forests (MoEF), Government of India, alcohol distilleries are listed at the top of “Red
Category” industries having a high polluting potential. The industry generates large
volumes of spent–wash with high BOD (45,000–60,000 mg/L) and COD (80,000–
120,000 mg/L) (CPCB, 2003; TERI, 2003). This poses a serious pollution threat; thus it
is mandatory for distilleries to respond appropriately and obligatory for an
environmentalist to suggest appropriate technology. This huge quantity of effluent
enters lagoons where it is aerated to reduce the Biological Oxygen Demand (BOD) and
afterward the effluent is used for land irrigation. The solid particles settle in the lagoons
to form a sludge that can be used as biofertilizer because of its nutritive value.
However, prior to application the waste must be processed properly using a composting
method. Earlier, studies revealed that Vermicomposting could be an appropriate
technology to transfer energy rich organic wastes in to value-added products, i.e.,
vermicompost (Kale 1998; Elvira et al., 1998; Suthar 2006a). Seenapa et al.(1995)
demonstrated that Eudrilus eugeniae can breakdown the waste generated from
distilleries when mixed with other potting materials. They recorded appreciable results
during Vermicomposting of distillery sludge mixed with press mud, water hyacinth,
plant litter, and cow dung in different proportions. The treatment consisting of three
parts of distillery sludge and cow dung along with 1 part of pressmud, water hyacinth
and plant litter showed the maximum earthworm biomass production as compare to the
others. Distillery sludge contains a high concentration of essential plant metabolites e.g.
NPK and micronutrients. Due to excellent nutritive value it, can be used as soil
conditioner after processing through appropriate biotechnological devices.
In the study we examine to the suitability of a composting earthworm species
i.e. E.eugeniae, E. fetida and P. excavatus for recycling distillery sludge mixed with
(cow dung) in different ratios, to produce a value-added product (vermicompost).
Vermicompost could be than used for sustainable land restoration practices on plant
growth.

CHAPTER-I Introduction
Page | 86
MATERIALS AND METHODS
Collection and processing of worms, Preparation of Compost, Determination of
LC50, Casting, Macro & Micronutrient Analysis, Identification, and Biochemical
characterization of microbes in gut region of earthworm were performed as described
previously in Chapter IV.
RESULTS AND DISCUSSION
The LC50 was determined by the wide dosage and found the sludge to be lethal
at the concentration between 55 and 60, and further narrow down of dosage the worm’s
shows high mortality rate at for 60% for E. eugeniae, 55% E. fetida , and 50 for
P. excavatus respectively (Table 6.1; Fig 6.1)
Table 6.1 Determination of LC50 for E. eugeniae, E. fetida and P.excavatus at various dosages for distillery sludge before treatment
Dosage-Mortality (%) S.No
No. of Worms E. eugeniae E. fetida P. excavatus
1 10 66 60 55
2 10 65 58 52
3 10 64 57 50(50%)
4 10 62 55(50%) 48
5 10 60 (50%) 53 46
Physico-Chemical Changes in Bioreactors
The pH of the final product was lower in all treatment samples of E. eugeniae
than their initial values. The reduction in pH was between the ranges of 7.55± 0.15 for
E. eugeniae, 7.49±0.35 for E. fetida and 7.61± 0.24 P. excavatus (Table 6.4; Fig.6.2)
after treatment whereas the pH of the control ranges from 8.21± 0.03 (Table 6.4) this
decrease is considered statistically significant. The shift in pH during the study could be
due to production of CO2 and organic acids microbial decomposition during
vermicomposting and is favourable for the use of recycled water in agricultural field
since the increase in the pH induces the alkaline stress in the plants resulting decrease
in production. Hence, this significant decrease was considered a positive outcome.

CHAPTER-I Introduction
Page | 87
TOC was lower after treatment in with E. eugeniae, E. fetida and P. excavatus
(Table 6.4) when compared to the initial level in the DS (Table 6.4; Fig.6.3). This
major lower shift is due to the utilization of the organic carbon by earthworm
additionally this organic carbon act as the carbon source for the microbial population
present in the bioreactor. Dominguez points out that vermicomposting process involve
active participation of earthworm and microbes (Dominguez, 2004). The earthworm
disintegrates, homogenizes the ingested material through foregut muscular action,
supplement mucus and enzyme rich environment. This provides increased surface area
for microbial action and the microorganisms perform the biochemical degradation. The
microbial action would be absolute in the extracellular enzymatic environment of
earthworms. This biological mutuality is suggested to cause TOC loss in the form of
CO2 from the municipal sludge during the decomposition and mineralization of organic
waste (Suthar, 2007).
Total N (TN) was significantly higher in the (Table 6.4) bioreactors
inoculated with E. eugeniae than E. fetida and P. excavatus (Table 6.3 and Fig 6.2) It
is suggested that earthworms enhance nitrogen levels by accumulating excretory
products, mucus release, body fluids, and other biological fluids rich in nitrogen.
Decaying tissues of dead worms is yet another factor for this improvement of N value
in significance. After treatment, in all the bioreactors inoculated with E. eugeniae,
E. fetida and P. excavatus presented higher concentrations of TP than the DS (Table
6.4).The difference between control and experimental value was statistically
significant. The increases in the concentration of TP after treatment may be due to the
action of gut phosphatise enzymes of the earthworm. After ingestion the bound
phosphorus are subjected to the action of phosphatise enzymes in the gut, thereby
releasing the available phosphorus and enriches the soil nutrient. The status of Ca
(TCa) and Mg (TMg) was raised significantly in the bioreactors inoculated with
E. eugeniae, E. fetida and P. excavatus (Table 6.4) after treatment completion. This
study agrees with previous reports stating a significant increase in the level of Ca, and
Mg after the completion of vermicomposting (Simard, 1993). It is a known fact that
earthworm plays critical role in conversion of plant metabolites into available forms,
which is further subjected to microbial disintegration and recycling allied with their
casts (Dominguez, 2004). Overall comparisons of the treated bioreactor suggest the

CHAPTER-I Introduction
Page | 88
inoculation of E. eugeniae produces superior result than E. fetida and P. excavatus in
the physiochemical parameter improvement.
Heavy Metal Dynamics in Bioreactors: The concentration of heavy metals was
lower in vermicomposted material as compared to the initial concentration
(Table6.5).The bioreactor inoculated with the E. eugeniae, E. fetida and P. excavatus
showed the decrease (2.58± 0.12, 2.53±0.21 and 2.53± 0.13) in the level of zinc.
Among all the species E. eugeniae act significantly in decreasing the level of metals
such as Zn, Cu, Fe, Mn, Cr, Ni, Co and Cd (Table 6.5; Fig 6.4). This study is
accordance with previous workers who reported a significant decrease in the level of
heavy metals, after the completion of vermicomposting process. Although metal
concentration varied in terms of both effluent and treated in bioreactor, the
vermicompost was efficient in the treatment of the distillery waste. Lamim et al. (1998)
reported the effects of the time on adsorption of various metals by vermicomposts.
This decrease in the heavy metal toxicity relief the metal stress to the plant
thereby providing a feasible solution to use them in agro industry.Previous report also
states that the heavy metals decreases drastically during vermicomposting processes
(Jordao et al., 2002). In vermicomposting sub-system, the loss of carbon as carbon
dioxide due to respiratory activities of earthworms and associated micro flora, and
simultaneously adding of nitrogen in substrate material by inoculated earthworms
(through. production of mucus, enzymes and nitrogenous excrements) lowers the C:N
ratio of the substrate (Mortvedt et al., 1991). Adding high concentrations of phenol,
heavy metals and significant concentrations of N, P and K were present in the sludge
versus substrate. It has previously stated that the soil amended by 10% of distillery
sludge (w/w) might be used as a fertilizer, whereas high concentration of distillery
effluent is harmful for plants and soil (Chandra et al., 2008). A risk assessment of toxic
metals present in the edible parts of the plant, grown in the distillery sludge-amended
soil, is required as the animals and general populations are consuming these.
Microbial dynamics
Earthworms feed selectively on material rich in organic matter, such as organic
polymers(or breakdown products thereof) derived from plants, protozoa, fungi, and
bacteria (Brown and Doube, 2004; Edwards and Fletcher, 1988). Ingested protozoans

CHAPTER-I Introduction
Page | 89
are required for maturation of certain earthworm species and are digested in the crop,
gizzard, and fore gut (Bonkowski and Schaefer, 1997; Kristufek et al., 1994;
Miles1963; Piearce and Philips, 1980). Digestion of large ingested bacteria may also
occur during gut passage (Brown and Doube2004; Clegg, 1995; Kristufek et al., 1994).
Schonholzer et al., 2002), although total and culture-dependent bacterial counts tend to
increase (Fischer et al.,1994; Kristufek et al., 1992; Parle, 1963; Pedersen and
Hendriksen, 1993; Sconholzer, 2002; Wolter and Scheu, 1999). Thus, there is evidence
that ingested microorganisms with high cell volumes are preferentially disrupted in the
gizzard. The alimentary canals of L. terrestris and E. fetida are perhaps the most
thoroughly described earthworm digestive systems (Breidenbach, 2002; Brown and
Doube, 2004; Edward and Bohlen, 1996; Edwards and Fletcher, 1988; Kukenthal and
Renner, 1982; Laverack, 1963; Tillinghast et al., 2001; Van Gansen, 1963). Ingested
material, which is usually a mixture of organic material and soil, enters the alimentary
canal via the mouth, is transferred. sequentially to the esophagus, crop, gizzard,
intestine, and finally leaves the worm via the anus Salivary glands in the pharynx
amend ingested soil/litter with amylase- and protease- containing mucus that aids in the
movement of coarse, dry material through the alimentary canal. Calciferous glands in
the esophagus secrete mucus that contains calcium carbonate, enabling the worm to
expel excess calcium andcarbonate and to regulate the pH of gut and coelom fluids. A
chitinous membrane (called a peritrophic membrane) (Arthur, 1963; Breidenbach,
2002) that lines the alimentary canal from the crop to the end of the midgut region has
both protective and digestive functions. This membrane contains digestive enzymes
that are released into the gut lumen when abraded by ingested material as it passes
through the alimentary canal. The gizzard is a muscular, cuticula-lined grinder that
triturates ingested material. Digestive enzymes (e.g., lipases, chitinases and cellulases)
are secreted into the intestine by both the worm and ingested microorganisms (Urbasek
and Pizl, 1991). The intestinal mucus that is secreted in large quantities into the foregut
contains water-soluble organic carbon that can be readily degraded by microbes
(Lavelle et al.,1995; Martin et al., 1987; Trigo et al., 1999). Digested microbial biomass
yields forms of organic carbon that can be utilized by the earthworm. Microbial
population in the gut of earthworm’s E. eugeniae, E. fetida and P. excavatus cultured
in different substrates for two weeks.The total microbial population in foregut, midgut
and hindgut of E.fetida showed increase when analyses at the end of experiment 14th
day over the microbial load recorded (CFU x 105g-1 control 43, 48 and 68 to 49, 70 and

CHAPTER-I Introduction
Page | 90
79 for treated sludge) in the gut at the time of introduction (initial to final i.e., 0-14th
day). The bacterial population of 48, 67and 73 CFU x 105g-1 (control) was recorded
respectively in foregut, midgut, and hindgut of E .eugeniae cultured in distillery
sample. The population of bacteria were observed in the foregut, midgut and hindgut
region of E. eugeniae collected at the end of experiment (after,14thdays) were 66 CFU x
106g-1, 81 CFU x 103g-1 and 89 CFU x 104g-1 respectively. Finally, the earthworm’s
P. excavatus enumeration the bacterial population was CFUx105g-1 46, 53 and 66 to 58,
67 and 73 for after treated sludge. Aseptically foregut, midgut and hindgut segments
shows a great variation in the microbial diversity and new species have been introduced
into the gut region were also reflected in the biochemical tests and characterization
were tabulated E. eugeniae, E. fetida and P. excavatus consist of, various pathogens
like Salmonella, Shigella and faecal coliforms in the gut region. In addition to these
bacteria Bacillus, Streptococcus, Pseudomonas, Staphylococcus aures, Micrococcus,
Escherichia coli and Klebsilla sp were found in the distillery sludge treated worm gut
after two weeks(Table 6.6, 6.7, 6.8 and chapter VIII-Table 8.9).

CHAPTER-I Introduction
Page | 91
Table 6.2 Macro Nutrient Analysis of Distillery Sludge before and after treatment using selected earthworms
Control E. eugeniae Collection Points
CP1 CP2 CP3 CP4 CP5 CP6 Mean SD CP1 CP2 CP3 CP4 CP5 CP6 Mean SD
pH 8.21 8.18 8.24 8.17 8.21 8.23 8.21 0.03 7.82 7.62 7.56 7.40 7.42 7.51 7.55 0.15
TOC 271.4 289.6 258.3 297.6 318.1 283.1 286.34 20.81 231.2 227.6 256.5 239.2 262.2 271.3 247.95 17.79
TN 5.73 5.63 5.91 6.02 6.31 5.86 5.91 0.24 6.32 6.02 6.36 7.08 6.83 6.71 6.55 0.39
C:N 33.03 34.06 33.07 36.06 33.81 33.29 33.89 1.14 23.03 24.26 24.45 21.70 23.09 24.22 23.42 1.03
TP 9.76 7.79 8.69 9.71 9.68 9.18 9.14 0.78 19.76 18.26 17.88 26.82 26.61 27.09 22.72 4.53
TK 7.1 7.18 7.16 7.19 7.13 7.13 7.15 0.03 7.20 8.99 9.82 5.84 7.18 6.06 7.52 1.59
TCa 33.08 3.08 36.51 33.81 37.41 33.51 29.57 13.09 45.04 43.14 30.9 25.32 39.1 37.6 36.86 7.49
TMg 20.31 20.11 19.81 19.33 18.33 19.76 19.61 0.71 22.38 32.74 36.53 35.88 35.65 39.00 33.70 5.90
E. fetida P. excavatus Collection
Points CP1 CP2 CP3 CP4 CP5 CP6 Mean SD CP1 CP2 CP3 CP4 CP5 CP6 Mean SD
pH 7.89 7.02 7.81 7.18 7.39 7.66 7.49 0.35 7.69 7.82 7.50 7.32 7.39 7.91 7.61 0.24
TOC 245.6 241.2 259.1 271.7 259.1 276.6 258.89 13.91 238.1 359.6 271.1 269.2 253.9 263.0 275.83 42.79
TN 5.81 5.42 4.99 5.32 6.22 6.71 5.75 0.64 4.32 5.06 5.82 4.69 4.73 4.36 4.83 0.56
C:N 30.03 32.41 30.36 32.58 29.13 28.59 30.52 1.66 30.03 33.02 32.91 33.92 33.06 33.1 32.67 1.34
TP 9.01 17.02 15.81 23.66 21.32 25.08 18.65 5.95 16.05 17.01 19.53 18.03 17.06 19.01 17.78 1.32
TK 6.93 6.38 6.91 6.31 7.81 7.53 6.98 0.60 6.81 5.93 6.54 6.32 6.11 6.82 6.42 0.37
TCa 38.92 37.38 31.81 30.71 35.11 26.32 33.38 4.67 39.11 37.56 38.31 31.03 36.01 37.1 44.85 20.37
TMg 31.38 35.41 45.53 44.23 45.11 39.51 40.20 5.83 30.94 33.81 30.19 30.63 36.11 33.9 32.60 2.37

CHAPTER-I Introduction
Page | 92
Table 6.3 Micro Nutrient Analysis of Distillery Sludge before and after treatment using selected earthworms
Control E. eugeniae
Collection Points
CP1 CP2 CP3 CP4 CP5 CP6 Mean SD CP1 CP2 CP3 CP4 CP5 CP6 Mean SD
Zn 2.92 2.87 2.2 2.9 2.68 2.18 2.63 0.35 2.74 2.54 2.53 2.67 2.41 2.58 2.58 0.12
Cu 1.66 1.9 1.94 1.53 1.78 1.98 1.80 0.18 1.26 1.2 1.24 1.23 1.26 1.25 1.24 0.02
Fe 21.2 18.8 17.2 18.7 18.6 19.6 19.03 1.31 16.3 15.3 16.2 16.7 16.2 16.7 16.25 0.50
Mn 5.28 4.82 4.72 5.42 5.31 5.61 5.19 0.35 4.28 4.18 4.32 4.52 4.67 4.76 4.46 0.23
Cr 0.29 0.47 0.68 0.83 0.63 0.53 0.57 0.19 0.24 0.23 0.51 0.54 0.61 0.63 0.46 0.18
Ni 0.27 0.26 0.25 0.29 0.28 0.68 0.34 0.17 0.16 0.17 0.18 0.15 0.19 0.14 0.17 0.02
Co 0.84 0.77 0.75 0.79 0.56 0.54 0.71 0.13 0.22 0.25 0.26 0.28 0.21 0.27 0.25 0.03
Cd 0.39 0.3 0.29 0.49 0.41 0.41 0.38 0.08 0.17 0.13 0.11 0.17 0.18 0.19 0.16 0.03
E. fetida P. excavatus
Collection Points
CP1 CP2 CP3 CP4 CP5 CP6 Mean SD CP1 CP2 CP3 CP4 CP5 CP6 Mean SD
Zn 2.83 2.61 2.14 2.51 2.49 2.62 2.53 0.21 2.36 2.68 2.48 2.49 2.48 2.69 2.53 0.13
Cu 1.53 1.28 1.21 1.28 1.23 1.25 1.29 0.11 1.59 1.28 1.31 1.29 1.35 1.71 1.42 0.18
Fe 17.1 15.8 16.3 19.4 18.2 17.7 17.35 1.09 18.2 16.1 19.2 15.7 16.8 17.2 17.21 1.31
Mn 4.18 4.92 3.08 3.99 4.38 3.97 4.09 0.55 4.96 4.42 4.02 4.06 4.81 4.09 4.39 0.41
Cr 0.29 0.26 0.23 0.61 0.68 0.62 0.45 0.19 0.29 0.28 0.26 0.61 0.58 0.51 0.42 0.16
Ni 0.18 0.19 0.21 0.61 0.16 0.15 0.25 0.16 0.19 0.21 0.17 0.31 0.21 0.28 0.23 0.05
Co 0.26 0.24 0.28 0.18 0.21 0.24 0.24 0.03 0.28 0.26 0.21 0.31 0.61 0.28 0.33 0.14
Cd 0.18 0.17 0.19 0.21 0.19 0.20 0.19 0.01 0.21 0.21 0.19 0.17 0.37 0.16 0.22 0.08
CHAPTER-I Introduction
Page | 93
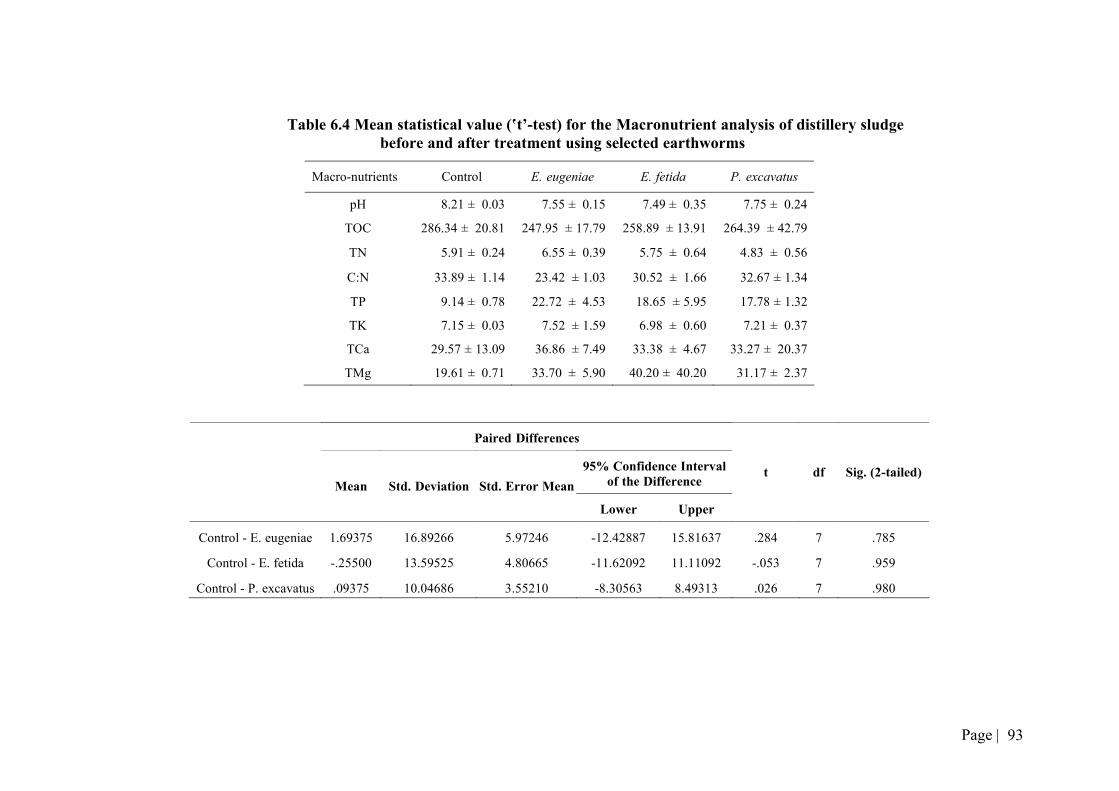
Table 6.4 Mean statistical value (‛t’-test) for the Macronutrient analysis of distillery sludge before and after treatment using selected earthworms
Macro-nutrients Control E. eugeniae E. fetida P. excavatus
pH 8.21 ± 0.03 7.55 ± 0.15 7.49 ± 0.35 7.75 ± 0.24
TOC 286.34 ± 20.81 247.95 ± 17.79 258.89 ± 13.91 264.39 ± 42.79
TN 5.91 ± 0.24 6.55 ± 0.39 5.75 ± 0.64 4.83 ± 0.56
C:N 33.89 ± 1.14 23.42 ± 1.03 30.52 ± 1.66 32.67 ± 1.34
TP 9.14 ± 0.78 22.72 ± 4.53 18.65 ± 5.95 17.78 ± 1.32
TK 7.15 ± 0.03 7.52 ± 1.59 6.98 ± 0.60 7.21 ± 0.37
TCa 29.57 ± 13.09 36.86 ± 7.49 33.38 ± 4.67 33.27 ± 20.37
TMg 19.61 ± 0.71 33.70 ± 5.90 40.20 ± 40.20 31.17 ± 2.37
Paired Differences
95% Confidence Interval of the Difference
Mean Std. Deviation Std. Error Mean
Lower Upper
t df Sig. (2-tailed)
Control - E. eugeniae 1.69375 16.89266 5.97246 -12.42887 15.81637 .284 7 .785
Control - E. fetida -.25500 13.59525 4.80665 -11.62092 11.11092 -.053 7 .959
Control - P. excavatus .09375 10.04686 3.55210 -8.30563 8.49313 .026 7 .980

CHAPTER-I Introduction
Page | 94
Table 6.5 Mean statistical value (‛t’-test) for the Micronutrient analysis of distillerysludge before and after treatment using selected earthworms
Micro-Nutrients Control E. eugeniae E. fetida P.excavatus
Zn 2.63 ± 0.35 2.58 ± 0.12 2.53 ± 0.21 2.53 ± 0.13
Cu 1.80 ± 0.18 1.24 ± 0.02 1.29 ± 0.11 1.42 ± 0.18
Mn 5.19 ± 0.35 4.46 ± 0.23 4.09 ± 0.55 4.39 ± 0.41
Cr 0.57 ± 0.19 0.46 ± 0.18 0.45 ± 0.19 0.42 ± 0.16
Ni 0.34 ± 0.17 0.17 ± 0.02 0.25 ± 0.16 0.23 ± 0.05
Co 0.71 ± 0.13 0.25 ± 0.03 0.24 ± 0.03 0.33 ± 0.14
Cd 0.38 ± 0.08 0.16 ± 0.03 0.19 ± 0.01 0.22 ± 0.08
Paired Differences
95% Confidence Interval of the Difference
Mean Std. Deviation Std. Error Mean
Lower Upper
t df Sig. (2-tailed)
Control - E. eugeniae -1.47375 5.10326 1.80427 -5.74018 2.79268 -.817 7 .441
Control - E. fetida -2.25125 7.41777 2.62258 -8.45266 3.95016 -.858 7 .419
Control - P. excavatus -1.18500 4.19862 1.48444 -4.69513 2.32513 -.798 7 .451
Since, ‘t’calculated value is less than the‘t’ tabulated value; we have no evidence to reject our null hypothesis (i.e) Comparing the values of
Macro, Micro nutrients and Heavy metal reduction with control and the three species of earthworms, E.eugeniae appears to be most suitable for the treatment of distillery sludge using Vermitechnology

CHAPTER-I Introduction
Page | 95
Table 6.6 Biochemical Characteristics and identification of dominant colonies of microbes found in the gut region of earthworms
Eudrilus eugeniae introduced in distillery sludge
Inte
stin
al p
art
G
ram
Sta
in
Gel
atin
li
qu
efic
atio
n
Star
ch
hyd
roly
sis
Lip
id h
ydro
lysi
s
Lac
tose
Dex
tros
e
Sucr
ose
H2S
Pro
duct
ion
Nit
rate
re
duc
tion
Indo
le
prod
ucti
on
MR
rea
ctio
n
VP
rea
ctio
n
Cit
rate
use
Ure
ase
acti
vity
Cat
alas
e ac
tivi
ty
Oxi
dase
act
ivit
y
Mic
robe
s
FG Rod
- - - - AG AG
A ±
- + + + - - - + - Escherichia coli
FG Rod
- + - + - - - - + - - - + - + + Pseudomonas aeruginosa
FG Coccus
+ - - - A A A - - - + - - - - - Streptococcus lactis
MG Rod
+ + + + - A A - + - - ± - - - + Bacillus subtilis
MG Coccus
+ + - + A A A - + - + ± - - + - Staphylococcus lactis
MG Rod
+ + + + - A A - + - - ± - - - + Bacillus cereus
HG Rod
- - - - AG AG
AG ±
- + - - + + - + - Enterobacter aerogenes
HG Rod
- - - - AG AG
AG
- + - - ± + + + - Klebsilella pneumoniae
HG Rod
- - - - AG AG
A ±
- + + + - - - + - Escherichia coli
HG Rod
- + - + - - - - + - - - + - + + Pseudomonas aeruginosa

CHAPTER-I Introduction
Page | 96
Table 6.7 Biochemical Characteristics and identification of dominant colonies of microbes found in the gut region of earthworms Eisenia fetida introduced in distillery sludge
In
test
inal
par
t
G
ram
Sta
in
Gel
atin
li
quef
icat
ion
Star
ch h
ydro
lysi
s
Lip
id h
ydro
lysi
s
Lac
tose
Dex
tros
e
Sucr
ose
H2S
Pro
duct
ion
Nit
rate
red
ucti
on
Indo
le p
rodu
ctio
n
MR
rea
ctio
n
VP
rea
ctio
n
Cit
rate
use
Ure
ase
acti
vity
Cat
alas
e ac
tivi
ty
Oxi
dase
act
ivit
y
Mic
robe
s
FG Cocci
+ + - - - - - - ± - - - + + - - Micrococcus luteus
FG Cocci
+ + - - - - - - ± - - - + + - - Micrococcus luteus
FG Coccus
+ - - - A A A - - - + - - - - - Streptococcus lactis
MG Rod
- - - - AG AG
A ±
- + + + - - - + - Escherichia coli
MG Coccus
+ - - - A A A - - - + - - - - - Streptococcus lactis
MG Rod
- + - + - - - - + - - - + - + + Pseudomonas aeruginosa
MG Coccus
+ - - - A A A - - - + - - - - - Streptococcus lactis
HG Rod
- - - - AG AG
AG
- + - - ± + + + - Klebsilella pneumoniae
HG Rod
+ + + + - A A - + - - ± - - - + Bacillus subtilis
HG Rod
- - - - AG AG
AG ±
- + - - + + - + - Enterobacter aerogenes
HG Rod
- + - + - - - - + - - - + - + + Pseudomonas aeruginosa
HG Cocci
+ + - - - - - - ± - - - + + - - Micrococcus luteus

CHAPTER-I Introduction
Page | 97
Table 6.8 Biochemical Characteristics and identification of dominant colonies of microbes found in the gut region of earthworms Perionyx excavatus introduced in distillery sludge
Inte
stin
al p
art
G
ram
Sta
in
Gel
atin
liqu
efic
atio
n
Star
ch h
ydro
lysi
s
Lip
id h
ydro
lysi
s
Lac
tose
Dex
tros
e
Sucr
ose
H2S
Pro
duct
ion
Nit
rate
red
ucti
on
Indo
le p
rodu
ctio
n
MR
rea
ctio
n
VP
rea
ctio
n
Cit
rate
use
Ure
ase
acti
vity
Cat
alas
e ac
tivi
ty
Oxi
dase
act
ivit
y
Mic
robe
s
FG Cocci
+ + - - - - - - ± - - - + + - - Micrococcus luteus
MG Rod
+ + + + - A A - + - - ± - - - + Bacillus subtilis
MG Coccus
+ - - - A A A - - - + - - - - - Streptococcus lactis
HG Rod
- - - - AG AG
AG ±
- + - - + + - + - Enterobacter aerogenes
HG Rod
- - - - AG AG
AG
- + - - ± + + + - Klebsilella pneumoniae
HG Rod
- + - + - - - - + - - - + - + + Pseudomonas aeruginosa

Fig. 6.1 Determination of LC50 for E.eugeniae,E.fetida and P.excavatus at various dosages for Distillery sludge in before treatment
Fig. 6.2 Pictogram representation of Macro-Nutrient analysis of earthworm treated Distillery sludge; TP:Total Phosphorus; TK: Total Potassium; TCa: Total Calcium; TMg: Total Magnesium; EE: E. eugeniae; EF: E. fetida; PE: P. excavatus

Fig. 6.3 C:N is obtained by arithemetic calculation from TOC and TN; TOC: Total Organic Carbon; TN:Total Nitrogen
Fig. 6.4 Pictogram representation of Micro-Nutrient analysis of earthworm treated Distillery sludge; Zn:Zinc; Cu: Copper; Mn: Manganese; Cr: Chromium; Ni: Nickel; Co: Cobalt; Cd: Cadmium; EE: E. eugeniae; EF: E. fetida; PE: P. excavates