chapter one: functions and linear models1.1 functions from the numerical, algebraic, and graphical...
TRANSCRIPT
Chapter One: Functions and Linear Models
1.1 Functions from the Numerical, Algebraic, and Graphical Viewpoints
Definition – A real-valued function f for a real-valued variable x assigns to each real number x in a
specified set of numbers, called the domain of f, a unique real number f x . The variable x is called the
independent variable, and f is called the dependent variable. A function is usually specified numerically
using a table of values, graphically using a graph, or algebraically using a formula. The graph of a
function consists of all points ,x f x in the plane with x in the domain of f.
Definition – The domain of a function consists of all possible inputs (x-values) for the given function. The
general rule is no zeros in denominators, no negatives under even index radicals, and only positive
values inside logarithms. We will cover each as it comes up, but these are the three main rules for
domains. Graphically, the domain consists of all x-values used by the function or relation being graphed.
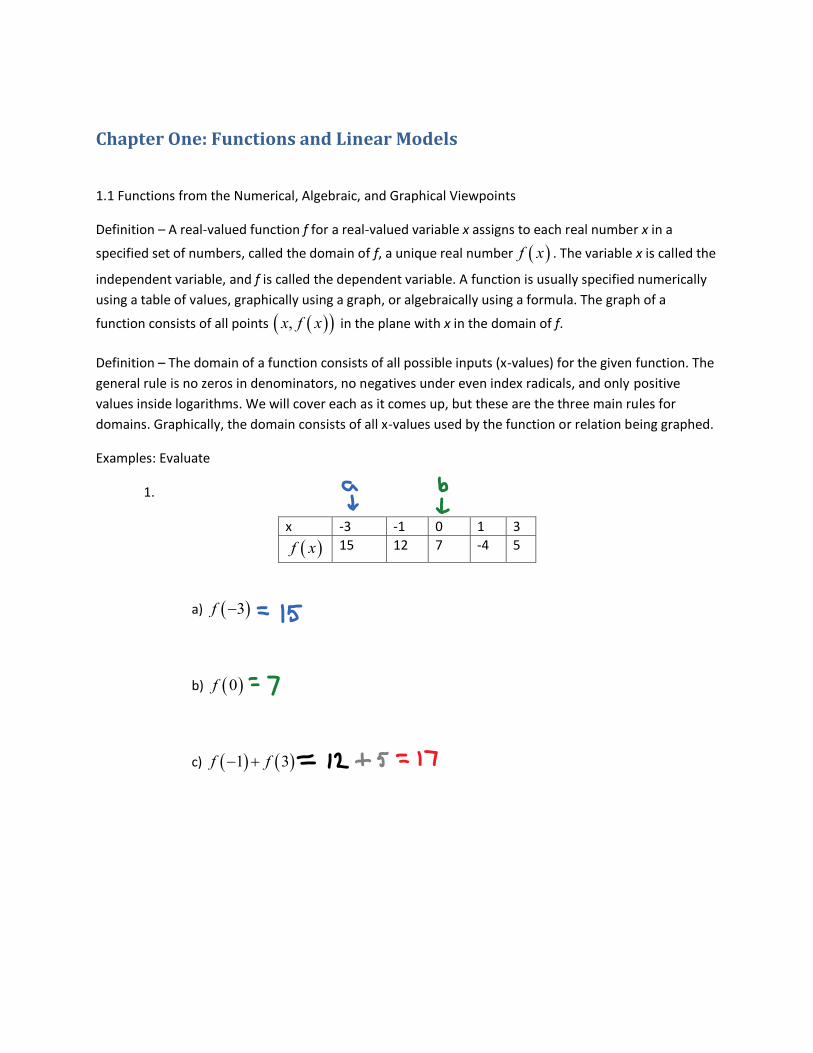
Examples: Evaluate
1.
x -3 -1 0 1 3
f x 15 12 7 -4 5
a) 3f
b) 0f
c) 1 3f f

2. 3 4f x x
a) 5f
b) 2f
c) f b
d) 1 2 3f f
3. 2 5f x x
a) f a
b) f a h
c) f a h f a
h
Functions and Equations – Instead of using function notation, 3 1f x x , to specify a function, we
could have specified by replacing f x with y. That is, we could write 3 1y x . When we use the
letter y, it is an equation but when we use function notation we call it a function. Function notation and
equation notation, sometimes using the same letter for the function name and the dependent variable,
are often used interchangeably. It is important to be able to switch back and forth between function
notation and equation notation, and we shall do so when it is convenient.
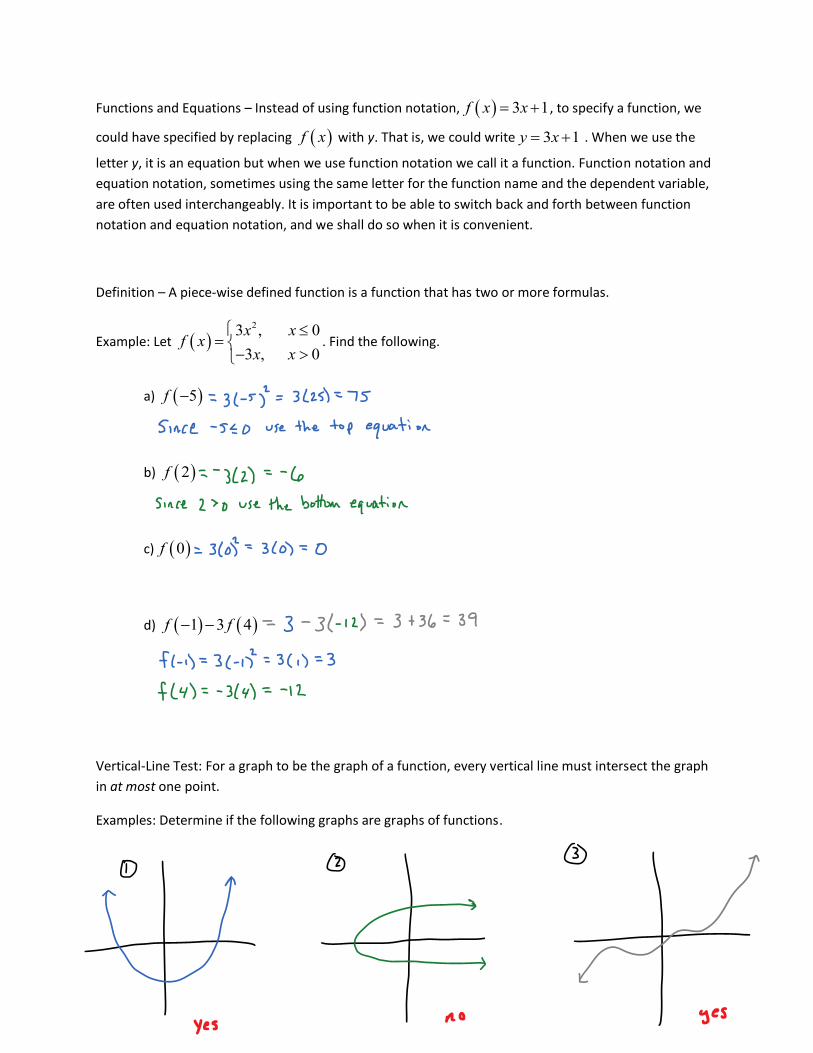
Definition – A piece-wise defined function is a function that has two or more formulas.
Example: Let 23 , 0
3 , 0
x xf x
x x
. Find the following.
a) 5f
b) 2f
c) 0f
d) 1 3 4f f
Vertical-Line Test: For a graph to be the graph of a function, every vertical line must intersect the graph
in at most one point.
Examples: Determine if the following graphs are graphs of functions.
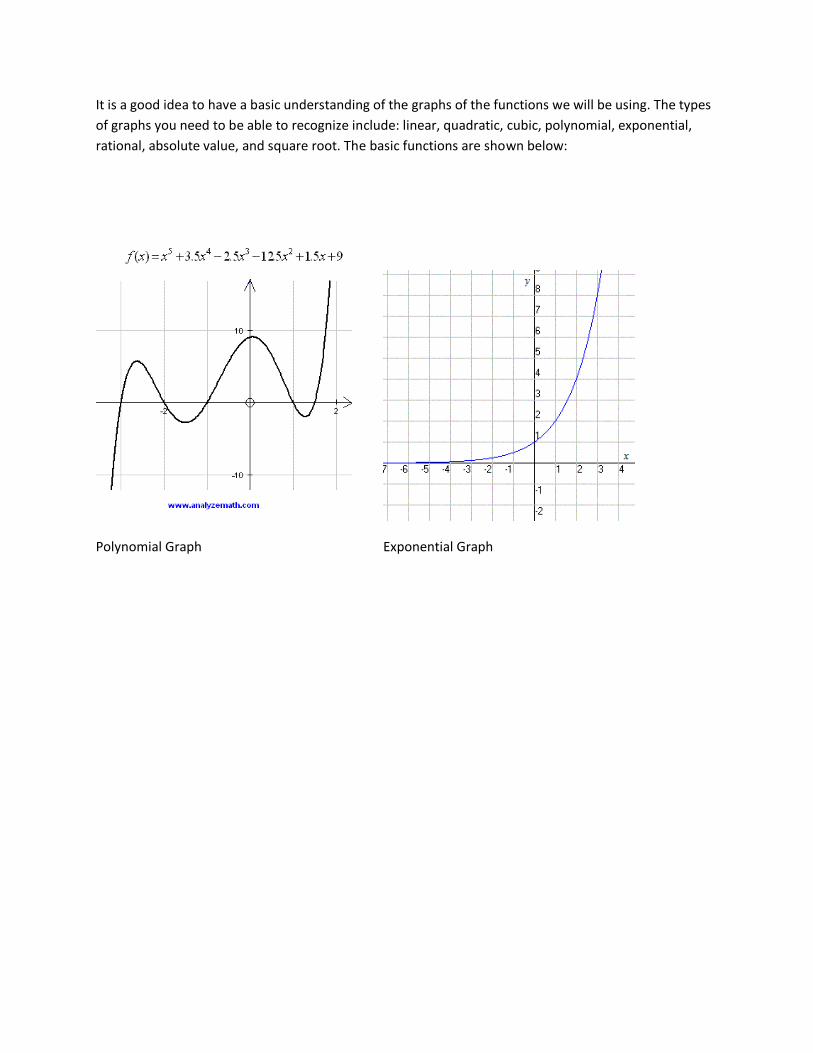
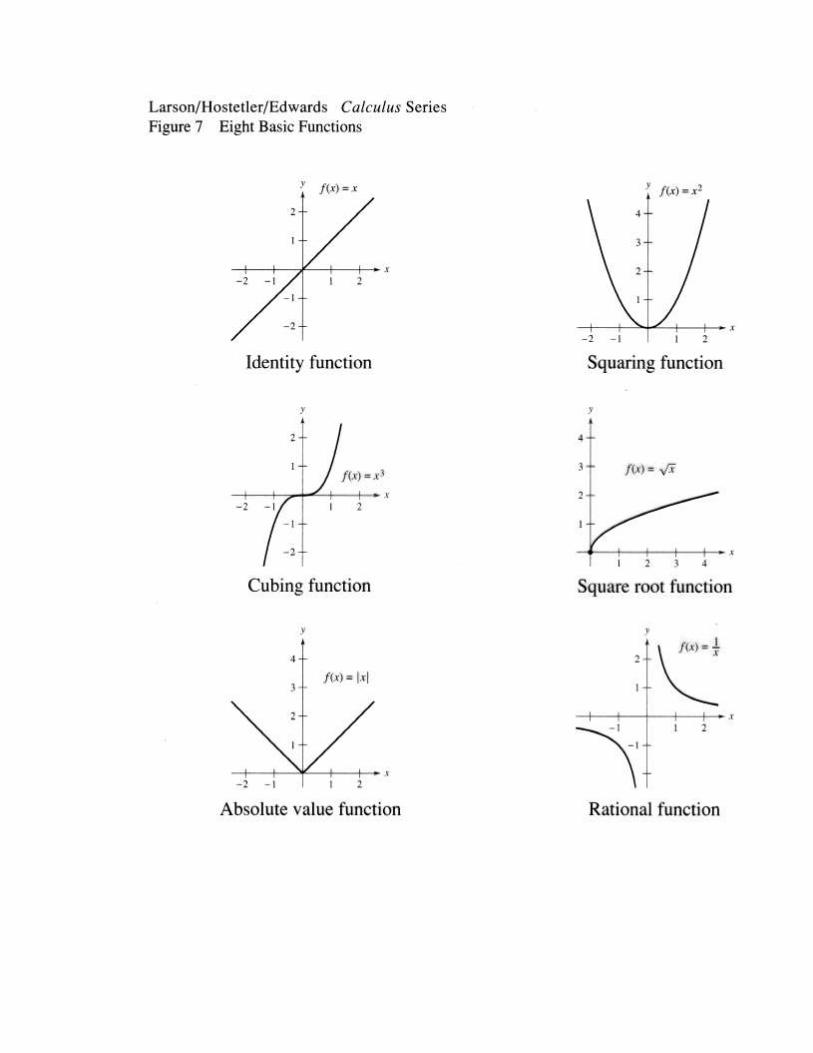
It is a good idea to have a basic understanding of the graphs of the functions we will be using. The types
of graphs you need to be able to recognize include: linear, quadratic, cubic, polynomial, exponential,
rational, absolute value, and square root. The basic functions are shown below:
Polynomial Graph Exponential Graph