chapter iv - shodhgangashodhganga.inflibnet.ac.in/bitstream/10603/25100/13/13_chapter_4.pdf ·...
TRANSCRIPT

136
CHAPTER IV
Airborne-Radiometric Data
Processing and Interpretation

137
4. AIRBORNE RADIOMENTRIC (GAMMA RAY SPECTROMETRY) DATA INTERPRETATION
4.1 Introduction
The application of radioactivity in geoscience is based on knowledge of the physical properties of radiation sources, and the ability to detect these sources through the analysis of remotely sensed data.
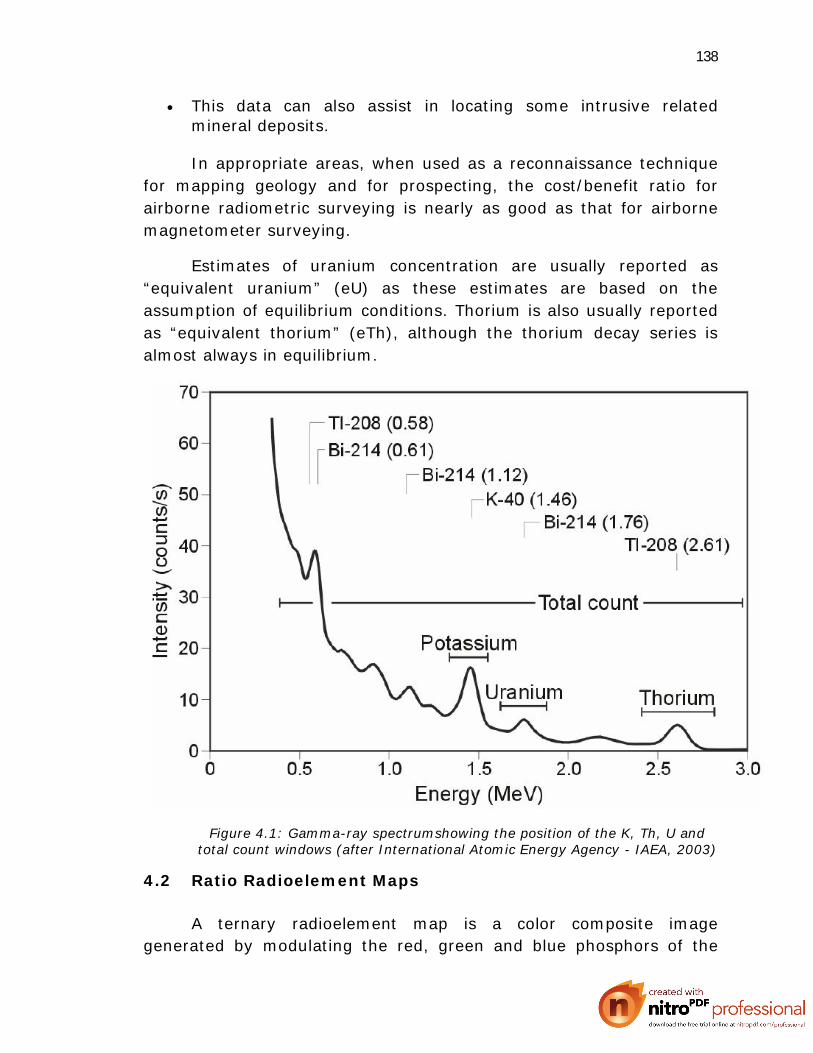
Radiometric surveys detect and map natural radiometric emanations, call gamma rays, from rocks and soils. At least 20 naturally occurred elements are known to be radioactive (Telford et. al., 1990). All detectable gamma radiation from earth materials come from the natural decay products of only three elements, i.e. uranium, thorium, and potassium. While many naturally occurring elements have radioactive isotopes, only potassium, uranium and thorium decay series, have radioisotopes that produce gamma rays of sufficient energy and intensity to be measured by gamma ray spectrometry. This is because they are relatively abundant in the natural environment. Average crustal abundances of these elements quoted in the literature are in the range 2-2.5% of K, 2-3 ppm of U and 8-12 ppm of Th. The basic purpose of radiometric surveys is to determine either the absolute or relative amounts of U, Th., and K in the surface rocks and soils.
Few benefits that can expect from the interpretation of radiometric surveys include:
Changes in the concentration of the three radioelements U, Th., and K accompany most major changes in lithology; hence the method can be used as a reconnaissance geologic mapping tool in many areas.
Variations in radioelement concentrations may indicate primary geological processes such as the action of mineralizing solutions or metamorphic processes.
These variations also characterize secondary geological processes like supergene alteration and leaching.
Radiometric surveys are capable of directly detecting the presence of uranium.
138
This data can also assist in locating some intrusive related mineral deposits.
In appropriate areas, when used as a reconnaissance technique for mapping geology and for prospecting, the cost/benefit ratio for airborne radiometric surveying is nearly as good as that for airborne magnetometer surveying.
Estimates of uranium concentration are usually reported as “equivalent uranium” (eU) as these estimates are based on the assumption of equilibrium conditions. Thorium is also usually reported as “equivalent thorium” (eTh), although the thorium decay series is almost always in equilibrium.
Figure 4.1: Gamma-ray spectrumshowing the position of the K, Th, U and total count windows (after International Atomic Energy Agency - IAEA, 2003)
4.2 Ratio Radioelement Maps
A ternary radioelement map is a color composite image generated by modulating the red, green and blue phosphors of the

139
display device or yellow, magenta and cyan dyes of a printer in proportion to the radioelement concentration values of the K, Th, U and TC grids. The use of red, green and blue for K, Th and U, respectively, is standard for displaying gamma ray spectrometric data. Blue is used to display the U channel, since this is the noisiest channel and the human eye is least sensitive to variations in blue intensity. Areas of low radioactivity and consequently low signal to noise ratios, can be masked by setting a threshold on the total count grid. This reserves more color space and ensures a better color enhancement for the remaining data.
Sum-normalization can be used to compute relative concentrations of K, Th and U prior to imaging as follows:
Kn = K/ K+U+Th
Un = U/ K+U+Th
Thn = Th/ K+U+Th
This converts the radioelement concentrations to relative abundance. Sum-normalization can be useful to reduce the effects of the attenuation of gamma rays by vegetation or soil moisture.
140
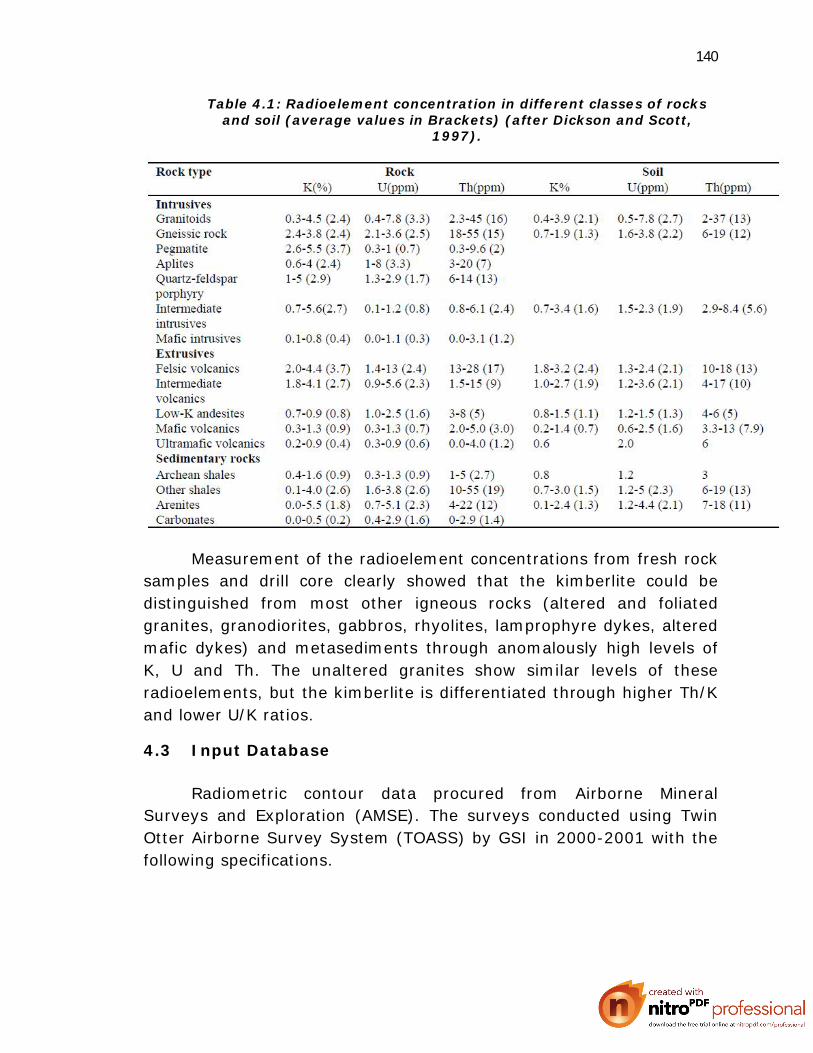
Table 4.1: Radioelement concentration in different classes of rocks and soil (average values in Brackets) (after Dickson and Scott,
1997).
Measurement of the radioelement concentrations from fresh rock samples and drill core clearly showed that the kimberlite could be distinguished from most other igneous rocks (altered and foliated granites, granodiorites, gabbros, rhyolites, lamprophyre dykes, altered mafic dykes) and metasediments through anomalously high levels of K, U and Th. The unaltered granites show similar levels of these radioelements, but the kimberlite is differentiated through higher Th/K and lower U/K ratios.
4.3 Input Database
Radiometric contour data procured from Airborne Mineral Surveys and Exploration (AMSE). The surveys conducted using Twin Otter Airborne Survey System (TOASS) by GSI in 2000-2001 with the following specifications.

141
Spectrometric (Total Count) data:
Flight Line Direction : NE-SW
Mean Flight line Spacing : 500 m
Mean Terrain Clearance : 120 m (AGL)
Contour Interval : 250 cps
Spectrometric (Potassium) data:
Flight Line Direction : NE-SW
Mean Flight line Spacing : 500 m
Mean Terrain Clearance : 120 m (AGL)
Contour Interval : 0.2 %K
Spectrometric (Thorium) data:
Flight Line Direction : NE-SW
Mean Flight line Spacing : 500 m
Mean Terrain Clearance : 120 m (AGL)
Contour Interval : 2 ppm eTh
Spectrometric (Uranium) data:
Flight Line Direction : NE-SW
Mean Flight line Spacing : 500 m
Mean Terrain Clearance : 120 m (AGL)
Contour Interval : 2 ppm eU
4.4 Analysis and Interpretation
The gamma-ray spectrometry method is widely used in diverse fields. Initially developed as uranium exploration tool, the application of the method now include geological mapping (Andrson and Nash, 1997; Graham, and Bonham-carter, 1993; Jaques et al., 1997;

142
Charbonneau et al., 1997), mineral exploration (Grasty and Shives, 1997; Lo and Pitcher, 1996), soil mapping (Cook et al., 1996; Wilford et al., 1997), and environmental radiation monitoring. Wilford et al., (1997) demonstrated that airborne gamma-ray spectrometry patterns provided important information for soil, regolith, and geomorphology studies used for land management and mineral exploration decisions. Darnley and Ford (1989) show that, in many situations, gamma-ray spectrometry is probably more useful than any other single airborne geophysical or remote sensing technique in providing information directly interpretable in terms of surface geology.
U, K and Th occur at high concentration in fresh granite soil (white to violet) and in granitic soil where clay layers are close to or exposed at the surface (yellow, pink and white). Highest levels of U and Th (brightest blue/green) denote exposed ironstone gravel where potassium is low and these colours fade out as the depth of overlying quartz sand increases. However, similarly muted U and Th signalling can emanate from duplex soil developed in highly weathered (K deficient) substrate. Deep sandy duplexes and deep yellow and grey sands of the sandplain show up as brown to black while deep granitic sands (fresh soil) with appreciable quantities of potassium feldspars show up as dark red.
Composite images provide a simultaneous display of up to three parameters on one image and facilitates the correlation and delineation of areas based on subtle differences in numerical values. The following combinations are developed by the USGS (Duval, 1983):
i. The radioelement composite image combines the data of K (in red), eTh (in green), and eU (in blue).
ii. The potassium composite image combines the data of K (in red), with the ratios K/eTh (in green) and K/eU (in blue).
iii. The uranium composite image combines the data of eU (in red) with the ratios eU/eTh (in green) and eU/K (in blue).
iv. The thorium composite image combines the data of eTh (in red), with the ratios eTh/eU (in green), and eTh/K (in blue).
v. The radioelement ratio composite image combines the data of the three radiometric ratios eU/eTh (in red), eU/K (in green) and eTh/K (in blue).

143
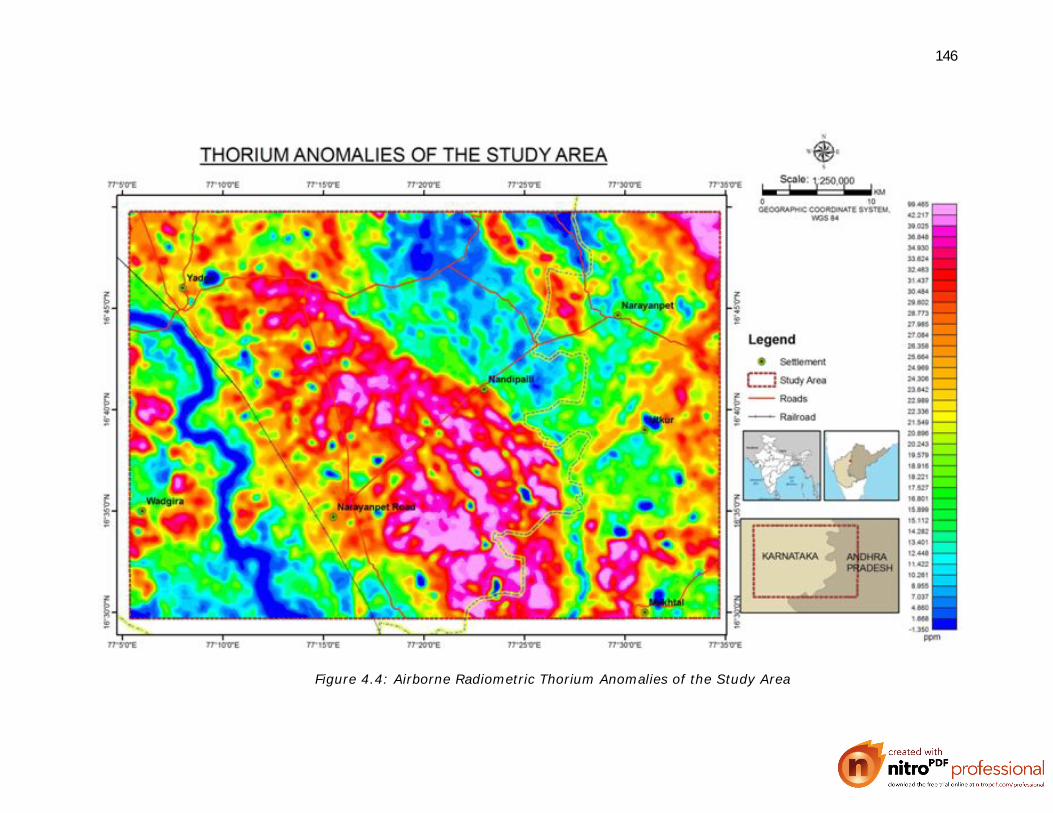
In the present study granitic rocks with little soil cover could be easily identifiable with high concentrations of K and Th. Whereas the same granitic bodies with thick soil cover (derived from Deccan Traps) showing negative anomalies than the granitic terrain. Even greenstone belt (Dharwar schist) is showing moderate anomalies.
All processed radiometric data analysed to generate and correlated with geological and spectral interpretation. The radiometric spectral trends are corroborated with magnetic spectral strengths (Figures 4.2 to 4.9).

144
Figure 4.2: Airborne Radiometric Potassium Anomalies of the Study Area

145
Figure 4.3:Airborne Radiometric Potassium Anomaly contour Map of the Study Area
146
Figure 4.4: Airborne Radiometric Thorium Anomalies of the Study Area

147
Figure 4.5: Airborne Radiometric Thorium Anomaly contour Map of the Study Area

148
Figure 4.6: Airborne Radiometric Uranium Anomalies of the Study Area

149
Figure 4.7: Airborne Radiometric Uranium Anomaly contour Map of the Study Area

150
Figure 4.8: Airborne Total Radiometric Anomalies of the Study Area

151
Figure 4.9: Airborne Total Radiometric Anomaly contour Map of the Study Area