chapter iii status and performance of major transit …
TRANSCRIPT

III-1
CHAPTER IIISTATUS AND PERFORMANCE OF MAJOR TRANSIT SYSTEMS
The New York State Department of Transportation isrequired by Section 18-b of Transportation Law to reporton the efficiency, effectiveness and economy of transitservice. This Chapter addresses this requirement bypresenting an overview of trends in the performance of theState’s major transit systems.
This Chapter is divided into two sections:
• A Statewide overview of the performance oftransit systems, grouped by service type andcommon market characteristics; and,
• A detailed reporting on the status andperformance of specific transit systems thatreport financial and operating statistics to theDepartment of Transportation under therequirements of Section 17-a of StateTransportation Law.
This report presents the operating statistics overviewmaterial on a calendar year basis, consistent with the 17-areporting years of the vast majority of transit systems thatare covered in the more detailed section of this chapter onspecific transit systems.
The New York State Department of Transportationclassifies transit systems as either downstate or upstate.Downstate systems serve the Metropolitan TransportationCommuter District and include: MetropolitanTransportation Authority (MTA) - New York City Transit(MTA-NYCT), two MTA commuter rail operations, andlocal bus systems serving the counties of Nassau, Suffolk,Westchester, Dutchess, Putnam, Orange, and Rockland.Systems serving the remainder of the State comprise theupstate transit system grouping, including the four publictransportation authorities, intercity bus operations, andsystems serving small urbanized areas (SUZAs), non-urbanized area counties, and small cities.
The overview section of this chapter summarizes ridershipand vehicle mile trends by these service groupings. It alsoprovides an overview of the trends in “Effectiveness,”“Efficiency” and “Economy” - statistical measurescomprised of the following ratios:
• “Effectiveness” is measured by the revenuepassenger to revenue vehicle mile ratio;
• “Efficiency” is measured by the operating costper revenue vehicle mile ratio; and,
• “Economy” is measured by the operatingrevenue to operating cost ratio.
Effectiveness, efficiency and economy performancemeasure figures in this report include data for allsponsored operators that reported 17-a statistics for2002. Prior to the 2001 edition, tables have includedfinancial and operational data for the largest systemswithin the Metropolitan Transportation Authority (MTA)Commuter District. Thus, the more comprehensive fiveyear statistics in this report will not in every case matchthose found in previous Transit Annual Reports. Non-urbanized and small city systems are not required tosubmit 17-a statistics. The SUZAs that are included inthis analysis are: the Utica Transit Authority (UTA),Greater Glens Falls Transit (GGFT), Broome CountyTransit, Tompkins Consolidated Area Transit (TCAT),and the Chemung County Transit System (CCTS).

III-2
Downstate Revenue Passengers
% Change% Change%ChangeCYCYCYCYNEW YORK STATE
01 to 0298 to 0292 to 022002200119981992SYSTEMS
NYCT:0.5%17.5%41.5%1,417,969,1531,410,293,3681,206,951,5761,001,790,001 Subway
3.0%21.9%69.5%762,563,720739,997,360625,586,830449,934,749 Bus
10.4%131.4%N/A2,227,7022,017,217962,606N/A Paratransit
1.4%19.0%50.4%2,182,760,5752,152,307,9451,833,501,0121,451,724,750NYCT Subtotal:
Commuter Rail:-1.8%4.6%15.1%83,974,20585,526,66980,272,31972,965,881 LIRR
-0.3%9.9%28.7%52,364,45852,499,10947,636,29240,698,488 MNCR (A)
-1.2%6.6%19.9%136,338,663138,025,778127,908,611113,664,369Commuter Rail Subtotal:1.3%18.2%48.1%2,319,099,2382,290,333,7231,961,409,6231,565,389,119MTA Total:
Other New York City:
6.1%-1.5%7.1%19,276,52518,174,83319,566,24917,990,327 Staten Island Ferry
-11.8%3.9%29.7%99,399,831112,668,47995,641,52576,661,588 NYC Private Bus
-9.3%3.0%25.4%118,676,356130,843,312115,207,77494,651,915Other NYC Total:Suburban Bus Systems:
-0.5%-1.5%4.5%29,499,74529,655,28129,941,96928,231,376 Westchester Co.
0.3%10.2%27.0%31,014,13530,919,07728,141,03124,411,091 Nassau Co.
-0.5%1.0%28.2%4,978,4435,002,7314,929,0753,882,893 Suffolk Co.
0.9%10.4%20.4%4,730,6654,689,4194,284,7203,930,433 Rockland Co.
1.5%5.4%16.4%2,836,3542,793,9942,691,3542,436,318 Other Formula Bus (B)
-0.0%4.4%16.2%73,059,34273,060,50269,988,14962,892,111Downstate Suburban Bus:
-0.2%1.2%32.8%1,804,3291,807,6371,782,1161,358,347Intercity Bus Companies
9.8%30.1%46.0%278,262253,356213,807190,549Trans-Hudson Service (C)
0.7%17.0%45.7%2,512,917,5272,496,298,5302,148,601,4691,724,482,041Downstate Total:
A) Includes only revenue passengers with origins and destinations in New York State.
B) Other Formula Bus Systems: Dutchess Co., Orange Co., Putnam Co., City of Long Beach, City of Glen Cove and City of Poughkeepsie.
C) Tappan Zee Bridge Bus Service provided under contract to Rockland County.
Figure III-1
RIDERSHIP TRENDS
In 2002, the State Operating Assistance Program (STOA)statewide ridership reached its highest level -- 2.58 billionpassengers -- since the inception of the STOA program in1974. STOA-eligible ridership has risen at an annualizedrate of 3.7 percent from 1992 to 2002. Downstate systemsaccount for 97.5 percent of total statewide ridership, 89.3percent of which is attributable to transit operations withinNew York City. Upstate systems serve 2.6 percent ofNew York State’s (NYS) transit riders.
Figure III-1 shows downstate ridership increasing by 16.6million passengers, or 0.7 percent, from 2001 to 2002.The largest one year percentage increase for 2002, 6.1percent, occurred on the Staten Island Ferry. New YorkCity Transit’s bus systems had the largest five yearpercentage increase for 2002 of 21.9 percent or 312.6million passengers (excluding NYCT paratransitservices).
The Staten Island Ferry’s significant increase inpassengers, 1.1 million additional passengers, waslargely due to the temporary restrictions that were placedon Single Occupant Vehicles entering Manhattan. Theserestrictions were put into place after September 11th,2001. These restrictions remained in place untilNovember 2003.
MTA NYC Transit ridership in 2002 accounted for 84.7percent of NYS ridership. MTA NYCT Subwayridership grew slightly despite service disruptions insome areas due to infrastructure damage inflicted by thecollapse of the World Trade Center buildings onSeptember 11t,h and the resulting economic impacts inthe New York Metropolitan area. The MTA NYCTransit bus system had a larger increase in ridership of3.0 percent. NYC Transit’s paratransit service ridershipgrew 10 percent from 2001 to 2002 due primarily toservice expansion.
MTA Commuter Rail services ridership saw a slight

III-3
Upstate Revenue Passengers
% Change% Change%ChangeCYCYCYCYNEW YORK STATE01 to 0298 to 0292 to 022002200119981992SYSTEM
Upstate Authorities:-3.7%-8.1%-18.9%21,535,73622,373,31823,440,18726,566,351 NFTA1.4%11.8%1.2%14,382,67414,178,80212,861,53414,213,634 R-GRTA
-2.2%-6.5%-23.4%8,912,9439,114,0739,535,53411,637,701 CNYRTA1.3%10.2%-0.3%10,721,72710,587,0279,725,60910,749,155 CDTA
-1.2%-0.0%-12.1%55,553,08056,253,22055,562,86463,166,841Upstate Authority Total:Small Urbanized Area (SUZA):
1.1%-7.7%-2.8%2,695,1242,665,8322,918,5982,772,893 Broome County Transit Utica-Rome Urbanized Area
3.8%-15.5%-59.7%1,172,1551,129,2271,386,6102,910,592 Utica Transit Authority-2.6%-3.5%-1.5%240,641247,163249,391244,353 City of Rome, VIP-5.7%-11.3%-35.7%697,490739,481786,5251,085,220 Chemung County Transit (A)
Tompkins/Ithaca Urbanized0.3%15.4%33.7%2,699,6942,692,4512,338,4401,165,499 Tompkins County (B)N/AN/AN/AN/AN/AN/A853,599 City of Ithaca (C)
-9.2%-3.2%17.0%287,230316,448296,797245,600 Greater Glens Falls Transit0.0%-2.3%-16.0%7,792,3347,790,6027,976,3619,277,7561) SUZA Total2.2%11.6%11.2%3,563,0853,484,8613,194,0413,205,1902) Small City and County
0.7%1.7%-9.0%11,355,41911,275,46311,170,40212,482,946City/County Systems (1+2)-3.4%76.6%-87.7%117,706121,88766,651953,854Intercity Bus Companies (D) (E)
-0.9%0.3%-12.5%67,026,20567,650,57066,799,91776,603,641Upstate Total:
A) Includes services provided by the operator in Tioga, Schuyler and Chemung Counties.B) Inlcudes services sponsored by Tompkins County: Tioga Transport, Tompkins County Rural, CU Transit and Gadabout.C) Includes Ithaca Transit and Swarthout & Ferris. As of 1st quarter 97-98 this is sponsored by Tompkins County.D) The number of operators in this category has changed over time.E) Intercity routes were restructured in 1999. For additional information see Chapter V. The number of operators in these categories has changed over time.
Figure III-2
decline of 1.2 percent. Over 136 million revenuepassengers were served by MTA Commuter Rail servicesin 2002.
New York City Department of Transportation (NYCDOT)private bus companies saw the largest one year decline inridership of 11.8 percent. NYCDOT private buscompanies’ decline in revenue passengers is mostly due tothe negative impact of two labor strikes that affected thecompanies during the year.
Figure III-2 shows overall ridership upstate between 1992and 2002. Upstate ridership accounts for approximately2.5 percent of the statewide total. Revenue passengers forupstate systems was virtually unchanged, a 0.9 percentdecrease, between 2001 and 2002.
The upstate authorities account for 82.9 percent of thetotal upstate ridership. Between 2001 and 2002, thesesystems had a decrease in ridership of 1.2 percent. Thisdecrease comes after a one year increase of 2.4 percentbetween 2000 and 2001 where most of the authorities hadlarge increases in ridership due to efforts at meetingchanging transportation demands of their service areas.The decrease in 2002 was due to NFTA and CNYRTAboth having decreases of 3.7 percent and 2.2 percent
respectively. Both systems’ decreases were due toservices other than the base fixed route ridership.Meanwhile, CDTA and R-GRTA both saw modestincreases in ridership from 2001 to 2002.
The ridership for the Small Urbanized Areas (SUZA)systems remained fairly constant, as a group, between2001 and 2002. There was a wide variation in one-yeartrends in 2002. Utica Transit Authority (UTA) had thelargest one year percentage increase in ridership for2002. This is a reversal of trends for UTA which hasbeen losing ridership over the last couple of years.UTA’s ridership increase is partially due to gaining theriders from the LINK service which was canceled in2001.
In 2002, Greater Glens Falls Transit (GGFT) saw thelargest one year decline in revenue passengers. Thisdecrease is largely due to GGFT discontinuing anexperimental service that ran in 2001.
In 2002, subsidized intercity bus service decreased by3.4 percent. Several factors contributed to the decreasein passengers. These factors are described in Chapter 4.

III-4
Downstate Revenue Vehicle Miles
% Change% Change%ChangeCY CYCYCYNEW YORK STATE01 to 0298 to 0292 to 022002200119981992SYSTEMS
NYCT:3.9%8.2%12.1%343,466,970330,607,534317,388,013306,463,384 Subway1.2%13.6%14.5%102,883,784101,655,14690,552,80189,881,007 Bus
36.1%62.4%N/A14,864,55710,918,5339,152,134N/A Paratransit4.1%10.6%16.4%461,215,311443,181,213417,092,948396,344,391NYCT Subtotal:
Commuter Rail:0.2%-0.3%5.8%57,801,72457,687,00057,969,48054,638,100 LIRR
-0.4%13.9%36.1%40,047,20040,223,03535,158,00329,422,410 MNCR (A)-0.1%5.1%16.4%97,848,92497,910,03593,127,48384,060,510Commuter Rail Subtotal:3.3%9.6%16.4%559,064,235541,091,248510,220,431480,404,901MTA Total:
Other New York City:0.6%1.9%1.4%164,226163,298161,138162,022 Staten Island Ferry
-6.2%0.8%-5.8%25,823,37427,544,31025,619,32227,417,445 NYC Private Bus-6.2%0.8%-5.8%25,987,60027,707,60825,780,46027,579,467Other NYC Total:
Suburban Bus Systems:-0.7%3.6%11.2%10,964,44511,044,67110,587,9919,861,059 Westchester Co.3.5%14.6%37.7%12,523,42212,096,75610,931,8239,094,543 Nassau Co.4.4%21.6%58.1%9,559,1759,158,2327,861,1496,047,245 Suffolk Co.1.5%15.8%26.7%7,403,4527,296,5316,392,5405,841,658 Rockland Co.2.1%12.6%55.0%5,276,1145,169,7234,686,1853,402,994 Other Formula Bus (C)2.1%13.0%33.5%45,726,60844,765,91340,459,68834,247,499Downstate Suburban Bus:
-2.2%6.6%25.2%6,196,9796,336,7435,812,2164,950,252Intercity Bus Companies15.7%63.3%102.4%428,080369,929262,138211,480Trans-Hudson Service (C)2.8%9.4%16.4%637,403,502620,271,441582,534,933547,393,599Downstate Total:
A) Includes only revenue vehicle miles in New York State.B) Other Formula Bus Systems: Dutchess Co., Orange Co., Putnam Co., City of Long Beach, City of Glen Cove and City of Poughkeepsie.C) Tappan Zee Bridge Bus Service provided under contract to Rockland County.
Figure III-3
TRANSIT SERVICE TRENDS
The overall level of transit service available in New YorkState, as measured by revenue vehicle miles of service,increased by 2.9 percent from 2001 to 2002.
Figure III-3 presents revenue vehicle mile data for thedownstate systems, which provided 92.2 percent of therevenue vehicle miles of service in the State. In total, theMTA provides 87.7 percent of the revenue miles ofservice in the downstate area.
MTA-NYCT subway vehicle miles increased 3.9 percent,12.9 million revenue miles, from 2001 to 2002. Themain reason for the increase in service is the opening ofthe 63rd street tunnel in December 2001.
2002 was the first full year of the new services associatedwith the recommendations from the Long Island Busstudy. Suffolk County Transit (SCT) saw an increase inrevenue vehicle miles of 4.4 percent from 2001 to 2002.
New York City Department of Transportation (NYCDOT)private bus companies saw a 6.2 percent decrease in
service from 2001 to 2002. This decrease in revenuevehicle miles is due to the labor strikes that affected thebus companies.
Figure III-4 shows that revenue vehicle miles of servicefor the upstate transit systems increased by 4.1 percentfrom 2001 to 2002. The four upstate authorities,accounting for 57.7 percent of the upstate total revenuemiles, experienced a 3.8 percent increase in service from2001 to 2002. This is due to service increases in most ofthe authorities, especially CDTA and R-GRTA who hadincreases around 6 percent.
The combined SUZA systems operated 2.6 percent morerevenue miles in 2002 than in 2001 while small City, andrural County systems, as a whole, provided a 6.6 percentincrease in service miles in 2002. These types ofsystems had revenue mile increases due to serving widerservice areas.
Fares have remained stable over the ten year period 1992to 2002, with most systems maintaining fares at 1996levels. The 30.9 percent increase in State transit fundingsince SFY 1996-1997, detailed in the preceding Chapter,

III-5
Upstate Revenue Vehicle Miles
% Change% Change%ChangeCYCYCYCYNEW YORK01 to 0298 to 0292 to 022002200119981992SYSTEMS
Upstate Authorities:-0.2%5.4%7.0%9,587,8079,605,2689,100,6628,961,686 NFTA6.1%11.4%25.8%9,598,8899,045,0438,613,7917,629,929 R-GRTA3.7%8.8%-6.8%4,963,0364,786,3574,563,3305,326,362 CNYRTA6.3%10.9%11.3%7,151,1746,729,8326,448,2306,423,605 CDTA3.8%9.0%10.4%31,300,90630,166,50028,726,01328,341,582Upstate Authority Total:
Small Urbanized Area (SUZA):4.0%18.2%21.6%1,964,3681,888,7401,661,6761,615,570 Broome County Transit
Utica-Rome Urbanized Area-0.5%-9.3%-9.2%1,070,5641,076,4351,180,8271,178,944 Utica Transit Authority7.5%1.4%27.3%246,217229,113242,727193,487 City of Rome, VIP
-0.5%14.2%1.5%1,286,8621,293,7071,126,3571,268,028 Chemung County Transit (A) Tompkins/Ithaca Urbanized
6.7%22.3%39.6%1,822,5041,707,4181,490,151938,991 Tompkins County (B)N/AN/AN/AN/AN/AN/A366,338 City of Ithaca (C)
-8.9%-2.4%24.5%288,434316,596295,672231,740 Greater Glens Falls Transit2.6%11.4%15.3%6,678,9496,512,0095,997,4105,793,0981) SUZA Total6.6%29.5%73.7%13,302,22112,476,15510,270,5257,658,1262) Small City and County (D)5.2%22.8%48.5%19,981,17018,988,16416,267,93513,451,224City/County Systems (1+2)
-0.0%4.1%-37.4%3,009,3823,010,8252,891,5054,805,949Intercity Bus Companies (D)4.1%13.4%16.5%54,291,45852,165,48947,885,45346,598,755Upstate Total:
A) includes services provided by the operator in Tioga, Schuyler and Chemung Counties.
B) includes all services sponsored by Tompkins County: Tioga Transport, Tompkins County Rural, CU Transit and Gadabout.
C) includes Ithaca Transit and Swarthout & Ferris. As of 1st quarter 97-98 this is sponsored by Tompkins County.
D) The number of operators in these categories has changed over time.
Figure III-4
$0.90
$1.00
$1.10
$1.20
$1.30
$1.40
$1.50
$1.60
$1.70
$1.80
9293
9495
9697
9899
0001
02
Calendar Year
MTA-NYCT
NYC Privates
CPI
MTA-NYCT and NYC Private Bus (Local)Fares
Figure III-5
$0.85
$0.95
$1.05
$1.15
$1.25
$1.35
$1.45
$1.55
$1.65
$1.75
9293
9495
9697
9899
0001
02
Calendar Year
MTA-LIB
Westchester
CPI
MTA-Long Island Bus and WestchesterFares
Figure III-6
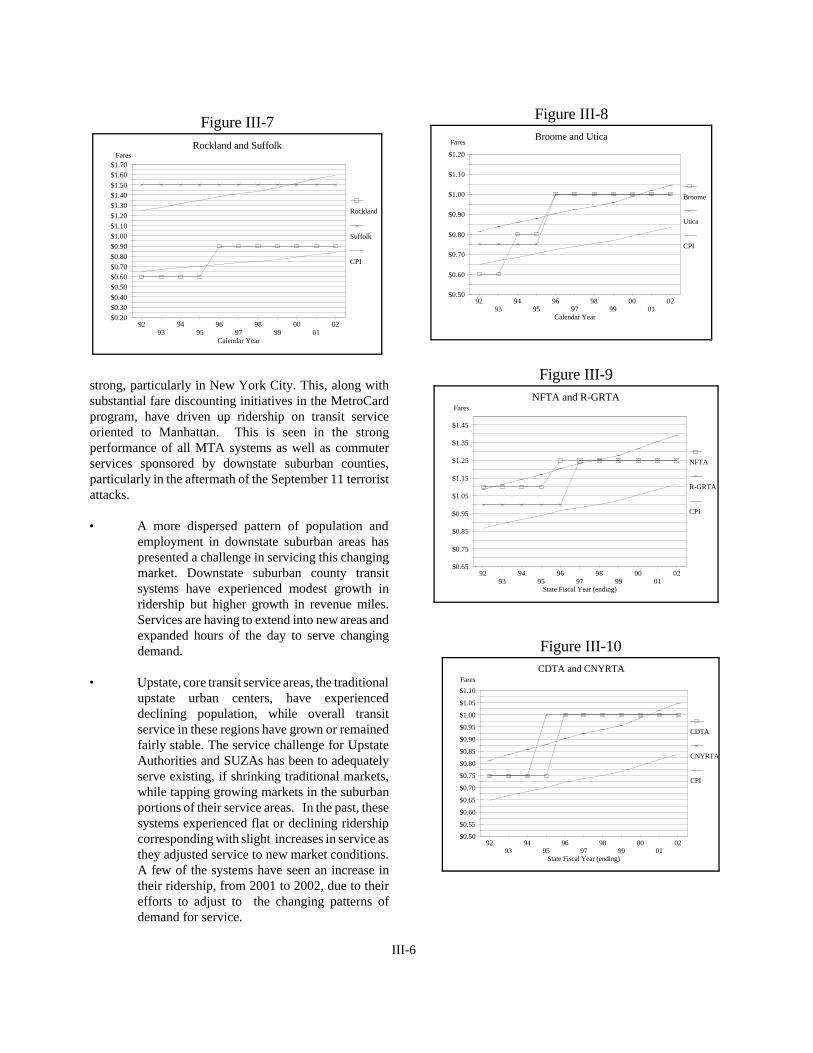
has enabled transit systems in the State's urbanized andrural areas to maintain fares at or below the nationalaverage, making transit a viable and affordabletransportation alternative.
Fare increases, over the ten year period from 1992 to2002, by peer group transit systems are shown in Figures
III-5 through III-10
Driving the trends in ridership and service are a numberof factors that will be described for each of the majorsystems in the detailed system sections that follow. Ona broad level, the following demographic shifts and otherfactors have contributed to the trends described above:
• Downstate population growth has been very
III-6
$0.20$0.30$0.40$0.50$0.60$0.70$0.80$0.90$1.00$1.10$1.20$1.30$1.40$1.50$1.60$1.70
9293
9495
9697
9899
0001
02
Calendar Year
Rockland
Suffolk
CPI
Rockland and SuffolkFares
Figure III-7
$0.50
$0.60
$0.70
$0.80
$0.90
$1.00
$1.10
$1.20
9293
9495
9697
9899
0001
02
Calendar Year
Broome
Utica
CPI
Broome and UticaFares
Figure III-8
$0.50
$0.55
$0.60
$0.65
$0.70
$0.75
$0.80
$0.85
$0.90
$0.95
$1.00
$1.05
$1.10
9293
9495
9697
9899
0001
02
State Fiscal Year (ending)
CDTA
CNYRTA
CPI
CDTA and CNYRTAFares
Figure III-10
$0.65
$0.75
$0.85
$0.95
$1.05
$1.15
$1.25
$1.35
$1.45
9293
9495
9697
9899
0001
02
State Fiscal Year (ending)
NFTA
R-GRTA
CPI
NFTA and R-GRTAFares
Figure III-9strong, particularly in New York City. This, along withsubstantial fare discounting initiatives in the MetroCardprogram, have driven up ridership on transit serviceoriented to Manhattan. This is seen in the strongperformance of all MTA systems as well as commuterservices sponsored by downstate suburban counties,particularly in the aftermath of the September 11 terroristattacks.
• A more dispersed pattern of population andemployment in downstate suburban areas haspresented a challenge in servicing this changingmarket. Downstate suburban county transitsystems have experienced modest growth inridership but higher growth in revenue miles.Services are having to extend into new areas andexpanded hours of the day to serve changingdemand.
• Upstate, core transit service areas, the traditionalupstate urban centers, have experienceddeclining population, while overall transitservice in these regions have grown or remainedfairly stable. The service challenge for UpstateAuthorities and SUZAs has been to adequatelyserve existing, if shrinking traditional markets,while tapping growing markets in the suburbanportions of their service areas. In the past, thesesystems experienced flat or declining ridershipcorresponding with slight increases in service asthey adjusted service to new market conditions.A few of the systems have seen an increase intheir ridership, from 2001 to 2002, due to theirefforts to adjust to the changing patterns ofdemand for service.

III-7
-3% -2% -1% 0% 1% 2% 3% 4%
MTA NYC Transit Rail
MTA NYC Transit Bus
MTA Commuter Rail
NYCDOT Private Bus
Downstate Suburban Bus
Upstate Authorities
Upstate Small Urbanized
Rev. Passengers per Rev. MileAnnualized Change 1998-2002
Figure III-12
Revenue Passengers per Revenue Vehicle Mile
AnnualizedChange 1998-200220021998Operator
3.70%4.293.71MTA NYC Transit Rail0.94%6.025.80MTA NYC Transit Bus1.23%1.471.40MTA Commuter Rail0.79%3.853.73NYCDOT Private Bus
-1.78%1.611.73Downstate Suburban Bus-2.10%1.811.97Upstate Authorities-2.24%1.161.27Upstate Small Urbanized
Figure III-11
Operating Cost per Revenue Vehicle Mile
AnnualizedChange 1998-200220021998Operator
2.81%$6.86$6.14MTA NYC Transit Rail1.17%$12.54$11.97MTA NYC Transit Bus5.57%$16.05$12.92MTA Commuter Rail6.32%$11.92$9.33NYCDOT Private Bus1.84%$5.96$5.54Downstate Suburban Bus5.76%$6.93$5.54Upstate Authorities2.91%$3.69$3.29Upstate Small Urbanized2.50%179.9163.0CPI Rate
Figure III-13
0% 1% 2% 3% 4% 5% 6% 7%
MTA NYC Transit Rail
MTA NYC Transit Bus
MTA Commuter Rail
NYCDOT Private Bus
Downstate Suburban Bus
Upstate Authorities
Upstate Small Urbanized
CPI Rate
Operating Cost per Rev. MileAnnualized Change 1998-2002
Figure III-14
Transit Service Performance Measures
Service Effectiveness: The ratio of revenue passengers torevenue vehicle miles is the statistical measure NYSDOTuses for the system-wide effectiveness of transit service.At an aggregate level, by transit system, this effectivenessmeasure provides only a generalized picture.
Service effectiveness differs dramatically among routeswithin a particular system, and this measure averages outthose differences by aggregating at the system level. But
for comparative purposes among systems and from yearto year the measure provides some useful insights intoservice and usage trends. This performance measure ispresented in Figures III-11 and III-12 for the variousgroups of transit systems in New York State.
Over the five year period, from 1998 to 2002, MTA-NYCT Rail had the greatest increase in the ratio used tomeasure a system’s effectiveness. The MTA subways hadan annualized increase in this performance measure of
3.70 percent. NYC Transit Bus had the best performanceof any of the other groupings, carrying 6.02 passengersper mile in 2002.
The MTA commuter rail systems experienced a modestin 1.23 percent annualized increase over the five yearperiod carrying 1.47 passengers per mile in 2002.
The downstate suburban bus systems along with theUpstate Authorities and SUZAs each experienceddeclines in this measure. This reflects changing marketconditions, a dispersing population and employmentpattern. The SUZA’s experienced the largest five yearannualized decline, 2.24 percent. Downstate suburbanbuses experienced a more modest decline in this measureof 1.78 percent.
Service Efficiency is measured by the operating cost perrevenue vehicle mile. This measure reflects a unit priceview of transit service.

III-8
Operating Revenue to Operating Cost
AnnualizedChange 1998-200220021998Operator
-4.61%71.92%86.88%MTA NYC Transit Rail-2.60%46.76%51.95%MTA NYC Transit Bus-3.85%43.00%50.32%MTA Commuter Rail-7.37%35.19%47.80%NYCDOT Private Bus-2.06%42.83%46.54%Downstate Suburban Bus-5.83%28.58%36.34%Upstate Authorities-0.59%30.42%31.15%Upstate Small Urbanized
Figure III-15
-8% -6% -4% -2% 0%
MTA NYC Transit Rail
MTA NYC Transit Bus
MTA Commuter Rail
NYCDOT Private Bus
Downstate Suburban Bus
Upstate Authorities
Upstate Small Urbanized
Operating Rev to Operating CostAnnualized Change 1998-2002
Figure III-16
As seen in the efficiency data as shown in Figures III-13and III-14, every category of service experienced anincrease in cost per mile over the five year period.The most common reasons for this rise in costs wereincreases in the level of service, liability costs, andsalaries and benefits for employees.
There were two system groups that were able to keep theircost increases per mile below inflation. The two groupswere MTA NYC Transit Bus and the downstate suburbanbuses.
Service Economy is measured by the ratio of operatingrevenue to operating cost. This ratio is presented inFigures III-15and III-16 for each transit grouping. Amajor influence on this measure is the amount of fareboxrevenue a system is able to generate, a function ofridership and fares.
This measure reflects a combination of passenger per mileand fare revenue trends. Over the five year period from1998 to 2002 all categories of transit systems saw this cost
recovery ratio decline. For many systems, this is due toincreases in cost that are outpacing any increases inrevenues. Often, personal wage and fringe benefitincreases were a contributing factor to the rise in costs.
In the downstate area this can be attributed to increasedexpenses associated with dramatic service increases,coupled with reduced revenue growth attributable toMetrocard pricing incentives. Despite record growth inriders, fare revenue did not keep pace with the expenses.New York City Department of Transportation(NYCDOT) private bus companies had the largestdecrease, 7.37 percent, in service economy. NYCDOTprivate bus’s decrease in service economy was due toincreases in fringe benefits and salaries that werepreviously mentioned, insurance cost increases due to theSeptemeber 11th attacks, and atypical costs due to repairsand parts due to the large amount of over-age buses.
The trend for downstate suburban bus also reflects theimpact of Metrocard, described above, where it has beenimplemented, primarily by MTA Long Island Bus. Butthe overall trend primarily reflects the cost for serviceincreases that have exceeded fare revenue resulting fromincreased ridership.
System Status Report
A detailed update on the status and performance of themajor transit systems in New York State follows. ThisSection will present an overview of trends in theperformance of major urbanized area transit systems.Each transit system section will describe ridership,service trends in the context of changing marketconditions and service initiatives, as well as ananalysis of service effectiveness, efficiency andeconomy over the five year period from 1998 to 2002.