chapter ii: emergence of a low-viscosity channel in...
TRANSCRIPT

II-1
Chapter II:
Emergence of a Low-Viscosity Channel in Subduction
Zones Through the Coupling of Mantle Flow and
Thermodynamics
Laura Baker Hebert, Paula Antoshechkina, Paul Asimow, and Michael Gurnis
For submission to Earth and Planetary Science Letters

II-2
Abstract
We couple a petrological model (pHMELTS) with a 2D thermal and variable
viscosity flow model (ConMan), to describe and compare fundamental processes occurring
within subduction zones. We study the thermal state and phase equilibria of the
subducting oceanic slab and adjacent mantle wedge and constrain fluid flux. Using a
Lagrangian particle distribution to perform thousands of thermodynamically equilibrated
calculations, the chemical composition of the domain is continuously updated. Allowing
the buoyancy and viscosity to be compositionally and thermally dependent permits a
consistent linkage between the effect of water addition to and flow within the mantle
wedge, leading to predictions as to the fate of hydrated material as subduction proceeds.
We present seven model cases that span normal ranges in subducting slab age, convergence
velocity, and slab dip angle. In all models, the coupling between the chemistry and the
dynamics results in behavior previously unresolved, including the development of a
continuous, slab-adjacent low-viscosity channel (LVC) defined by hydrous mineral
stability and higher concentrations of water in nominally anhydrous minerals and bounded
by the water-saturated solidus. The LVC develops due to fluid ingress into the mantle
wedge from the dehydrating slab, and can be responsible for slab decoupling, large-scale
changes in the wedge flow field, and a mechanism by which hydrated slab-adjacent mantle
material can be transported to the deep mantle. Changing model parameters indicate that
slab age and slab dip angle exert primary control over variations in LVC shape and
thickness, due to changing fluid release patterns within the slab. Slab convergence velocity
appears to exert a secondary control over LVC shape. Younger slabs tend to have thinner,

II-3
more uniform LVCs, while older slabs tend to have a thinner LVC at shallow depths with a
large increase in LVC thickness at ~100 km depth, followed by a gradual thinning deeper
in the model domain as material is advected down.
Keywords: subduction, low-viscosity channel, coupled models, Costa Rica, Izu-Bonin,
Mariana
1. Introduction
A complete understanding of subduction zones requires a model that accounts for
complex interactions between chemical and dynamic features of the system. Modeling that
addresses principally either the force balance or the chemistry, using results from one
direction to infer behaviors in the other, has succeeded in reaching broad conclusions as to
the manner of hydration of the mantle wedge and melting beneath the arc [1-7]. However,
when the thermal structure, viscosity, and the solid flow field are addressed within the
context of a fully coupled geophysical and geochemical model, emphasizing the
importance of interdependent contributions, more detailed interpretations can be made.
The evolution of dynamical quantities such as the flow field, entropy, and bulk
composition should provide input to thermodynamic calculations, which output
chemically-governed quantities such as melt fraction, compositional buoyancy, water
speciation, and latent heat contributions to the thermal balance. This forms an essential
loop where neither chemistry nor physics are independently evaluated. Indeed, it is the
dependence of one on the other that presents insights into the subduction system on a

II-4
fundamental level.
A particular part of the subduction system where strong coupling between mass and
energy flows and geophysical and geochemical processes is most important is the mantle
wedge adjacent to the slab. There is general agreement that fluids from the dehydrating
slab are introduced to the overlying mantle as the slab descends and that the pressure-
temperature path, chemical composition, and phase equilibria within the slab determine the
locations of water-rich fluid release [4]. The delivery of this water-rich fluid phase into
and interaction with the overlying mantle induces hydration reactions within the peridotite
and, where temperature is sufficient, water-fluxed melting [8]. Conventional steady-state
thermal solutions of subduction indicate that the slab-wedge interface is too cold for even
water-saturated melting of peridotite, so the fluids must somehow migrate into hotter areas
of the wedge in order for melting to begin [9]. However, the mechanism by which wedge
hydration proceeds and the pathways by which water-rich fluids are introduced to the sites
of melting remain speculative [2, 4]. Previous modeling studies have specifically
addressed the role of water in the subduction system together with dynamical
considerations, emphasizing the role of hydrous minerals in acting as transport agents
and/or sources of water and using phase diagrams for consideration of the peridotite
solidus. Davies and Stevenson [1] propose a model where water released from the basaltic
slab at 2.3 GPa is transferred into the wedge and stabilizes amphibole. Advection with the
solid flow field results in a net horizontal transport of water along the amphibole-out
boundary until the water-saturated peridotite solidus is crossed and melting begins. The
model of Iwamori [2] improves upon [1] by adding the potential stabilization of additional
hydrous phases within the wedge into the model. This method results in nearly all the

II-5
water expelled during primary dehydration from the altered oceanic crust being hosted
within a slab-adjacent layer of hydrated peridotite (serpentine and chlorite). Secondary
dehydration of this hydrated layer allows the formation of fluid columns leading to zones
of active melting. Arcay et al. [3], using non-Newtonian rheology, include the presence of
lithospheric serpentinite in the down going slab as a major contributor to the water budget,
and discuss a process by which the entire mantle wedge can experience hydration as the
slab subducts. However, these studies do not include a full evaluation of water stability in
nominally anhydrous minerals or changing bulk composition of the peridotite due to melt
extraction. In addition to contributing to the stability of hydrous phases and the initiation
of melting, the influx of fluid induces partitioning of hydrogen into defect sites within
nominally anhydrous minerals (NAM) such as olivine. Recent investigations introduce the
potential importance of these minerals in both the water budget and the dynamics of
subduction zones [10-12], and this study aims to improve upon previous modeling by
including water partitioning in NAM in the mantle wedge as the primary focus of a
coupled geochemical and geodynamic model which emphasizes the origination and
development of hydration features within the wedge in an internally consistent treatment.
There is a dual impact on the viscosity structure along the slab-mantle interface due
to temperature dependence and compositional dependence (water-weakening) [10]. The
implications of the reduction of viscosity of the mantle due to slab-related hydration have
been considered [13, 14]. For example, a low-viscosity mantle wedge has been shown to
have a substantial effect on the force balance in a subduction zone, and leads to observable
signals in topography, state of stress, gravity, and the geoid [13, 15]. The viscosity of the
wedge may be at least a factor of 10 smaller than the surrounding mantle lithosphere and

II-6
asthenosphere [13], consistent with estimates from seismic dissipation [16] and rock
deformation experiments [10]. The low-viscosity wedge potentially resolves the over-
prediction of back-arc basin depths by several kilometers [13]. In models that successfully
fit the observed geoid, the addition of a low-viscosity wedge changes the state of stress in
the over-riding plate from compression to extension [13]. Such a wedge may play an
important role in controlling the presence of back-arc spreading. While the importance of a
localized low-viscosity region in a subduction zone has been evaluated, the mechanism by
which it develops and its detailed geometry have yet to be considered.
We present GyPSM-S (Geodynamic and Petrological Synthesis Model for
Subduction), a self-consistent model that includes the thermodynamic minimization
algorithm pHMELTS [17-19], which takes into account water partitioning into nominally
anhydrous minerals, in conjunction with the 2-D thermal and variable viscosity flow model
ConMan [20] and a fluid migration scheme. Evaluation of properties such as the melt
fraction, fluid flux, the impact of water in NAM on the viscosity structure and overall flow
field, and spatial extent of fluids and melts within the subduction system are all
incorporated into GyPSM-S. It is important to mention that the overall structure of GyPSM
can be adapted for other tectonic regimes such as mid-ocean ridges (GyPSM-R, [85]).
2. Model Formulation
2.1.Component programs
The two primary component programs used within the GyPSM-S computational

II-7
scheme are (1) ConMan, a two-dimensional thermal and variable viscosity numerical flow
model [20], and (2) pHMELTS, a thermodynamic energy minimization algorithm that can
calculate water partitioning into nominally anhydrous minerals [17-19].
ConMan solves equations for incompressible buoyant viscous flow using the finite
element method (FEM) in two dimensions. While an extension to three-dimensional flow
is important to fully model variables that may contribute to along-arc observables, it is
beneficial to first consider the consequences of a two-dimensional approach. A penalty
formulation is used to enforce incompressibility in the solution of the momentum equation
[20]. The dynamics are controlled by conservation equations of mass, momentum, and
energy, with the Boussinesq approximation. The non-dimensional equations for mass and
momentum are:
∇⋅v'= 0 and (1)
∇ P'−∇⋅η' ∇ v' =RaT' k , (2)
where v' is the dimensionless velocity, T' is the dimensionless temperature, P' is the
dimensionless pressure, η' is dimensionless viscosity, and k is a unit vector in the
direction of gravity. The dimensionless Rayleigh number combines all the material
properties:
Ra=gαρΔTd 3
κη, (3)

II-8
where g is the acceleration due to gravity, α is the coefficient of thermal expansion, ΔT is
the temperature drop across the box, d is the depth of the box (Table 3), κ is the thermal
diffusivity, and η is the dynamic viscosity (Table 1).
The effects of latent heats of melting, hydration, and dehydration can be better
evaluated in pressure-entropy space, where an isentropic calculation can result in an
increase or decrease in temperature depending on melting or crystallization. Consequently,
compared to the normally-posed convection problem ConMan was designed to solve [20],
we have modified the energy equation such that entropy is advected instead of temperature.
Our non-dimensional energy equation is:
∂ S '
∂ t '=−ν '⋅∇ S '
C P'
T '∇ 2T ' , (4)
where S' is the dimensionless entropy, CP' is the dimensionless heat capacity, and t' is
dimensionless time. A streamline upwind Petrov-Galerkin method [21] is used to solve
(4). In the model formulation of GyPSM-S, we employ a near-fractional melting scheme
that accounts for the instantaneous removal of all melt above a certain residual porosity
(MINF, Table 1). Because of this, we do not allow the melt to subsequently interact with
or crystallize in the lithosphere, which negates the possibility of increases in temperature
there due to crystallization of melt.
For all of the results presented here, the computational grid consists of 2 × 10⁴
uniformly sized bilinear quadrilateral elements: 100 in the vertical direction and 200 in the
horizontal direction (20301 Eulerian nodes). All numerical experiments use the same

II-9
number of elements, and as such the different model grids have slightly different
resolutions from one to another, as the width of the model domain varies among
experiments. The dimensional grid resolutions and dimensions of the calculation domains
of all models are presented in Table 3.
The viscosity law is both temperature and composition dependent, as influenced by
water in nominally anhydrous minerals, specifically olivine [10]:
η '= ηη0
=exp [ QRT 0 ∗ T 0
T −1]∗ XH 2 O
XH 2 Ocrit−1
, (5)
where XH2O > XH2Ocrit, η0 is the reference viscosity, Q is the activation energy, R is the gas
constant, T0 is the model reference temperature, XH2O is the water content in olivine, and
XH2Ocrit is the critical value for water weakening (Table 1). The law was determined
empirically from experimental results for dislocation creep of hydrated olivine aggregates
[22] and is relatively simplistic, meant to account for a large range of pressures,
temperatures, and water contents well outside current experimental bounds. The possible
compounding effects of the hydration of other NAM are neglected in the viscosity
formulation. The viscosity of the thermal lithosphere and the slab depends on temperature
and has a maximum value of 1.0 × 1024 Pa s for the coldest regions (103 × reference
viscosity, Table 1). Within the models, we expect variations in temperature of 1500
degrees and water in olivine contents up to ~2000 ppm at the highest pressures. As such,
we observe that the viscosity law as stated results in a range of potential viscosities of 5.5 ×
1019 to 1.0 × 1027 Pa s (with the maximum value seen in the model results set at 1.0 × 1024
Pa s). This model maximum viscosity restricts the range of solid viscosities found within

II-10
the model to approximately 5 orders of magnitude (Fig. 1). For comparison, Kelemen et
al. [23] show that there is a variation in viscosity of three orders of magnitude from
temperature dependence alone.
The initial and boundary conditions within the model are summarized in Figure 2.
The subducting slab velocity as well as the velocity of all material subjacent to the slab is
kinematically imposed and the magnitude is dependent on the rate of convergence of the
model being calculated (Table 3). The velocity boundary conditions on the left-side and
the base of the wedge domain are imposed by an analytical solution for corner flow
(equation 4.8.23, [24]), while the velocities within the wedge itself are allowed to respond
dynamically. The top surface is isothermal (273 K), and the thickness of the over-riding
plate and the thermal age of the down-going slab define the initial thermal conditions
within the model. The initial particle distribution within the convecting portion of the
mantle is assigned a temperature based on a pHMELTS-calculated adiabatic gradient. A
prescribed potential temperature and an imposed adiabatic gradient on the sidewalls (Table
1) determine the temperature of incoming material for the duration of the calculation.
Specifically, temperatures and entropies along the sidewalls are fixed and determined by
independent pHMELTS calculations based on the position of the intersection of the
convective (adiabatic) asthenosphere with the conductive thermal lithosphere [80 and
references therein]. This explicit treatment of the thermal boundary layer discourages
melting of the peridotite immediately upon entering the model domain, and we do not
include decompression melting associated with a back-arc in any model. The initial
composition-space spanned by the model includes depleted peridotite solved for by
pHMELTS (with some supplemental calculations required where pressure and temperature

II-11
conditions restrict pHMELTS applicability, see below for discussion), hydrated altered
oceanic crust (AOC) within the slab, and hydrated lithospheric serpentinite also within the
slab. The latter two compositions are not solved within pHMELTS, but refer to phase
diagrams [25] for dehydration reaction locations within pressure-temperature space. This
is due to the fact that the calibration of pHMELTS does not encompass the full spectrum of
lithologies within the model domain. Within the slab, we impose a layered structure. The
first layer is composed of AOC (basaltic, 2 km, and gabbroic, 5 km) modeled after [25],
which treats the entire oceanic crust as basalt and gabbro of MORB composition (Table 2b)
and initially contains ~5.0 wt. % H2O. The second layer is composed of a serpentinite
lithology (5 km) and is modeled on the hydrated harzburgite phase diagram in [25],
initially containing 14.8 wt. % H2O. Within the wedge, we use an initial depleted
peridotite composition which includes an initial bulk water content of 110 ppm (Table 2a)
[26]. There is no K2O included, which effectively suppresses formation of mica within
pHMELTS, but results in a more realistic melt productivity. Equilibration of the original
peridotite composition, mass-normalized to 100.0 g, occurs at 3.3 GPa, 1424.56 ºC and fO2
= NNO, which is then used as the starting composition within the pHMELTS algorithm. In
selecting a single depleted mantle composition, we are not specifically accounting for the
range of source compositions presumably encountered within subduction zone wedges,
which can include depletion due to extraction of melt at a back-arc, or larger-scale mantle
source variations. While mineral-melt trace element partitioning is included, pHMELTS
cannot currently calculate trace elements within the fluid phase itself, making it impossible
to directly include the fluid-mobile trace element composition of the slab lithologies in the
fully-coupled experiments. Supplemental modeling done independently using GyPSM-S

II-12
results is required to address this (Chapter 3).
pHMELTS can be used to calculate water partitioning among hydrous minerals,
nominally anhydrous minerals, melt, and free water, and the effect of such partitioning on
melt productivity. The underlying thermodynamic model behind pHMELTS is pMELTS
[27]. This is calibrated for peridotite bulk compositions between 1 and 4 GPa. In
pMELTS, water is treated as an oxide component accommodated only in melt, vapor, or
hydrous mineral phases, whereas in pHMELTS the effects of storage of water in nominally
anhydrous minerals are approximately modeled [19]. The pHMELTS calculation uses
trace element partitioning to distribute water between the system-consisting of melt, pure
vapor, or hydrous minerals-and a hidden reservoir within the nominally anhydrous
minerals. Although the algorithms used to calculate thermodynamic equilibria are
powerful and generally reliable, especially when melt is present, there are situations where
they fail to converge to a correct solution. The pHMELTS starting solutions are carefully
constructed to avoid many of these potential pitfalls, but where they do occur, and also in
regions outside of the calibrated pressure-temperature-composition range of pHMELTS,
we use a heat-capacity polynomial formulation for entropy [28] with pMELTS-calculated
end-member parameters, in conjunction with an equation of state for water [29].
pHMELTS uses the Birch-Murnaghan equation of state for the melt phase, but a
polynomial expression for the solid volumes [28]. We do not allow the system to re-
equilibrate above 5.3 GPa, but use an extrapolation of the equation of state and the heat
capacity formulation of assemblages at 5.3 GPa that is continuous in volume and its first
derivatives. Liquids are only calculated at pressures below 4 GPa.

II-13
2.2.Code coupling and tracer particles
The adiabat_1ph interface to pHMELTS [17] uses scripts to invoke subroutine
versions of the (pH)MELTS program, which has the advantage over the graphical user
interface (GUI) version of allowing almost complete automation of the calculation process.
GyPSM-S uses an extension of adiabat_1ph that can be exploited with parallel processing.
Bulk density is computed by pHMELTS from the equations of state of the constituent
phases and the equilibrium phase assemblage and is a function of temperature, pressure,
and composition. The latest estimates of water solubility in olivine are included [30].
The component programs are executed and controlled by scripts governing the
parallel computing process (Fig. 3). Within GyPSM-S, quantities such as temperature,
entropy, volatile content in nominally anhydrous minerals, and water content are passed in
a loop structure which includes the component programs until the model reaches a state
independent of its initial conditions. A network of Lagrangian particles, acting as chemical
tracers, provide iterative feedback among the component programs and are advected within
ConMan using a predictor-corrector method [31]; for one convective overturn (about twice
the residence time of a particle in our calculations), the particles accumulate a spatial error
O(10-5). The particle set includes an initial distribution of approximately 4 × 10⁴ particles
(Fig. 4a), with four particles randomly introduced per element within the area of interest
and one particle per node in rigid regions and in regions of relatively uniform bulk
composition (beyond the extent of water introduction from the slab). In areas where single
particles are on the nodes, because of the uniformity of bulk composition and the
redundancy of pHMELTS calculations, we do not allow the particles to advect with the

II-14
flow field (Fig. 2a). We chose this particle distribution in order to maximize computational
efficiency and minimize errors due to interpolation and interference with boundaries (see
below).
Particles within the model have several different compositional "tags" that
determine lithology. As the experiment proceeds, the particles can be advected across the
boundaries of the model domain. In order to keep a uniform particle density, new particles
are added at the boundaries (the right sidewall and the interface between high and low
particle densities, Fig. 2a) as older particles are advected out of the model domain. The
temperature of new particles is interpolated from fixed boundary values along the
sidewalls. The criterion for adding particles is a particle summation test within the
elements along the boundaries. If an element has become empty, then four more particles
are introduced in a random configuration within that element. The type of particle added is
appropriate to its initial position: peridotite within the wedge (for particles entering the left
boundary within the convecting region and along the right sidewall beneath the 12 km
hydration depth), AOC (for particles entering along the right sidewall within 7 km of the
top of the slab), and serpentinite (for particles entering along the right sidewall between 7
km and 12 km from the top of the slab). Throughout the computation, the wedge remains
well-resolved (Fig. 4b). Encroachment of streamlines against the interface between the
convecting and rigid parts of the mantle results in the necessity for a random "kick" given
to particles to prevent clumping. Each peridotite-composition particle is associated with a
full pHMELTS calculation, translating into thousands of thermodynamically equilibrated
calculations per iteration. This allows for a continuously updating dataset and a strong
chemical feedback mechanism into the dynamics, provided by particle-to-node and node-

II-15
to-particle interpolations at each time step. The particle-to-node step is performed using a
triangle-based linear interpolation scheme for smoothly-varying quantities such as
temperature, but a bilinear scheme for interpolation of available fluid (particles in the four
surrounding bilinear quadrilateral elements all contribute an area-weighted value to each
node) in order to conserve mass. The node-to-particle step is performed using a bilinear
interpolation method (area-weighted value at the particle position within an element
calculated from quantities at the four surrounding nodes). It has been suggested that, for
area-weighted bilinear methods, 5 particles per element represents the optimal load for
high resolution interpolation [32]. We tested three interpolation methods (bilinear,
triangle-based linear, and bi-cubic triangulated) with particle densities of up to 9 particles
per element and ultimately chose to use 4 particles per element as the slight improvement
in resolution presented by the increased particle density was offset by the high
computational cost (pHMELTS). Over the model duration, there is a slight numerical
diffusion that results in overall cooling of tens of degrees due to the interpolations. This
appears to be unavoidable, and we have chosen the scheme and particle distribution that
minimizes it while maximizing computational efficiency. Errors in temperature are highest
in areas of high thermal gradients, namely in the wedge corner and along the slab interface,
and the triangulation scheme appears to perform best at minimizing errors in these areas.
Prior to coupling, the finite element program is used independently (with only
temperature-dependent viscosity) to achieve a quasi-steady-state thermal structure
(approximately 56 million years of subduction); this is then used as our thermal initial
condition for the coupled GyPSM calculations. These nodal values for temperature are
interpolated onto the particle set, with pressure and compositional information (e.g.,

II-16
depleted peridotite, altered oceanic crust, lithospheric serpentinite, etc.), including initial
water content, being assigned (or "tagged") based on the position of each particle within the
dimensional domain (200 km depth, variable width, see Table 3, Fig. 4a).
This first set of pHMELTS calculations involves an isothermal thermodynamic
minimization: inputs being temperature and pressure, and outputs being entropy and water
content in nominally anhydrous minerals, along with chemical information such as melt
presence and composition, water content, trace element abundance, solid phase mode and
mineral compositions, and melt and solid density. Each subsequent pHMELTS calculation
will be isentropic. At each ConMan timestep, the chemical information is returned to the
FEM, influencing the viscosity and energy fields. The appropriate particles move with the
updated velocity field, into a new pressure-entropy state, which then becomes the condition
sent to the next set of pHMELTS calculations. The energy equation is an advection-
diffusion formulation in entropy terms, dependent upon the temperature state of the system.
Key variables are updated accordingly, including the water content in nominally anhydrous
minerals and the density of the residue. The total duration of the coupled computations in
dimensional model time are typically two to five million years of subduction. This is
sufficient to approach a state independent of initial conditions, judged by the complete
progression of original particles from the top of the model slab to its base.
We use a near-fractional melting scheme, employed such that after every iteration
all but a small residual porosity of melt (MINF, Table 1) is instantaneously removed. As
the equations governing the finite element calculation assume incompressibility and single-
phase flow, we do not allow the removed melt to interact with the remaining solid residue
(amounting to an assumption of perfect chemical isolation of migrating melts).
II-17
Additionally, we do not account for any impact the remaining porosity has on the solid
flow field or the viscosity. However, a small but finite residual porosity helps to stabilize
the pHMELTS calculation. Melt extraction depletes the residue (changes the bulk
composition of sources for future melts), which changes the solidus temperature. When a
packet of mantle peridotite residue (that has experienced melting due to fluid fluxing) is
advected along slab-parallel streamlines, encountering new fluid sources from the slab, the
temperature of the solidus of the residue should be slightly higher than for the original
peridotite composition, influencing where melting will initiate (Table 2a). In order to
account for this, pHMELTS retains knowledge of the changing bulk composition of each
particle. The bulk composition of the residue, plus any residual liquid, is re-summed to
100.0 g of material so that the extensive quantities calculated by pHMELTS (such as
entropy and volume) can be readily incorporated into the finite element model, which deals
with intensive quantities (such as density).
2.3.Water migration
The hydrated slab is progressively dehydrated as it moves deeper into the mantle,
with slab particles advected into increasing temperature and pressure conditions. We use
the hydrous mineral stability calculations of [25] to approximate the amount of free water
liberated from slab hydrous mineral phases upon crossing univariant reactions, solving for
slab dehydration during subduction as thermobaric conditions change. We assume an
initial hydration depth into the slab of 12 km, including both an AOC layer and a
lithospheric serpentinite layer, as mentioned previously. A serpentinite layer has been

II-18
observed in Alpine ophiolites [33, 34] and seafloor exposures and is presumed to be
formed by the introduction of fluids at the ridge crest or along normal faults occurring
during plate bending [35]. We do not, however, include a sediment layer, assuming that
most sediment water is lost to compaction early in slab descent [79]; sediments probably do
not contain enough water to be significant water sources at these depths [36]. However,
this assumption disallows sediment melting, which may be significant in certain
subduction zones as sources of chemical slab tracers [37]. We assume that the initial state
of the slab is water-saturated, resulting in an immediate vertical flux of water into the
wedge (running the model long enough so that this initial transient is passed). There is the
possibility that temperature changes associated with phase changes, melting, or
hydration/dehydration reactions in the mantle wedge can progressively heat or cool the
slab, influencing the flux of water at each subsequent iteration. However, because we rely
on phase diagrams to predict reactions within the AOC and serpentinite lithologies, we
cannot directly account for the thermodynamics of slab dehydration reactions within the
model. We do account for the movement of entropy with the fluid phase.
The evolved pure water (water that is not bound by NAM, melt, or hydrous phases)
is advected vertically by Darcy's law, taking into account the estimated domain
permeability:
vwater−v solid = KgΔρηW
and (6)
K=d m
2 φn
C, (7)
where K is the permeability, dm is the characteristic spacing of transport tubules (on the
order of grain size), φ is the mean fluid fraction, Δρ is the density difference between fluid

II-19
and solid, ηW is the fluid viscosity, n is a constant parameter indicating the type of pore
geometry, and C is a geometrical constant [38] (Table 1). We estimate the fluid velocity to
be approximately 2 × 10⁻⁸ m/s (63 cm/yr) with the current parameters. The choice of n = 2
includes a fundamental assumption that flow is occurring within an isotropic network of
cylindrical pores of uniform size. Experimental investigation of natural systems indicates
that the pore geometry may differ significantly from this idealized case in natural systems,
with n = 3 [39, 40], and may be anisotropic [41]. The simplifications used in our models
can be justified by the lack of information available for conditions at depth. However, we
consider the range of fluid velocities dependent on grain size and on the value of n to
assess the impact on the model results. Changing n from 2 to 3 effectively extends the
time in which it takes water to migrate through the LVC to reach the zone of active
melting, however, the LVC geometry and the orientation of the zone of active melting
remain the same. At each iteration (dimensionally ~8,000-14,000 years), we assume that
chemical equilibrium between the fluid and the solid matrix is attained, such that the water
may be bound in nominally anhydrous minerals or in hydrous minerals such as chlorite
and/or amphibole, or freely move through water-saturated regions up into the hotter regions
of the wedge, where it may be partitioned into a melt phase. We do not account for the
solubility of silicate components in our hydrous fluid, which may be of importance to
phase relations, as the second critical endpoint beyond which H2O-rich fluids and silicate
melts forms a single supercritical phase exists within the bounds of our models
(approximately 3.8 GPa and 1000 ºC) [42].
2.4.Model input parameters

II-20
Subduction parameters such as slab convergence velocity, slab dip angle, and slab
thermal age vary on Earth over ranges of 10-100 mm/yr, 10-70º, and 10-160 Ma,
respectively [43]. To evaluate the role of changing physical characteristics on the thermal
and chemical development of the LVC, we have varied the subduction variables (Table 3)
convergence velocity, slab dip, slab thermal age, and crustal thickness among seven
models, spanning significant ranges of convergence velocities (47.5-90 mm/yr), slab dip
angles (30-60º), and slab thermal structures (incoming plate age 15-165 Ma). Four of the
models are immediately applicable to two geographical regions (and two sub-regions
within each): (i) the Costa Rica-Nicaragua segment of the Central American subduction
zone and (ii) the Izu-Bonin-Mariana subduction zone, and the model results can be used to
specifically match physical and chemical datasets.
The Central American subduction zone involves relatively young lithosphere (15-
25 Ma) of the Cocos Plate subducting beneath the Caribbean Plate [44]. The convergence
rate increases slightly towards the southeast, but the primary difference between the
Central Costa Rican (CCR) and Southeastern Costa Rican (SCR) models is the slab dip,
which changes from 45º to 30º, respectively. The Izu-Bonin-Mariana (IBM) subduction
zone involves relatively mature lithosphere of the western Pacific Plate subducting beneath
the eastern Philippine Sea Plate [45], allowing us to evaluate the possible effects of a
significantly older slab and a slower convergence rate, as compared to the CCR and SCR
cases. The primary difference between the Northern Izu-Bonin (NIB) and Northern
Marianas (NMAR) models is the slab dip, which changes from 45º to 60º, respectively.
Model ADD1 addresses fast subduction of an older plate, while ADD2 is a slow-

II-21
subducting young plate. Model ADD3 involves slow subduction of a mature slab with a
thicker overlying lithosphere. All additional models have slab dips of 45º, allowing an
evaluation of slab age and slab convergence velocity at a constant dip angle (compared
with models CCR and NIB).
3. Model Results
3.1.Development of the low-viscosity channel and controls on its shape
For a young, moderately fast subducting plate, we summarize the results for the
process of slab-adjacent mantle wedge hydration (Fig. 5). The pressure-temperature path
of the descending slab allows the release of water in distinct locations along the slab
surface (Fig. 5c), corresponding to the crossing of dehydration reaction boundaries [25] of
particles within the basalt-gabbro and the serpentinite layers (within the slab). At the early
stages of this model, the majority of the shallow water release (< 100 km) is due to
reactions within the AOC layer (jadeite lawsonite blueschist → lawsonite amphibole
eclogite, lawsonite amphibole eclogite → amphibole eclogite, and amphibole eclogite →
zoisite eclogite) [25]. Reactions within the serpentinite layer account for fluids coming
from ~110 km depth (rock containing serpentine chlorite brucite → serpentine chlorite
dunite; lithologic descriptions from [25]) and from ~170 km depth (chlorite harzburgite →
garnet harzburgite) [25]. As the initial fluid transient dissipates, the primary sources of
fluid become shallow sources within the AOC (60-80 km depth) and a source around 140
km depth within the serpentinite layer (chlorite harzburgite → garnet harzburgite). The

II-22
flux of water from the slab interacts with the nominally anhydrous minerals (NAM) such as
olivine, pyroxene, and garnet in the overlying wedge. There is a substantial increase in the
water content of these minerals in a region of the wedge adjacent to the slab (Fig. 5c).
Through the viscosity formulation (Eq. 5), this creates a strong variation (a reduction of 10-
100 times, due to water-weakening) in wedge viscosity within ~25 kilometers of the slab
surface (Fig. 5d). Despite discontinuous point sources of water influx, the low-viscosity
zone is extended into a continuous layer that is further advected downward by entrainment
in the slab-dominated velocity field. Ultimately, the low-viscosity layer extends from 50
kilometers depth to the base of our model region (200 km) and results in a non-uniform
low viscosity channel (LVC) (Fig. 5f). The difference in hydration between the ambient
mantle wedge and the LVC increases with depth, leading to a strong variation in viscosity
that extends perpendicular to the slab. There is a lack of fluid release at the highest
pressures beyond the initial transient (in contrast to other models, see below) that results in
an LVC thickness at 200 km that is primarily a result of advection of hydrated material
from lower pressures, thinned slightly relative to the LVC at lower pressures directly above
the fluid sources. The flow field changes with the development of the LVC as seen in the
difference in the streamlines within the wedge (Fig. 5a versus Fig. 5e). There is a stronger
component of upward flow across the boundary between the nominally anhydrous mantle
wedge and the hydrated LVC.
In addition to the hydration of NAM, there is the concurrent appearance of hydrous
phases within the hydrated region of the slab-adjacent wedge. Amphibole appears at
pressures below 2.1 GPa, and chlorite appears as a stable slab-adjacent phase at pressures
from 2.0 GPa to ~5.3GPa, where chlorite breaks down by the reaction clinochlore +

II-23
enstatite → forsterite + pyrope + H2O [46-48], leading to a continuous hydrous phase layer
above the slab surface and below the 1000 K isotherm within the wedge (Fig. 6a). Small
amounts of deep chlorite (> 5.3 GPa) are an artifact of pHMELTS not including a high-P
hydrous phase such as Mg-sursassite or phase A. An evaluation of the position and extent
of melting reveals a localized slab-adjacent region of hydrous melt production formed by
water-fluxed wedge melting that extends deeper than 100 km. Instantaneous low-degree
fractional melts bound the top of the LVC (water-saturated solidus). Water transport
occurs solely within the hydrous fluid phase, and therefore, as melting initiates, and water
partitions strongly into the melt phase, the activity of water drops below unity and the fluid
phase disappears, preventing further transport of water and additional flux melting. The
region of melting is therefore thin (~6 km) as measured normal to the LVC surface and is
restricted to the top of the LVC, but displaced from the slab-wedge interface due to the
thermal structure. In areas with quasi-continuous dehydration from the slab, the melting
region is oriented at a slight angle to the slab-wedge interface with depth, as progressive
depletion of the advecting slab-adjacent mantle by melting results in a displacement of the
water-saturated solidus further into the wedge to higher temperatures. Indeed, melt
initiation provides the limitation on the geometry of the hydrated region as demonstrated in
a comparison calculation with the silicate liquid phase suppressed in pHMELTS (Fig. 6c).
If melting is suppressed, fluid continues to react with the wedge peridotite, hydrating NAM
and moving through the wedge until it enters the overlying rigid lithosphere. A sharp,
upper boundary (Fig. 6b, c) is imposed to prevent water from entering low-temperature and
low-pressure regions where pHMELTS is not stable.
The development of a low-viscosity channel within a subduction zone is a

II-24
consequence of the dehydration of the subducting slab and progressive hydration of the
overlying mantle wedge below the water-saturated solidus. The thickness of the LVC is
determined by the thermal structure of the wedge, in that initiation of flux melting
effectively restricts further transport of fluid in a hydrous phase within the system and
forms an upper boundary to the hydrated low-viscosity region, controlling the channel
geometry. We do not observe hydrous phases (amphibole and chlorite) restricting water
transport as a fluid phase to the active melting region. If melting is not present within the
wedge, for whatever reason, then a low-viscosity "wedge" geometry may prevail. Due to
our assumption of purely vertical fluid flow, initiation of melting appears discontinuous,
controlled primarily by the spatial position of water influx, and the presence of active
melting can be transient, depending on a consistent influx of water. As mentioned earlier,
we do not include a back-arc spreading region, and take care to avoid melting of the
peridotite source prior to its introduction into the wedge corner. Latent heat of melting
results in net cooling of the residue before turning the corner in the wedge, potentially
counter-acting the incorporation of temperature-dependent viscosity variations, which
allow for higher slab-adjacent temperatures than an isoviscous rheology [45].
3.2.Model comparison (Table 3)
The influence that slab age and convergence velocity have on the LVC and flow
geometry are illustrated with four models at a constant slab dip angle (45º) with different
slab ages (18 Ma versus 135 Ma) and different convergence velocities (50 mm/yr versus 87
mm/yr) (Fig. 7). LVC shape changes substantially with changing subduction parameters.

II-25
The cases involving a younger slab have thinner, more uniform LVCs. Cases involving
older slabs show a very different geometry: a very thin LVC at shallow depths and a large
increase in LVC thickness around 100 km depth, followed by the gradual thinning of the
LVC towards 200 km depth as the hydrated material is advected out of the model domain.
The abrupt truncations at the base of the LVC (Fig. 7a, b) at 220 km from the trench (x-
axis) are due to a change in particle distribution (Fig. 2a), and the upper limit of fluid
migration (Fig. 7b) is imposed by the position of the overlying lithosphere. The thick
hydrated envelope in models with older, colder slabs originates from stronger fluid sources
at greater depths than the models with young, warm slabs, which rely on fluid sources from
the slab at < 130 km depth. In the case of the older slabs, the streamlines show a marked
kink upwards as they cross the thick region of lower viscosity, and the temperature
structure is also decidedly influenced, resulting in significant cooling associated with zones
of melting. This is a consequence of the latent heat of melting. In regions of high water
flux at higher pressures, which occur in models with colder thermal structures due to
subduction of older slabs, the melting column is longer, and time-dependent cooling of the
wedge occurs. This results in an upward retreat of the water-saturated solidus and an
extension of the fluid pathways, allowing fluid from dominantly serpentinite lithology to
interact with a shallow melting region. Over time, the zone of melting retreats vertically
and stalls below the thermal lithosphere, reducing to direct fluid transport into the
overlying lithosphere (similar to the water transport columns of [2]) and melting restricted
to the edges of the hydrated region (Fig. 9). The differences in the LVC shape among the
models with younger slabs (and likewise among the models with older slabs) can be
attributed to variations in slab velocity. Increasing convergence velocity with other

II-26
parameters held relatively constant results in a colder thermal regime, and so changes the
locations of dehydration reactions within the slab. For the younger slab models, there is
melting at 100 km depth in both models as a result of the dehydration of lithospheric
serpentinite (chlorite harzburgite → garnet harzburgite), but additional releases at lower
pressures (50 mm/yr convergence) and at higher pressures (87 mm/yr convergence)
determine the overall shape of the LVC, with the model with more rapid convergence
velocity having a slightly thicker LVC due to the deeper fluid release. In terms of
comparing lateral variations in viscosity at higher pressures, the slower converging case
then involves a greater contrast between the ambient nominally anhydrous mantle wedge
and the LVC due to the thinner LVC shape. The overall thinning at higher pressures is a
result of the continuation of the LVC solely by advection of hydrated material down-dip,
without strong additional fluid sources. For the more mature slab models, the case with the
faster convergence velocity likewise involves a slightly deeper fluid source and a
somewhat thicker LVC at the base of the model domain. Notably, this is reflected in the
position of the melting region (Fig. 9) in that melts for the faster converging case are
further down-dip from the trench.
Slab dip has a major control on the geometry of wedge hydration. Models
comparing variations in slab dip from 45º are shown in Fig. 8. Fig. 8a and b compare a
slab dip shallowing from 45º to 30º, with all other parameters remaining relatively
constant. Fig. 8c and d compare a slab dip steepening from 45º to 60º, again with all other
parameters remaining relatively constant. The primary observation with regard to the
shallowing of the slab dip angle is that while the uniformity of the LVC remains, the
thickness of the LVC increases. In the case of the steepening slab dip, the fluid pathways

II-27
become closer to slab-parallel, decreasing the thickness of the LVC along the slab and
resulting in a sharp thinning of the LVC at 200 km depth, leading to large lateral variations
in viscosity as the overprinting of the cold boundary layer adjacent to the slab is not as
extensive as in other models. While deep fluid sources are influencing shallower melting
via a long fluid pathway, the melting region is closer to the trench due to the near-slab-
parallel fluid trajectory, reflecting a narrower trench-perpendicular region of melting. The
locations of fluid release remain relatively constant throughout the experiment, except for
the initial transient.
Instantaneous melt fractions in all cases are low (<1%) (Fig. 9) as a consequence of
the size of the time-step between extractions (and therefore the corresponding change in
pressure and addition of water). However, using residual compatible trace element
abundances to map cumulative melt fraction results in total melt fractions of up to 20%,
comparable to petrological estimates of arc magma fractions. The shape of the
instantaneous melting region is complex, as melting relates closely to the positions of fluid
release from the slab, and is thin, as a function of our fluid migration scheme (vertical
transport, water transport in a hydrous fluid only). However, for a batch melting case, the
melt layer can be more continuous and the thickness of the melting region will increase.
The influence of the latent heat of melting on the thermal regime (and slight additional
cooling due to numerical diffusion from the interpolation algorithms) within the wedge is
to thicken the LVC (Fig. 9g-i). Specifically, the position of the melting region produced
by fluid releases at high pressures transits vertically into the wedge as the wedge cools,
leading to longer fluid pathways. The displacement of the solidus could be exaggerated by
the presence of prior depletion due, perhaps, to melting at the back-arc, and would result in

II-28
even thicker LVCs.
The thickness of the LVC is related to the distribution and magnitude of fluid
resulting from dehydration reactions within the slab (a function of the slab age and
convergence velocity), to the degree of melt extraction (cooling and prior melt depletion
due to flux melting or to potential back-arc spreading), and to the slab dip angle. The
variations in shape of the LVC indicate that changing slab thermal age and slab dip angle
exert a primary control over the degree to which the slab is viscously decoupled from the
overlying wedge, judging by the continuity of the LVC along the length of the slab and the
extension of the hydration region into the wedge. Changing convergence velocity exerts a
secondary control, mainly in terms of variations in LVC shape and position of the melting
region within the wedge. Subduction of older slabs emphasizes shallow melts from deeper
fluid sources (serpentinite). Steeper-dipping slabs (> 45º) allow for melting regions closer
to the trench. Shallower dipping and younger slabs emphasize shallower melts and
shallower fluid sources (AOC). As the AOC and serpentinized lithosphere have different
fluid-mobile trace element chemistries, fluids from different sources should manifest
themselves in different trace element patterns in arc lavas from different regions (Chapter
3). Additionally, the greater extent of the low-viscosity region in ADD1 and NIB
(subduction of older, colder slabs) has a significant impact of the force balance,
manifesting itself in geophysical observables such as the geoid, gravity, and topography
(Chapter 4). Despite differences in shape, the development of the spatially-restricted LVC
geometry occurs across the range of model parameters evaluated.
4. Discussion

II-29
4.1.The low-viscosity channel (LVC)
In all models we observe the development of a spatially-restricted layer of
hydration present continuously along the slab-mantle interface. This layer can extend from
the slab-wedge interface vertically into the wedge to the overlying lithosphere, up to 100
km in some cases (Fig. 10), and is comprised of hydrous phases (chlorite and hornblende)
and nominally anhydrous minerals with high water contents (olivine up to ~1400 ppm,
clinopyroxene up to ~5700 ppm, orthopyroxene up to ~2800 ppm, and garnet up to ~600
ppm as the solubility of water in NAM increases with pressure). As there is a fundamental
assumption of a pure water phase, we can discuss water contents in terms of solubility, as
opposed to storage capacity. This layer is responsible for a large reduction in viscosity (101
to 102 ×) due to water-weakening along the slab, and can therefore be referred to as a low-
viscosity channel (LVC). The development of the specific geometry of the LVC is
affected by slab age, convergence velocity, and dip angle through the specific pressure-
temperature evolution of the slab, resulting in differing dehydration patterns for different
subduction parameters. The hydrated layer defining the LVC is initiated and thickened by
fluid release from the slab and is also advected downward with the slab-dominated velocity
field, resulting in a continuous extension of the hydrated layer along the slab-mantle
interface. This smearing out by the sub-solidus flow in the wedge counteracts the
discontinuous pattern of water release from the slab. Our models are restricted in vertical
dimension due to the pressure limitations of pHMELTS, but we observe the persistence of
the hydrated layer to the base of our domain, and reasonably assume that it can persist

II-30
deeper. The increasing solubility of water in olivine with pressure may allow for an even
greater influence on viscosity with depth, assuming that the slab has not been completely
dehydrated. Indeed, for models with subduction of older slabs, the lithospheric serpentinite
layer still contains as much as 6.8 wt. % H2O as it exits the model domain. The peak water
content in NAMs in the LVC, as it reflects a water-saturated zone, is primarily a reflection
of the solubility of water at a particular temperature and pressure, and therefore the peak
hydration does not vary significantly among the models tested. The extent of the LVC into
the mantle wedge is governed by the position of the water-saturated solidus within the
specific thermal structure defined by the subduction parameters of a particular model and
the degree of melt extraction and prior depletion. As soon as melting initiates, the activity
of water drops as water is strongly partitioned into the melt. In the absence of a hydrous
fluid phase, water transport ceases, and melting is restricted to a thin zone immediately
above slab fluid sources.
We do not see the formation of Rayleigh-Taylor instabilities (cold diapirs) along
the surface of the hydrated LVC, in contrast to [49], because of lower density contrasts
across that boundary predicted by our models. There are like to be two reasons for the
lower density contrasts. Firstly, we do not include a very low-density sediment layer in our
slab lithology and do not assume mechanical (solid) mixing between slab lithologies and
the overlying mantle wedge peridotite (which decreases the density of the hydrated
peridotite and therefore increases the density contrast between that hydrated layer and
anhydrous peridotite above it). Secondly, we do not observe the presence of serpentinized
wedge peridotite against ambient nominally anhydrous peridotite. The position of the
hydrated peridotite solidus in pHMELTS is sufficient to allow some distance between the

II-31
upper stability limits of the hydrous phases and the water-saturated peridotite solidus.
Compositional limitations within pHMELTS result in a restriction in the range of hydrous
minerals that can be stabilized in the wedge. Along the slab interface, pHMELTS
stabilizes hornblende at lower pressures and chlorite at higher pressures (Fig. 6a). There is
residual amphibole present in the shallowest melt source regions, but along the majority of
the slab surface, chlorite is the only stable hydrous phase and is restricted to within ~10 km
of the slab surface due to breakdown above 1000 K. Coincident with the sharp drop in
water content along the top of the LVC boundary, we observe slight density contrasts
increasing from water-saturated peridotite in the LVC to ambient nominally anhydrous
peridotite (Δρ ~ 20-50 kg/m3), which are much less than those predicted by [49] for the
diapir-source region ("mixed" hydrated layer vs. anhydrous peridotite) along the top of the
slab. The thermal conditions of our model predict a much thicker hydrated channel before
water-saturated melting begins. Therefore, we never see fully-serpentinized (implying
stability of chrysotile and antigorite) mantle lithology adjacent to the nominally anhydrous
region above it. Finally, the hydrated channel in our models is capped by the initiation of
melting. At lower pressures (~1.5 GPa), melting of a fully-saturated assemblage results in
a higher density residue and a lower density melt phase. The residue density is comparable
to the anhydrous density, but is slightly lower. At higher pressures (~4.0 GPa) there are
even smaller density contrasts between fully-saturated peridotite and residues of melting.
The low density contrasts across the top of the LVC compared to the contrasts of [49]
across the top of their thinner hydrated layer ultimately inhibit the formation of Rayleigh-
Taylor instabilities in this model at the pressures evaluated.
Iwamori [2] presents a numerical model that describes the generation and migration

II-32
of fluids from the slab with consequent equilibration with the overlying convecting mantle
solids, producing hydration and melting. Similar to our results, there is a stable slab-
adjacent layer of chlorite within the wedge and a displacement of the region of melting into
the wedge. In contrast to our results, their chlorite layer [2] is able to absorb the majority
of the water released from the slab and dehydration of the chlorite around 150 km depth
allows for a singular fluid source, transporting water to the melting region. Our results,
which include consideration of water stability in NAM, indicate that fluid is able to both
hydrate the slab-adjacent layer of chlorite and an overlying thickness of NAM. Successive
fluid flux through this saturated zone produces melting at multiple depths within the
wedge, ultimately producing a discontinuous slab-parallel melting region that is displaced
into the wedge. Our melting region looks very similar to the disequilibrium transport case
of [2], in which water is allowed to "leak" from the slab-adjacent hydrated layer at depths
less than 150 km.
Independent of results presented here, time-dependent models of subduction with a
parameterized wedge viscosity show that slab dip can be substantially influenced by a low-
viscosity channel geometry with a thickness of tens of kilometers and a viscosity contrast
of a factor of two [50]. In such models, a low viscosity channel generally leads to
increased slab dips as the suction force drawing the slab upward is reduced. Our model
provides a self-consistent mechanism to generate such a low-viscosity channel geometry,
however, we are unable to demonstrate the effect changing slab dip would have on an
existing LVC because we did not include dynamical feedback to the slab. We can estimate
the effect that a changing slab dip may have based on our model results encompassing a
range of slab dip angles. Initiation of subduction at a shallow dip angle would result in a

II-33
continuous LVC to at least 200 km depth of roughly uniform thickness. If the formation of
this LVC leads to increasing slab dip angles [50], the LVC would most likely remain as a
continuous channel, but the thickness may change, and, more importantly, the positions of
the melting region within the wedge would change. This may lead to observable increases
in lava flux from the volcanic arc as melts are produced further from the trench initially
(perhaps feeding the rear-arc), and then closer with time as the slab dip angle changes. The
trenchward progression could also be mapped by signals in fluid-mobile trace elements
consistent with lithospheric serpentinite dehydration as opposed to dehydration from AOC
proceeding from the rear-arc to the volcanic front with time (Chapter 3).
Although we do not specifically include prior melt depletion at a back-arc into
GyPSM-S, we note that it can potentially impact the character of melts produced in the
models with time as a function of position in the mantle wedge. For example, considering
subduction of an older, cold slab, the melting region influenced by the deep fluid sources
changes position in the wedge with time, driven by cooling of the mantle wedge due to
latent heat of melting (Fig. 11). At the beginning of the experiment, the source region for
these melts is relatively fertile. There is a displacement of the melting region into the
wedge away from the residues of the shallow melts traveling along the slab-parallel flow
field, and therefore no prior source depletion due to episodes of flux melting earlier along
the streamline. Additionally, the position of these melts in relation to the flow field and
potential prior depletion from the back-arc melting region implies that they are relatively
fertile as well. As the experiment continues, the deep-sourced melting region shallows,
and while the fluid-mobile trace elements are still consistent with a deep source
(serpentinite), the extent of potential prior depletion due to a back-arc increases, potentially

II-34
changing the values of trace element indicators such as Zr/Nb with time. Shallowing of the
deep-sourced melting region also produces even greater depletion signatures for the
shallow-sourced melts, as the two melting regions are aligned along streamlines within the
wedge.
Our use of pHMELTS allows for a self-consistent application to the problem of a
changing bulk composition (source depletion) due to melting and for the partitioning of
water into NAM. Hydrous phases such as amphibole and chlorite are present, but do not
dictate the transport of fluid to the active melting region, and while they act as effective
"sponges," they do not inhibit the flux of a hydrous fluid phase. Instead, fluid migrates
vertically into the wedge, progressively saturating a layer of NAM and hydrous phases. As
mentioned previously, we do not see the stability of hydrous phases up to the zone of
active melting except in the case of very low pressures. Once the layer is saturated, water
can move through to the melting region (water-saturated solidus of peridotite), where it is
partitioned into the melt phase and effectively removed from the system.
4.2. Water mobility: recycling to deep mantle and timing of transport to active melting
region
The formation of enriched mid-ocean-ridge basalts (E-MORB) at normal mid-ocean
ridges hints at the presence of chemical heterogeneities in the mantle which may have been
generated by recycling of material at subduction zones [51-55]. Geochemical arguments
exist for the relative importance of the slab-adjacent mantle, metasomatized by either slab-
derived fluids or small-degree slab melts, rather than recycled oceanic crustal materials or

II-35
sediments themselves [52, 53]. Analyses of basaltic glasses from the mid-Atlantic ridge
(MAR) near the Azores reveal evidence (high δ18O, La/Sm, Ce/Pb, and 87Sr/86Sr and low
143Nd/144Nd) for an enriching agent [52]. However, bulk incorporation of sediments or
altered oceanic crust to the ridge melting source region will not reproduce observed
geochemical trends [52]. A two-stage model of the slab-adjacent mantle, modified by
either fluids or slab-derived small-degree melts, and then mixed with ambient mantle to
form a mixed, enriched source region for partial melting allows for erupted E-MORB lavas
with major element systematics similar to normal MORB, isotopic ratios reflecting long-
term enrichment of the source region, and the required trace element fractionations and
concentrations [53]. Additionally, high lithium isotope ratios in enriched East Pacific Rise
lavas may be explained by enrichment by fluid-modified recycled wedge material instead
of altered oceanic crust itself [36]. The slab-adjacent mantle is carried down with the
subducting slab, but, as opposed to altered oceanic crust, may be more efficiently mixed in
with ambient upper mantle to produce enriched source regions for normal upwelling and
melting beneath ridges.
In these models, the LVC emerges as a stable zone of fluid-modified slab-adjacent
mantle material and trapped low-degree melts that is transported with the slab-dominated
flow field, presumably to depths beyond our model region, where it may, at some point,
separate from the denser oceanic crust and mix with surrounding upper mantle material.
The persistence of the LVC to great depths is due to it being spatially limited by the water-
saturated solidus. As the subducting slab descends, although water solubility in NAM
increases, the pressure-temperature path of the LVC will not cross the solidus, allowing a
mechanism for the recycling of water and slab-adjacent water-rich wedge material deep

II-36
into the mantle, as well as possibly affecting the solid flow and contributing to slab
decoupling. Excluding hydrous phases (as pHMELTS does not stabilize realistic hydrous
phases near 200 km depth), and assuming a peridotite assemblage of 57% olivine, 8%
garnet, 16% orthopyroxene, and 16% clinopyroxene, the LVC can potentially transport
~2200 ppm H2O into the deeper mantle in NAM alone, providing a significant, robust,
water source.
The presence of the LVC has implications for the timing of fluid-bearing element
transport from the slab to the arc. It has been hypothesized that two separate mantle wedge
enrichment mechanisms result in the 238U excesses observed at the Mariana arc: an episode
of sediment-derived (uranium-rich) fluid addition to the mantle source followed by >350ky
of radiogenic ingrowth as the solid flow advects the material deeper, and then a second
episode of (aqueous) fluid influx from the dehydrating altered oceanic crust [37]. Timing
from this second release of fluid to the eruption of lavas is on the order of tens of thousands
of years, a time-frame which necessarily includes melt migration and lower crustal
processing, and the rapidity of this process suggests that the fluids themselves are the
trigger for the initiation of significant mantle wedge melting [37]. The LVC, defined by
tens of kilometers of water-saturated mantle material, may allow fairly rapid fluid transport
with minimal chemical water-rock equilibration, resulting in direct delivery to the melting
region and immediate triggering of melting. With the model fluid velocity (d = 100 µm, n
= 2), it would take < 50 kyr for the fluids to penetrate to the active melting region with an
LVC thickness of 25 km, a sufficiently short timeframe that would correspond to the U-
series timescale for the second (and applicable, considering a lack of sediment) fluid influx
to the wedge from the AOC. Changing these parameters (i.e., n = 3) results in timescales

II-37
of fluid transport on the order of 1.5 Ma for a similar LVC thickness.
4.3. Melting
In all models, there is a distinct spatial region of melt production within the mantle
wedge. We find that the dominant factor in subduction systems for controlling this melt
distribution is the amount and spatial location of dehydration and free water release within
the slab. Not only do fluids carry slab signatures, but the spatial location (pressure and
temperature) of their release has implications for the resulting fluxed melt composition.
Additionally, although we do not account for the influence of melt on viscosity, the
presence of a melt lens may serve to either increase the effective thickness of the LVC, or
to smooth out the sharpness of the viscosity transition from the LVC into the interior of the
mantle wedge. In contrast to our near-fractional melt extraction scheme, melt migration at
depths greater >90 km may be consistent with porous/reactive flow [56]. This would add
an additional transport mechanism for water in the system: allowing hydrous melts to react
with solids as they migrate will re-distribute water within NAM beyond the LVC, leading
to a smoothly decreasing activity of water upwards and a finite extension of the hydration
region and a wedge-type low-viscosity geometry.
A number of geochemical and petrological studies have suggested that partial
melting of subducting slab components (sediment and/or altered oceanic crust) is a
possibility in many arc systems. This is due to recycling of trace elements such as Th that
are considered relatively fluid-immobile but can be partitioned strongly into partial melts
of metasediments and metabasalt [37, 57-59] and by the similarities between trace element

II-38
patterns of partial melts of eclogite with primitive arc andesites [60-64]. Plots of slab-
wedge interface pressures and temperatures for the models alongside the water-saturated
MORB solidus of [25] (i.e., 650-700 deg. C from 1-3 GPa) show that we would not
reasonably expect melting of the AOC to occur in any of the models (Fig. 12). If, indeed,
melting of the oceanic crust were to occur, as suggested by some thermal models
incorporating temperature-dependent [23] and temperature and stress-dependent viscosity
[6], the implications for the development of the LVC could be significant. Melting of the
slab (sediment and/or AOC) would encourage partitioning of water into the melt phase,
reducing the capacity of fluid for transport into the wedge. In this case, relying on a fluid
phase to initiate melting may be incorrect, as the fluid could be taken up wholly in NAM
and hydrous phases. We would then rely on the migration of the hydrous slab melts as the
transport mechanism for water, and a more complicated fluxing process to initiate
peridotite melting.
We note that the observation of the volcanic front forming at nearly constant
globally-averaged height (~105 km) above the Wadati-Benioff zone [43] does not appear to
be fulfilled by a discontinuous melt lens that extends along the slab surface (Fig. 9).
However, we do not take into account melt migration processes that may serve to focus the
melt, or may exploit the channel geometry for flow reversals back up the slab. Porous flow
driven by pressure gradients as a mechanism of melt focusing towards the wedge corner
[5], diapirism of melts towards the overlying lithosphere [65], or fracture propagation as a
mechanism of melt extraction [66] have all been invoked as potential melt migration
processes within subduction zones. We assume vertical fluid transport, immediately
moving fluid into the mantle wedge upon release. Accounting for up-dip migration of
II-39
fluids along the slab-wedge interface to lower pressures may concentrate melting within
the wedge. Despite the simplistic approach to melt migration in our models, we can infer
quite a lot from the positions of the zones of active melting. Seismic tomographic studies
in northeastern Japan show an inclined, slab-parallel seismic low-velocity and high-
attenuation zone in the mantle wedge [67, 68]. These discontinuous inclined regions exist
at depths less than 150 km, are separated from the upper surface of the slab by ~50 km, and
show very similar geometries to melting regions calculated by GyPSM-S in that the
regions are inclined towards the position of the arc (Fig. 9).
Latent heat of melting appears to be the cause of the significant cooling of the
mantle wedge. Since we remove melt completely from the system (above a certain
porosity), we do not allow for crystallization of that melt within the wedge, which may also
counteract wedge cooling by latent heat of crystallization. The calculated solidi from
pHMELTS show a systematic offset from values calculated by [69]. At pressures less than
1 GPa, pHMELTS predicts lower solidus temperatures, while it gives significantly higher
temperatures at higher pressures with a steeper dT/dP solidus curve, (1150 ºC vs. 800-1000
ºC at 3 GPa ) (Fig. 13). This may lead to an over-extension of the zone of active melting
into the wedge in our models, especially at pressures in excess of 3 GPa, as well as the lack
of a contact between the chlorite stability field and the zone of active melting. However,
the overall relationship between fluid migration, hydration of NAM, and displacement of
the inclined zone of melting away from the slab with increasing pressure should remain the
same.
4.4. Impact of LVC on seismic wave propagation

II-40
Seismic velocity and attenuation studies have interpreted a hydrated region directly
adjacent to the slab. From regionally detected body-wave phases, low velocity layers
(LVLs) exist above seismically fast slabs with thicknesses of 5-10 km in the Mariana,
Japan [70], Kurile, Nicaragua [71], and Aleutian arcs. However, the LVL may be up to 20
km thick in parts of Alaska [72]. The Japan results suggest that the LVL extends down to
300 km depth with substantial velocity reduction. The P-wave velocity reduction could be
as much as 14% if the thickness of the LVL is only 10 km, but only 4% if the layer is 30
km thick [70], suggesting a thick zone of hydrated phases. In addition, studies of seismic
attenuation (with lower spatial resolution than the velocity models) suggest that there are
broad zones of high attenuation (low Q) above slabs in Tonga [73], Alaska [74], and
elsewhere.
It has been shown that the presence of hydrous phases can have a direct impact on
seismic properties, and estimates of low-velocity anomalies along the slab-wedge interface
in subduction zones have been hypothesized to be due to a continuous layer of hydrous
phases [72, 82]. While hydrous phases can certainly hold more water than NAM, it
remains true that NAM can account for significant amounts of water (in olivine alone as
much as 0.6-0.9 wt. % can be held at 12 GPa [30, 75]) with steadily increasing solubility
with increasing pressure and may have an indirect effect on seismic properties. The LVC
is defined by an increased water content in NAM, present as hydrogen-related defects,
which can enhance anelasticity and lead to an increase in attenuation and a reduction in
seismic wave velocities [76-78,16]. Therefore, our results for a continuous channel of high
water content in NAM may be consistent with regionally detected body-wave phase results

II-41
showing low velocity layers (LVLs) of order tens of kilometers thickness above slabs [70].
5. Conclusions
As our models show, the ability to simultaneously explain geophysical and
geochemical observations is essential to demonstrate certain behaviors such as the
development of boundary features along the slab-mantle interface. The spatial extent of
the low-viscosity region of the wedge may be a large-scale volume extending from the
slab-mantle interface to the back-arc (e.g., [13]) or a relatively thin, continuous channel
defined by water-saturated NAM and hydrous phases along the slab-mantle interface,
depending on subduction parameters (slab age, convergence velocity, slab dip angle). The
development of the LVC is a consequence of the vertical migration of fluids into the
mantle wedge and reaction with peridotite to produce hydrous phases and higher water
contents in NAM. Its extent is limited by the onset of melting and is therefore dependent
on the position of the water-saturated solidus, which changes spatial position within the
wedge due to source depletion (prior melt extraction) and/or the thermal evolution of the
wedge (progressive melt extraction). The zone of active melting exists at the upper surface
of the LVC, and the thickness and instantaneous melt fraction are restricted in our models
by the assumptions of near-fractional melt extraction and the limitation of water transport
to the hydrous fluid phase. Despite changing subduction parameters, the geometry of the
melting regions are quite similar in all models: discontinuous lenses inclined to the slab
surface and displaced from it by tens of kilometers. The persistence of the LVC would
provide a mechanism by which hydrated slab-adjacent mantle material (consisting of a

II-42
significant reservoir of water and potentially very low-degree mantle melts) is transported
to the deep mantle without melting, providing a source for enriched OIB magmas such as
the Azores. The LVC is also significant because of the effect it has on the large-scale flow
field within the wedge, possibly leading to slab decoupling [13] and changes in slab dip
[50]. Additional evidence for the existence of the LVC includes seismic wave propagation
and attenuation and recent studies showing the significant displacement of the active
melting region from the slab-wedge interface [67, 68].
Acknowledgments
The authors would like to especially thank Chad Hall for his substantial early work
on code and concept development. This work benefited from helpful discussion with V.
Manea, M. Chen, B. Hacker, and S. Kidder and from very constructive comments by two
anonymous reviewers and editor C. Jaupart. Support provided through the Caltech
Tectonics Observatory by the Gordon and Betty Moore Foundation. All calculations carried
out on the Caltech Geosciences Supercomputer Facility partially supported by NSF EAR-
0521699.
References
[1] J. H. Davies and D. J. Stevenson (1991) Physical model of source region of
subduction zone volcanics. Journal of Geophysical Research 97(B2), 2037-2070.
[2] H. Iwamori (1998) Transportation of H2O and melting in subduction zones. Earth and

II-43
Planetary Science Letters 160, 65-80.
[3] D. Arcay et al. (2005) Numerical simulations of subduction zones: Effect of slab
dehydration in the mantle wedge dynamics. Physics of the Earth and Planetary
Interiors 149, 133-153.
[4] M. W. Schmidt and S. Poli (1998) Experimentally-based water budgets for dehydrating
slabs and consequences for arc magma generation. Earth and Planetary Science
Letters 163, 361-379.
[5] M. Spiegelman and D. McKenzie (1987) Simple 2-D models for melt extraction at mid-
ocean ridges and island arcs. Earth and Planetary Science Letters 83, 137-152.
[6] P. E. van Keken et al. (2002) High-resolution models of subduction zones: Implications
for mineral dehydration reactions and the transport of water into the deep mantle.
Geochemistry, Geophysics, Geosystems 3(10), 1056, doi: 10.1029/2001GC000256.
[7] S. M. Peacock (1990) Fluid processes in subduction zones. Science 248, 329-337.
[8] Y. Tatsumi and S. Eggins (1995) Subduction Zone Magmatism, Blackwell, Cambridge.
[9] S. M. Peacock (2003) Thermal Structure and Metamorphic Evolution of Subducting
Slabs. Geophysical Monograph 138, 7-22.
[10] G. Hirth and D. L. Kohlstedt (1996) Water in the oceanic upper mantle; implications
for rheology, melt extraction, and the evolution of the lithosphere. Earth
and Planetary Science Letters 144(1-2), 93-108.
[11] S. Mei and D. L. Kohlstedt (2000) Influence of water on plastic deformation of
olivine aggregates 2. Dislocation creep regime. Journal of Geophysical Research
105(21), 21471-21481.
[12] E. H. Hauri et al. (2006) Partitioning of water during melting of the Earth's upper

II-44
mantle at H2O-undersaturated conditions. Earth and Planetary Science Letters 248,
715-734.
[13] M. I. Billen and M. Gurnis (2001) A low viscosity wedge in subduction zones. Earth
and Planetary Science Letters 193, 227-236.
[14] M. I. Billen and M. Gurnis (2003) Comparison of dynamic flow models for the
Central Aleutian and Tonga-Kermadec subduction zones. Geochemistry,
Geophysics, Geosystems 4(4), 1035, doi:10.1029/2001GC000295.
[15] N. H. Sleep (1975) Stress and flow beneath island arcs. Geophysical Journal
International 42, 827-857.
[16] S. Karato and H. Jung (1998) Water, partial melting, and the origin of the seismic low
velocity and high attenuation zone in the upper mantle. Earth and Planetary
Science Letters 157(3-4), 193-207.
[17] P. M. Smith and P. D. Asimow (2005) Adiabat_1ph: A new public front-end to the
MELTS, pMELTS, and pHMELTS models. Geochemistry, Geophysics,
Geosystems 6(2), Q02004, doi:10.1029/2004GC000816.
[18] M. S. Ghiorso and R. O. Sack (1995) Chemical mass transfer in magmatic processes;
IV, A revised and internally consistent thermodynamic model for the
interpolation and extrapolation of liquid-solid equilibrium magmatic
systems at elevated temperatures and pressures. Contributions to
Mineralogy and Petrology 119(2-3), 197-212.
[19] P. D. Asimow, J. E. Dixon, C. H. Langmuir (2004) A hydrous melting and
fractionation model for mid-ocean ridge basalts: Application to the Mid-Atlantic
Ridge near the Azores. Geochemistry, Geophysics, Geosystems 5(1), Q01E16,

II-45
doi:10.1029/2003GC000568.
[20] S. King et al. (1990) ConMan; vectorizing a finite element code for incompressible
two-dimensional convection in the Earth's mantle. Physics of the Earth and
Planetary Interiors 59(3), 195-207.
[21] A. N. Brooks and T. J. R. Hughes (1982) Streamline Upwind Petrov-Galerkin
Formulations for Convection Dominated Flows with Particular Emphasis on
the Incompressible Navier-Stokes Equations. Computer Methods in Applied
Mechanics and Engineering 32(1-3), 199-259.
[22] G. Hirth and D. Kohlstedt (2003) Rheology of the Upper Mantle and the Mantle
Wedge: A View from the Experimentalists. Geophysical Monograph 138, 83-105.
[23] P. B. Kelemen et al. (2003) Thermal Structure due to Solid-State Flow in the Mantle
Wedge. Geophysical Monograph 138, 293-311.
[24] G. K. Batchelor (1967) An Introduction to Fluid Dynamics. Cambridge University
Press.
[25] B. R. Hacker, G. A. Abers, and S. M. Peacock (2003) Subduction factory-1.
Theoretical mineralogy, densities, seismic wave speeds, and H2O contents. Journal
of Geophysical Research-Solid Earth 108(B1),
http://dx.doi.org/10.1029/2001JB001129.
[26] R. K. Workman and S.R. Hart (2005) Major and trace element composition of the
depleted MORB mantle (DMM). Earth and Planetary Science Letters 231(1-2), 53-
72, http://dx.doi.org/10.1016/j.epsl.2004.12.005.
[27] M. S. Ghiorso et al. (2002) The pMELTS: A revision of MELTS from improved
calculation of phase relations and major element partitioning related to partial

II-46
melting of the mantle to 3GPa. Geochemistry, Geophysics, Geosystems 3,
10.1029/2001GC000217.
[28] R. G. Berman (1988) Internally consistent thermodynamic data for minerals in the
system Na2O-K2O-CaO-MgO-FeO-Fe2O3-Al2O3-SiO2-TiO2-H2O-CO2:
representation, estimation, and high temperature extrapolations. Journal of
Petrology 89, 168-183.
[29] K. S. Pitzer and S. M. Sterner (1994) Equations of state valid continuously from zero
to extreme pressures for H2O and CO2. Journal of Chemical Physics 101(4), 3111-
3116.
[30] J. L. Mosenfelder et al. (2006) Hydrogen incorporation in olivine from 2-12 GPa.
American Mineralogist 91(2), 285-294, http://dx.doi.org/10.2138/am.2006.1943.
[31] I. Sidorin and M. Gurnis (1998) Geodynamically consistent seismic velocity
predictions at the base of the mantle, in M. Gurnis, M. Wysession, E. Knittle, and
B. Buffett, eds. The Core Mantle Boundary Region, American Geophysical Union,
Washington, D.C., 209-230.
[32] P. J. Tackley and S. D. King (2003) Testing the tracer ratio method for modeling
active compositional fields in mantle convection simulations. Geochemistry,
Geophysics, Geosystems 4(4).
[33] L. H. Rupke et al. (2004) Serpentine and the subduction water cycle. Earth and
Planetary Science Letters 223, 17-34.
[34] M. Scambelluri et al. (2004) The fate of B, Cl, and Li in the subducted oceanic
mantle and in the antigorite breakdown fluids. Earth and Planetary Science Letters
222, 217-234.
II-47
[35] P. Ulmer and V. Trommsdorf (1995) Serpentine stability to mantle
depths and subduction-related magmatism. Science 268, 858– 861.
[36] T. Elliott et al. (2006) Lithium isotope evidence for subduction-enriched mantle in the
source of mid-ocean-ridge basalts. Nature 443(5), 565-568,
http://dx.doi.org/10.1038/nature05144.
[37] T. Elliott et al. (1997) Element transport from slab to volcanic front at the Mariana
arc. Journal of Geophysical Research 102(B7), 14991-15019.
[38] M. G. Braun, G. Hirth, and E. M. Parmentier (2000) The effect of deep damp melting
on mantle flow and melt generation beneath mid-ocean ridges. Earth and Planetary
Science Letters 176, 339-356.
[39] D. A. Wark and E. B. Watson (1998) Grain-scale permeabilities of texturally
equilibrated, monomineralic rocks. Earth and Planetary Science Letters 164, 591-
605.
[40] D. A. Wark et al. (2003) Reassessment of pore shapes in microstructurally
equilibrated rocks, with implications for permeability of the upper mantle. Journal
of Geophysical Research 108(B1).
[41] M. E. Zimmerman et al. (1999) Melt distribution in mantle rocks deformed in shear.
Geophysical Research Letters 26(10), 1505-1508.
[42] K. Mibe et al. (2007) Second critical endpoint in the peridotite-H2O system. Journal
of Geophysical Research 112, B03201, doi: 10.1029/2005JB004125.
[43] E. M. Syracuse and G. A. Abers (2006) Global compilation of variations in slab depth
beneath arc volcanoes and implications. Geochemistry, Geophysics, Geosystems 7
(5), Q05017, doi: 10.1029/2005GC001045.

II-48
[44] S. M. Peacock et al. (2005) Thermal structure of the Costa Rica-Nicaragua
subduction zone. Physics of the Earth and Planetary Interiors 149(1-2), 187-200.
[45] R. J. Stern et al. (2003) An Overview of the Izu-Bonin-Mariana Subduction Factory.
Geophysical Monograph 138, 175-222.
[46] T. L. Grove et al. (2006) The influence of H2O on mantle wedge melting. Earth and
Planetary Science Letters 249, 74-89.
[47] P. M. Smith et al. (2007) Coupled Petrological and Geodynamic Models of Mantle
Flow in Subduction Zones; the Importance of Chlorite in the Emergence of a Low-
Viscosity Channel. Eos Trans. AGU, 88(52), Fall Meet. Suppl., Abstract V43D-
1637.
[48] A. Pawley (2003) Chlorite stability in mantle peridotite: the reaction
clinochlore+enstatite=forsterite+pyrope+H2O. Contributions to Mineralogy and
Petrology 144, 449-456.
[49] T. V. Gerya and D. A. Yuen (2003) Rayleigh-Taylor instabilities from hydration and
melting propel 'cold plumes' at subduction zones. Earth and Planetary Science
Letters 212, 47-62.
[50] V. Manea and M. Gurnis (2007) Subduction zone evolution and low viscosity wedges
and channels. Earth and Planetary Science Letters 264(1-2), 22-45.
[51] M.W. Schmidt and S. Poli (1998) Experimentally based water budgets
for dehydrating slabs and consequences for arc magma generation.
Earth and Planetary Science Letters 163, 361– 379.
[52] K. M. Cooper et al. (2004) Oxygen isotope evidence for the origin of enriched mantle
beneath the mid-Atlantic ridge. Earth and Planetary Science Letters 220, 297-316.

II-49
[53] K. E. Donnelly et al. (2004) Origin of enriched ocean ridge basalts and implications
for mantle dynamics. Earth and Planetary Science Letters 226, 347-366.
[54] J. E. Dixon et al. (2002) Recycled dehydrated lithosphere observed in plume-
influenced mid-ocean-ridge basalt. Nature 420, 385-389.
[55] P. J. le Roux et al. (2002) Mantle heterogeneity beneath the southern Mid-Atlantic
Ridge: trace element evidence for contamination of ambient asthenospheric mantle.
Earth and Planetary Science Letters 203, 479-498.
[56] J. Nakajima et al. (2005) Quantitative analysis of the inclined low-velocity zone in the
mantle wedge of northeastern Japan: A systematic change of melt-filled pore shapes
with depth and its implications for melt migration. Earth and Planetary Science
Letters 234, 59-70.
[57] T. Plank and C. H. Langmuir (1993) Tracing trace elements from sediment input to
volcanic output at subduction zones. Nature 362, 739-743.
[58] T. Plank and C. H. Langmuir (1998) The chemical composition of subducting
sediment and its consequences for the crust and mantle. Chemical Geology 145,
325-394.
[59] M. C. Johnson and T. Plank (1999) Dehydration and melting experiments constrain
the fate of subducted sediments. Geochemistry, Geophysics, Geosystems 1,
1999GC000014.
[60] G. M. Yogodzinski and P. B. Kelemen (1998) Slab melting in the Aleutians:
implications of an ion probe study of clinopyroxene in primitive adakite and basalt.
Earth and Planetary Science Letters 158, 53-65.
[61] M. J. Defant and P. Kepezhinskas (2001) Evidence suggests slab melting in arc
II-50
magmas. EOS 82, 65-69.
[62] T. L. Grove et al. (2002) The role of an H2O-rich fluid component in the generation of
primitive basaltic andesites and andesites from the Mt. Shasta region, N. California.
Contributions to Mineralogy and Petrology 142(4), 375-396.
[63] Y. Tatsumi et al. (2001) Tectonic setting of high-Mg andesite magmatism in the SW
Japan Arc: K-Ar chronology of the Setouchi volcanic belt. Geophysical Journal
International 144(3), 625-631.
[64] G. M. Yogodzinski et al. (2001) Geochemical evidence for the melting of subducting
oceanic lithosphere at plate edges. Nature 409, 500-504.
[65] P. Hall and C. Kincaid (2001) Diapiric flow at subduction zones: A recipe for rapid
transport. Science 292, 2472-2475.
[66] F. Furukawa (1993) Magmatic processes under arcs and formation of the volcanic
front. Journal of Geophysical Research 98, 8309-8319.
[67] A. Hasegawa et al. (2005) Deep structure of the northeastern Japan arc and its
implications for crustal deformation and shallow seismic activity. Tectonophysics
403, 59-75.
[68] D. P. Zhao et al. (2001) Seismological structure of subduction zones and its
implications for arc magmatism and dynamics. Physics of the Earth and Planetary
Interiors 127, 197-214.
[69] T. L. Grove et al. (2006) The influence of H2O on mantle wedge melting. Earth and
Planetary Science Letters 249, 74-89.
[70] M. Chen et al. (2007) Waveform modeling of the slab beneath Japan. Journal of
Geophysical Research-Solid Earth 112(B02305), doi: 10.1029/2006JB004394.

II-51
[71] G. A. Abers et al. (2003) The wet Nicaraguan slab. Geophysical Research Letters 30
(2), 1098. http://dx.doi.org/10.1029/2002GL015649.
[72] A. Ferris et al. (2003) High-resolution image of the subducted Pacific plate beneath
central Alaska, 50-150km depth. Earth and Planetary Science Letters 214(3-4),
575-588. http://dx.doi.org/10.1016/S0012-821X(03)00403-5.
[73] E. G. Roth, D. A. Wiens, and D. P. Zhao (2000) An empirical relationship between
seismic attenuation and velocity anomalies in the upper mantle. Geophysical
Research Letters 27(5), 601-604. http://dx.dot.org.10.1029/1999GL005418.
[74] J. C. Stachnik, G. A. Abers, and D. H. Christensen (2004) Seismic attenuation and
mantle wedge temperatures in the Alaska subduction zone. Journal of Geophysical
Research-Solid Earth 109(B10). http://dx.doi.org/10.1029/2004JB003018.
[75] J. R. Smyth et al. (2006) Olivine hydration in the deep upper mantle: Effects of
temperature and silica activity. Geophysical Research Letters 33(L15301), doi:
10.1029/2006GL026194.
[76] S. Karato (2003) Mapping Water Content in the Upper Mantle. Geophysical
Monograph 138, 135-152.
[77] S. Karato et al. (1986) Rheology of synthetic olivine aggregates: influence of grain
size and water. Journal of Geophysical Research 91, 8151-8176.
[78] S. Mei and D. L. Kohlstedt (2000) Influence of water on plastic deformation of
olivine aggregates 2. Dislocation creep regime. Journal of Geophysical Research
105(21), 21471-21481.
[79] L. H. Rupke et al. (2002) Are regional variations in Central American arc lavas due to
differing basaltic versus peridotitic slab sources of fluids? Geology 30(11), 1035-

II-52
1038.
[80] D. McKenzie and M. J. Bickle (1988) The volume and composition of melt generated
by extension of the lithosphere. Journal of Petrology 29(3), 625-679.
[81] D. W. Peate and J. A. Pearce (1998) Causes of spatial compositional variations in
Mariana arc lavas: Trace element evidence. The Island Arc 7, 479-495.
[82] H. Kawakatsu and S. Watada (2007) Seismic evidence for Deep-Water Transportation
in the Mantle. Science 316, 1468-1471.
[83] A. Hochstaedter et al. (2001) Across-arc geochemical trends in the Izu-Bonin arc:
contributions from the subducting slab. Geochemistry, Geophysics, Geosystems
2:2000GC000105.
[84] A. Audetat and H. Keppler (2004) Viscosity of fluids in subduction zones. Science
303, 513-516.
[85] P. M. Smith et al. (2005) Integrating Geodynamic and Petrological Numerical Models;
Mid-Ocean Ridge Flow Dynamics Revisited. Eos Trans. AGU, 86(52) Fall Meet.
Suppl., Abstract V33D-03.
Figure Captions
Figure 1: Range in viscosity produced from Eq. 5 implemented in GyPSM-S for the model
water in olivine contents (0-2000 ppm) and model temperatures (0-1500 ºC in 100 ºC
intervals). The range spans 5 orders of magnitude in viscosity when the maximum
viscosity cut-off is imposed.

II-53
Figure 2: (a) Initial conditions and (b) boundary conditions imposed within the GyPSM-S
model domain. See text for details.
Figure 3: Computational organization and data flow of the GyPSM-S model.
Figure 4: (a) Initial particle distribution for the wedge corner region of model SCR. The
particles are arranged by composition and by temperature: peridotite (green), altered
oceanic crust (black), and serpentinite (blue). The particle density is increased for the
mantle wedge, the area of interest. (b) Final particle distribution after run completion for
the wedge corner region of model SCR.
Figure 5: Development of LVC for model CCR: (a) initial thermal structure and
streamfunction (with arrows showing direction of flow), resulting from an uncoupled
ConMan calculation approaching steady-state; (b) initial viscosity structure, calculated
immediately after the first coupled iteration with pHMELTS such that the water content of
the ambient mantle is reflected in the viscosity structure as well as temperature-dependent
contributions; (c) increase in water in olivine above the ambient background as fluid from
the dehydrating slab rises vertically into the wedge and then reacts with the peridotite to
form hydrous phases and hydrated NAM. A thin zone of melting is illustrated at the top of
the hydrated channel where the white contour indicates melting > 1%; (d) viscosity
structure corresponding to panel c, showing the marked decrease in viscosity of the solid
matrix due to water-weakening from hydration of nominally anhydrous olivine; (e)
advection of the slab-adjacent wedge peridotite results in the development of a hydrated

II-54
channel, bounded at the top by a thin melt lens. The solid flow streamlines shows a
marked change in trajectory upon impacting the hydrated channel, with an increasing
upward component; (f) the hydrated channel is defined by high concentrations of water in
NAM, which influence the viscosity through the flow law, and result in the low-viscosity
channel (LVC). Note that the contour interval of the stream function in the slab and
descending mantle is twice the value in the wedge.
Figure 6: (a) Distribution of hydrous phases within model CCR. Hornblende (red) is
present at lower pressures (< 2.5 GPa), while chlorite (green) is stable at pressures up to ~5
GPa, and temperatures < 1000 K. This stability field results in the formation of a
continuous channel of hydrous minerals to depths of ~175 km within the LVC and
bounding the slab surface. (b) Water in olivine (which defines the LVC). (c) An
experiment with melting suppressed within the pHMELTS model, to test the impact of
melting as the primary restriction on the thickness of the LVC. Note that the contour
interval of the stream function in the slab and descending mantle is twice the value in the
wedge.
Figure 7: Influence of slab age and convergence velocity on the development of the LVC
as shown by the resulting viscosity structure. Models with a 45º slab dip are compared,
arranged such that the effects of increasing slab age and increasing slab convergence
velocity can be evaluated at constant slab dip angle. Fig. 7a (NIB) and b (ADD1) represent
the subduction of old, cold slabs (thermal age 135 Ma), differentiated primarily by slow
(50 mm/yr) and fast (87 mm/yr) convergence velocity. Fig. 7c (ADD2) and d (CCR)

II-55
represent the subduction of young, warm slabs (thermal age 18 Ma), and slow and fast
velocities, respectively (Table 3).
Figure 8: Influence of the impact of changing slab dip on the geometry of the LVC. (a-b)
CCR-SCR: shallowing slab dip from 45º to 30º. (c-d) NIB-NMAR: steepening slab dip
from 45º to 60º.
Figure 9: Instantaneous melt fraction (color) and fluid release from the slab (blue
contours), showing that melting is generally restricted to a thin (~6 km) lens immediately
above fluid release locations within the slab for models (a) CCR, (b) NIB, (c) ADD2, (d)
NMAR, (e) SCR, and (f) ADD1. Panels (g-i) illustrate the evolution of the melting region
and the changing fluid release locations over time for model ADD1.
Figure 10: Thickness of the LVC vertically from the slab surface as a function of distance
along the slab for (a) CCR (red), NIB (blue), ADD1 (black), ADD2 (purple), (b) NMAR
(green), and (c) SCR (pink) models.
Figure 11: Schematic of the low-viscosity channel (LVC) geometry, including hydrous
melt layer for the NIB model case. Dehydration reactions in the down-going slab release
water, which rises into the overlying mantle wedge and reacts with peridotite to form
hydrous phases and to hydrate nominally anhydrous minerals (NAM), such as olivine.
Locations of water release from slab dehydration reactions showing the discontinuous
nature of the water release due to crossing of reaction boundaries. The shallower

II-56
dehydration reactions are due to reaction boundaries in the altered oceanic crust, while the
deeper reactions are in the lithospheric serpentinite layer. Once saturated, water can rise
through the hydrated NAM layer into the hotter regions of the wedge, where it induces
water-fluxed melting.
Figure 12: Pressure-temperature trajectories of the slab-wedge interface for the six models
with the water-saturated MORB solidus from [19]. We neglect slab melting in our models,
which refers to melting of the altered oceanic crust, as sediments are not included. The
only model that approaches the water-saturated MORB solidus is ADD2, around 4.0 GPa.
Figure 13: Solidus relations for the model peridotite wedge starting composition (Table 1)
with variable H2O contents predicted by pHMELTS and the estimates of solubility of water
in nominally anhydrous minerals (NAM) given by [30], similar to the construction of
Figure 1 from [19], but with the primary difference being the higher estimates of water
able to go into NAM relative to values originally given by [10]. The upper heavy black
curve is the anhydrous solidus (aH2O
= 0.0); the lowermost heavy black curve is the water-
saturated solidus (aH2O
= 1.0). The blue contours are lines of constant activity of water on
the solidus in increments of 0.1 in aH2O
. The black curves labeled 50, 300, 700, 1200, and
2000 show the solidus predicted for these bulk H2O contents in parts per million by weight.
The gray lines indicates the stability limits of garnet and plagioclase on the solidus,
respectively. The green boundary shows the stability of hornblende on the solidus.
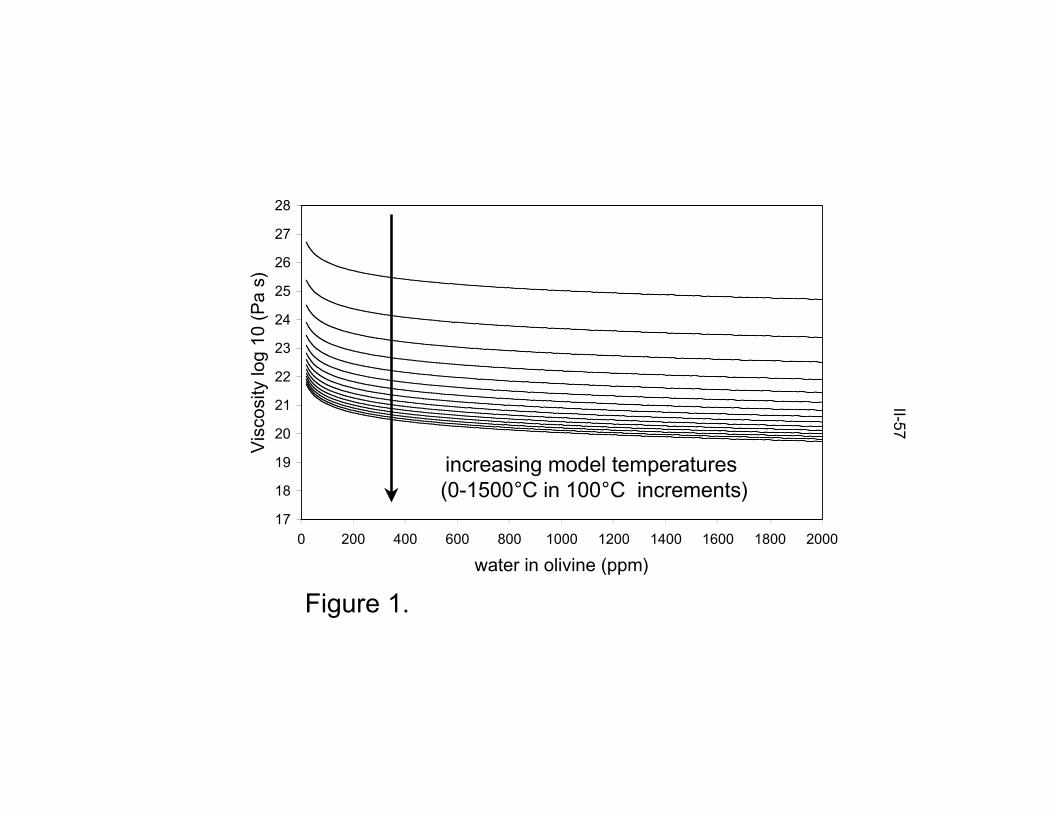
17
18
19
20
21
22
23
24
25
26
27
28
0 200 400 600 800 1000 1200 1400 1600 1800 2000
water in olivine (ppm)
Vis
cosi
ty lo
g 10
(P
a s)
increasing model temperatures (0-1500°C in 100°C increments)
Figure 1.
II-57

Figure 2a.
II-58

II-59
Figure 2b.
T = 273 K constant temperature
velocities kinematically imposedin
com
ing
man
tle fl
ow(c
orne
r flo
w s
olut
ion
on
edge
)
inco
min
g m
antle
flow
outgoing mantle flow
rigid lithosphere, u = v = 0
velocities free

II-60

Figure 4.
A. B.
II-61

II-62
Figure 5.

II-63
Figure 6.

II-64
SL
AB
AG
E
VELOCITYFigure 7.

II-65
Figure 8.

II-66
Figure 9.

II-67

II-68
Figure 10.
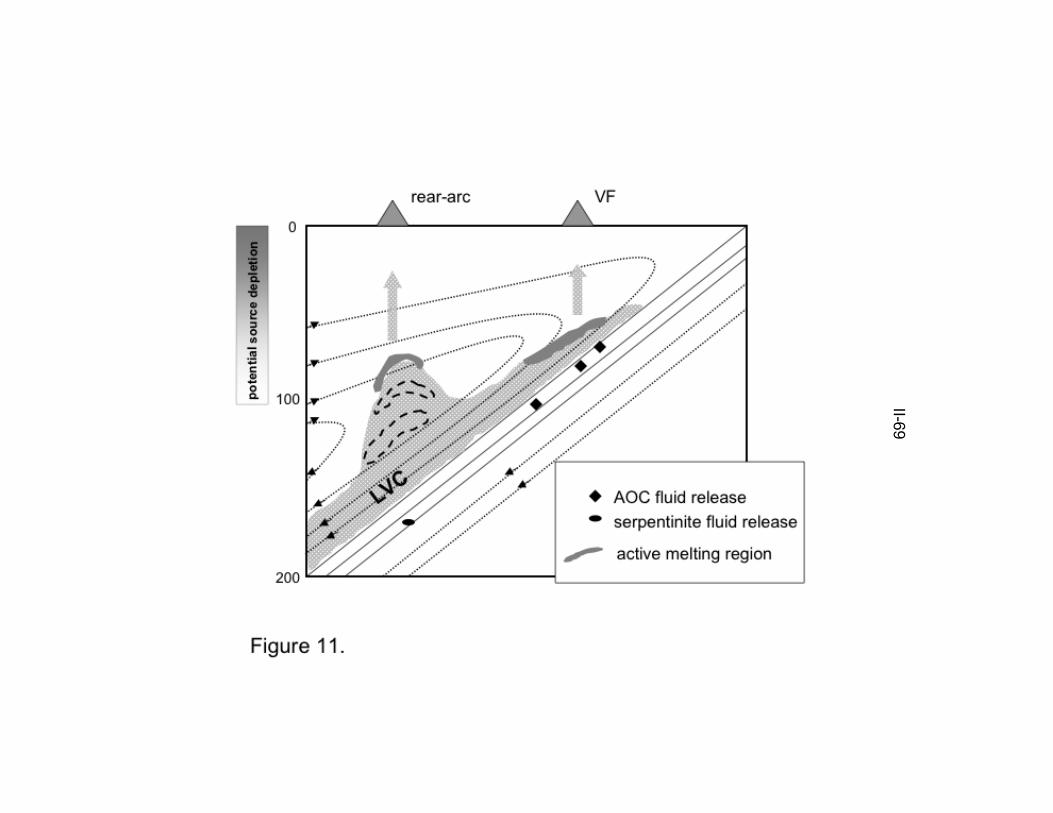
II-69
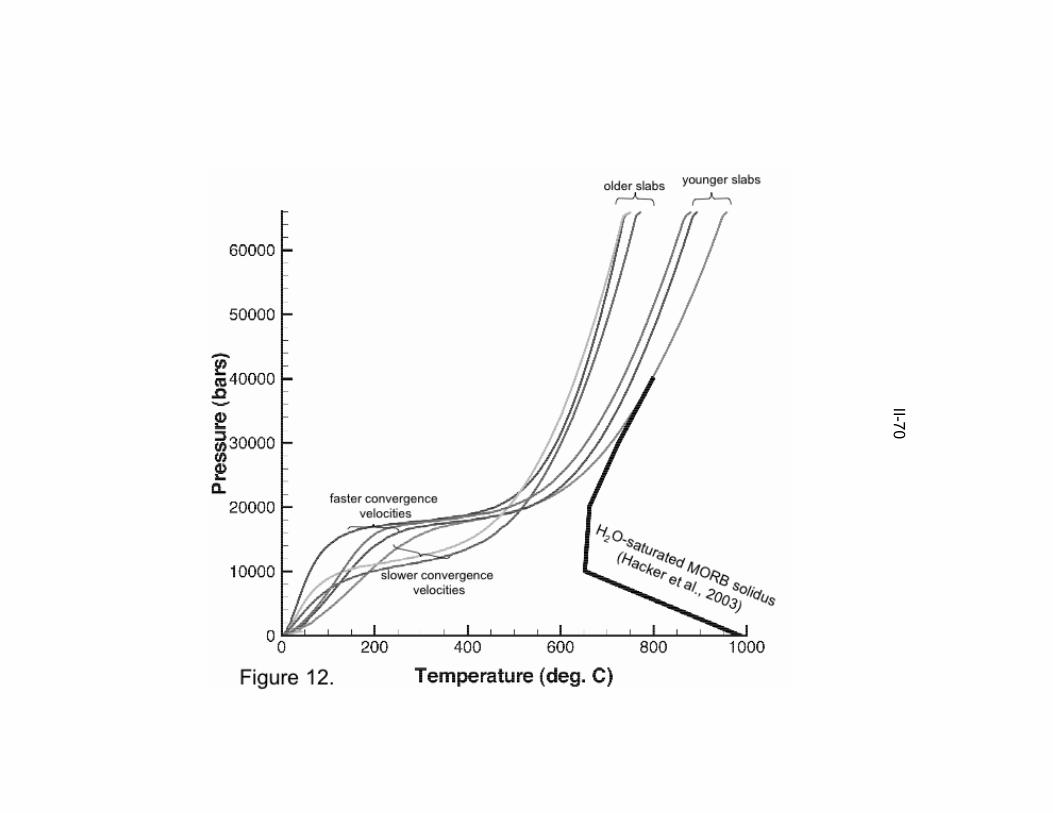
II-70

Figure 13.
II-71

II-72_________________________________________________________________________
Table 1: Model parameters held constant_________________________________________________________________________
parameter value units_________________________________________________________________________
T0 1773 K∆T 1500 KRa 1.0E+04 *η0 1.0E+21 Pa sR 8.31 J/K molXH2O_crit 100 ppmQ 500 kJ/moln 2 [38] *C 1.2E+04 [38] *ηW 1.0E-03 [84] Pa sdm 1.0E-04 mφ 0.03 [38] *κ 1.0E-06 m2/sα 2.5E-05 K-1
g 10.0 m/s2
MINF 0.005 *adiabatic gradient 0.7 ºC/km_________________________________________________________________________
* indicates non-dimensional quantitysquare brackets indicate references_________________________________________________________________________

II-73_________________________________________________________________________
Table 2a: pHMELTS starting composition_________________________________________________________________________
_________________________________________________________________________
Adapted from Workman and Hart [26]_________________________________________________________________________
oxide
44.80
0.13
3.99
0.41
0.57FeO 7.83MgO 38.81CaO 3.18
0.28tracer initial value (ppm)
110.00K 60.00
Rb 0.05Ba 0.56Th 0.01U 0.0032
Nb 0.15Ta 0.01La 0.19Ce 0.55Pb 0.02Pr 0.11Nd 0.58Sr 7.66Zr 5.08Hf 0.16Sm 0.24Eu 0.10Ti 716.30Gd 0.36Tb 0.07Dy 0.51Ho 0.12Y 3.33Er 0.35Yb 0.37Lu 0.06
initial value (weight percent)
SiO2
TiO2
Al2O
3
Fe2O
3
Cr2O
3
Na2O
H2O
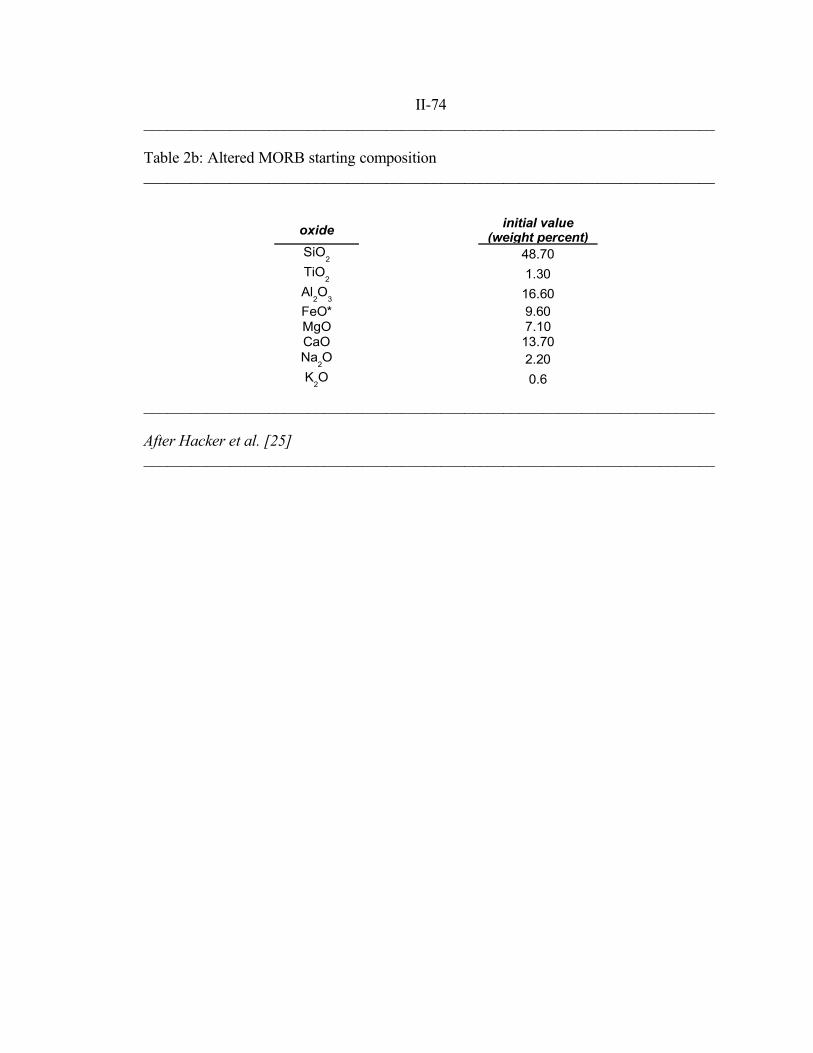
II-74_________________________________________________________________________
Table 2b: Altered MORB starting composition_________________________________________________________________________
_________________________________________________________________________
After Hacker et al. [25]_________________________________________________________________________
oxide
48.70
1.30
16.60FeO* 9.60MgO 7.10CaO 13.70
2.20
0.6
initial value (weight percent)
SiO2
TiO2
Al2O
3
Na2O
K2O

II-75_________________________________________________________________________
Table 3: A summary of subduction zone model parameters_________________________________________________________________________
_________________________________________________________________________
numbers in square brackets are references_________________________________________________________________________
Northern Mariana
abbreviation CCR SCR NIB NMAR ADD1 ADD2 NIB
latitude ~8-11º N ~8-11º N ~32º N ~23º N N/A N/A N/A
longitude ~275-277º E ~276-278º E ~135-143º E ~143-145º E N/A N/A N/A
87 [44] 90 [44] 50 [45] 47.5 [45] 87.00 50.00 50.00
slab dip (degrees) 45 [44] 30 [44] 45 [45] 60 [45] 45 45 45
slab thermal age (Ma) 18 [44] 15 [44] 135 [45] 165 [45] 135 18 135
50 [44] 50 [44] 32 [81] 32 [81] 50 50 50
88 88 66 66 88 88 88
2.0 km, 2.0 km 2.0 km, 3.4641 km 2.0 km, 2.0 km 2.0 km, 1.1547 km 2.0 km, 2.0 km 2.0 km, 2.0 km 2.0 km, 2.0 km
200 km, 400 km 200 km, 692.8 km 200 km, 400 km 200 km, 230.9 km 200 km, 400 km 200 km, 400 km 200 km, 400 km
approximate subduction region
Central Costa Rica
Southeastern Costa Rica
Northern Izu-Bonin
Additional Model 1
Additional Model 2
Additional Model 3
rate of convergence (mm/yr)
rigid lithospheric thickness (km)
thermal lithospheric thickness (km)
dimensional grid resolution (z, x)
dimensions of model domain (z, x)