chapter i - web viewanimal and poultry sciences. honglin jiang ... of related genes and remain...
TRANSCRIPT

ROLES OF GROWTH HORMONE IN LIVER GROWTH AND
MESENCHYMAL STEM CELL MYOGENIC AND ADIPOGENIC LINEAGE
COMMITMENT
DAN JIA
Thesis submitted to the faculty of the Virginia Polytechnic Institute and State University in partial fulfillment of the requirements for the degree of
Master of ScienceIn
Animal and Poultry Sciences
Honglin Jiang, ChairR. Michael Akers
Dongmin Liu
September 25, 2013Blacksburg, Virginia
Keywords: growth hormone, mouse, C3H10T1/2 cells, liver, myogenesis, adipogenesis

ROLES OF GROWTH HORMONE IN LIVER GROWTH AND MESENCHYMAL
STEM CELL MYOGENIC AND ADIPOGENIC LINEAGE COMMITMENT
DAN JIA
ABSTRACT
Growth hormone (GH) has growth-stimulating effects on skeletal muscle and liver but a
growth-inhibitory effect on adipose tissue. The mechanisms underlying these actions of GH are
not fully understood. Two studies were conducted to achieve the following objectives: 1) to
determine the cellular mechanism by which GH stimulates liver growth; 2) to determine the
effects of GH on the commitment of mesenchymal stem cells (MSCs) to myogenic and
adipogenic lineages. In the first study, the GH-deficient lit/lit male mice were injected (s.c.) daily
with rbGH or vehicle for two weeks. GH-injected lit/lit mice tended to have a greater liver/body
weight percentage than lit/lit control mice. GH injection did not alter the percentage of
proliferating cells in the liver. However, GH-injected lit/lit mice had 18% larger hepatocytes and
16% less DNA per unit liver weight than those of lit/lit control mice. These data together
indicate that GH stimulates liver growth in mice by increasing the size, not by increasing the
number of hepatocytes. In the second study, we treated the MSC cell line C3H10T1/2 cells with
or without 5’-azacytidine and rbGH for 4 days. We assessed the myogenic or adipogenic
potential by determining the ability of these cells to differentiate into myotubes or adipocytes,
respectively. C3H10T1/2 cells treated with 5’-azacytidine and GH formed more myotubes,
myoblasts, and fewer adipocytes compared to cells treated with 5’-azacytidine alone. Taken
together, these results suggest that GH enhances 5’-azacytidine-induced myogenic commitment
but inhibits 5’-azacytidine-induced adipogenic commitment in C3H10T1/2 cells.

Key words: growth hormone, mouse, C3H10T1/2 cells, liver, myogenesis, adipogenesis
iii

ACKNOWLEDGEMENTS
First and foremost I offer my sincerest gratitude to my major professor, Dr. Honglin
Jiang, who has supported me throughout my thesis with his patience and knowledge. I appreciate
all his contributions of time, ideas, and funding to make my Master experience productive and
stimulating. Without him, this thesis would not have been completed or written. I would also like
to thank my committee members, Dr. Mike Akers and Dr. Dongmin Liu, for giving me valuable
advices on research.
I would like to thank Lee Johnson for his technical support and encouragement. He
always gives me help without any reservation. Thanks a lot to my lab mates: Aihua, Xiaomei,
Lidan, Yafei, Xiaofei, and Genlai. They not only share much experimental knowledge with me,
but also provide me emotional support, entertainment, and caring.
Finally, I would like to thank my parents. They raised me, taught me, and loved me. They
always support me whatever decision I made, and give me valuable advices. I thank my father
for encouraging me in the tough times. I thank my mother for her tender, loving care and
compassion.
iv

Table of Contents
ABSTRACT……………………………………………………………………….…………......ii
ACKNOWLEDGEMENTS .……………………………………………….…………..……....iv
List of Tables ….………………...………………………………………..………......................vi
List of Figures ……………………………………...………………………………………......vii
CHAPTER I. Literature Review ....………………………………………...……..……………1
INTRODUCTION ...…….………………………………………..….……..…...............1
GROWTH HORMONE ...……………………………….…………………...................2
LIVER ...……….………………………………………………………..……..................9
MYOGENESIS ...………………………….…………………………………...............13
ADIPOGENESIS ...………………………….………………………...…….................16
CONCLUDING REMARKS……………………..………………………....................20
REFERENCES …………….….………………………….............................................22
CHAPTER II. Growth hormone stimulates liver growth by increasing the size of
hepatocytes in mice …....…………………………………………………...……….………….31
ABSTRACT ..………………….……………….………………………….…...............31
INTRODUCTION ...…………………….………….…………….……………………33
MATERIALS AND METHODS …..………………..…….…………………………..35
RESULTS ……………………….……………………….………….………………….40
DISCUSSION .…..…………..……....……...…………………………….....………….43
REFERENCES ………...…………....……...………………………….…...………….46
CHAPTER III. Growth hormone facilitates 5’-azacytidine-induced myogenic but
inhibits 5’-azacytidine-induced adipogenic commitment in C3H10T1/2 cells ……………..54
ABSTRACT ..………………….……………….……………………….……...............54
INTRODUCTION ...…………………….………….…………………….……………55
MATERIALS AND METHODS …..………………..………………………...............58
RESULTS ……………………….……………………….…………….……………….62
DISCUSSION .…..…………..……....……...…………………………….....………….65
REFERENCES ………...…………....……...……………………………....………….68
v

List of Tables
Table 3. 1. Nucleotide sequences of the primers used for real-time RT-PCR …………..............71
vi

List of Figures
Fig. 1.1. Effects of GH and IGF-1 on growth and metabolism ...……………………..................5
Fig. 1.2. GH intracellular signaling pathways mediated by JAK2 phosphorylation ….………….8
Fig. 1. 3. The steps of myogenesis from mesenchymal stem cells (MSCs) …..….……………..15
Fig. 1. 4. The steps of adipogenesis from mesenchymal stem cells (MSCs) ……...……………18
Fig. 2. 1. Effects of GH on body and liver weights …………………………………....………..48
Fig. 2. 2. Effect of GH on hepatocyte proliferation ……….......................................………...…50
Fig. 2. 3. Effect of GH on hepatocyte size ………………………………….…..…...…………..51
Fig. 2. 4. Effect of GH on DNA and protein concentration in liver tissue ………..…….………52
Fig. 2. 5. Effects of GH and IGF-I on protein accretion in hepatocytes ………………………..53
Fig. 3. 1. Effects of 5’-azacytidine (5Aza) and GH on the expression of MyoD, Myf5, Pax3,
and Pax7 mRNAs in C3H10T1/2 cells ………………………..……………...………………...72
Fig. 3. 2. Representative microgrpahs of C3H10T1/2 cells during induced myogenic
differentiation ……………………………………………………………...…………………...73
Fig. 3. 3. Effects of 5Aza and GH on myogenic differenciation of C3H10T1/2 cells …………74
Fig. 3. 4. Effects of 5Aza and GH on the expression of myogenin and MHC3 mRNAs in
C3H10T1/2 cells at day 8 of myogenic differentiation …………………...……..…………….76
Fig. 3. 5. Effects of 5Aza and GH on the expression of CD24, CD29, CD34, Sca-1, PPARγ,
C/EBPα, BMP4, and Wnt10b mRNAs in C3H10T1/2 cells ….….……………………………77
Fig. 3. 6. Representative microgrpahs of C3H10T1/2 cells during induced adipogenic
differentiation …………………………………………………………………………………79
Fig. 3. 7. Effects of 5Aza and GH on adipogenic differentiation of C3H10T1/2 cells … ……80
Fig. 3. 8. Effects of 5Aza and GH on the expression of Plin1, FABP4, PPARγ, and C/EBPα
mRNAs in C3H10T1/2 cells at day 14 of adipogenic differentiation ...….…………………...81
vii

Chapter I
LITERATURE REVIEW
INTRODUCTION
Growth hormone (GH) is a polypeptide hormone that is synthesized and secreted by cells
called somatotrophs in the anterior pituitary. It is widely known that GH plays a critical role in
postnatal growth and metabolism. As GH is necessary for body growth, growth hormone
deficiency (GHD), which is characterized by the inadequate secretion of GH, can cause
dwarfism, non-alcoholic fatty liver disease (NAFLD), and other disorders. Therefore, GH is used
as a prescription drug in medicine to treat growth disorders and metabolic diseases caused by
GHD in children and adults. Normal GH secretion is also important for agricultural animals to
efficiently produce meat and milk.
Once GH is secreted from the anterior pituitary, it is transported in blood to its targets
including liver, bone, muscle, and adipose tissue. It is widely known that GH stimulates
production of insulin-like growth factor-1 (IGF-1), which is produced in liver as an endocrine
hormone or as a paracrine or autocrine hormone in other tissues. Thus, besides direct effects, GH
can indirectly regulate growth and metabolism in its target tissues through IGF-1.
In this review, I will discuss GH secretion, functions, and the intracellular signaling
pathways from the GH receptor, with a focus on the mechanism of action of GH on liver,
skeletal muscle, and adipose tissue.
1

GORWTH HORMONE
Growth hormone production
Growth hormone is a polypeptide hormone that is present in various animals. It is
synthesized, stored, and secreted by somatotropic cells (or somatotrophs) in the anterior pituitary
gland. GH with a molecular weight of 22 kDa is considered the classic or typical GH and is the
most abundant isoform in human pituitary extraction and serum. The structure includes four
helices and has considerable homology with prolactin. This predominant GH form has growth-
promoting effect and influences metabolic processes, such as lipolysis (Baumann, 1999). The 20
kDa is the second most abundant form of GH in the pituitary and circulation. This isoform
accounts for about 5% of pituitary GH. Additional isoforms of GH are present in pituitary
extracts; some are native and some are artifacts of extraction (Baumann, 2009). GH has marked
structural similarities between different species (Yanaihara, 1977).
Secretion of GH from the pituitary is mainly regulated by growth hormone-releasing
hormone (GHRH) (Ling et al., 1984; Spiess et al., 1983) and growth hormone-inhibiting
hormone (GHIH or somatostatin) (Brazeau et al., 1973). Both GHRH and somatostatin are
peptide hormones released by neurons of the hypothalamus, and they reach the somatotrophs
through the hypophyseal portal veins (Merchenthaler et al., 1984). GHRH acts through the
GHRH receptor to stimulate GH production and release. The GHRH receptor is structurally
related to a large family B-III of the G protein coupled receptor (GPCR) superfamily
(Kolakowski, 1997), which is a large protein family of receptors, consisting of seven
transmembrane domains (7TM), three extracellular loops (EC1, EC2, EC3), three intracellular
loops (IC1, IC2, and IC3), an amino-terminal extracellular domain and an intracellular carboxyl
2

terminus (Harmar, 2001). The GPCRs interact with G proteins (heterotrimeric GTPases) to
regulate the synthesis of intracellular second messengers, such as cyclic 3’, 5’ adenosine
monophosphate (cAMP), inositol phosphates, diacylglycerol and calcium ions (Dikic and
Blaukat, 1999; Selbie and Hill, 1998).
Studies on the GHRH receptor have shown that the N-terminus is essential for ligand
binding (DeAlmeida and Mayo, 1998; Kajkowski et al., 1997) and that residues of the
transmembrane domains and/or the connecting extracellular loops are important in determining
the specificity of ligand binding. The stimulation of the GHRH receptor leads to activation of
signal transduction involving G protein, adenylyl cyclase (isoform II and/or IV), cAMP, and
protein kinase A in the somatotroph cell (Bilezikjian and Vale, 1983). This signaling pathway
activates GH gene transcription through the cAMP response element binding protein (CREB).
Meanwhile, GH secretion is increased through the elevation of intracellular Ca2+ concentrations,
either by influx of Ca2+ via L- and T-type voltage-sensitive Ca2+ channels or by phospholipase C
hydrolysis of phosphatidylinositol, leading to mobilization of intracellular Ca2+ stored in the
endoplasmic reticulum (Frohman, 1999).
On the other hand, somatostatin (SST) has a suppressing effect on the release, but not the
synthesis, of GH by the somatotrophs. The somatostatin receptor (SSTR) is encoded by five
different genes (Tannenbaum, 1999). SSTR-2 is the dominant SSTR that mediates the influence
of somatostatin on GH release (Reed et al., 1999). The signaling transduction pathway involves
G-protein coupled reduction in L- and T-type voltage-sensitive Ca2+ influx and increase in K+
outflow (Tannenbaum, 1999).
3

Other hypothalamic peptides that directly influence GH release include thyrotropin-
releasing hormone (TRH), pituitary adenylate cyclase-activating peptide (PACAP), and
gonadotropin-releasing hormone (GnRH). TRH, PACAP, and GnRH have been reported to
stimulate GH release (Sawangjaroen et al., 1997; Szabo et al., 1984; Van Goor et al., 1997).
Leptin, a fat-derived hormone, also has the stimulatory effect on GH secretion (Watanobe and
Habu, 2002). Compared to GHRH, the effects of these factors on GH release are minor (Mayo et
al., 1995).
Growth hormone functions
GH plays critical roles in both growth and metabolism (Fig. 1. 1.). Growth is a complex
process that is regulated by the integration of environmental signals (e.g., nutritional and
seasonal cues) with endogenous neuroendocrine responses to the genetic programs that
ultimately determine the body plan. The role of growth hormone in stimulating body growth is in
part mediated by IGF-1 produced by the liver and other tissues (Schlechter et al., 1986). IGF-1 is
a peptide hormone that has direct effects on cell proliferation, differentiation, and apoptosis
(Noel et al., 2001).
Despite the indirect mode of action, GH also directly promotes bone and muscle growth.
The acceleration of longitudinal bone growth has been observed after local administration of
human growth hormone (hGH) in vivo to the cartilage growth plate of the proximal tibia of
hypophysectomized rats (Isaksson et al., 1982). This result suggests that GH has direct
stimulatory effects on longitudinal bone growth. For muscle growth, the IGF-1 knockout mouse
is less growth retarded than the IGF-1 and GHR double knockout, suggesting that GH has IGF-1
independent effects on growth (Lupu et al., 2001).
4

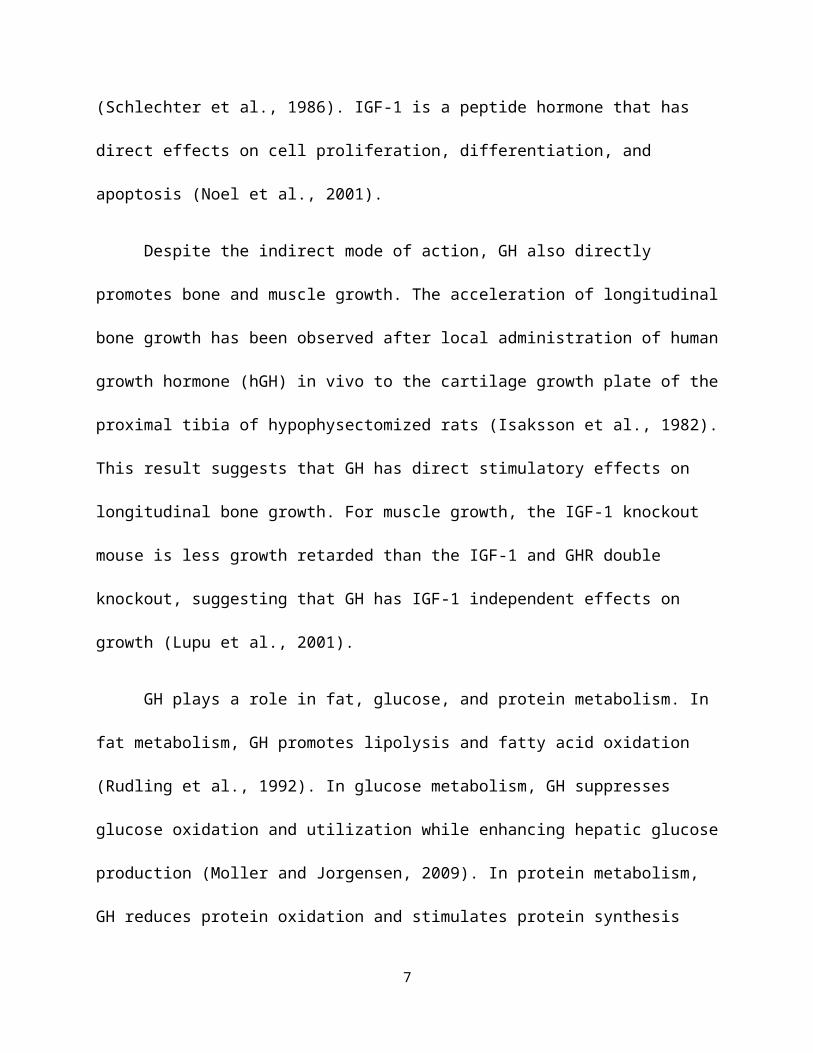
GH plays a role in fat, glucose, and protein metabolism. In fat metabolism, GH promotes
lipolysis and fatty acid oxidation (Rudling et al., 1992). In glucose metabolism, GH suppresses
glucose oxidation and utilization while enhancing hepatic glucose production (Moller and
Jorgensen, 2009). In protein metabolism, GH reduces protein oxidation and stimulates protein
synthesis (Fryburg and Barrett, 1993). The effects of GH on fat and glucose metabolism are
clearly not mediated by IGF-I because, contrary to GH, IGF-1 enhances lipogenesis, and
increases glucose uptake. (Guevara-Aguirre et al., 1997; Jacob et al., 1989; Le Roith et al., 2001;
Ranke et al., 1999).
5

Fig. 1. 1. Effects of GH and IGF-1 on growth and metabolism. The effects of GH and IGF-1
on target tissues other than bone and cartilage are mostly based on the results of in vivo studies
with GH receptor and IGF-1 gene disruption. “+” indicates stimulation; “–” indicates inhibition.
Growth hormone receptor and signal transduction
At the cellular level, the action of GH begins with binding to a membrane receptor, the
GH receptor (GHR). The GHR belongs to the cytokine receptor superfamily (Cosman et al.,
1990; Ihle, 1995). Other members of the cytokine receptor superfamily include receptors for
prolactin (PRL), erythropoietin (EPO), granulocyte colony stimulating factor (GM-CSF), ciliary
neurotrophic factor (CNTF), thrombopoietin, leptin, interleukins (IL) 2-7, IL-9, IL-11 and IL-12.
The GHR has an extracellular domain (ECD) which is connected to an intracellular domain
(ICD) via a flexible linker. The GHR has no intrinsic kinase activity because of the absence of a
tyrosine kinase consensus sequence. However, the cytoplasmic kinase, Janus kinase 2 (JAK2), is
constitutively associated with the Box1 region, a short homologous domain, in the ICD of the
GHR. Upon GHR dimerization as a result of ligand binding, GHR associates with JAK2
molecules. This event unmasks the catalytic domain of JAK2, allowing the adjacent JAK2
molecules to activate each other by transphosphorylation (Lanning and Carter-Su, 2006). The
activated JAK2 molecules phosphorylate the ICD of GHR which then recruits downstream
molecules, including the signal transducer and activator of transcription (STAT) (Smit et al.,
1996; Sotiropoulos et al., 1996; Wood et al., 1997; Yi et al., 1996), Src homology 2/α collagen-
related (SHC) (VanderKuur et al., 1995), and insulin receptor substrate (IRS) proteins (Liang et
al., 1999; Souza et al., 1994; Yamauchi et al., 1998) (Fig. 1. 2.).
6

Among the known signaling molecules of GH, the STAT family of transcription factors,
including STAT1, 3, and 5, play a particularly prominent role in the regulation of gene
transcription. The STAT proteins are phosphorylated by JAK2 when they are recruited to the
GHR. The phosphorylation results in their dissociation from the receptor, homo- or hetero
dimerization, and translocation to the nucleus. Among the various STAT proteins, STAT5
mediates a majority of biological effects of GH, including direct control of expression of genes
related to cell proliferation, apoptosis, differentiation and inflammation; one of these genes is
IGF-I (Frank, 2001; Woelfle and Rotwein, 2004; Zhu et al., 2001). Apart from STATs, GHR
signaling has also been associated with activation of the phosphatidylinositol-3 kinase
(PI3K)/protein kinase B (AKT)/the mammalian target of rapamycin (mTOR) and the
SHC/mitogen-activated protein kinase (MAPK; or, extracellular signal regulated kinase, Erk1/2)
pathway (Hayashi and Proud, 2007; Lanning and Carter-Su, 2006; Zhu et al., 2001) in a JAK2-
dependent manner. The former pathway has a number of effects including promoting protein
synthesis and inhibiting protein breakdown, and play an important role in regulation of cell
growth, proliferation and apoptosis (Morgensztern and McLeod, 2005). The latter pathway, the
SHC/MAPK pathway, plays a central role in the control of cell proliferation, either by changing
the activities of transcription factors or activation of other kinases by phosphorylation (Cargnello
and Roux, 2011). Moreover, studies have shown that GH also associates with several other
signaling molecules, including epidermal growth factor receptor (EGFR), focal adhesion kinase
(FAK), Src family members, Ras-like GTPase, p38 and JNK/SAPK MAP kinase (Lanning and
Carter-Su, 2006; Zhu et al., 2001). Most signaling pathways are activated by GH in a JAK2-
dependent manner. However, the GHR also interacts with c-Src kinase in a JAK2-independent
7

manner, leading to the formation of GTP-bound RalA and RalB, which regulate the activation of
Erk 1/2 via phospholipase D (Brooks et al., 2008; Zhu et al., 2002).
Fig. 1. 2. GH intracellular signaling pathways mediated by JAK2 phosphorylation. a)
Activated JAK2 phosphorylates signal transducers and activators of transcription (STATs)
proteins, which form dimers to trigger transcription of target genes; b) As docking proteins,
insulin receptor substrate (IRS) proteins are phosphorylated to activate the PI3K/AKT/mTOR
pathway; c) Upon phosphorylation by JAK2, SHC activates MAPK to regulate cell growth and
proliferation.
The precise control of GHR signal transduction requires the limitation of the magnitude
and duration of the signaling. Three families of proteins are reported to have inhibitory effect on
8

JAK/STAT signaling: phosphatases, protein inhibitors of activated STATs (PIAS), and
suppressors of cytokine signaling (SOCSs). Among these inhibitors, SOCSs are the primary
negative regulators of the JAKs (Endo et al., 1997; Hilton et al., 1998; Naka et al., 1997; Starr et
al., 1997). All SOCS proteins contain a central SH2 domain and a C-terminal SOCS box domain
(Hilton et al., 1998), which is involved in catalytic action of ubiquitination of bound signaling
proteins when binding to Elongins B and C and Cullin5 (Babon et al., 2009; Kamizono et al.,
2001; Zhang et al., 2001). Studies have shown that the two major suppressors of signaling,
SOCS1 and SOCS3, contain a kinase inhibitory region (KIR), which is a short motif, upstream of
their SH2 domain. The KIR allows SOCS1 and SOCS3 to suppress signaling by direct inhibition
of JAK catalytic activity (Sasaki et al., 1999; Yasukawa et al., 1999).
LIVER
Introduction of liver
The liver is one of the most complex and highly functioning organs in vertebrates. The
liver is composed of water (approximately 70% of the mass), protein (approximately 20% of the
mass), and other components (approximately 10% of the mass), such as lipid, glycogen, nuclei
acid, and minerals (Harrison, 1953). In an adult liver, approximately 80% of the mass is
accounted by a parenchymal cell type called a hepatocyte. Hepatocyte nuclei are distinctly
rounded, with one of two prominent nucleoli. Ultrastructural examination of hepatocytes
discovered bountiful quantities of both rough and smooth endoplasmic reticulum, reflective of
high level activities of hepatocytes in synthesis of protein and lipids. Also, hepatocytes contain
abundant Golgi, especially those located in the vicinity of the bile canaliculi, reflecting transport
of bile constituents into those channels (Avigan et al., 1984). Non-parenchymal cells constitute
9
40% of the total number of liver cells but only 6.5% of its volume (Lodish, 2000). Sinusoidal
hepatic endothelial cells, Kupffer cells and hepatic stellate cells are some of the non-
parenchymal cells that line the liver sinusoid, which is a type of blood vessel transporting the
oxygen-rich blood from the hepatic artery and the nutrient-rich blood from the portal vein
(Kmiec, 2001).
The liver is the largest internal organ providing essential metabolic, exocrine and
endocrine functions. One of the most important functions of the liver in metabolism is to
maintain normal blood glucose levels over both short (hours) and long (days to weeks) periods of
time (Penhos et al., 1975). Excess glucose in the blood is rapidly taken up by the liver and stored
as glycogen through the process called glycogenesis. When blood concentration of glucose
declines, the liver activates other pathways which lead to glycogeneolysis, a depolymerization of
glycogen to glucose-1-phosphate and glucose. The liver also plays a predominant role in lipid
metabolism. It is extremely active in oxidizing triglycerides to produce energy by exporting large
quantities of acetoacetate into blood where it can be taken up and metabolized by other tissues
(Mead, 1963). The liver synthesizes large quantities of lipoproteins, cholesterol and
phospholipids. Some of the cholesterol and phospholipids are packaged with lipoproteins and
transported to the other tissues. The liver is also the major site for converting excess
carbohydrate and protein into fatty acids and triglyceride, which are then exported and stored in
adipose tissue (Castro Mendoza et al., 1954). Besides the activities on carbohydrate and lipid
metabolism, the liver also plays a critical role in protein metabolism. The liver is responsible for
deamination and transamination of amino acids, followed by conversion of the non-nitrogenous
part of those molecules to glucose or lipids (Villano and D'Onofrio, 1955). Synthesis of non-
essential amino acids, albumin, a major plasma protein, and many of the clotting factors
10

necessary for blood coagulation is another major function of liver in protein metabolism (Peters
and Anfinsen, 1950). Liver is also responsible for removing ammonia from the body by synthesis
of urea (Blackshear et al., 1975). Ammonia is a toxin and will result in central nervous system
disease if is not rapidly and efficiently removed from the circulation.
The liver also acts as both an exocrine and endocrine gland. The major exocrine function
is the production of bile, which aids the digestion of lipids in the small intestine. As an endocrine
gland, the liver produces some very important hormones, including angiotensinogen,
thrombopoietin, and IGF-1 (Daughaday et al., 1976; McDonald, 1981; Tateishi and Masson,
1972).
Actions of growth hormone on liver
The liver is the main target of GH for serum IGF-1 production (Yakar et al., 1999). A
greater than 90% reduction in serum IGF-1 levels was observed in mice with liver-specific
deletion of the GH receptor (GHRLD mice) (Fan et al., 2009). On the other hand, it is believed
that IGF-1 does not affect hepatocyte function directly since the normal hepatocytes express low
level of IGF-1 receptors (Caro et al., 1988). However, GHRLD mice were observed to have
insulin resistance, glucose intolerance, increased free fatty acids (FFAs), decreased triglyceride
efflux, and severe steatosis, indicating the metabolic importance of GH on liver (Fan et al.,
2009). Mice bearing hepatocyte-specific deletion of JAK2 (JAK2L mice) showed lean body and
hepatic steatosis, but markedly elevated levels of GH, liver triglycerides (TGs), and FFAs. This
result combined with the fact that a cross between GH-deficient lit/lit mice and JAK2L mice
rescued hepatic steatosis phenotype, suggested that elevated GH and GH-induced lipolysis in
adipose tissue play a role in the prevention of hepatic steatosis (Sos et al., 2011). Moreover,
11
studies showed liver-specific STAT5-deficient mice displayed elevated expression of
peroxisome proliferator-activated receptor gamma (PPARγ), its target gene CD36, and its
downstream factor PPARγ coactivator 1 alpha/beta (PGC1α/β) in liver, which leads to an
increased uptake of FFA (Barclay et al., 2011). These studies together suggest that GH has a
direct action in the liver, particularly in the prevention of steatosis in hepatocytes.
Growth hormone also has growth-stimulating effects on liver. GH regulates the
proliferation capacity of hepatocytes, shown by the impairment of the liver regeneration ability
in GHRLD mice and several GH-deficient animal models (Ekberg et al., 1992; Krupczak-Hollis
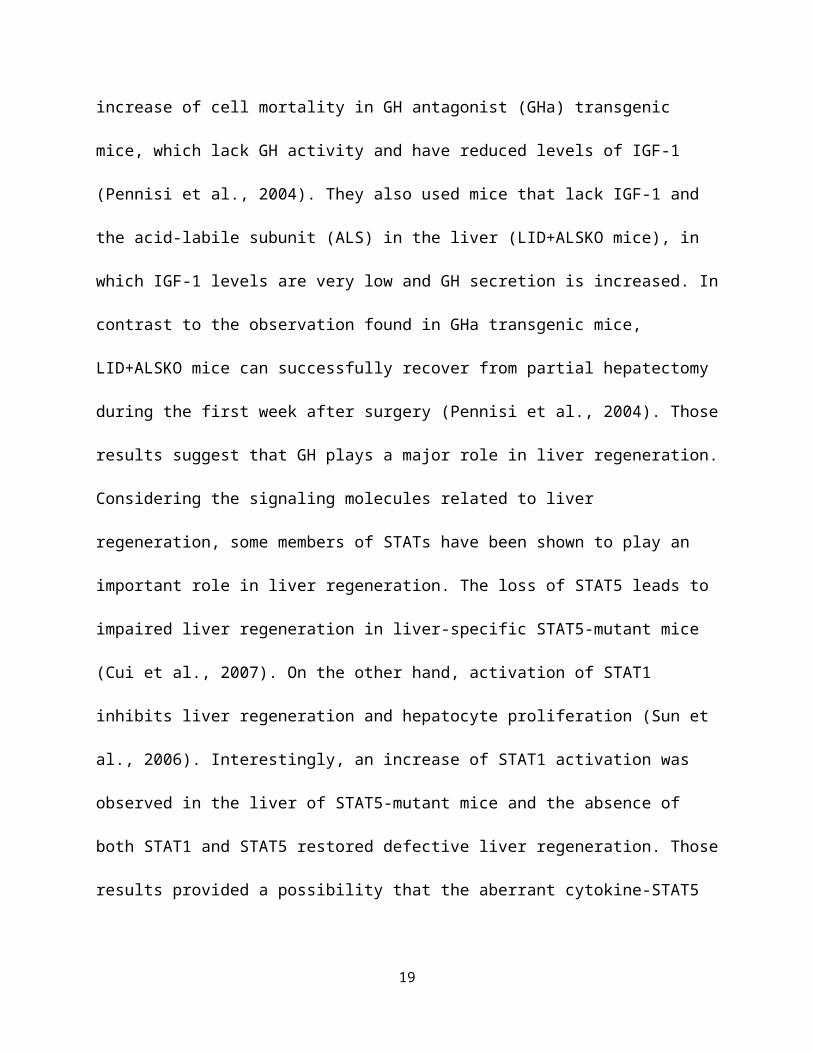
et al., 2003; Pennisi et al., 2004). Pennisi et al. in 2004 observed an impairment of liver
regeneration and an increase of cell mortality in GH antagonist (GHa) transgenic mice, which
lack GH activity and have reduced levels of IGF-1 (Pennisi et al., 2004). They also used mice
that lack IGF-1 and the acid-labile subunit (ALS) in the liver (LID+ALSKO mice), in which
IGF-1 levels are very low and GH secretion is increased. In contrast to the observation found in
GHa transgenic mice, LID+ALSKO mice can successfully recover from partial hepatectomy
during the first week after surgery (Pennisi et al., 2004). Those results suggest that GH plays a
major role in liver regeneration. Considering the signaling molecules related to liver
regeneration, some members of STATs have been shown to play an important role in liver
regeneration. The loss of STAT5 leads to impaired liver regeneration in liver-specific STAT5-
mutant mice (Cui et al., 2007). On the other hand, activation of STAT1 inhibits liver
regeneration and hepatocyte proliferation (Sun et al., 2006). Interestingly, an increase of STAT1
activation was observed in the liver of STAT5-mutant mice and the absence of both STAT1 and
STAT5 restored defective liver regeneration. Those results provided a possibility that the
12

aberrant cytokine-STAT5 signaling in hepatocytes alters their physiology through cross-talk with
STAT1 (Cui et al., 2007).
MYOGENESIS
Introduction of myogenesis
Skeletal muscle is a highly complex and heterogeneous tissue serving multiple functions
in the organism. The process of generating muscle is called myogenesis. Myogenesis begins
when cells in embryonic somites acquire myogenic potential, and then migrate to muscle-
forming regions. Those embryonic progenitor cells are called myoblasts. After a period of cell
division, the myoblasts withdraw from the cell cycle and fuse with each other to form
multinucleated cells, called myotubes (Stockdale, 1992). A type of cell that can also differentiate
into a muscle cell is called mesenchymal stem cell (MSC), which is proved to be pluripotent
(Fig. 3.1.). Those cells can differentiate into a variety of cell types, including myoblasts,
preadipocytes, osteoblasts, and chondrocytes (Beyer Nardi and da Silva Meirelles, 2006; Zuk et
al., 2002). Once the muscle has matured, these progenitors will enter quiescence as satellite cells.
Tissue homeostasis is important for mature skeletal muscle, as well as all renewing organs. The
maintenance of tissue homeostasis relies on a mechanism that compensates for the turnover of
terminally differentiated cells (Pellettieri and Sanchez Alvarado, 2007; Schmalbruch and Lewis,
2000). For this type of myogenesis, the mechanism depends on the activation of satellite cells
that have the potential to differentiate into new muscle fibers (Charge and Rudnicki, 2004).
Myogenesis is controlled by a complex transcriptional regulatory network (Fig. 1. 3.).
The network ultimately results in the expression of members of the basic helix-loop-helix
domain-containing myogenic regulatory factors (MRFs), which include myogenic factor 5
13

(Myf5), myogenic differentiation 1 (Myod1 or MyoD), myogenic regulatory factor 4 (MRF4,
also known as Myf6) and myogenin (Myog). MRFs all bind to similar sites on the DNA and
activate muscle-specific genes to generate the contractile properties of a mature skeletal-muscle
cell. The Wnt, Sonic hedgehog (Shh), and other signaling pathways have been shown to play a
role in muscle determination by inducing the expression of Myf5 and MyoD (Buckingham,
2001). Because double disruption of the Myf5 and MyoD genes leads to the absence of skeletal
myoblasts (Rudnicki et al., 1993), the expression of both genes is the key step in the commitment
of multipotential somite cells to the myogenic lineage. Myog plays a critical role in the fusion of
myogenic precursor cells to either new or previously existing fibers during the process of
differentiation in myogenesis. Myog mutants initiate normal myogenesis but possess defects in
the differentiation of myofibres (Hasty et al., 1993; Nabeshima et al., 1993). Studies of MRF4
knockout mice suggested that MRF4 acts downstream of the redundant activities of Myf5 and
MyoD, similarly to Myog (Patapoutian et al., 1995; Zhang et al., 1995). MRFs act downstream
of, or in parallel with, the paired domain and homeobox-containing transcription factors paired
box gene 3 (Pax3) and 7 (Pax7) in different phases of myogenesis in the embryo and adult. Pax3
seems to have a major role during primary myogenesis, meanwhile, Pax7 induces satellite cell
specification by restricting alternate developmental programs (Maroto et al., 1997; Seale et al.,
2000). Constitutive expression of Pax3 and Pax7 causes both primary satellite cell-derived
myoblasts and C2C12 immortalized myoblasts to increase their rate of cell division. This
observation indicated that Pax3 and Pax7 function to promote expansion of the adult muscle
precursor pool, which is consistent with the roles of these genes during embryonic development
(Collins et al., 2009).
14
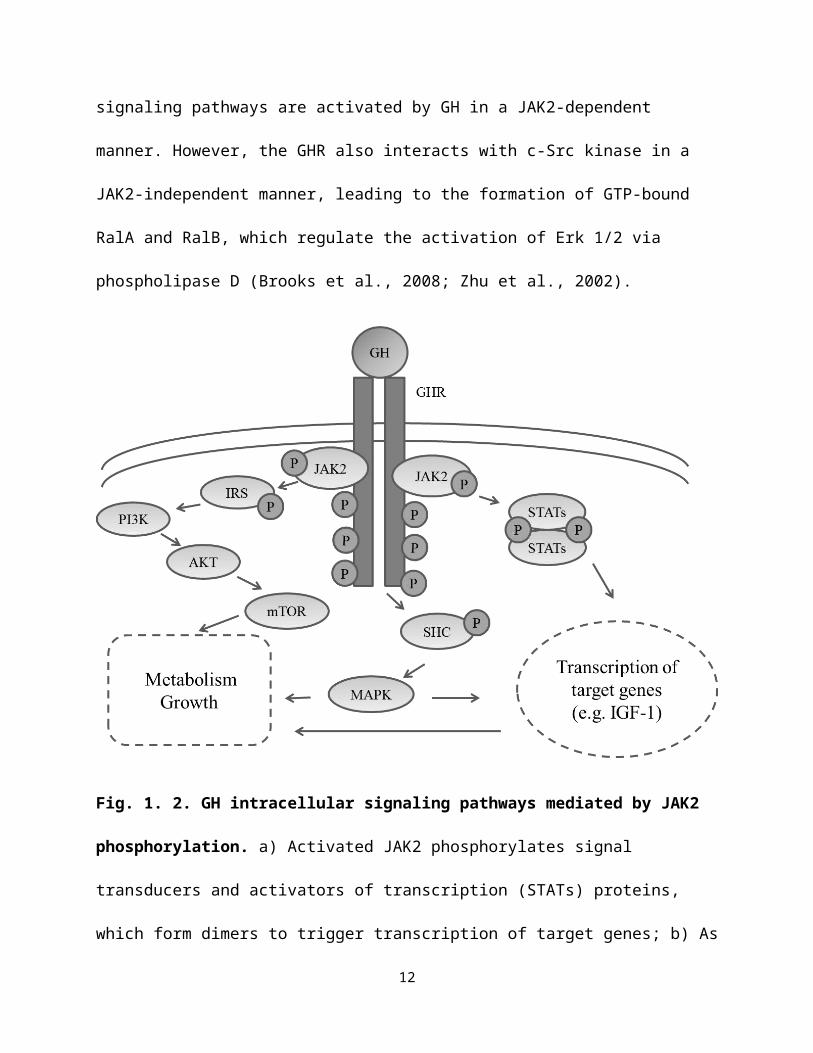
Fig. 1. 3. The steps of myogenesis from mesenchymal stem cells (MSCs). As MSCs commit
to the myogenic lineage, myoblasts are formed with the up-regulation of Pax7, Pax3 and Myf5.
Myoblasts are marked with Myf5 and MyoD during proliferation and finally differentiate and
fuse to form myotubes in the presence of Myogenin and MRF4. MRF, myogenic regulatory
factor. +, positive. -, negative.
Role of GH in myogenesis
GH coordinates the postnatal growth of skeletal muscle (Florini et al., 1996). This effect
of GH has been exploited to increase lean body mass and protein synthesis in GH-deficient
patients and muscle wasting diseases (Hoffman et al., 2004; McNurlan et al., 1997). According
to recently modified somatomedin hypothesis, most of the growth-promoting actions of GH are
mediated by circulating or locally produced IGF-1 (Le Roith et al., 2001), which is a critical
myogenic agent involved in muscle growth (Florini et al., 1996; Shavlakadze et al., 2005).
Several studies have shown that GH treatment increases IGF-1 mRNA expression level in
skeletal muscles as well as the myoblast cell line C2C12 (Florini et al., 1996; Frost et al., 2002;
15

Sadowski et al., 2001). However, the growth retardation of double GHR/IGF-1 mutants is more
severe than that observed with single mutant; it is likely that there are anabolic effects of GH that
are not mediated by IGF-1 (Lupu et al., 2001). IGF-I-independent effect of GH on muscle
growth is supported by recent studies showing that GH did not stimulate IGF-1 mRNA
expression in muscle cells in both cattle and mouse at physiological and supraphysiological
concentrations (Ge et al., 2012; Sotiropoulos et al., 2006). GH has been shown to stimulate the
fusion of murine myoblasts into myotubes (Florini et al., 1991; Heron-Milhavet et al., 2010; Hsu
et al., 1997; Mavalli et al., 2010; Sotiropoulos et al., 2006). However, the same effect was not
observed for bovine myoblasts. In bovine muscle cells, the major IGF-I-independent effect of
GH seems to be stimulating protein synthesis (Ge et al., 2012).
ADIPOGENESIS
Introduction of adipogenesis
Adipose tissue is loose connective tissue serving as the major form of energy storage.
Adipogenesis, the process of cell differentiation from stem cells to adipocytes, occurs in both the
prenatal and postnatal stages in multiple, dispersed sites around the body. The nascent adipocytes
are derived from preadipocytes, which in turn are derived from multipotent mesenchymal stem
cells (MSCs). Preadipocytes proliferate further to expand the population, and undergo growth
arrest before differentiating into adipocytes. Nascent adipocytes have multiple small lipid
droplets, while mature adipocytes contain a sin;gle large fat droplet surrounded by a thin rim of
cytoplasm that lies between the droplet and the plasma membrane in each cell (Tang et al., 2005;
Tang and Lane, 1999; Tang et al., 2003a, b) (Fig. 1. 4.).
16

Several factors have been identified that commit or inhibit the conversion of MSCs to the
adipocyte lineage. Studies showed that bone morphogenetic protein 4 (BMP4) can induce
C3H10T1/2 cells, which are a widely used MSC model, to commit to the adipocyte lineage
(Bowers et al., 2006; Bowers and Lane, 2007; Tang et al., 2004). BMP4 belongs to the BMP
family, which is a part of transforming growth factor-β superfamily (Chen et al., 1998; Dale and
Jones, 1999; Ebara and Nakayama, 2002). C3H10T1/2 cells treated with BMP4 produce fat pad
in athymic mice after subcutaneous implantation. However, untreated cells do not undergo this
transformation (Tang et al., 2004). Wnt proteins are known to act upstream of BMP4 in some
instances. However, the linkage between Wnt signaling and adipogenesis was first recognized
through the finding that Wnt10b expression level decreased dramatically during the process of
adipocyte differentiation (Ross et al., 2000). Wnt signaling inhibits the differentiation of
preadipocytes into mature adipocytes through the inhibition of the adipogenic transcription
factors CCAAT/enhancer binding protein α (C/EBPα) and peroxisome proliferator-activated
receptor γ (PPARγ) (Ross et al., 2000). C/EBPα is one of the six members of C/EBPs, which is a
family of transcription factors. C/EBPα, C/EBPβ, C/EBPδ and PPARγ, which is a type II
nuclear receptor, play critical roles in the process of adipogenesis (Rosen et al., 2000). The
expression levels of C/EBPβ and C/EBPδ rapidly increase at the beginning of hormonal
induction of differentiation of adipogenic cell lines 3T3-L1 and 3T3-F442A (Cao et al., 1991;
Yeh et al., 1995). Concentrations of these proteins peak and then begin to decrease within the
next day, followed by a rise in C/EBPα and PPARγ. The two latter factors change the
characteristics of mature adipocytes through changing the expression of related genes and remain
elevated for the life of the cell. They are induced by C/EBPβ and C/EBPδ and then able to induce
each other’s expression in a positive feedback loop that promotes and maintains the
17

differentiated state. Although C/EBPβ and C/EBPδ play important roles in adipogenesis, mice
lacking both factors exhibited normal PPARγ expression in adipose tissue, indicating that there
are other pathways responsible for the maintenance of PPARγ expression level (Tanaka et al.,
1997). In addition, studies also showed C/EBPα or PPARγ can independently promote
adipogenesis in fibroblast cell lines (Lin and Lane, 1994; Tontonoz et al., 1994).
Fig. 1. 4. The steps of adipogenesis from mesenchymal stem cells (MSCs). As MSCs commit
to the adipogenic lineage, preadipocytes are formed. Preadipocytes proliferate, exit cell cycle,
and undergo a series of differentiation before becoming mature adipocytes.
Role of GH on adipogenesis
Various studies have shown that GH plays a critical role in the formation of adipose
tissue. An increase in body fat was observed after hypophysectomy in rats (Li et al., 1949; Scow,
1959). In both children and adults, GH-deficient (GHD) patients exhibit higher body fat mass
and lower lean body mass (Bonnet and Mathieu, 1974; Rosen et al., 1993; Salomon et al., 1989).
In these cases, GH treatment of GH-deficient patients results in a reduction in body fat
(Bengtsson et al., 1993; Wabitsch et al., 1995; Zachmann et al., 1980). GHD patients exhibit a
decreased number and an increased mean volume of adipocytes, and this abnormal adipose tissue
18
composition is normalized by GH replacement therapy (Bengtsson et al., 1993; Bonnet et al.,
1974; Salomon et al., 1989).
However, studies of mechanism of GH action on adipogenesis have generated
controversial results. Studies on preadipocytes cell lines such as 3T3-F442A have shown that GH
is strictly required in the conversion of preadipocytes to adipocytes and plays a role in priming
the cells to become responsive to insulin and IGF-1 (Corin et al., 1990; Guller et al., 1989;
Wabitsch et al., 1995). It was further found that GH stimulated PPARγ-induced adipogenesis in
3T3-L1 cells through Stat5A/5B and that GH enhanced the transcriptional activity of PPARγ by
stimulating the expression of C/EBPβ and C/EBPδ, two transcription factors expressed at early
stages of differentiation (Kawai et al., 2007). GH is also found to stimulate c-fos and c-jun,
which are involved in cell growth and differentiation (Gurland et al., 1990; Sumantran et al.,
1992). These results indicated a stimulatory effect of GH on adipogenesis.
In contrast, an inhibitory effect of GH on adipogenesis was reported in primary
preadipocytes (Hansen et al., 1998; Richter et al., 2003; Wabitsch et al., 1996). GH has been
reported to inhibit the fat cell cluster formation during the differentiation of pig stromal vascular
cells, which are considered preadipocytes in vivo (Hausman and Martin, 1989). In primary
preadipocytes from rats, GH markedly reduced the formation of new adipocytes and the activity
of glycerol-3-phosphate dehydrogenase (G3PDH), which is a marker enzyme of adipocytes
differentiation, in a dose-dependent manner (Wabitsch et al., 1996). It has been reported that GH
had the inhibitory effect on PPARγ expression and that GH reduced the DNA binding activity of
PPARγ/retinoid X receptor-α (RXRα) to the binding element of the adipocyte protein 2 gene
(aP2 gene), which is critical for intracellular lipid accumulation (Hansen et al., 1998). This effect
was not dependent on the MAPK pathway. Moreover, STAT5 has been shown to act as the
19

repressing modulator of GH-mediated inhibition in primary preadipocytes through the repression
of genes required for terminal differentiation (Richter et al., 2003).
The conflicting GH actions on adipogenesis may be due to the different characteristics of
preadipocyte cell lines and primary preadipocytes. It was believed that, compared to the
established preadipocyte cell lines, primary preadipocytes may have been at a later stage of
adipogenesis (Gregoire et al., 1998; Nam and Marcus, 2000; Wabitsch et al., 1995). If this is
true, it would be interesting to know what effect GH has on early adipogenesis, which is the
stage from stem cells to preadipocytes.
CONCLUDING REMARKS
GH is a peptide hormone that has important functions in regulating somatic growth either
directly or indirectly via effectors such as IGF-1. The secretion of GH is up-regulated by GHRH
and down-regulated by somatostatin. As an endocrine hormone, GH is transported in blood to
perform different effects on its target tissues, including liver, muscle, and adipose tissue.
Liver is a vital organ preforming a wide range of functions, including detoxification,
protein synthesis, blood glucose regulation, and production of biochemical necessary for
digestion. GH is not only important for liver IGF-1 secretion and fat metabolism, but also plays a
critical role in liver regeneration. Moreover, it has been shown that, during liver regeneration,
GH stimulates the proliferation capacity of hepatocytes through signaling pathways that involve
STAT proteins. However, it remains unclear if GH stimulates hepatocyte proliferation in normal
liver growth.
GH clearly stimulates skeletal muscle growth. Skeletal muscle is generated through a
process called myogenesis. The process starts from the commitment of stem cells to myoblasts,
20

followed by myoblast proliferation, and finally differentiation and fusion of myoblasts into
myotubes. GH increases the production of IGF-1 in the myoblast cell line C2C12, but not in
primary murine and bovine muscle cells. GH stimulates the fusion of murine myoblast into
myotubes, but does not have the same effect on primary bovine myoblasts. Thus, the mechanism
by which GH stimulates myogenesis remains unclear.
Adipose tissue is another main target of GH action. Adipocytes are formed from
preadipocytes, which are derived from MSCs. Studies have shown that GH has a strong
inhibitory effect on adipose tissue growth. However, studies of the mechanism of GH action on
adipogenesis have generated controversial results. For example, GH stimulates preadipocyte cell
lines to become adipocytes, but has the opposite effect on primary preadipocytes.
Clearly, additional studies need to be conducted to understand how GH regulates the
growth of liver, skeletal muscle, and fat tissue.
21
REFERENCES
Avigan, M. I., K. G. Ishak, R. E. Gregg, and J. H. Hoofnagle. 1984. Morphologic features of the liver in abetalipoproteinemia. Hepatology 4: 1223-1226.
Babon, J. J., J. K. Sabo, J. G. Zhang, N. A. Nicola, and R. S. Norton. 2009. The SOCS box encodes a hierarchy of affinities for Cullin5: implications for ubiquitin ligase formation and cytokine signalling suppression. Journal of molecular biology 387: 162-174.
Barclay, J. L. et al. 2011. GH-dependent STAT5 signaling plays an important role in hepatic lipid metabolism. Endocrinology 152: 181-192.
Baumann, G. 1999. Growth hormone heterogeneity in human pituitary and plasma. Hormone research 51 Suppl 1: 2-6.
Baumann, G. P. 2009. Growth hormone isoforms. Growth hormone & IGF research : official journal of the Growth Hormone Research Society and the International IGF Research Society 19: 333-340.
Bengtsson, B. A. et al. 1993. Treatment of adults with growth hormone (GH) deficiency with recombinant human GH. J Clin Endocrinol Metab 76: 309-317.
Beyer Nardi, N., and L. da Silva Meirelles. 2006. Mesenchymal stem cells: isolation, in vitro expansion and characterization. Handbook of experimental pharmacology: 249-282.
Bilezikjian, L. M., and W. W. Vale. 1983. Stimulation of adenosine 3',5'-monophosphate production by growth hormone-releasing factor and its inhibition by somatostatin in anterior pituitary cells in vitro. Endocrinology 113: 1726-1731.
Blackshear, P. J., P. A. Holloway, and K. G. Alberti. 1975. Factors regulating amino acid release from extrasplanchnic tissues in the rat. Interactions of alanine and glutamine. The Biochemical journal 150: 379-387.
Bonnet, F., M. Vanderschueren-Lodeweyckx, R. Eeckels, and P. Malvaux. 1974. Subcutaneous adipose tissue and lipids in blood in growth hormone deficiency before and after treatment with human growth hormone. Pediatric research 8: 800-805.
Bonnet, F. P., and J. P. Mathieu. 1974. [A new trend in the treatment of childhood obesity]. Acta paediatrica Belgica 28: 250-260.
Bowers, R. R., J. W. Kim, T. C. Otto, and M. D. Lane. 2006. Stable stem cell commitment to the adipocyte lineage by inhibition of DNA methylation: role of the BMP-4 gene. Proceedings of the National Academy of Sciences of the United States of America 103: 13022-13027.
Bowers, R. R., and M. D. Lane. 2007. A role for bone morphogenetic protein-4 in adipocyte development. Cell cycle 6: 385-389.
Brazeau, P. et al. 1973. Hypothalamic polypeptide that inhibits the secretion of immunoreactive pituitary growth hormone. Science 179: 77-79.
Brooks, A. J., J. W. Wooh, K. A. Tunny, and M. J. Waters. 2008. Growth hormone receptor; mechanism of action. The international journal of biochemistry & cell biology 40: 1984-1989.
Buckingham, M. 2001. Skeletal muscle formation in vertebrates. Current opinion in genetics & development 11: 440-448.
Cao, Z., R. M. Umek, and S. L. McKnight. 1991. Regulated expression of three C/EBP isoforms during adipose conversion of 3T3-L1 cells. Genes & development 5: 1538-1552.
Cargnello, M., and P. P. Roux. 2011. Activation and function of the MAPKs and their substrates, the MAPK-activated protein kinases. Microbiology and molecular biology reviews : MMBR 75: 50-83.
22

Caro, J. F. et al. 1988. Insulin-like growth factor I binding in hepatocytes from human liver, human hepatoma, and normal, regenerating, and fetal rat liver. The Journal of clinical investigation 81: 976-981.
Castro Mendoza, H., C. Jimenez Diaz, and R. Ortega Mata. 1954. Effects of cholic acid on cholesterol deposits and on plasma lipids and lipoproteins. Bulletin of the Institute for Medical Research, University of Madrid 7: 99-125.
Charge, S. B., and M. A. Rudnicki. 2004. Cellular and molecular regulation of muscle regeneration. Physiological reviews 84: 209-238.
Chen, D. et al. 1998. Differential roles for bone morphogenetic protein (BMP) receptor type IB and IA in differentiation and specification of mesenchymal precursor cells to osteoblast and adipocyte lineages. The Journal of cell biology 142: 295-305.
Collins, C. A. et al. 2009. Integrated functions of Pax3 and Pax7 in the regulation of proliferation, cell size and myogenic differentiation. PloS one 4: e4475.
Corin, R. E., S. Guller, K. Y. Wu, and M. Sonenberg. 1990. Growth hormone and adipose differentiation: growth hormone-induced antimitogenic state in 3T3-F442A preadipose cells. Proceedings of the National Academy of Sciences of the United States of America 87: 7507-7511.
Cosman, D. et al. 1990. A new cytokine receptor superfamily. Trends in biochemical sciences 15: 265-270.
Cui, Y. et al. 2007. Loss of signal transducer and activator of transcription 5 leads to hepatosteatosis and impaired liver regeneration. Hepatology 46: 504-513.
Dale, L., and C. M. Jones. 1999. BMP signalling in early Xenopus development. BioEssays : news and reviews in molecular, cellular and developmental biology 21: 751-760.
Daughaday, W. H., L. S. Phillips, and M. C. Mueller. 1976. The effects of insulin and growth hormone on the release of somatomedin by the isolated rat liver. Endocrinology 98: 1214-1219.
DeAlmeida, V. I., and K. E. Mayo. 1998. Identification of binding domains of the growth hormone-releasing hormone receptor by analysis of mutant and chimeric receptor proteins. Molecular endocrinology 12: 750-765.
Dikic, I., and A. Blaukat. 1999. Protein tyrosine kinase-mediated pathways in G protein-coupled receptor signaling. Cell biochemistry and biophysics 30: 369-387.
Ebara, S., and K. Nakayama. 2002. Mechanism for the action of bone morphogenetic proteins and regulation of their activity. Spine 27: S10-15.
Ekberg, S., M. Luther, T. Nakamura, and J. O. Jansson. 1992. Growth hormone promotes early initiation of hepatocyte growth factor gene expression in the liver of hypophysectomized rats after partial hepatectomy. The Journal of endocrinology 135: 59-67.
Endo, T. A. et al. 1997. A new protein containing an SH2 domain that inhibits JAK kinases. Nature 387: 921-924.
Fan, Y. et al. 2009. Liver-specific deletion of the growth hormone receptor reveals essential role of growth hormone signaling in hepatic lipid metabolism. The Journal of biological chemistry 284: 19937-19944.
Florini, J. R., D. Z. Ewton, and S. A. Coolican. 1996. Growth hormone and the insulin-like growth factor system in myogenesis. Endocrine reviews 17: 481-517.
Florini, J. R., D. Z. Ewton, and S. L. Roof. 1991. Insulin-like growth factor-I stimulates terminal myogenic differentiation by induction of myogenin gene expression. Molecular endocrinology 5: 718-724.
23
Frank, S. J. 2001. Growth hormone signalling and its regulation: preventing too much of a good thing. Growth hormone & IGF research : official journal of the Growth Hormone Research Society and the International IGF Research Society 11: 201-212.
Frohman, L. A. K., R.D. 1999. Growth hormone-releasing hormone: discovery, regulation, and actions. Oxford University Press, New York.
Frost, R. A., G. J. Nystrom, and C. H. Lang. 2002. Regulation of IGF-I mRNA and signal transducers and activators of transcription-3 and -5 (Stat-3 and -5) by GH in C2C12 myoblasts. Endocrinology 143: 492-503.
Fryburg, D. A., and E. J. Barrett. 1993. Growth hormone acutely stimulates skeletal muscle but not whole-body protein synthesis in humans. Metabolism: clinical and experimental 42: 1223-1227.
Ge, X., J. Yu, and H. Jiang. 2012. Growth hormone stimulates protein synthesis in bovine skeletal muscle cells without altering insulin-like growth factor-I mRNA expression. Journal of animal science 90: 1126-1133.
Gregoire, F. M., C. M. Smas, and H. S. Sul. 1998. Understanding adipocyte differentiation. Physiological reviews 78: 783-809.
Guevara-Aguirre, J. et al. 1997. Two-year treatment of growth hormone (GH) receptor deficiency with recombinant insulin-like growth factor I in 22 children: comparison of two dosage levels and to GH-treated GH deficiency. The Journal of clinical endocrinology and metabolism 82: 629-633.
Guller, S., M. Sonenberg, K. Y. Wu, P. Szabo, and R. E. Corin. 1989. Growth hormone-dependent events in the adipose differentiation of 3T3-F442A fibroblasts: modulation of macromolecular synthesis. Endocrinology 125: 2360-2367.
Gurland, G., G. Ashcom, B. H. Cochran, and J. Schwartz. 1990. Rapid events in growth hormone action. Induction of c-fos and c-jun transcription in 3T3-F442A preadipocytes. Endocrinology 127: 3187-3195.
Hansen, L. H., B. Madsen, B. Teisner, J. H. Nielsen, and N. Billestrup. 1998. Characterization of the inhibitory effect of growth hormone on primary preadipocyte differentiation. Mol Endocrinol 12: 1140-1149.
Harmar, A. J. 2001. Family-B G-protein-coupled receptors. Genome biology 2: REVIEWS3013.Harrison, M. F. 1953. Composition of the liver cell. Proceedings of the Royal Society of London.
Series B, Containing papers of a Biological character. Royal Society 141: 203-216.Hasty, P. et al. 1993. Muscle deficiency and neonatal death in mice with a targeted mutation in
the myogenin gene. Nature 364: 501-506.Hausman, G. J., and R. J. Martin. 1989. The influence of human growth hormone on
preadipocyte development in serum-supplemented and serum-free cultures of stromal-vascular cells from pig adipose tissue. Domestic animal endocrinology 6: 331-337.
Hayashi, A. A., and C. G. Proud. 2007. The rapid activation of protein synthesis by growth hormone requires signaling through mTOR. American journal of physiology. Endocrinology and metabolism 292: E1647-1655.
Heron-Milhavet, L., D. Mamaeva, D. LeRoith, N. J. Lamb, and A. Fernandez. 2010. Impaired muscle regeneration and myoblast differentiation in mice with a muscle-specific KO of IGF-IR. Journal of cellular physiology 225: 1-6.
Hilton, D. J. et al. 1998. Twenty proteins containing a C-terminal SOCS box form five structural classes. Proceedings of the National Academy of Sciences of the United States of America 95: 114-119.
24

Hoffman, A. R. et al. 2004. Growth hormone (GH) replacement therapy in adult-onset gh deficiency: effects on body composition in men and women in a double-blind, randomized, placebo-controlled trial. The Journal of clinical endocrinology and metabolism 89: 2048-2056.
Hsu, H. H., M. M. Zdanowicz, V. R. Agarwal, and P. W. Speiser. 1997. Expression of myogenic regulatory factors in normal and dystrophic mice: effects of IGF-1 treatment. Biochemical and molecular medicine 60: 142-148.
Ihle, J. N. 1995. Cytokine receptor signalling. Nature 377: 591-594.Isaksson, O. G., J. O. Jansson, and I. A. Gause. 1982. Growth hormone stimulates longitudinal
bone growth directly. Science 216: 1237-1239.Jacob, R., E. Barrett, G. Plewe, K. D. Fagin, and R. S. Sherwin. 1989. Acute effects of insulin-
like growth factor I on glucose and amino acid metabolism in the awake fasted rat. Comparison with insulin. The Journal of clinical investigation 83: 1717-1723.
Kajkowski, E. M., L. A. Price, M. H. Pausch, K. H. Young, and B. A. Ozenberger. 1997. Investigation of growth hormone releasing hormone receptor structure and activity using yeast expression technologies. Journal of receptor and signal transduction research 17: 293-303.
Kamizono, S. et al. 2001. The SOCS box of SOCS-1 accelerates ubiquitin-dependent proteolysis of TEL-JAK2. The Journal of biological chemistry 276: 12530-12538.
Kawai, M. et al. 2007. Growth hormone stimulates adipogenesis of 3T3-L1 cells through activation of the Stat5A/5B-PPARgamma pathway. Journal of molecular endocrinology 38: 19-34.
Kmiec, Z. 2001. Cooperation of liver cells in health and disease. Springer, US.Kolakowski, L. F., Zhuang, J. 1997. G protein-coupled receptor family B, in the G protein-
coupled receptor database, World Wide Web site. http://www.gcrdb.uthscsa.edu/FB_intro.html.
Krupczak-Hollis, K., X. Wang, M. B. Dennewitz, and R. H. Costa. 2003. Growth hormone stimulates proliferation of old-aged regenerating liver through forkhead box m1b. Hepatology 38: 1552-1562.
Lanning, N. J., and C. Carter-Su. 2006. Recent advances in growth hormone signaling. Reviews in endocrine & metabolic disorders 7: 225-235.
Le Roith, D., C. Bondy, S. Yakar, J. L. Liu, and A. Butler. 2001. The somatomedin hypothesis: 2001. Endocrine reviews 22: 53-74.
Li, C. H., M. E. Simpson, and H. M. Evans. 1949. Influence of growth and adrenocorticotropic hormones on the body composition of hypophysectomized rats. Endocrinology 44: 71-75.
Liang, L. et al. 1999. Insulin receptor substrate-1 enhances growth hormone-induced proliferation. Endocrinology 140: 1972-1983.
Lin, F. T., and M. D. Lane. 1994. CCAAT/enhancer binding protein alpha is sufficient to initiate the 3T3-L1 adipocyte differentiation program. Proceedings of the National Academy of Sciences of the United States of America 91: 8757-8761.
Ling, N. et al. 1984. Isolation, primary structure, and synthesis of human hypothalamic somatocrinin: growth hormone-releasing factor. Proceedings of the National Academy of Sciences of the United States of America 81: 4302-4306.
Lodish, H., Berk, A., Zipursky, S. L., Matsudaira, P., Baltimore, D., Darnell, J. E. 2000. Molecular Cell Biology. 5th ed. W. J. Freeman and Company, New York.
25

Lupu, F., J. D. Terwilliger, K. Lee, G. V. Segre, and A. Efstratiadis. 2001. Roles of growth hormone and insulin-like growth factor 1 in mouse postnatal growth. Developmental biology 229: 141-162.
Maroto, M. et al. 1997. Ectopic Pax-3 activates MyoD and Myf-5 expression in embryonic mesoderm and neural tissue. Cell 89: 139-148.
Mavalli, M. D. et al. 2010. Distinct growth hormone receptor signaling modes regulate skeletal muscle development and insulin sensitivity in mice. The Journal of clinical investigation 120: 4007-4020.
Mayo, K. E., P. A. Godfrey, S. T. Suhr, D. J. Kulik, and J. O. Rahal. 1995. Growth hormone-releasing hormone: synthesis and signaling. Recent progress in hormone research 50: 35-73.
McDonald, T. P. 1981. Assay and site of production of thrombopoietin. British journal of haematology 49: 493-499.
McNurlan, M. A. et al. 1997. Responsiveness of muscle protein synthesis to growth hormone administration in HIV-infected individuals declines with severity of disease. The Journal of clinical investigation 100: 2125-2132.
Mead, J. F. 1963. Lipid Metabolism. Annual review of biochemistry 32: 241-268.Merchenthaler, I., C. R. Thomas, and A. Arimura. 1984. Immunocytochemical localization of
growth hormone releasing factor (GHRF)-containing structures in the rat brain using anti-rat GHRF serum. Peptides 5: 1071-1075.
Moller, N., and J. O. Jorgensen. 2009. Effects of growth hormone on glucose, lipid, and protein metabolism in human subjects. Endocrine reviews 30: 152-177.
Morgensztern, D., and H. L. McLeod. 2005. PI3K/Akt/mTOR pathway as a target for cancer therapy. Anti-cancer drugs 16: 797-803.
Nabeshima, Y. et al. 1993. Myogenin gene disruption results in perinatal lethality because of severe muscle defect. Nature 364: 532-535.
Naka, T. et al. 1997. Structure and function of a new STAT-induced STAT inhibitor. Nature 387: 924-929.
Nam, S. Y., and C. Marcus. 2000. Growth hormone and adipocyte function in obesity. Hormone research 53 Suppl 1: 87-97.
Noel, M., D. Chevenne, and D. Porquet. 2001. Utility of insulin-like growth factor-I and its binding protein assays. Current opinion in clinical nutrition and metabolic care 4: 399-405.
Patapoutian, A. et al. 1995. Disruption of the mouse MRF4 gene identifies multiple waves of myogenesis in the myotome. Development 121: 3347-3358.
Pellettieri, J., and A. Sanchez Alvarado. 2007. Cell turnover and adult tissue homeostasis: from humans to planarians. Annual review of genetics 41: 83-105.
Penhos, J. C., M. Ezequiel, A. Lepp, and E. R. Ramey. 1975. Plasma immunoreactive insulin (IRI) and immunoreactive glucagon (IRG) after evisceration with and without a functional liver. Diabetes 24: 637-640.
Pennisi, P. A., J. J. Kopchick, S. Thorgeirsson, D. LeRoith, and S. Yakar. 2004. Role of growth hormone (GH) in liver regeneration. Endocrinology 145: 4748-4755.
Peters, T., Jr., and C. B. Anfinsen. 1950. Net production of serum albumin by liver slices. The Journal of biological chemistry 186: 805-813.
26
Ranke, M. B. et al. 1999. Long-term treatment of growth hormone insensitivity syndrome with IGF-I. Results of the European Multicentre Study. The Working Group on Growth Hormone Insensitivity Syndromes. Hormone research 51: 128-134.
Reed, D. K. et al. 1999. Pituitary somatostatin receptor (sst)1-5 expression during rat development: age-dependent expression of sst2. Endocrinology 140: 4739-4744.
Richter, H. E., T. Albrektsen, and N. Billestrup. 2003. The role of signal transducer and activator of transcription 5 in the inhibitory effects of GH on adipocyte differentiation. Journal of molecular endocrinology 30: 139-150.
Rosen, E. D., C. J. Walkey, P. Puigserver, and B. M. Spiegelman. 2000. Transcriptional regulation of adipogenesis. Genes & development 14: 1293-1307.
Rosen, T., I. Bosaeus, J. Tolli, G. Lindstedt, and B. A. Bengtsson. 1993. Increased body fat mass and decreased extracellular fluid volume in adults with growth hormone deficiency. Clin Endocrinol (Oxf) 38: 63-71.
Ross, S. E. et al. 2000. Inhibition of adipogenesis by Wnt signaling. Science 289: 950-953.Rudling, M. et al. 1992. Importance of growth hormone for the induction of hepatic low density
lipoprotein receptors. Proceedings of the National Academy of Sciences of the United States of America 89: 6983-6987.
Rudnicki, M. A. et al. 1993. MyoD or Myf-5 is required for the formation of skeletal muscle. Cell 75: 1351-1359.
Sadowski, C. L., T. T. Wheeler, L. H. Wang, and H. B. Sadowski. 2001. GH regulation of IGF-I and suppressor of cytokine signaling gene expression in C2C12 skeletal muscle cells. Endocrinology 142: 3890-3900.
Salomon, F., R. C. Cuneo, R. Hesp, and P. H. Sonksen. 1989. The effects of treatment with recombinant human growth hormone on body composition and metabolism in adults with growth hormone deficiency. The New England journal of medicine 321: 1797-1803.
Sasaki, A. et al. 1999. Cytokine-inducible SH2 protein-3 (CIS3/SOCS3) inhibits Janus tyrosine kinase by binding through the N-terminal kinase inhibitory region as well as SH2 domain. Genes to cells : devoted to molecular & cellular mechanisms 4: 339-351.
Sawangjaroen, K., S. T. Anderson, and J. D. Curlewis. 1997. Effects of pituitary adenylate cyclase-activating polypeptide (PACAP) and vasoactive intestinal polypeptide (VIP) on hormone secretion from sheep pituitary cells in vitro. Journal of neuroendocrinology 9: 279-286.
Schlechter, N. L., S. M. Russell, E. M. Spencer, and C. S. Nicoll. 1986. Evidence suggesting that the direct growth-promoting effect of growth hormone on cartilage in vivo is mediated by local production of somatomedin. Proceedings of the National Academy of Sciences of the United States of America 83: 7932-7934.
Schmalbruch, H., and D. M. Lewis. 2000. Dynamics of nuclei of muscle fibers and connective tissue cells in normal and denervated rat muscles. Muscle & nerve 23: 617-626.
Scow, R. O. 1959. Effect of growth hormone and thyroxine on growth and chemical composition of muscle, bone and other tissues in thyroidectomized-hypophysectomized rats. The American journal of physiology 196: 859-865.
Seale, P. et al. 2000. Pax7 is required for the specification of myogenic satellite cells. Cell 102: 777-786.
Selbie, L. A., and S. J. Hill. 1998. G protein-coupled-receptor cross-talk: the fine-tuning of multiple receptor-signalling pathways. Trends in pharmacological sciences 19: 87-93.
27

Shavlakadze, T., N. Winn, N. Rosenthal, and M. D. Grounds. 2005. Reconciling data from transgenic mice that overexpress IGF-I specifically in skeletal muscle. Growth hormone & IGF research : official journal of the Growth Hormone Research Society and the International IGF Research Society 15: 4-18.
Smit, L. S. et al. 1996. The role of the growth hormone (GH) receptor and JAK1 and JAK2 kinases in the activation of Stats 1, 3, and 5 by GH. Molecular endocrinology 10: 519-533.
Sos, B. C. et al. 2011. Abrogation of growth hormone secretion rescues fatty liver in mice with hepatocyte-specific deletion of JAK2. The Journal of clinical investigation 121: 1412-1423.
Sotiropoulos, A. et al. 1996. Differential activation of Stat3 and Stat5 by distinct regions of the growth hormone receptor. Molecular endocrinology 10: 998-1009.
Sotiropoulos, A. et al. 2006. Growth hormone promotes skeletal muscle cell fusion independent of insulin-like growth factor 1 up-regulation. Proceedings of the National Academy of Sciences of the United States of America 103: 7315-7320.
Souza, S. C. et al. 1994. Growth hormone stimulates tyrosine phosphorylation of insulin receptor substrate-1. The Journal of biological chemistry 269: 30085-30088.
Spiess, J., J. Rivier, and W. Vale. 1983. Characterization of rat hypothalamic growth hormone-releasing factor. Nature 303: 532-535.
Starr, R. et al. 1997. A family of cytokine-inducible inhibitors of signalling. Nature 387: 917-921.
Stockdale, F. E. 1992. Myogenic cell lineages. Developmental biology 154: 284-298.Sumantran, V. N., M. L. Tsai, and J. Schwartz. 1992. Growth hormone induces c-fos and c-jun
expression in cells with varying requirements for differentiation. Endocrinology 130: 2016-2024.
Sun, R. et al. 2006. STAT1 contributes to dsRNA inhibition of liver regeneration after partial hepatectomy in mice. Hepatology 44: 955-966.
Szabo, M., M. E. Stachura, N. Paleologos, D. E. Bybee, and L. A. Frohman. 1984. Thyrotropin-releasing hormone stimulates growth hormone release from the anterior pituitary of hypothyroid rats in vitro. Endocrinology 114: 1344-1351.
Tanaka, T., N. Yoshida, T. Kishimoto, and S. Akira. 1997. Defective adipocyte differentiation in mice lacking the C/EBPbeta and/or C/EBPdelta gene. The EMBO journal 16: 7432-7443.
Tang, Q. Q. et al. 2005. Sequential phosphorylation of CCAAT enhancer-binding protein beta by MAPK and glycogen synthase kinase 3beta is required for adipogenesis. Proceedings of the National Academy of Sciences of the United States of America 102: 9766-9771.
Tang, Q. Q., and M. D. Lane. 1999. Activation and centromeric localization of CCAAT/enhancer-binding proteins during the mitotic clonal expansion of adipocyte differentiation. Genes & development 13: 2231-2241.
Tang, Q. Q., T. C. Otto, and M. D. Lane. 2003a. CCAAT/enhancer-binding protein beta is required for mitotic clonal expansion during adipogenesis. Proceedings of the National Academy of Sciences of the United States of America 100: 850-855.
Tang, Q. Q., T. C. Otto, and M. D. Lane. 2003b. Mitotic clonal expansion: a synchronous process required for adipogenesis. Proceedings of the National Academy of Sciences of the United States of America 100: 44-49.
28

Tang, Q. Q., T. C. Otto, and M. D. Lane. 2004. Commitment of C3H10T1/2 pluripotent stem cells to the adipocyte lineage. Proceedings of the National Academy of Sciences of the United States of America 101: 9607-9611.
Tannenbaum, G. S., Epelbaum, J. 1999. Samatostatin. Oxford Universty Press, New York.Tateishi, H., and G. M. Masson. 1972. Role of the liver in the regulation of plasma
angiotensinogen and renin levels. Proceedings of the Society for Experimental Biology and Medicine. Society for Experimental Biology and Medicine 139: 304-309.
Tontonoz, P., E. Hu, and B. M. Spiegelman. 1994. Stimulation of adipogenesis in fibroblasts by PPAR gamma 2, a lipid-activated transcription factor. Cell 79: 1147-1156.
Van Goor, F., J. I. Goldberg, and J. P. Chang. 1997. Extracellular sodium dependence of GnRH-stimulated growth hormone release in goldfish pituitary cells. Journal of neuroendocrinology 9: 207-216.
VanderKuur, J. A. et al. 1995. Growth hormone-dependent phosphorylation of tyrosine 333 and/or 338 of the growth hormone receptor. The Journal of biological chemistry 270: 21738-21744.
Villano, F., and F. D'Onofrio. 1955. [Effect in vivo and in vitro of cortisone on transamination and deamination reactions of 1(+) glutamic acid in presence of guinea-pig liver]. Bollettino della Societa italiana di biologia sperimentale 31: 1407-1410.
Wabitsch, M., H. Hauner, E. Heinze, and W. M. Teller. 1995. The role of growth hormone/insulin-like growth factors in adipocyte differentiation. Metabolism: clinical and experimental 44: 45-49.
Wabitsch, M. et al. 1996. Biological effects of human growth hormone in rat adipocyte precursor cells and newly differentiated adipocytes in primary culture. Metabolism 45: 34-42.
Watanobe, H., and S. Habu. 2002. Leptin regulates growth hormone-releasing factor, somatostatin, and alpha-melanocyte-stimulating hormone but not neuropeptide Y release in rat hypothalamus in vivo: relation with growth hormone secretion. The Journal of neuroscience : the official journal of the Society for Neuroscience 22: 6265-6271.
Woelfle, J., and P. Rotwein. 2004. In vivo regulation of growth hormone-stimulated gene transcription by STAT5b. American journal of physiology. Endocrinology and metabolism 286: E393-401.
Wood, T. J. et al. 1997. Specificity of transcription enhancement via the STAT responsive element in the serine protease inhibitor 2.1 promoter. Molecular and cellular endocrinology 130: 69-81.
Yakar, S. et al. 1999. Normal growth and development in the absence of hepatic insulin-like growth factor I. Proceedings of the National Academy of Sciences of the United States of America 96: 7324-7329.
Yamauchi, T. et al. 1998. Growth hormone and prolactin stimulate tyrosine phosphorylation of insulin receptor substrate-1, -2, and -3, their association with p85 phosphatidylinositol 3-kinase (PI3-kinase), and concomitantly PI3-kinase activation via JAK2 kinase. The Journal of biological chemistry 273: 15719-15726.
Yanaihara, N. 1977. [Chemistry of growth hormone]. Horumon to rinsho. Clinical endocrinology 25: 123-130.
Yasukawa, H. et al. 1999. The JAK-binding protein JAB inhibits Janus tyrosine kinase activity through binding in the activation loop. The EMBO journal 18: 1309-1320.
29

Yeh, W. C., Z. Cao, M. Classon, and S. L. McKnight. 1995. Cascade regulation of terminal adipocyte differentiation by three members of the C/EBP family of leucine zipper proteins. Genes & development 9: 168-181.
Yi, W. et al. 1996. Growth hormone receptor cytoplasmic domain differentially promotes tyrosine phosphorylation of signal transducers and activators of transcription 5b and 3 by activated JAK2 kinase. Molecular endocrinology 10: 1425-1443.
Zachmann, M., F. Fernandez, D. Tassinari, R. Thakker, and A. Prader. 1980. Anthropometric measurements in patients with growth hormone deficiency before treatment with human growth hormone. European journal of pediatrics 133: 277-282.
Zhang, J. G. et al. 2001. The SOCS box of suppressor of cytokine signaling-1 is important for inhibition of cytokine action in vivo. Proceedings of the National Academy of Sciences of the United States of America 98: 13261-13265.
Zhang, W., R. R. Behringer, and E. N. Olson. 1995. Inactivation of the myogenic bHLH gene MRF4 results in up-regulation of myogenin and rib anomalies. Genes & development 9: 1388-1399.
Zhu, T., E. L. Goh, R. Graichen, L. Ling, and P. E. Lobie. 2001. Signal transduction via the growth hormone receptor. Cellular signalling 13: 599-616.
Zhu, T., L. Ling, and P. E. Lobie. 2002. Identification of a JAK2-independent pathway regulating growth hormone (GH)-stimulated p44/42 mitogen-activated protein kinase activity. GH activation of Ral and phospholipase D is Src-dependent. The Journal of biological chemistry 277: 45592-45603.
Zuk, P. A. et al. 2002. Human adipose tissue is a source of multipotent stem cells. Molecular biology of the cell 13: 4279-4295.
30

Chapter II
Growth hormone stimulates liver growth by increasing the size of hepatocytes in mice
ABSTRACT
Growth hormone (GH) has growth-stimulating effects on bones, skeletal muscle, and
liver. Compared to our knowledge of how GH stimulates growth in bones and skeletal muscle,
little is known about the mechanism by which GH stimulates liver growth. We hypothesized that
GH stimulates liver growth by increasing the number of hepatocytes. We tested this hypothesis
in the lit/lit mice, which are nearly GH deficient because of a mutation in the GH-releasing
hormone-receptor. Lit/lit male mice, 12-13 weeks of age, were injected (s.c.) daily with 1 mg/kg
body weight of recombinant bovine GH or an equal volume of 10 mM NaHCO3 (vehicle for GH)
for two weeks. Age-matched heterozygous (lit/+) mice served as normal GH controls. Two hours
before euthanasia, mice were injected (i.p.) with 5-bromo-2’-deoxyuridine (BrdU) to label the
proliferating cells. Lit/lit mice injected with GH had a greater increase in body weight (P < 0.05,
n = 6) and tended to have a greater liver/body weight percentage (P = 0.1, n = 6) than lit/lit
control mice, but were not different from lit/+ heterozygous mice. Percentage of BrdU-stained
liver cells was not different between the three groups of mice (P > 0.1, n = 6). However, GH-
injected lit/lit mice had 20% fewer cells or cell nuclei per unit liver area (P < 0.05, n = 6) than
lit/lit control mice. Lit/+ mice had 40% fewer cells or nuclei per unit liver area (P < 0.01, n = 6)
than lit/lit control mice. Hepatocytes of GH-injected lit/lit mice were 18% larger than those of
lit/lit control mice (P < 0.01, n = 6). Hepatocytes of lit/+ mice were 42% larger than those of
lit/lit mice (P < 0.01, n = 6). Consistent with these data, liver of GH-injected lit/lit and liver of
lit/+ mice had 16% and 31% less DNA per unit weight than that of lit/lit mice, respectively (P <
31
0.05, n = 6). The protein content per unit DNA amount was higher in lit/+ control mice than lit/lit
control mice (P < 0.05, n = 6), while that ratio tended to be greater in GH-injected lit/lit mice
than lit/lit control mice (P = 0.06, n = 6). Taken together, these results suggest that GH increases
mouse liver weight by increasing the size, not by increasing the number of hepatocytes. Whether
GH increases the size of liver by increasing protein accumulation in the hepatocytes needs
further investigation.
Keywords: growth hormone, mouse, liver
32

INTRODUCTION
Growth hormone (GH) is synthesized, stored, and secreted by the somatotrophs within
the anterior pituitary gland. Its secretion is under the strict neuroendocrine control. The central
hormone that stimulates GH synthesis is hypothalamic growth hormone-releasing hormone
(GHRH) (Ling et al., 1984; Spiess et al., 1983) , while hypothalamic somatostatin exerts strong
inhibitory effects on GH secretion (Brazeau et al., 1973). GH has multiple physiological
functions, including stimulating growth and modulating metabolism. Part of the growth-
promoting effect of GH is mediated by insulin-like growth factor-1 (IGF-1), produced by the
liver and other tissues. GH also stimulates body growth independent of IGF-1 (Kaplan and
Cohen, 2007).
A primary target organ of GH action is the liver, where the GH receptor (GHR) is more
abundant than any other organ or tissue in the body (Tiong et al., 1989; Tiong and Herington,
1991). Liver is a vital organ and it plays a major role in metabolism, including regulation of
blood glucose, synthesis and storage of proteins, vitamins, and fats in the body. A well-known
effect of GH on the liver is the production of IGF-1 (Herrington et al., 2000; Piwien-Pilipuk et
al., 2002). GH stimulates IGF-1 gene expression in liver through the Janus kinase 2 (JAK2) and
signal transducer and activators of transcription 5 (STAT5) signaling pathway from the GHR
(Argetsinger et al., 1993; Davey et al., 2001; Woelfle et al., 2003).
Liver has a unique ability to regenerate upon hepatectomy (Devic et al., 1952; Mallet-
Guy et al., 1953; Yokoyama et al., 1953). A number of studies have shown that liver
regeneration depends at least partially on GH action (Ekberg et al., 1992; Pennisi et al., 2004).
Early studies reported that the initiation of DNA synthesis after partial hepatectomy was delayed
33

in hypophysectomized rats (Hemingway and Cater, 1958; Rabes and Brandle, 1969), and the
response of DNA synthesis to hepatectomy was accelerated after GH treatment of rats with intact
pituitaries (Moolten et al., 1970). Ekberg et al. demonstrated that the response of hepatic
hepatocyte growth factor (HGF) gene expression and DNA synthesis to partial hepatectomy was
accelerated by treatment of GH in hypophysectomized rats (Ekberg et al., 1992). In addition, it
has been reported that GH antagonist (GHa) transgenic mice, in which the action of GH was
blocked, had a lower hepatocyte proliferation rate compared to control mice after partial
hepatectomy (Pennisi et al., 2004).
GH appears to have IGF-1-independent growth-stimulatory effects on intact liver as well.
GH injection increases the relative weight of liver in both wild-type and IGF-1 null mice (Liu
and LeRoith, 1999). Liver-specific IGF-I knockout mice had enlarged liver despite normal body
size compared to wild-type mice (Sjogren et al., 1999; Yakar et al., 1999).
The objective of this study was to determine the cellular mechanism by which GH
stimulates the growth of intact liver. We conducted the study in the little mice, where a
spontaneous mutation on the GHRH gene (Ghrhrlit) leads to barely detectable secretion of GH
(Gaylinn et al., 1999). Our study suggests that GH stimulates the growth of normal liver not by
increasing the proliferation of hepatocytes, but rather by increasing the size of hepatocytes.
34

MATERIALS AND METHODS
Animals and Treatments
Breeding pairs of C57BL/6J-Ghrhrlit mice were purchased from the Jackson Laboratory
(Bar Harbor, ME, USA). Male GH-deficient lit/lit mice or lit/+ (heterozygous) littermates (12-13
week-old) received subcutaneous injection of 1 mg/kg body weight (~ 0.2 mL)of recombined
bovine GH (The National Hormone and Peptide Program, Torrance, CA) or an equivalent
volume of 0.01 M NaHCO3 (pH = 7.4, vehicle for GH) every day for two weeks. This dose of
GH was chosen because similar doses of GH were effective in stimulating liver growth in
previous studies (Bates et al., 1992; Liu and LeRoith, 1999). The week before these injections,
all animals received a daily subcutaneous injection of 10 mM NaHCO3 to acquaint with the
subsequent injections and handling. Each mouse was injected intraperitoneally with 10 mL/kg
body weight of 5-bromo-2'-deoxyuridine (BrdU; Invitrogen Corporation, Carlsbad, CA) 2 h
before euthanasia to label the proliferating cells. Body weights were taken every week. Wet liver
weights were taken at the time of euthanasia. Mice were kept in a 12 h light-dark cycle at 23℃ with free access to standard chow and water throughout the study. All animal-related procedures
were approved by the Virginia Tech Institutional Animal Care and Use Committee.
Immunohistochemistry
One-third of left lateral lobe of mouse liver was cut and then fixed in 10% phosphate
buffered formalin for 48 h. Fixed liver tissue was dehydrated by passing through a series of
solutions: 70% ethanol 2 times for 30 min each, 80% ethanol 2 times for 30 min each, 95%
ethanol 2 times for 30 min each, 100% ethanol 2 times for 20 min each, and xylene 2 times for 1
35
h each. Dehydrated liver tissue was embedded in a hot (56 ℃) paraffin-filled metal mold. The
paraffin-embedded liver block was cut into 6 micron sections using a rotary microtome.
A BrdU staining kit (Invitrogen Corporation, Carlsbad, CA) was used for
immunohistochemical detection of proliferating cells. Slides containing liver sections were
deparaffinized in 2 changes of xylene for 5 min each, and then processed for rehydration in a
series of graded alcohol: 95% ethanol 2 times for 1 min each, 80% ethanol 2 times for 1 min
each, and 70% ethanol 2 times for 2 min each. Slides were submerged in quenching solution (3%
H2O2, 97% methanol) for 10 min, and then rinsed with phosphate-buffered saline (PBS; 137 mM
NaCl, 2.7 mM KCl, 10 mM Na2HPO4, 1.8 mM KH2PO4; pH = 7.4). One drop of reagent 1A
(Trypsin Concentrate) and 3 drops of reagent 1B (Trypsin Diluted) were mixed. The mixture was
applied to each section. After incubation 10 min in a moist chamber at 37%, the slides were
rinsed with distilled water 3 times for 2 min each. Sections were applied with a series of
reagents: reagent 2 (Denaturing Solution) for 30 min, PBS 3 times for 2 min each, reagent 3
(Blocking Solution) for 10 min, reagent 4 (Biotinylated Mouse Anti-BrdU) for 60 min, PBS 3
times for 2 min each, reagent 5 (Streptavidin-Peroxidase) for 10 min, PBS 3 times for 2 min
each, Ab mixture (1 drop of reagent 6A: 20 × Substrate Buffer, 1 drop of reagent 6B: 20 × DAB
Concentrate, 1 drop of 20 × 0.6% Hydrogen Peroxide, 1 mL distilled water) for 5 min, distilled
water 2 times for 2 min each, and reagent 7 (Hematoxylin) for 90 sec. After incubation with
reagent 7, slides were washed in tap water, and put into PBS until sections turned blue. Slides
were dehydrated in a series of solutions: 70% ethanol 2 times for 2 min each, 80% ethanol 2
times for 1 min each, 95% ethanol 2 times for 1 min each, 100% ethanol 2 times for 1 min each,
xylene 2 times for 5 min each. A coverslip was added on each slide with HistomountTM.
Micrographs were taken with an Olympus microscope digital camera. Numbers and sizes of cells
36

or nuclei were counted using ImageJ 1.45s (National Institutes of Health, USA). At least 2,000
nuclei or cells were counted for each mouse.
Liver DNA and protein content analyses
Liver tissue was homogenized in buffer consisting of 100 mM K2HPO4, 100 mM
KH2PO4, 250 mM Sucrose, 2 mM EDTA, 1 mM HEPES, and 1% protease inhibitors (Thermo
Scientific, Waltham, MA). The homogenate was further lysed by 3 freeze-thaw cycles between
liquid nitrogen and 37℃ water baths. The cell lysates were centrifuged at 13,000 × g for 10
min at 4℃. Protein and DNA concentrations of the supernatants were determined using a
Bicinchoninic acid (BCA) kit (Thermo Scientific, Waltham, MA) and a Quant-iT PicoGreen
dsDNA kit (Invitrogen Corporation, Carlsbad , CA), respectively, essentially following the
suppliers’ instructions.
Hepatocyte isolation and culture
Mouse hepatocytes were isolated by the two-step collagenase perfusion procedure
(Edstrom et al., 1983). Male lit/+ mice of 12-13 weeks of age were anesthetized by
intraperitoneal injection of 0.2 mg/g body weight of Avertin. The anesthetized mouse was laid on
a surgical platform, and its abdomen was cleaned with 70% ethanol. An incision was made on
the ventral midline to access the inferior vena cava and the portal vein. A 24G × 3/4” catheter
was inserted into the vena cava. After the removal of the stylet, 50 mL of warmed perfusion
buffer 1 (Krebs Ringer buffer supplemented with glucose: 120 mM NaCl, 20 mM NaHCO3, 20
mM Glucose, 5 mM HEPES, 4.8 mM KCl, 1.2 mM MgSO4, 1.2 mM KH2PO4; 0.1 ml 50 mM
EGTA; pH = 7.4; 37℃) was infused into the vena cava at approximately 2 mL/min by a syringe
pump. Once the liver was enlarged by infusion, the portal vein was severed and the pump flow
37

rate was immediately increased to approximately 7 mL/min. The anterior vena cava between the
heart and diaphragm was clamped off with a hemostat. After perfusion with buffer 1, the liver
was perfused with buffer 2 [buffer 1 supplemented with 50 mM CaCl2 and 1% Collagenase D
(Sigma-Aldrich, St. Louis, MO)]. When perfusion with buffer 2 was completed, the liver was
excised and placed in pre-chilled buffer 1 on ice. Hepatocytes were dispersed by cutting through
the liver in several locations and collected by filtering through a 70 μM cell strainer (Fisher
Scientific, Pittsburg, PA) with cold growth medium composed of Dulbecco's Modified Eagle
Medium (DMEM; Corning, Corning, NY), 10% fetal bovine serum (FBS; Atlanta Biologicals,
Lawrenceville, GA), 2% L-glutamine (Corning, Corning, NY), and 1% Antibiotic-Antimycotic
solution (ABAM; Corning, Corning, NY). Subsequently, the hepatocytes were washed three
times by centrifugation at 50 × g for 2 min at 4℃ and plated into 6-well plates at the density of 4
× 104 cells/cm2. Based on trypan blue staining, approximately 70% of newly isolated hepatocytes
were viable.
Hepatocyte protein accumulation assay
Mouse hepatocytes were cultured for 24 h in growth medium and another 8 h in serum-
free medium composed of DMEM with 2% L-glutamine and 1% ABAM at 37˚C and 5% CO2.
The hepatocytes were then cultured in serum-free medium added with 500 ng/mL of recombined
bovine GH, 500 ng/mL of IGF-I, or an equal volume of PBS and 0.5 μCi/mL of L-[2,3,4,5,6-
3H]phenylalanine (GE Healthcare, Pittsburgh, PA) for 16 h. Subsequently, the hepatocytes were
washed twice with PBS to remove extracellular L-[2,3,4,5,6-3H]phenylalanine. The hepatocytes
were lysed in 1 mL of 0.5 M NaOH and 0.1% Triton X-100 for 2 h at 37℃. The lysates were
centrifuged at 14,000 × g for 5 min to remove cell debris. A 400 µL sample of supernatant was
taken for DNA and protein concentration assays. The protein in the remaining supernatant was
38

precipitated by an equal volume of 10% trichloroacetic acid (TCA) and incubation at room
temperature for 30 min. The precipitated protein was subsequently applied to a glass fiber filter
(Millipore, Billerica, MA). Free L-[2,3,4,5,6-3H]phenylalanine was removed by washing the
filter 5 times with 5 mL 10% TCA each time. The filter was dried in an oven for 1 h at 55℃, and
then soaked in 5 mL of scintillation fluid (Fisher Scientific, Pittsburg, PA) for 1 h. The
radioactivity was counted on a liquid scintillation counter (LS-6000LL, Beckman, Brea, CA).
Protein and DNA concentrations of the lysate were determined as described earlier. The
radioactivity in protein was normalized to DNA and protein concentration in the same cell lysate.
Statistical analysis
All data are expressed as means ± SEM (standard error of the mean). Statistical analysis
was performed using General Linear Model ANOVA followed by the Tukey’s test of JMP® Pro
10.0.0 (SAS Institute, Inc., Cary, NC) to compare means of multiple groups. The main effect of
treatment was tested. A difference at P < 0.05 was considered statistically significant.
39

RESULTS
Growth hormone treatment increased body weight and relative liver weight in mice
To determine the effect of GH on body and liver growth, 12-13 week-old male lit/lit mice
were injected subcutaneously daily with 1 mg/kg body weight (~ 0.2 mL)of recombinant bovine
GH for two weeks, and 12-13 week-old lit/lit and lit/+ male mice injected with the vehicle (10
mM NaHCO3) were used as controls. The lit/lit mice injected with GH gained weight from day 1
to day 14 (Fig. 2. 1. A, P < 0.05, n = 6), whereas the two control groups of mice did not increase
in body weight during the same period of time (Fig. 2. 1. A, P > 0.1, n = 6). Representative
images of lit/+ control, lit/lit control, and GH-injected lit/lit mice at day 14 of the experiment are
shown in Fig. 2. 1. B. From day 1 to day 14, lit/lit mice injected with GH had greater increases in
body weight than lit/lit control mice (Fig. 2. 1. C, P < 0.05, n = 6) and lit/+ control mice (Fig. 2.
1. C, P < 0.05, n = 6).
At day 14 of GH injection, although liver weight was not statistically different between
lit/lit control mice and lit/lit mice injected with GH (Fig. 2. 1. D, P > 0.1, n = 6), the liver
weight/body weight percentage tended to be greater in lit/lit mice injected with GH than in lit/lit
control mice (Fig. 2. 1. D, P = 0.1, n = 6). The liver/body weight percentage was not different
between lit/lit mice injected with GH and lit/+ control mice (Fig. 2. 1. D, P > 0.1, n = 6).
Growth hormone injection did not change the number of proliferating hepatocytes
To investigate the possibility that GH increases liver weight by stimulating hepatocyte
proliferation, we determined the percentages of BrdU-labeled cells in the liver of the three
groups of mice at the last day of the injection. Representative images of mouse liver sections
stained with BrdU (40 × magnification) are shown in Fig. 2. 2. A. In these images, BrdU-labeled
40

nuclei appeared dark brown. Approximately 2-2.5% of the cells in the liver were labeled with
BrdU (Fig. 2. 2. B). The percentages of BrdU-stained cells were not different between the three
groups of mice (Fig. 2. 2. B, P > 0.1, n = 6). This data indicated that GH administration did not
stimulate hepatocyte proliferation in the lit/lit mice.
Growth hormone injections increased the size of hepatocytes
From the images of liver sections, we observed that the hepatocytes of GH-injected lit/lit
mice were larger than hepatocytes of lit/lit control mice, and smaller than those of lit/+ control
mice (Fig. 2. 3. A). GH-injected lit/lit mice had fewer nuclei (Fig. 2. 3. B, P < 0.05, n = 6) and
fewer cells per unit of liver area (Fig. 2. 3. C, P < 0.05, n = 6) than lit/lit control mice, but more
nuclei (Fig. 2. 3. B, P < 0.05, n = 6) and more cells per unit of liver area (Fig. 2. 3. C, P < 0.05, n
= 6) than lit/+ mice. These data indicated GH-injected lit/lit mice had larger hepatocytes than
lit/lit control mice but smaller hepatocytes than lit/+ mice.
By directly measuring the area of cells on the sections, we found liver cells from GH-
injected lit/lit mice were approximately 18% larger than those from lit/lit control mice (Fig. 2. 3.
D, P < 0.05, n = 6). Liver cells from lit/+ mice were approximately 42% larger than those from
lit/lit mice (Fig. 2. 3. D, P < 0.01, n = 6). These data again indicated that GH-injected lit/lit mice
had larger hepatocytes than lit/lit control mice but smaller hepatocytes than lit/+ mice.
Growth hormone injections increased protein to DNA ratios in the liver
To further determine how GH increased the weight of liver in mice, we measured the
relative DNA and protein contents in the liver of the three groups of mice. The lit/lit mice
injected with GH had less DNA per unit of liver weight than lit/lit control mice (Fig. 2. 4. A, P <
0.05, n = 6), but more than lit/+ control mice (Fig. 2. 4. A, P < 0.05, n = 6). There was no
41

difference in the amount of protein per unit of liver weight between the three groups of mice
(Fig. 2. 4. B, P > 0.1, n = 6). Lit/+ control mice had more protein per unit of DNA amount than
lit/lit control mice (Fig. 2. 4. C, P < 0.05, n = 6). Lit/lit mice injected with GH tended to have
more protein per unit of DNA amount than lit/lit control mice (Fig. 2. 4. C, P = 0.06, n = 6),
whereas they were not different from lit/+ control mice in this ratio (Fig. 2. 4. C, P > 0.1, n = 6).
These data indicated that GH injections increased liver or hepatocyte size by increasing the
intracellular protein content.
GH and IGF-I had no effect on protein accumulation in mouse hepatocytes in vitro
To determine whether GH stimulates hepatocyte enlargement by increasing protein
accumulation, we isolated hepatocytes from male lit/+ mice and determined the effects of GH
and IGF-1 on protein accretion. Protein accretion was determined by measuring the amount of
3H-labeled phenylalanine incorporated into protein during a period of 16 h. Neither GH nor IGF-
I had any effect on protein accumulation in mouse hepatocytes compared to vehicle control (Fig.
2. 5. A and B, P > 0.1, n = 4).
42

DISCUSSION
In this study, we determined whether GH stimulates liver growth by increasing
hepatocyte proliferation or hepatocyte size. We conducted the study in GH-deficient lit/lit mice.
These mice have barely detectable GH, due to the mutations on the growth hormone releasing
hormone receptor gene (Gaylinn et al., 1999). Heterozygous mice (lit/+), which have normal
phenotypes, were used as controls (Obal et al., 2003). We found that lit/+ mice had and GH-
injected lit/lit mice tended to have a greater liver to body weight percentage than lit/lit control
mice, and that GH-injected lit/lit mice had a similar liver to body weight percentage to
heterozygous lit/+ mice. These observations suggest that GH injection leads to a normalization of
liver undergrowth caused by GH deficiency.
The increase of organ size results from either an increase of the number or the size of
cells within the organ. Previous studies suggested that GH regulates the proliferation capacity of
hepatocytes, shown by the impaired liver regeneration after partial hepatectomy in GH-deficient
animal models (Ekberg et al., 1992; Pennisi et al., 2004). After cellular loss, the final shape and
size of liver can be restored. GH plays a partial part, at least, in stimulation of hepatocyte
proliferation during this process. Thus, we first tested the possibility that GH stimulates the
growth of intact liver also by stimulating the proliferation of hepatocytes. The result from BrdU
labeling showed no difference in the percentage of proliferating cells in the liver between GH-
treated and untreated lit/lit 12-week-old male mice. This indicates that GH does not stimulate
proliferation of hepatocytes in mice with intact livers.
Next, we tested the possibility that GH increases liver size by stimulating hepatocyte
enlargement. Histology showed that after 2-week injections, the hepatocytes of GH-injected
43

lit/lit mice were much larger than those of lit/lit control mice. This result suggests that GH has a
stimulatory effect on hepatocyte size, and further indicates that GH stimulates liver growth by
hypertrophy. We also measured DNA and protein contents in liver tissue from GH-treated and
control mice and found that GH-injected lit/lit mice had less DNA per gram of liver tissue than
control mice. But there was no difference in protein concentration in the liver. These results
suggest that GH increases the size of hepatocytes at least in part by increasing their protein
content.
We further tested the possibility that GH stimulates protein accumulation in hepatocytes
by increasing protein synthesis. Since liver is the main target of GH for serum IGF-1 production
(Yakar et al., 1999), we also determined if the action of GH on liver protein synthesis depends
on the presence of IGF-1. The accumulation of 3H-phenylalanine-labeled protein in both GH and
IGF-1 treated mouse hepatocytes was not different from untreated hepatocytes. This result does
not support the hypothesis that GH directly stimulates mouse liver growth by stimulating protein
synthesis. However, the in vitro hepatocyte culture experiment has several potential limitations
that might have prevented the recuperation of the stimulatory effect of GH on liver protein
accumulation in mice: 1) The 16 h treatment of GH might not be long enough to cause
significant accumulation of protein in hepatocytes; 2) The collagenase D, which was used to
separate the hepatocytes, might damage the GHR on hepatocyte plasma membrane and lead to
hepatocytes insensitivity to GH molecules.
The liver is composed of water (approximately 70% of the mass), protein (approximately
20% of the mass), and other minor components (approximately 10% of the mass), such as lipids,
glycogen, nuclei acids, and minerals (Harrison, 1953). GH has been reported to increase
44

myocardial water fraction in rats (Powis, 1975). Further investigation is needed to determine
whether GH has an effect on water fraction in hepatocytes.
In conclusion, our results demonstrate that GH not only increases body weight, but also
causes a disproportional growth in liver. Our study shows that GH preforms this stimulatory
effect by increasing the size of hepatocytes, but not stimulating the proliferation of hepatocytes.
Whether GH enlarges the hepatocytes by inducing intracellular protein accumulation needs
further investigation.
45

REFERENCES
Argetsinger, L. S. et al. 1993. Identification of JAK2 as a growth hormone receptor-associated tyrosine kinase. Cell 74: 237-244.
Bates, P. C., R. Aston, and A. T. Holder. 1992. Growth hormone control of tissue protein metabolism in dwarf mice: enhancement by a monoclonal antibody. The Journal of endocrinology 132: 369-375.
Brazeau, P. et al. 1973. Hypothalamic polypeptide that inhibits the secretion of immunoreactive pituitary growth hormone. Science 179: 77-79.
Davey, H. W. et al. 2001. STAT5b is required for GH-induced liver IGF-I gene expression. Endocrinology 142: 3836-3841.
Devic, G., G. Pezzuoli, J. Feroldi, A. Leva, and N. Huu. 1952. [Experimental study of hepatic regeneration in the dog after partial hepatectomy; regeneration tests]. Revue internationale d'hepatologie 2: 387-395.
Edstrom, S., L. Ekman, M. Ternell, and K. Lundholm. 1983. Isolation of mouse liver cells: perfusion technique and metabolic evaluation. European surgical research. Europaische chirurgische Forschung. Recherches chirurgicales europeennes 15: 97-102.
Ekberg, S., M. Luther, T. Nakamura, and J. O. Jansson. 1992. Growth hormone promotes early initiation of hepatocyte growth factor gene expression in the liver of hypophysectomized rats after partial hepatectomy. The Journal of endocrinology 135: 59-67.
Gaylinn, B. D. et al. 1999. The mutant growth hormone-releasing hormone (GHRH) receptor of the little mouse does not bind GHRH. Endocrinology 140: 5066-5074.
Harrison, M. F. 1953. Composition of the liver cell. Proceedings of the Royal Society of London. Series B, Containing papers of a Biological character. Royal Society 141: 203-216.
Hemingway, J. T., and D. B. Cater. 1958. Effects of pituitary hormones and cortisone upon liver regeneration in the hypophysectomized rat. Nature 181: 1065-1066.
Herrington, J., L. S. Smit, J. Schwartz, and C. Carter-Su. 2000. The role of STAT proteins in growth hormone signaling. Oncogene 19: 2585-2597.
Kaplan, S. A., and P. Cohen. 2007. The somatomedin hypothesis 2007: 50 years later. The Journal of clinical endocrinology and metabolism 92: 4529-4535.
Ling, N. et al. 1984. Isolation, primary structure, and synthesis of human hypothalamic somatocrinin: growth hormone-releasing factor. Proceedings of the National Academy of Sciences of the United States of America 81: 4302-4306.
Liu, J. L., and D. LeRoith. 1999. Insulin-like growth factor I is essential for postnatal growth in response to growth hormone. Endocrinology 140: 5178-5184.
Mallet-Guy, P., G. Devic, and J. Feroldi. 1953. [Hepatic regeneration after partial hepatectomy: experimental study]. Lyon chirurgical 48: 845-861.
Moolten, F. L., N. J. Oakman, and N. L. Bucher. 1970. Accelerated response of hepatic DNA synthesis to partial hepatectomy in rats pretreated with growth hormone or surgical stress. Cancer research 30: 2353-2357.
Obal, F., Jr., J. Alt, P. Taishi, J. Gardi, and J. M. Krueger. 2003. Sleep in mice with nonfunctional growth hormone-releasing hormone receptors. American journal of physiology. Regulatory, integrative and comparative physiology 284: R131-139.
Pennisi, P. A., J. J. Kopchick, S. Thorgeirsson, D. LeRoith, and S. Yakar. 2004. Role of growth hormone (GH) in liver regeneration. Endocrinology 145: 4748-4755.
46

Piwien-Pilipuk, G., J. S. Huo, and J. Schwartz. 2002. Growth hormone signal transduction. J Pediatr Endocrinol Metab 15: 771-786.
Powis, R. L. 1975. The influence of growth hormone on myocardial weight and water fraction in rats. Recent advances in studies on cardiac structure and metabolism 8: 427-436.
Rabes, H. M., and H. Brandle. 1969. Synthesis of RNA, protein, and DNA in the liver of normal and hypophysectomized rats after partial hepatectomy. Cancer research 29: 817-822.
Sjogren, K. et al. 1999. Liver-derived insulin-like growth factor I (IGF-I) is the principal source of IGF-I in blood but is not required for postnatal body growth in mice. Proceedings of the National Academy of Sciences of the United States of America 96: 7088-7092.
Spiess, J., J. Rivier, and W. Vale. 1983. Characterization of rat hypothalamic growth hormone-releasing factor. Nature 303: 532-535.
Tiong, T. S., K. A. Freed, and A. C. Herington. 1989. Identification and tissue distribution of messenger RNA for the growth hormone receptor in the rabbit. Biochemical and biophysical research communications 158: 141-148.
Tiong, T. S., and A. C. Herington. 1991. Tissue distribution, characterization, and regulation of messenger ribonucleic acid for growth hormone receptor and serum binding protein in the rat. Endocrinology 129: 1628-1634.
Woelfle, J., D. J. Chia, and P. Rotwein. 2003. Mechanisms of growth hormone (GH) action. Identification of conserved Stat5 binding sites that mediate GH-induced insulin-like growth factor-I gene activation. The Journal of biological chemistry 278: 51261-51266.
Yakar, S. et al. 1999. Normal growth and development in the absence of hepatic insulin-like growth factor I. Proceedings of the National Academy of Sciences of the United States of America 96: 7324-7329.
Yokoyama, H. O., M. E. Wilson, K. K. Tsuboi, and R. E. Stowell. 1953. Regeneration of mouse liver after partial hepatectomy. Cancer research 13: 80-85.
47

48

Fig. 2. 1. Effects of GH on body and liver weights. Lit/lit male mice were injected
subcutaneously with 1 mg/kg body weight of recombinant bovine GH or an equal volume of 0.01
M NaHCO3 (vehicle for GH), every day for 2 weeks. Lit/+ mice injected with NaHCO3 served as
controls with normal GH secretion. (A) Body weights on day 1, day 7, and day 14 of GH or
vehicle injection. (P < 0.05, n = 6). (B) Representative images of lit/+ control, lit/lit control, and
GH-injected lit/lit mice on day 14 of the injection experiment. (C) Body weight changes between
day 1 and day 14 (P < 0.05, n = 6). (D) Wet liver weight on day 14 (P < 0.05, n = 6). (E) Liver
percentage of body weight on day 14 (P < 0.05, n = 6). CTR, control.
49

Fig. 2. 2. Effect of GH on hepatocyte proliferation. (A) Representative images of mouse liver
section stained with BrdU (40 × magnification). Nuclei incorporated with BrdU appeared dark
brown in color (pointed by arrows). (B) Percentage of nuclei incorporated with BrdU (P > 0.1, n
= 6). At least 2,000 nuclei were counted for each mouse.
50

Fig. 2. 3. Effect of GH on hepatocyte size. (A) Representative images of mouse liver sections
(40 × magnification). (B) Average number of hepatocyte per unit of liver area (P < 0.05, n = 6).
At least 2,000 cells were counted for each mouse. (C) Average number of nuclei per unit of liver
area (P < 0.05, n = 6). At least 2,000 nuclei were counted for each mouse. (D) Average size of
hepatocytes (P < 0.05, n = 6). The areas of at least 200 cells were measured for each mouse.
51

Fig. 2. 4. Effect of GH on DNA and protein concentration in liver tissue. (A) DNA amount in
liver tissue normalized to tissue weight (P < 0.05, n = 6). (B) Protein amount in liver tissue
normalized to tissue weight (P > 0.1, n = 6). (C) Protein amount normalized to DNA amount in
liver (P < 0.05, n = 6).
52

Fig. 2. 5. Effects of GH and IGF-I on protein accretion in hepatocytes. Mouse hepatocytes
were treated with 500 ng/mL bGH, or 500 ng/mL IGF-1, or PBS (control), together with [3H]-
phenylalanine for 16 h. Incorporation of [3H]-phenylalanine into protein was measured by
counting the radioactivity in trichloroacetic acid (TCA)-precipitated protein. (A) 3H activity in
protein normalized to the amount of DNA in the same cells (P > 0.1, n = 4). (B) 3H activity in
protein normalized to the amount of protein in the same cells (P > 0.1, n = 4).
53

Chapter III
Growth hormone facilitates 5’-azacytidine-induced myogenic but inhibits 5’-azacytidine-
induced adipogenic commitment in C3H10T1/2 cells
ABSTRACT
The potential role of growth hormone (GH) in the early stages of myogenesis and
adipogenesis is not clear. In this study, we treated multipotential murine C3H10T1/2 cells with
or without 5’-azacytidine, the known inducer of myogenesis and adipogenesis in those cells, and
100 ng/mL of recombinant bovine GH for 4 days. We assessed the myogenic or adipogenic
potential of the cells by determining their ability to differentiate into myotubes or adipocytes,
respectively. Myotubes and adipocytes were identified by immunocytochemistry and Oil Red O
staining, respectively, and by quantifying their expression of respective markers. C3H10T1/2
cells treated with 5’-azacytidine and GH had greater mRNA levels of Pax3 and Pax7 than those
treated with 5’-axacytidine alone (P < 0.05, n = 4). The former formed more myotubes and
myoblasts compared to C3H10T1/2 cells treated with 5’-azacytidine alone (P < 0.05, n = 5).
However, cells treated with GH alone did not undergo myogenesis. C3H10T1/2 cells treated
with 5’-azacytidine and GH formed fewer adipocytes than those treated with 5’-azacytidine
alone (P < 0.05, n = 5). Taken together, these results suggest that GH can enhance 5’-
azacytidine-induced myogenic commitment but inhibit 5’-azacytidine-induced adipogenic
commitment in C3H10T1/2 cells. The underlying mechanisms need further investigation.
Keywords: growth hormone, myogenesis, adipogenesis, mesenchymal stem cell
54

INTRODUCTION
Growth hormone (GH) is a polypeptide hormone produced by the anterior pituitary. It is
an important regulator of somatic growth, metabolism and body composition. The effects of GH
on body composition include increased muscle growth and reduced adipose tissue growth
(Berryman et al., 2010; Etherton et al., 1993; Rosen et al., 1993). Proper skeletal muscle and
adipose tissue masses are critical for life. Loss of muscle mass is associated with many diseases
including cancer, diabetes, AIDS, and renal failure. Excess adipose tissue causes obesity, which
has become a world-wide health problem over the past decades (Letonturier, 2007), and which is
associated with cardiovascular disease, diabetes, hypertension, and metabolic abnormalities
(Ahmadian et al., 2007). Moreover, proper skeletal muscle and adipose tissue masses are
important for production efficiency in meat-producing animals.
Myogenesis is the process of generating muscle. It begins with the commitment of
mesenchymal stem cells (MSCs) to the myogenic lineage. The MSC cells can differentiate into a
variety of cell types, including myoblasts, preadipocytes, osteoblasts, and chondrocytes (Beyer
Nardi and da Silva Meirelles, 2006; Zuk et al., 2002). As MSCs commit to the myogenic lineage,
myoblasts are formed, then proliferate, and, finally, differentiate and fuse to form multinucleated
myotubes (Stockdale, 1992). GH is known to regulate the postnatal growth of skeletal muscle
(Florini et al., 1996). GH has been shown to stimulate murine myoblasts to differentiate into
myotubes (Florini et al., 1996; Heron-Milhavet et al., 2010; Hsu et al., 1997; Mavalli et al., 2010;
Sotiropoulos et al., 2006), but in bovine muscle cells, the major effect of GH seems to be
stimulating protein synthesis (Ge et al., 2012). It seems that no study has been conducted to
assess the potential effect of GH on the commitment of MSCs to the myogenic lineage.
55

Adipogenesis is a process of formation of adipocytes. As MSCs commit to the adipogenic
lineage, preadipocytes are formed, and then proliferate and undergo growth arrest before
differentiating into adipocytes (Tang et al., 2005; Tang and Lane, 1999; Tang et al., 2003a, b).
Studies of mechanism of GH action on adipogenesis have generated controversial results. A
stimulatory effect on adipogenesis has been reported for GH in preadipocyte cell lines, such as
3T3-F442A and 3T3-L1. It is believed that GH stimulated the differentiation of these cells by
priming them to respond to insulin and IGF-1 (Corin et al., 1990; Guller et al., 1989; Wabitsch et
al., 1995), and/or enhancing the transcriptional activity of proliferator-activated receptor γ
(PPARγ) (Kawai et al., 2007). However, an inhibitory effect of GH on adipogenesis has been
reported in primary preadipocytes from pigs and rats (Hausman and Martin, 1989; Wabitsch et
al., 1996). GH reduced the activities of glycerol-3-phosphate dehydrogenase (G3PDH) and
PPARγ in rat primary preadipocytes (Hansen et al., 1998; Wabitsch et al., 1996). Moreover,
signal transducer and activator of transcription 5 (STAT5) has been shown to act as the
repressing mediator of GH inhibition of terminal differentiation in primary preadipocytes
(Richter et al., 2003). The conflicting GH actions on adipogenesis may be due to the different
characteristics of preadipocyte cell lines and primary preadipocytes. It was believed that,
compared to the established preadipocyte cell lines, primary preadipocytes may have been at a
later stage of adipogenesis (Gregoire et al., 1998; Nam and Marcus, 2000; Wabitsch et al., 1995).
If this is true, then it would be interesting to know what effect GH has on early adipogenesis,
where stem cells differentiate into preadipocytes.
The objective of this study was, therefore, to determine the effect of GH on the
commitments of MSCs to the myogenic and adipogenic lineages. We conducted this study in
C3H10T1/2 cells, which are a clonal cell line derived from an early mouse embryo (Reznikoff et
56

al., 1973). These cells appear to be multipotential (Taylor and Jones, 1979), and have been
widely used as a model system for experimental analysis of the molecular genetic control of
mesodermal cell lineage determination and differentiation.
57

MATERIALS AND METHODS
Cell culture and treatments
C3H10T1/2 cells (Clone 8; American Type Culture Collection, Manassas, VA) were
cultured in 100 mm dishes with growth medium composed of Dulbecco’s Modified Eagle
Medium (DMEM; Corning, Corning, NY), 10% fetal bovine serum (FBS; Atlanta Biologicals,
Lawrenceville, GA), 2% L-glutamine (Corning, Corning, NY), and 1% antibiotics-antimycotics
(ABAM; Corning, Corning, NY) at 37 oC and 5% CO2 with saturating humidity. At 60%
confluence, cells were harvested and re-seeded into four 100 mm dishes at 5 × 10³, 5 × 10³, 3 ×
104, 3 × 10⁴ cells/cm2, respectively. After 24 h, the cells in the low cell density dishes were
treated with PBS or 100 ng/mL recombinant bovine GH (bGH; The National Hormone and
Peptide Program, Torrance, CA), while the cells in the high cell density dishes were treated with
3 µM 5’-azacytidine (Sigma-Aldrich, St. Louis, MO), or 3 µM 5’-azacytidine and 100 ng/mL
bGH. After 4-day treatment, during which medium with treatment was refreshed every 2 days,
cells were harvested and re-seeded into 24-well plates at a density of 1 × 10⁴ cells/cm2. The
concentration of 5’-azacytidine used was based on previous studies (Konieczny and Emerson,
1984; Taylor and Jones, 1979). To induce myogenesis, cells were grown to 90% confluence in
growth medium, and the growth medium was then replaced with differentiation medium
composed of DMEM, 2% horse serum (HS; Atlanta Biologicals, Lawrenceville, GA), 2 % L-
glutamine, and 1% ABAM. To induce adipogenesis, cells were grown to 100% confluence in
growth medium. Two days after, the growth medium was replaced with differentiation medium
composed of DMEM, 5% FBS, 1% ABAM, 2 mM L-glutamine, 10 μg/mL insulin (Sigma-
Aldrich, St. Louis, MO), 0.1 μM dexamethasone (Sigma-Aldrich, St. Louis, MO), and 250 μM 3-
Isobutyl-1-methylxanthine (IBMX; Sigma-Aldrich, St. Louis, MO). After 48 h, the medium was
58

replaced with medium composed of DMEM, 5% FBS, 1% ABAM, 2 mM L-glutamine, and 10
μg/mL insulin.
Total RNA isolation and real-time RT-PCR
Total RNA from cells was extracted using TRI Reagent (MRC, Cincinnati, OH),
according to the manufacturer’s instructions. Total RNA (1 µg) was reverse-transcribed into
cDNA in a total volume of 20 μL using the ImProm-II reverse transcriptase (Promega, Fitchburg,
WI) according to the manufacturer’s instructions. Real-time PCR was performed with 50 ng
cDNA in a total volume of 25 μL containing 12.5 μL of SybrGreen PCR Master Mix (Applied
Biosystems Inc., Foster City, CA) and 0.2 μM of gene-specific forward and reverse primers
(Table 3. 1.), under conditions suggested by the manufacturer. Each sample was quantified in
duplicate. The relative abundance of an mRNA was calculated using 18S rRNA as the internal
control. Based on the Ct values, the expression of 18S rRNA was consistent across the samples
(P > 0.1). The relative quantification of mRNA was obtained using the threshold cycle (∆∆Ct)
method (Pfaffl, 2001).
Immunocytochemistry
After 8-day myogenic differentiation, cells in 24-well plates were fixed with 4%
Paraformaldehyde (PFA) and permeated with 0.25% Triton X-100. The cells were then blocked
with 0.05% Tween and 1% BSA in PBS for 30 min at room temperature. The cells were
incubated with 1:100 diluted anti-myosin heavy chain (MHC) antibody (NA4, Developmental
Studies Hybridoma Bank, Department of Biology, University of Iowa) overnight at 4 oC and
1:200 diluted anti-mouse IgG fluorescein isothiocyanate (FITC) antibody (F0382, Sigma-
59

Aldrich, St. Louis, MO) in dark for 1 h at room temperature. After washing twice with
phosphate-buffered saline (PBS; 137 mM NaCl, 2.7 mM KCl, 10 mM Na2HPO4, 1.8 mM
KH2PO4; pH = 7.4), nuclei of the cells were stained with 4', 6-diamidino-2-phenylindole (DAPI;
Thermo Scientific, Waltham, MA) for 1 min. The stained cells were visualized and photographed
with an Olympus microscope digital camera. The number of myotubes and nuclei inside
myotubes and myoblasts were counted using ImageJ 1.45s (National Institutes of Health, USA),
and then normalized by total number of nuclei. At least 30 images were taken and 10,000 nuclei
were counted for each treatment. MHC-positive cells containing 3 or more nuclei were
considered myotubes, while MHC-positive cells containing 1 or 2 nuclei were considered
myoblasts.
Oil Red O staining
Adipocytes were stained with Oil Red O (Fisher Scientific, Pittsburg, PA) on day 14 of
differentiation. Cells were washed twice with PBS and subsequently fixed with 10% formalin in
PBS for 1 h at room temperature. Following fixation, cells were washed twice with PBS and
subsequently stained with 60% Oil Red O solution for 30 min. Cells were then washed with
running tap water. The stained cells were visualized and photographed with an Olympus
microscope digital camera. The number of adipocytes were counted using ImageJ 1.45s
(National Institutes of Health, USA), and normalized by image area. At least 30 images were
taken for each treatment in each experiment. Cells with one or more Oil red O stained lipid
droplets were considered adipocytes.
Statistical analysis
60
All data are expressed as means ± SEM (standard error of the mean). Statistical analysis
was performed using General Linear Model ANOVA followed by the Tukey’s test of JMP® Pro
10.0.0 (SAS Institute, Inc., Cary, NC) to compare means of multiple groups. The main effect of
treatment was tested. A difference at P < 0.05 was considered statistically significant.
61

RESULTS
GH facilitates the commitment of C3H10T1/2 cells to the myogenic lineage
To investigate the effect of GH on the commitment of C3H10T1/2 cells to the myogenic
lineage, C3H10T1/2 cells were treated with PBS (control), 100 ng/mL bGH, 3 µM 5’-
azacytidine (5Aza), or 100 ng/mL bGH together with 3 µM 5’-azacytidine for 4 days. After 4-
day treatment, we measured the mRNA expression levels of MyoD, Myf5, Pax3, and Pax7,
which are considered the markers of myoblasts or committed satellite cells (Bentzinger et al.,
2012; Buckingham, 2001; Maroto et al., 1997; Seale et al., 2000). Compared to the groups
without 5’-azacytidine treatment, the 5’-azacytidine-treated groups had higher expression of
MyoD, Myf5, Pax3, and Pax7 mRNAs (Fig. 3. 1.). Under the treatment of 5’-azacytidine,
C3H10T1/2 cells in the presence of GH expressed more Pax3 and Pax7 mRNAs (P < 0.05, n =
4) than those without GH (Fig. 3. 1.). These data indicated that 5’-azacytidine might have
induced C3H10T1/2 cells to commit to the myogenic lineage and that GH might have facilitated
this effect of 5’axacytidine.
To further determine the possibility that GH facilitates the commitment of C3H10T1/2
cells to the myogenic lineage, C3H10T1/2 cells treated with 5’-azacytidine, GH, or both for 4
days were induced to differentiate and fuse into myotubes. On day 2 of induced differentiation,
fusiform-shaped myoblasts were observed in 5’-azacytidine-treated cells. During days 4 to 8 of
differentiation, multinucleated myotubes were formed in 5’-azacytidine treated cells, and more
myotubes seemed to be formed in the cells treated with both 5’-azacytidine and GH, while no
62

myotubes were observed in the control group and the group treated with GH alone (Fig. 3. 2). To
quantify the number of myotubes and myoblasts formed, we preformed immunocytochemistry
on cells at day 8 of differentiation, in which myoblasts or myotubes were identified by anti-
myosin heavy chain antibody (Fig. 3. 3. A). Cells treated with 5’-azacytidine and GH had more
myosin heavy chain-positive myotubes and myoblasts, compared with cells treated with 5’-
azacytidine alone, while no myotubes or myoblasts were observed in PBS or GH-treated cells
(Fig. 3. 3. B and C, P < 0.05, n = 5). Moreover, the expression levels of Myog and MHC3
mRNAs, which are markers of differentiated myoblasts and myotubes, were 50% greater in cells
treated with both 5’-azacytidine and GH than in those treated with 5’-azacytidine alone (Fig. 3.
4., P < 0.05, n = 5). Expression of Myog and MHC3 mRNAs in control or GH-treated cells was
much lower than in 5’-azacytidine-treated cells (Fig. 3. 4., P < 0.05, n = 5).
Overall, these data indicated that GH cannot induce myogenic commitment in
C3H10T1/2 cells, but that GH can enhance 5’-azacytidine-induced myogenic commitment in
C3H10T1/2 cells.
GH inhibits the commitment of C3H10T1/2 cells to the adipogenic lineage
To investigate the effect of GH on the commitment of MSC cells to the adipogenic
lineage, we treated C3H10T1/2 cells for 4 days with or without 5’-azacytidine or GH as
described above. After 4-day treatment, we measured the mRNA expression levels of CD24,
CD29, CD34, Sca-1, PPARγ, C/EBPα, BMP4, and Wnt10b. CD24, CD29, CD34, and Sca-1 are
considered cells surface markers of preadipocytes (Rodeheffer et al., 2008). BMP4 has been
reported to promote adipocyte lineage determination (Bowers et al., 2006; Bowers and Lane,
2007), while Wnt10b inhibits adipogenesis by suppressing the expression of adipogenic
63

transcription factors PPARγ and C/EBPα (Ross et al., 2000). The cells treated with 5’-
azacytidine had higher CD24 and C/EBPα mRNA expression levels, but lower CD34, Sca-1, and
Wnt10b mRNA expression levels than cells without 5’-azacytidine (Fig. 3.5., P < 0.05, n = 4).
No difference was found in mRNA abundance of CD29, PPARγ, and BMP4 (Fig. 3.5., P > 0.1, n
= 4). In the presence of 5’-azacytidine, the mRNA expression levels of all the markers examined
were not different between cells treated with GH and without GH (Fig. 3.5., P > 0.1, n = 4).
To further determine the effect of GH on the commitment of C3H10T1/2 cells to the
adipogenic lineage, we induced the differentiation to C2H10T1/2 cells treated with or without 5’-
azacytidine or GH into adipocytes. The round-shaped cells with lipid droplets started to be
observed at day 4 of differentiation in 5’-azacytidine treated cells, whereas they were barely
observed in control cells or cells treated with GH alone (Fig. 3. 6.). Lipid accumulation in
adipocytes was confirmed by Oil Red O staining. Fewer adipocytes were formed in C2H10T1/2
cells treated with 5’-azacytidine and GH than in those treated with 5’-azacytidine alone (Fig. 3.
7. A and B, P < 0.05, n = 5). To further assess the adipogenic status of differentiated C3H10T1/2
cells, the mRNA levels of several adipocyte markers, including Plin1, FABP4, PPARγ, and
C/EBPα, were quantified. Cells treated with GH and 5’-azacytidine and those treated with 5’-
acacytidin alone did not differ in the mRNA expression levels of FABP4 and PPARγ (Fig. 3. 8.,
P > 0.1, n = 5), but the former had less mRNAs of Plin1 and C/EBPα compared to the latter (Fig.
3. 8., P < 0.05, n = 5).
Overall, these data indicated that 5’-acacyidine induced the C3H10T1/2 cells to commit
to the adipogenic lineage and that this effect of 5’-acacyidine was partially inhibited by GH.
64
65

DISCUSSION
Growth hormone plays an important role in the growth of skeletal muscle. Numerous
studies have shown that GH stimulates skeletal muscle growth by stimulating myoblast
differentiation into myotubes and by stimulating protein accumulation in myotubes (Florini et al.,
1996; Ge et al., 2012; Heron-Milhavet et al., 2010; Hsu et al., 1997; Mavalli et al., 2010;
Sotiropoulos et al., 2006). However, the effect of GH on early myogenesis, the stage during
which stem cells commit to the myogenic lineage, is not clear. The first part of this study was
conducted to determine whether GH has an effect on the commitment of MSCs to the myogenic
lineage.
The C3H10T1/2 cell, which we used in this study, appears to be an embryonic precursor
cell to myoblast, preadipocyte and osteoblast cell types (Konieczny and Emerson, 1984; Taylor
and Jones, 1979). The 5’-azacytidine, which is a DNA methyltransferase inhibitor, was reported
to convert the C2H10T1/2 cells into stably determined, but undifferentiated, stem cell lineage
which can differentiate into chondrocytes, myocytes, and adipocytes (Konieczny and Emerson,
1984; Taylor and Jones, 1979). We first treated C3H10T1/2 cells with or without 5’-azacytidine
and GH for 4 days, and then measured mRNA expression levels of several markers for early
myogenesis. The 5’-azacytidine elevated the expression of MyoD, Myf5, Pax3, and Pax7
mRNAs, indicating the commitment of the cells to the myogenic lineage. The cells treated with
GH and 5’-azacytidine had greater expression of Pax3 and Pax7 than those treated with 5’-
axacytidine alone. Since Pax3 and Pax7 are the two factors that have a major role in primary
myogenesis (Maroto et al., 1997; Seale et al., 2000), this result suggests that GH facilitates the
effect of 5’-azacytidine on inducing the myogenic commitment in C3H10T1/2 cells. When
induced to differentiate into myotubes, more of the C3H10T1/2 cells treated with both GH and
66

5’-azacytidine became myotubes than did those treated with 5’-azacytidine alone. No myotubes
or myoblasts were observed in cells treated with PBS or GH alone. Overall, the results suggest
that GH cannot trigger the commitment of MSCs to the myogenic lineage but can facilitate the
5’-azacytidine-induced myogenic commitment in MSCs.
Growth hormone is also known to have an inhibitory effect on fat tissue growth
(Berryman et al., 2006; Wabitsch and Heinze, 1993). However, the underlying mechanism is not
fully understood. In the second part of this study, we aimed to determine whether GH has an
effect on the early adipogenesis, in which stem cells convert into preadipocytes. Based on our
Oil Red O staining and adipocyte marker data, a significant number of adipocytes were
differentiated from C3H10T1/2 cells pretreated with 5’-azacytidine but not from those untreated.
This result confirms earlier observations that 5’-azacytidine can induce C3H10T1/2 cells to
commit to the adipogenic lineage (Taylor and Jones, 1979). The number of formed adipocytes
was, however, significantly reduced when the C3H10T1/2 cells were treated with both 5’-
azacytidine and GH. This suggests that GH inhibits the ability of 5’-azacytidine to induce the
adipogenic commitment in C3H10T1/2 cells.
In adipose tissue, the Lin-:CD29+:CD34+: Sca-1+:CD24+ subpopulation of the stromal
vascular fraction (SVF) was identified to be capable of differentiating into adipocytes both in
vitro and in vivo (Rodeheffer et al., 2008). Thus, CD29, CD34, CD24, and Sca-1 were
considered as cell surface markers of preadipocytes (Rodeheffer et al., 2008). Except for CD24,
the mRNA expression levels of these markers in C3H10T1/2 cells were, however, not affected
by 5’-azacytidine or GH treatment. Given the fact that 5’-azacytidine did induce adipogenic
commitment in those cells, one explanation for these seemingly unanticipated gene expression
67

data is that preadipocytes committed from C3H10T1/2 cells bear different surface markers from
those in the SVF population.
In summary, the present study suggests that GH enhances 5’-azacytidine-induced
myogenic commitment but inhibits 5’-azacytidine-induced adipogenic commitment in
C3H10T1/2 cells. The underlying molecular mechanism remains to be determined.
68
REFERENCES
Ahmadian, M., R. E. Duncan, K. Jaworski, E. Sarkadi-Nagy, and H. S. Sul. 2007. Triacylglycerol metabolism in adipose tissue. Future lipidology 2: 229-237.
Bentzinger, C. F., Y. X. Wang, and M. A. Rudnicki. 2012. Building muscle: molecular regulation of myogenesis. Cold Spring Harbor perspectives in biology 4.
Berryman, D. E. et al. 2006. Effect of growth hormone on susceptibility to diet-induced obesity. Endocrinology 147: 2801-2808.
Berryman, D. E. et al. 2010. Two-year body composition analyses of long-lived GHR null mice. The journals of gerontology. Series A, Biological sciences and medical sciences 65: 31-40.
Beyer Nardi, N., and L. da Silva Meirelles. 2006. Mesenchymal stem cells: isolation, in vitro expansion and characterization. Handbook of experimental pharmacology: 249-282.
Bowers, R. R., J. W. Kim, T. C. Otto, and M. D. Lane. 2006. Stable stem cell commitment to the adipocyte lineage by inhibition of DNA methylation: role of the BMP-4 gene. Proceedings of the National Academy of Sciences of the United States of America 103: 13022-13027.
Bowers, R. R., and M. D. Lane. 2007. A role for bone morphogenetic protein-4 in adipocyte development. Cell cycle 6: 385-389.
Buckingham, M. 2001. Skeletal muscle formation in vertebrates. Current opinion in genetics & development 11: 440-448.
Corin, R. E., S. Guller, K. Y. Wu, and M. Sonenberg. 1990. Growth hormone and adipose differentiation: growth hormone-induced antimitogenic state in 3T3-F442A preadipose cells. Proceedings of the National Academy of Sciences of the United States of America 87: 7507-7511.
Etherton, T. D., I. Louveau, M. T. Sorensen, and S. Chaudhuri. 1993. Mechanisms by which somatotropin decreases adipose tissue growth. The American journal of clinical nutrition 58: 287S-295S.
Florini, J. R., D. Z. Ewton, and S. A. Coolican. 1996. Growth hormone and the insulin-like growth factor system in myogenesis. Endocrine reviews 17: 481-517.
Ge, X., J. Yu, and H. Jiang. 2012. Growth hormone stimulates protein synthesis in bovine skeletal muscle cells without altering insulin-like growth factor-I mRNA expression. Journal of animal science 90: 1126-1133.
Gregoire, F. M., C. M. Smas, and H. S. Sul. 1998. Understanding adipocyte differentiation. Physiological reviews 78: 783-809.
Guller, S., M. Sonenberg, K. Y. Wu, P. Szabo, and R. E. Corin. 1989. Growth hormone-dependent events in the adipose differentiation of 3T3-F442A fibroblasts: modulation of macromolecular synthesis. Endocrinology 125: 2360-2367.
Hansen, L. H., B. Madsen, B. Teisner, J. H. Nielsen, and N. Billestrup. 1998. Characterization of the inhibitory effect of growth hormone on primary preadipocyte differentiation. Molecular endocrinology 12: 1140-1149.
Hausman, G. J., and R. J. Martin. 1989. The influence of human growth hormone on preadipocyte development in serum-supplemented and serum-free cultures of stromal-vascular cells from pig adipose tissue. Domestic animal endocrinology 6: 331-337.
Heron-Milhavet, L., D. Mamaeva, D. LeRoith, N. J. Lamb, and A. Fernandez. 2010. Impaired muscle regeneration and myoblast differentiation in mice with a muscle-specific KO of IGF-IR. Journal of cellular physiology 225: 1-6.
69

Hsu, H. H., M. M. Zdanowicz, V. R. Agarwal, and P. W. Speiser. 1997. Expression of myogenic regulatory factors in normal and dystrophic mice: effects of IGF-1 treatment. Biochemical and molecular medicine 60: 142-148.
Kawai, M. et al. 2007. Growth hormone stimulates adipogenesis of 3T3-L1 cells through activation of the Stat5A/5B-PPARgamma pathway. Journal of molecular endocrinology 38: 19-34.
Konieczny, S. F., and C. P. Emerson, Jr. 1984. 5-Azacytidine induction of stable mesodermal stem cell lineages from 10T1/2 cells: evidence for regulatory genes controlling determination. Cell 38: 791-800.
Letonturier, P. 2007. [Obesity, a worldwide epidemic]. Presse medicale 36: 1773-1775.Maroto, M. et al. 1997. Ectopic Pax-3 activates MyoD and Myf-5 expression in embryonic
mesoderm and neural tissue. Cell 89: 139-148.Mavalli, M. D. et al. 2010. Distinct growth hormone receptor signaling modes regulate skeletal
muscle development and insulin sensitivity in mice. The Journal of clinical investigation 120: 4007-4020.
Nam, S. Y., and C. Marcus. 2000. Growth hormone and adipocyte function in obesity. Hormone research 53 Suppl 1: 87-97.
Pfaffl, M. W. 2001. A new mathematical model for relative quantification in real-time RT-PCR. Nucleic acids research 29: e45.
Reznikoff, C. A., D. W. Brankow, and C. Heidelberger. 1973. Establishment and characterization of a cloned line of C3H mouse embryo cells sensitive to postconfluence inhibition of division. Cancer research 33: 3231-3238.
Richter, H. E., T. Albrektsen, and N. Billestrup. 2003. The role of signal transducer and activator of transcription 5 in the inhibitory effects of GH on adipocyte differentiation. Journal of molecular endocrinology 30: 139-150.
Rodeheffer, M. S., K. Birsoy, and J. M. Friedman. 2008. Identification of white adipocyte progenitor cells in vivo. Cell 135: 240-249.
Rosen, T., I. Bosaeus, J. Tolli, G. Lindstedt, and B. A. Bengtsson. 1993. Increased body fat mass and decreased extracellular fluid volume in adults with growth hormone deficiency. Clinical endocrinology 38: 63-71.
Ross, S. E. et al. 2000. Inhibition of adipogenesis by Wnt signaling. Science 289: 950-953.Seale, P. et al. 2000. Pax7 is required for the specification of myogenic satellite cells. Cell 102:
777-786.Sotiropoulos, A. et al. 2006. Growth hormone promotes skeletal muscle cell fusion independent
of insulin-like growth factor 1 up-regulation. Proceedings of the National Academy of Sciences of the United States of America 103: 7315-7320.
Stockdale, F. E. 1992. Myogenic cell lineages. Developmental biology 154: 284-298.Tang, Q. Q. et al. 2005. Sequential phosphorylation of CCAAT enhancer-binding protein beta by
MAPK and glycogen synthase kinase 3beta is required for adipogenesis. Proceedings of the National Academy of Sciences of the United States of America 102: 9766-9771.
Tang, Q. Q., and M. D. Lane. 1999. Activation and centromeric localization of CCAAT/enhancer-binding proteins during the mitotic clonal expansion of adipocyte differentiation. Genes & development 13: 2231-2241.
Tang, Q. Q., T. C. Otto, and M. D. Lane. 2003a. CCAAT/enhancer-binding protein beta is required for mitotic clonal expansion during adipogenesis. Proceedings of the National Academy of Sciences of the United States of America 100: 850-855.
70

Tang, Q. Q., T. C. Otto, and M. D. Lane. 2003b. Mitotic clonal expansion: a synchronous process required for adipogenesis. Proceedings of the National Academy of Sciences of the United States of America 100: 44-49.
Taylor, S. M., and P. A. Jones. 1979. Multiple new phenotypes induced in 10T1/2 and 3T3 cells treated with 5-azacytidine. Cell 17: 771-779.
Wabitsch, M., H. Hauner, E. Heinze, and W. M. Teller. 1995. The role of growth hormone/insulin-like growth factors in adipocyte differentiation. Metabolism: clinical and experimental 44: 45-49.
Wabitsch, M., and E. Heinze. 1993. Body fat in GH-deficient children and the effect of treatment. Hormone research 40: 5-9.
Wabitsch, M. et al. 1996. Biological effects of human growth hormone in rat adipocyte precursor cells and newly differentiated adipocytes in primary culture. Metabolism: clinical and experimental 45: 34-42.
Zuk, P. A. et al. 2002. Human adipose tissue is a source of multipotent stem cells. Molecular biology of the cell 13: 4279-4295.
71

Table 3. 1. Nucleotide sequences of the primers used for real-time RT-PCR
Gene Direction Primer sequenceGenBank
Accession #
MyoDForwardReverse
5’- CCACTCCGGGACATAGACTTG -3’5’- AAAAGCGCAGGTCTGGTGAG -3’
NM_010866
Myf5ForwardReverse
5’- ATCCAGGTATTCCCACCTGCT -3’5’- ACTGGTCCCCAAACTCATCCT -3’
NM_008656
Pax3ForwardReverse
5’- GAGAGAACCCGGGCATGTTT -3’5’- TTTACTCCTCAGGATGCGGC -3’
NM_001159520
Pax7ForwardReverse
5’- TCTCCAAGATTCTGTGCCGAT -3’5’- CGGGGTTCTCTCTCTTATACTCC -3’
NM_011039
MyogeninForwardReverse
5’- GAGACATCCCCCTATTTCTACCA -3’5’- GCTCAGTCCGCTCATAGCC -3’
NM_031189
MHC3ForwardReverse
5’- CGCAGAATCGCAAGTCAATA -3’5’- ATATCTTCTGCCCTGCACCA -3’
NM_001099635
CD24ForwardReverse
5’- ATGCCGCTATTGAATCTGCTGGAG -3’5’- TGCACTATGGCCTTATCGGTCAGA -3’
NM_009846
CD29ForwardReverse
5’- CAATGGCGTGTGCAGGTGTC -3’5’- ACGCCAAGGCAGGTCTGAC -3’
NM_010578
CD34ForwardReverse
5’- GCACCTCCACAGGGACACGC -3’5’- TGGCTGGTACTTCCAGGGATGCT -3’
NM_001111059
Sca-1ForwardReverse
5’- GGGACTGGAGTGTTSCCAGTGCTA -3’5’- AGGAGGGCAGATGGGTAAGCAA -3’
NM_010738
PPARγForwardReverse
5’- TTCAGAAGTGCCTTGCTGTG -3’5’- CCAACAGCTTCTCCTTCTCG -3’
NM_181024
CEBPαForwardReverse
5’- AGCAACGAGTACCGGGTACG -3’5’- TGTTTGGCTTTATCTCGGCTC -3’
NM_176784
BMP4ForwardReverse
5’- GAGCCATTCCGTAGTGCCAT -3’5’- ACGACCATCAGCATTCGGTT -3’
NM_007554
Wnt10bForwardReverse
5’- GGAATGGGGTGGCTGTAACC -3’5’- TTTGCACTTCCGCTTCAGGT -3’
NM_011718
Plin1ForwardReverse
5’- AAGGATCCTGCACCTCACAC -3’5’- CCTCTGCTFAAGGGTTATCG -3’
NM_175640
FABP4ForwardReverse
5’- CATCAGCGTAAATGGGGATT -3’5’- TCGACTTTCCATCCCSCTTC -3’
NM_024406
18SForwardReverse
5’- TTAAGAGGGACGGCCGGGGG -3’5’- CTCTGGTCCGTCTTGCGCCG -3’
NR_003278
72

Fig. 3. 1. Effects of 5’-azacytidine (5Aza) and GH on the expression of MyoD, Myf5, Pax3,
and Pax7 mRNAs in C3H10T1/2 cells. C3H10T1/2 cells cultured in growth medium were
treated with PBS (CTR), 100 ng/mL bGH, 3 µM 5’-azacytidine, or 100 ng/mL bGH together
with 3 µM 5’-azacytidine for 4 days. mRNA abundance was measured by real-time RT-PCR.
The relative abundance of an mRNA was calculated using 18S rRNA as the internal control.
Bars not sharing the same letter label are different (P < 0.05, n = 4).
73

Fig. 3. 2. Representative microgrpahs of C3H10T1/2 cells during induced myogenic
differentiation. C3H10T1/2 cells were treated with PBS (CTR), 100 ng/mL bGH, 3 µM 5’-
azacytidine, or 100 ng/mL bGH together with 3 µM 5’-azacytidine for 4 days. Subsequently,
they were re-seeded to 24-well plates at an equal density and were induced to differentiate into
myotubes at 90% confluence. Micrographs were taken at days 2, 4, 6, and 8 of differentiation.
Note elongated, multinucleated myotubes in day 4, 6 and 8 images.
74

Fig. 3. 3. Effects of 5Aza and GH on myogenic differentiation of C3H10T1/2 cells.
C3H10T1/2 cells were treated with PBS (CTR), 100 ng/mL bGH, 3 µM 5’-azacytidine, or 100
ng/mL bGH together with 3 µM 5’-azacytidine for 4 days. Subsequently, they were re-seeded to
24-well plates at an equal density and were induced to differentiate into myotubes at 90%
confluence. (A) Immunocytochemistry of differentiated C3H10T1/2 cells. Cells and nuclei were
stained with anti-myosin heavy chain antibody (green) and DAPI (blue) on day 8 of
differentiation, respectively. Shown are representative micrographs of stained cells (10 ×
75

magnification). The same views were also photographed under white light. (B) Percentage of cell
nuclei that are located in myotubes and myoblasts (P < 0.05, n = 5). (C) Percentage of cell nuclei
that are located in myotubes (P < 0.05, n = 5). MHC-positive cells containing 3 or more nuclei
were considered myotubes, while MHC-positive cells containing 1 or 2 nuclei were considered
myoblasts.
76

Fig. 3. 4. Effects of 5Aza and GH on the expression of myogenin and MHC3 mRNAs in
C3H10T1/2 cells at day 8 of myogenic differentiation. C3H10T1/2 cells were treated with
5Aza, GH, or both for 4 days and then induced to differentiate into myotubes as described
earlier. Myogenin (Myog) and MHC3 mRNAs were measured at day 8 of differentiation by real-
time RT-PCR. The relative abundance of an mRNA was calculated using 18S rRNA as the
internal control. Bars not sharing the same letter label are different (P < 0.05, n = 5).
77

78
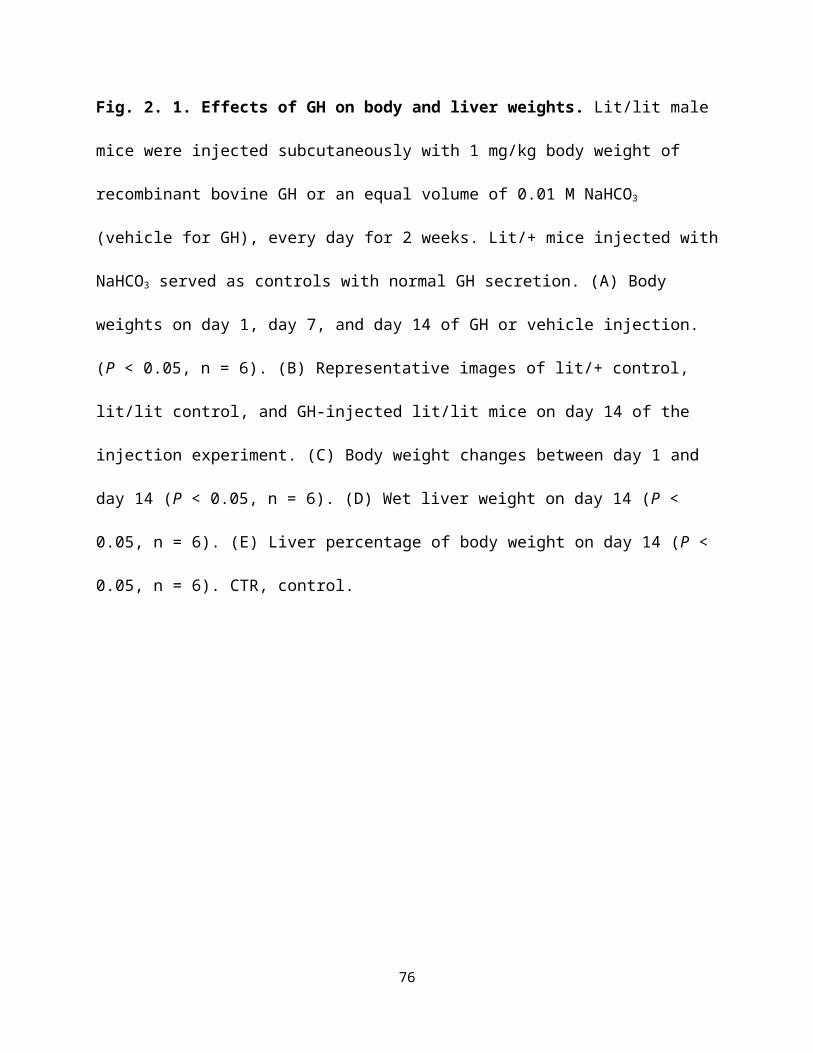
Fig. 3. 5. Effects of 5Aza and GH on the expression of CD24, CD29, CD34, Sca-1, PPARγ,
C/EBPα, BMP4, and Wnt10b mRNAs in C3H10T1/2 cells. C3H10T1/2 cells cultured in
growth medium were treated with PBS (CTR), 100 ng/mL bGH, 3 µM 5’-azacytidine, or 100
ng/mL bGH together with 3 µM 5’-azacytidine for 4 days. mRNA abundance was measured by
real-time RT-PCR. The relative abundance of an mRNA was calculated using 18S rRNA as the
internal control. Bars not sharing the same letter label are different (P < 0.05, n = 4).
79
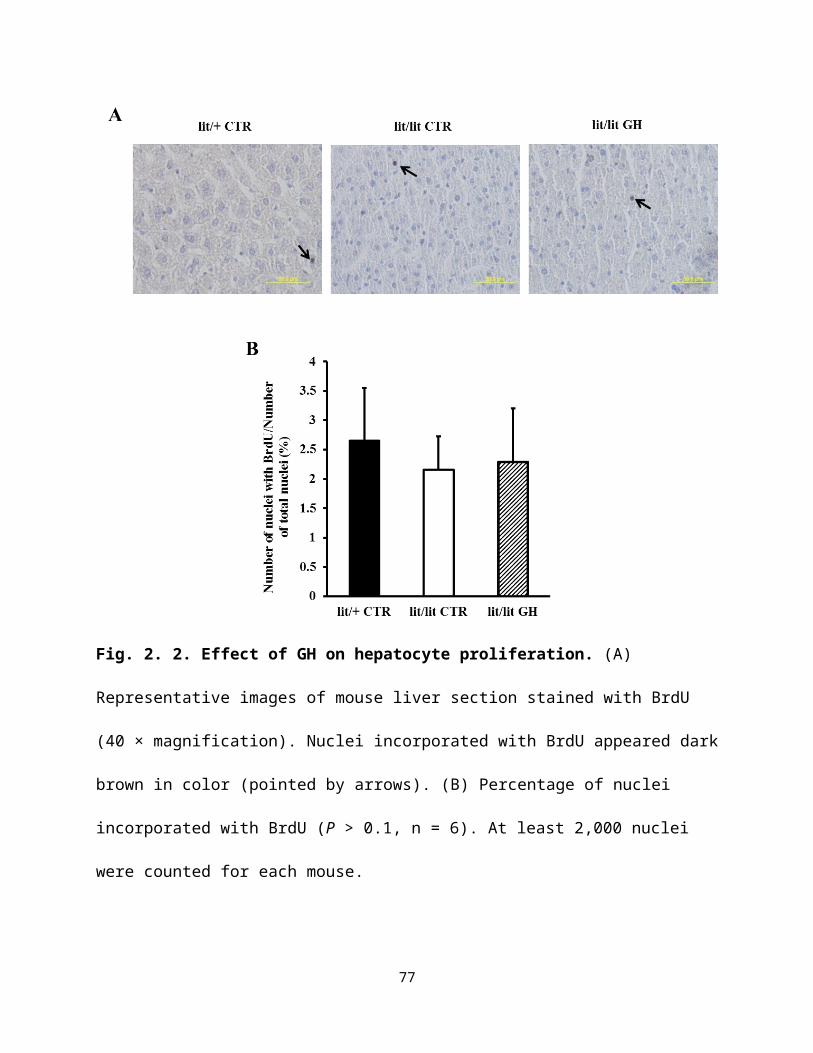
Fig. 3. 6. Representative microgrpahs of C3H10T1/2 cells during induced adipogenic
differentiation. C3H10T1/2 cells were treated with PBS (CTR), 100 ng/mL bGH, 3 µM 5’-
azacytidine, or 100 ng/mL bGH together with 3 µM 5’-azacytidine for 4 days. Subsequently,
they were re-seeded to 24-well plates at an equal density and were induced to differentiate into
adipocytes two days after reaching confluence. Micrographs were taken at days 4, 6, 8, 10, and
12 of differentiation. Lipid droplets-containing adipocytes appear white in the images.
80

Fig. 3. 7. Effects of 5Aza and GH on adipogenic differentiation of C3H10T1/2 cells.
C3H10T1/2 cells were treated with PBS (CTR), 100 ng/mL bGH, 3 µM 5’-azacytidine, or 100
ng/mL bGH together with 3 µM 5’-azacytidine for 4 days. Subsequently, they were re-seeded to
24-well plates at an equal density and were induced to differentiate into adipocytes two days
after reaching confluence. (A) Representative images of cells stained with Oil Red O on day 14
of differentiation (10 × magnification). (B) Number of adipocytes per mm2 of monolayer of cells
(P < 0.05, n = 4).
81

Fig. 3. 8. Effects of 5Aza and GH on the expression of Plin1, FABP4, PPARγ, and C/EBPα
mRNAs in C3H10T1/2 cells at day 14 of adipogenic differentiation. C3H10T1/2 cells were
treated with 5Aza, GH, or both for 4 days and then induced to differentiate into adipocytes as
described earlier. Expressions of Plin1, FABP4, PPARγ, and C/EBPα mRNAs were measured at
day 14 of differentiation by real-time RT-PCR. The relative abundance of an mRNA was
calculated using 18S rRNA as the internal control. Bars not sharing the same letter label are
different (P < 0.05, n = 5).
82