chapter i facilitating participation of smes in trade ... ii_chapter i_facilitating... · fact that...
TRANSCRIPT
28
Chapter I
Facilitating participation of SMEs in trade:
Financing and communications technology as key enablers 15
Introduction
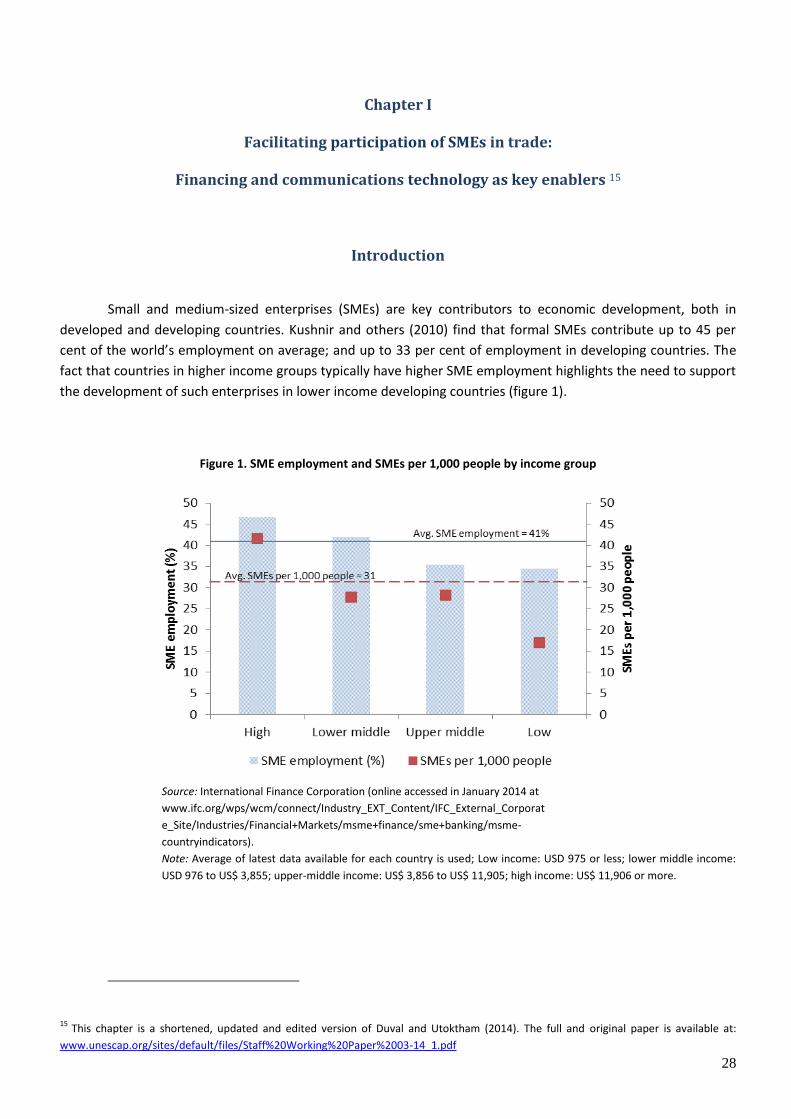
Small and medium-sized enterprises (SMEs) are key contributors to economic development, both in
developed and developing countries. Kushnir and others (2010) find that formal SMEs contribute up to 45 per
cent of the world’s employment on average; and up to 33 per cent of employment in developing countries. The
fact that countries in higher income groups typically have higher SME employment highlights the need to support
the development of such enterprises in lower income developing countries (figure 1).
Figure 1. SME employment and SMEs per 1,000 people by income group
Source: International Finance Corporation (online accessed in January 2014 at
www.ifc.org/wps/wcm/connect/Industry_EXT_Content/IFC_External_Corporat
e_Site/Industries/Financial+Markets/msme+finance/sme+banking/msme-
countryindicators).
Note: Average of latest data available for each country is used; Low income: USD 975 or less; lower middle income:
USD 976 to US$ 3,855; upper-middle income: US$ 3,856 to US$ 11,905; high income: US$ 11,906 or more.
15 This chapter is a shortened, updated and edited version of Duval and Utoktham (2014). The full and original paper is available at:
www.unescap.org/sites/default/files/Staff%20Working%20Paper%2003-14_1.pdf
29
United Arab Emirates
AustraliaAustria
Belgium
Canada
Switzerland
Czech Republic
GermanyDenmark
SpainEstonia
Finland
France
United Kingdom
Greece
Hong Kong SAR, China
Croatia
Ireland
Iceland
Israel
Italy
Japan Korea, Rep.
Kuwait
Luxembourg
Netherlands
Norway
New Zealand
Oman
Portugal
Singapore
Slovak Republic
Slovenia
Sweden
Saudi Arabia
Trinidad and Tobago
United States
Argentina
Bulgaria
Bosnia and HerzegovinaBelarusBrazil
Botswana
Chile
Costa Rica
Dominican Republic
Algeria
HungaryJamaica
Kazakhstan
LithuaniaLatviaMexico
Macedonia, FYRMontenegroMauritius
Malaysia
Poland
Puerto RicoRomania
Russian FederationSerbia
Turkey
Uruguay
Venezuela, RB
Albania Armenia
Azerbaijan
ChinaColombia
Egypt, Arab Rep.
Georgia
IndonesiaJordanSri LankaMoldova
Peru
PhilippinesEl Salvador
ThailandTunisia
Ukraine
West Bank and Gaza
Burkina Faso
EthiopiaIndia
KenyaKyrgyz RepublicNepal Pakistan
RwandaTajikistan
TanzaniaUganda
Uzbekistan
02
04
06
08
01
00
Doin
g b
usin
ess s
core
:
dis
tan
ce to
fro
ntie
r (0
-10
0)
0 20 40 60 80 100SME density: SMEs per 1000 people
High income Upper middle income
Lower middle income Low income
Line: y=x Fitted Line
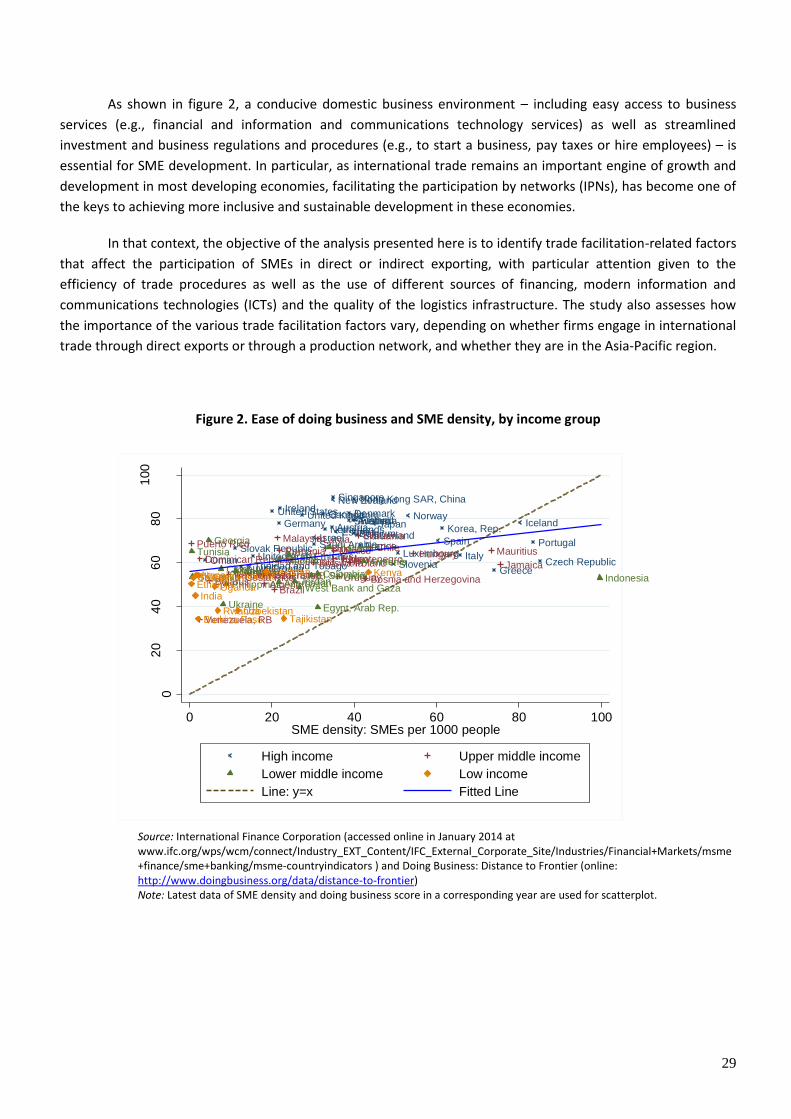
As shown in figure 2, a conducive domestic business environment – including easy access to business
services (e.g., financial and information and communications technology services) as well as streamlined
investment and business regulations and procedures (e.g., to start a business, pay taxes or hire employees) – is
essential for SME development. In particular, as international trade remains an important engine of growth and
development in most developing economies, facilitating the participation by networks (IPNs), has become one of
the keys to achieving more inclusive and sustainable development in these economies.
In that context, the objective of the analysis presented here is to identify trade facilitation-related factors
that affect the participation of SMEs in direct or indirect exporting, with particular attention given to the
efficiency of trade procedures as well as the use of different sources of financing, modern information and
communications technologies (ICTs) and the quality of the logistics infrastructure. The study also assesses how
the importance of the various trade facilitation factors vary, depending on whether firms engage in international
trade through direct exports or through a production network, and whether they are in the Asia-Pacific region.
Figure 2. Ease of doing business and SME density, by income group
Source: International Finance Corporation (accessed online in January 2014 at www.ifc.org/wps/wcm/connect/Industry_EXT_Content/IFC_External_Corporate_Site/Industries/Financial+Markets/msme+finance/sme+banking/msme-countryindicators ) and Doing Business: Distance to Frontier (online: http://www.doingbusiness.org/data/distance-to-frontier) Note: Latest data of SME density and doing business score in a corresponding year are used for scatterplot.

30
The definition of SMEs usually varies across countries as well as international organizations. This paper
follows the World Bank’s Enterprise Survey definition: (a) small enterprises are firms with 5 to 19 employees; (b)
medium enterprises are firms with 20-99 employees; and (c) large enterprises are firms with 100 employees or
more.16 For the purpose of this study, participation by SMEs in IPN follows the definition by Wignaraja (2012), i.e.,
firms are considered members of a production network if they export directly or indirectly.
Following a brief review of the existing empirical economic literature on the determinants of SME
participation in exporting (section A) and a brief review of obstacles to SME establishment and operations based
on the most recent World Bank Enterprise Survey data (section B), empirical models of SME export participation
are estimated and discussed in section C. Conclusion and policy recommendations that stem from the results are
presented in section D.
A. Review of the literature
Previous empirical literature has identified a relatively large number of factors that affect a firm’s
decision to export. These factors may be broadly categorized as firm characteristics, including measures of a
firm’s efficiency, and factors related to the external environment. A firm’s characteristics that are often cited in
the literature include size, foreign ownership, productivity, human capital and technological adoption. Other
characteristics that have been studied for their impact on participation in exporting – and typically used to infer a
firm’s efficiency – include sourcing of input/raw materials for production, the business sector, access to
knowledge and technology, capital stock, productivity and age of the firm.
External factors of importance to the participation of SMEs in trade typically relate to the quality of the
domestic business climate, which may be referred to as behind-the-border factors from a trade facilitation
perspective. Other external factors that are often referred to include access to finance, quality of institutions,
transport connectivity, quality of technology and rate of adoption in the home country as well as the complexity
of customs procedures. A summary of recent empirical studies of firms’ participation in exporting is given in table
1.
Overall, while a relatively large number of studies have been conducted on determinants of export
participation, few have focused explicitly on SMEs, particularly in developing countries. Unlike the study
presented here, the past literature also does not distinguish between determinants of direct export and IPN
participation, nor does it examine differences between firms globally and in the Asia-Pacific region. Finally, while
access to finance is often highlighted as an important factor, the literature provides no analysis of the relative
importance of different forms of financing. The importance of other trade facilitation-related factors included in
the present study has also been largely ignored in previous studies.
16 Another widely-cited definition of SMEs (referred to as micro, small and medium-sized enterprises; MSMEs) is from that used by the
European Commission (http://ec.europa.eu/enterprise/policies/sme/facts-figures-analysis/sme-definition/index_en.htm). However, this
study follows the definition of SMEs from the World Bank’s Enterprise Survey to reflect more on the size in developing countries. For a
country-specific SME definition, see IFC (www.ifc.org/wps/wcm/connect/Industry_EXT_Content/IFC_External_Corporate_Site/Industries/
Financial+Markets/msme+finance/sme+banking/msme-countryindicators).

31
Table 1. Summary of recent empirical studies of firms’ participation in exporting
Research/study Summary and findings related to SMEs, export participation, institutional
arrangements, or inclusiveness
Amornkitvikai and others
(2012). Factors affecting
the export participation
and performance of Thai
manufacturing small and
medium-sized enterprises.
The study used cross-sectional data (2007) on Thai manufacturing SMEs to
identify factors affecting export participation. It found that government
assistance, foreign ownership, municipal location, R&D and skilled labour have a
significant positive effect on the participation by a firm in the export market.
However, size of firm (small or medium), age and labour productivity had a
mixed effect on export participation, depending on the models.
Amrouk and others (2013).
The impact of commodity
development projects on
smallholders’ market
access in developing
countries: Case studies of
FAO/CFC projects.
The study found that extension services, provided credit as well as change in
agricultural assets are crucial determinants of market access by smallholders.
Smallholders with better wealth endowment and location tend to be those who
gain access to markets. Improvement of credit support activities is essential in
enabling market participation, particularly by poorer smallholders.
Bellone and others (2008)..
Financial constraints as a
barrier to export
participation.
The study assessed the link between financial constraints and export
participation of French manufacturing firms from 1996 to 2004. The results
support the fact that financial constraints are barriers to export participation.
Characteristics of firms – i.e., size, wage and productivity – have a positive
effect on export participation. Firms with either domestic or foreign subsidiaries
tend to export more. In addition, export starters do not exhibit ex ante financial
advantages and there is no significant evidence that firms who become
exporters will face fewer financial constraints.
Cardoza and others
(2012).. Institutional
determinants of Chinese
SMEs’ internationalization
– the case of Jiangsu
Province.
The study assessed factors affecting export intensity (ratio of international sales
to total sales) in Jiangsu Province of China. Estimated using OLS, the model
suggests that limited access to finance, domestic inefficiencies in logistics and
distribution, costs of internationalization (including international transport
costs and payment collection costs), and adverse regulatory frameworks affect
decision to participate in export markets. Three other factors, i.e., government
assistance, state participation, and public procurement, are not statistically
significant.
Harvie and others (2010).
Firm characteristic
determinants of SME
participation in production
network.
This study identified determinants of participation in production network in
2009 in some ASEAN countries and China. Productivity, foreign ownership,
financial characteristics, innovation efforts, and managerial/entrepreneurial
attitudes are important firm characteristics in determining SME participation in
the network. Firm size also matters.
Hessels and Terjesen
(2007). SME choice of
direct and indirect export
modes: resource
dependency and
institutional theory
perspectives.
The study examined participation in the export market in the Netherlands. It
found that institutional theory (which describes how firms adopt legitimate
business/industry practices) may be relevant in explaining choice of whether or
not to export, whereas resource dependency theory (which describes how firms
in the industry access resources) may be relevant in explaining the choice
between becoming direct or indirect exporters.
Hoekman and Shepherd
(2013). Who profits from
trade facilitation
The study found that export time – as a measure of trade facilitation – size of
firms and ownership are positively related to participation in direct export.
Trade facilitation matters for all firm sizes.
32
initiatives?
Li and Wilson (2009). Trade
facilitation and expanding
the benefits of trade:
evidence from firm level
data.
The study showed that improvement in trade facilitation tends to increase
probability of SMEs to export. In particular, better ICT services, streamlined
clearance and less transportation obstacles increase the chance of export
participation.
Ottaviano and Martincus
(2009). SMEs in Argentina:
Who are the exporters?
The study examined the determinants of export participation in Argentina. It
found that the number of employees, sourcing input from abroad, investment
in product improvement and average productivity (measured by sales per
employee) are associated with higher exporting probability.
Roberts and Tybout (1997).
The decision to export in
Colombia: an empirical
model of entry with sunk
costs.
The study found sunk costs (measured by past export participation), firm-
specific characteristics (measured by industry dummy, ownership structure and
location), efficiency of firms (measured by capital stock and age of firms) are
significant factors determining current export participation.
Wignaraja (2012). Engaging
Small and Medium-sized
enterprises in production
networks: Firm-level
analysis of five ASEAN
economies.
The study analysed the determinants of export participation in ASEAN. Firm
size, foreign ownership and higher workers’ education, obtaining international-
agreed certificates (such as ISO) or foreign technology and having access to
bank credit induces SMEs to participate in exporting. Firm age is negatively
associated with the participation in exporting. Practices by competitors in
informal sectors, political instability, and access to finance, tax rates and
corruption were also found to be the top five obstacles in conducting SME
business.
B. Exporting SMEs: Preliminary insights derived from firm-level data
Given the global and regional scope of the analysis, this study relies on the standardized dataset of the
World Bank Enterprise Surveys (2006-2014) on enterprises and their characteristics in 122 countries. Four of the
Enterprise Surveys are firm-level surveys of a representative sample of an economy’s private sector. Eighty per
cent of the 53,500 firms included in the standardized dataset are SMEs. The demographic description of export
participation by SMEs and large enterprises (LEs) in the dataset is provided in annex table 1(a).
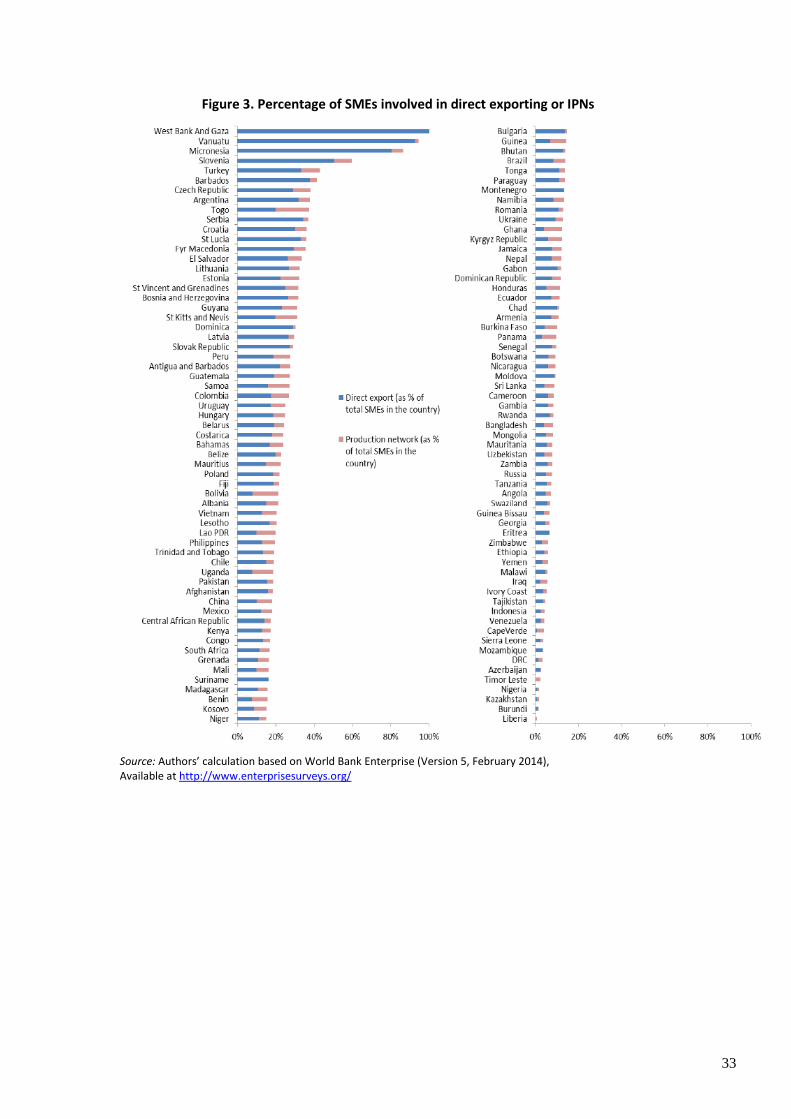
An overwhelming majority of SMEs do not engage in either direct or indirect exporting. Those who do
export, however, do so directly rather than indirectly.17 Figure 3 illustrates the percentage of SME firms engaged
in direct exporting or in an IPN (i.e., defined here as engaged in direct and/or indirect exporting) in each country
included in the dataset. On average, only 14 per cent and 19 per cent of SMEs in the Enterprise Survey participate
in direct exporting and IPN, respectively. These proportions are similar to those in the Asia-Pacific region.18
17 This is also true for large enterprises see annex in full paper for details). Available at
www.unescap.org/sites/default/files/Staff%20Working%20Paper%2003-14_1.pdf. 18
See annex in full paper for details. Available at www.unescap.org/sites/default/files/Staff%20Working%20Paper%2003-14_1.pdf.
33
Figure 3. Percentage of SMEs involved in direct exporting or IPNs
Source: Authors’ calculation based on World Bank Enterprise (Version 5, February 2014), Available at http://www.enterprisesurveys.org/
34
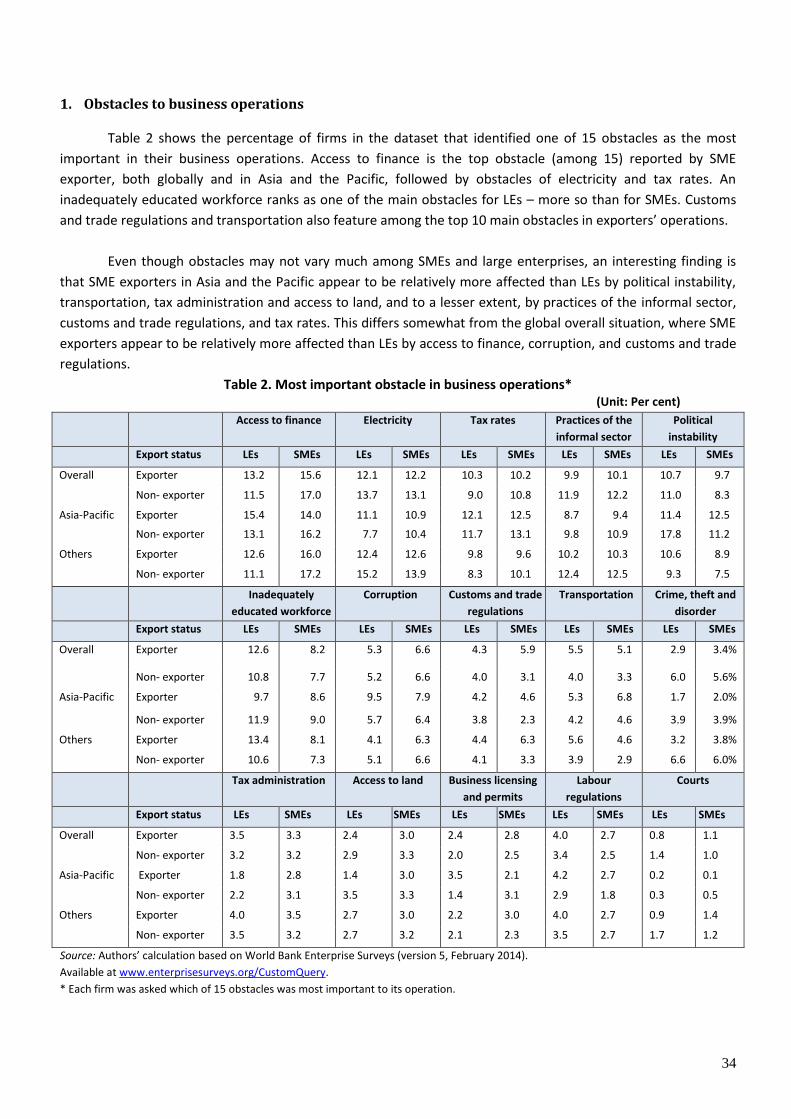
1. Obstacles to business operations
Table 2 shows the percentage of firms in the dataset that identified one of 15 obstacles as the most
important in their business operations. Access to finance is the top obstacle (among 15) reported by SME
exporter, both globally and in Asia and the Pacific, followed by obstacles of electricity and tax rates. An
inadequately educated workforce ranks as one of the main obstacles for LEs – more so than for SMEs. Customs
and trade regulations and transportation also feature among the top 10 main obstacles in exporters’ operations.
Even though obstacles may not vary much among SMEs and large enterprises, an interesting finding is
that SME exporters in Asia and the Pacific appear to be relatively more affected than LEs by political instability,
transportation, tax administration and access to land, and to a lesser extent, by practices of the informal sector,
customs and trade regulations, and tax rates. This differs somewhat from the global overall situation, where SME
exporters appear to be relatively more affected than LEs by access to finance, corruption, and customs and trade
regulations.
Table 2. Most important obstacle in business operations* (Unit: Per cent)
Access to finance Electricity Tax rates Practices of the
informal sector
Political
instability
Export status LEs SMEs LEs SMEs LEs SMEs LEs SMEs LEs SMEs
Overall Exporter 13.2 15.6 12.1 12.2 10.3 10.2 9.9 10.1 10.7 9.7
Non- exporter 11.5 17.0 13.7 13.1 9.0 10.8 11.9 12.2 11.0 8.3
Asia-Pacific Exporter 15.4 14.0 11.1 10.9 12.1 12.5 8.7 9.4 11.4 12.5
Non- exporter 13.1 16.2 7.7 10.4 11.7 13.1 9.8 10.9 17.8 11.2
Others Exporter 12.6 16.0 12.4 12.6 9.8 9.6 10.2 10.3 10.6 8.9
Non- exporter 11.1 17.2 15.2 13.9 8.3 10.1 12.4 12.5 9.3 7.5
Inadequately
educated workforce
Corruption Customs and trade
regulations
Transportation Crime, theft and
disorder
Export status LEs SMEs LEs SMEs LEs SMEs LEs SMEs LEs SMEs
Overall Exporter 12.6 8.2 5.3 6.6 4.3 5.9 5.5 5.1 2.9 3.4%
Non- exporter 10.8 7.7 5.2 6.6 4.0 3.1 4.0 3.3 6.0 5.6%
Asia-Pacific Exporter 9.7 8.6 9.5 7.9 4.2 4.6 5.3 6.8 1.7 2.0%
Non- exporter 11.9 9.0 5.7 6.4 3.8 2.3 4.2 4.6 3.9 3.9%
Others Exporter 13.4 8.1 4.1 6.3 4.4 6.3 5.6 4.6 3.2 3.8%
Non- exporter 10.6 7.3 5.1 6.6 4.1 3.3 3.9 2.9 6.6 6.0%
Tax administration Access to land Business licensing
and permits
Labour
regulations
Courts
Export status LEs SMEs LEs SMEs LEs SMEs LEs SMEs LEs SMEs
Overall Exporter 3.5 3.3 2.4 3.0 2.4 2.8 4.0 2.7 0.8 1.1
Non- exporter 3.2 3.2 2.9 3.3 2.0 2.5 3.4 2.5 1.4 1.0
Asia-Pacific Exporter 1.8 2.8 1.4 3.0 3.5 2.1 4.2 2.7 0.2 0.1
Non- exporter 2.2 3.1 3.5 3.3 1.4 3.1 2.9 1.8 0.3 0.5
Others Exporter 4.0 3.5 2.7 3.0 2.2 3.0 4.0 2.7 0.9 1.4
Non- exporter 3.5 3.2 2.7 3.2 2.1 2.3 3.5 2.7 1.7 1.2
Source: Authors’ calculation based on World Bank Enterprise Surveys (version 5, February 2014).
Available at www.enterprisesurveys.org/CustomQuery.
* Each firm was asked which of 15 obstacles was most important to its operation.
35
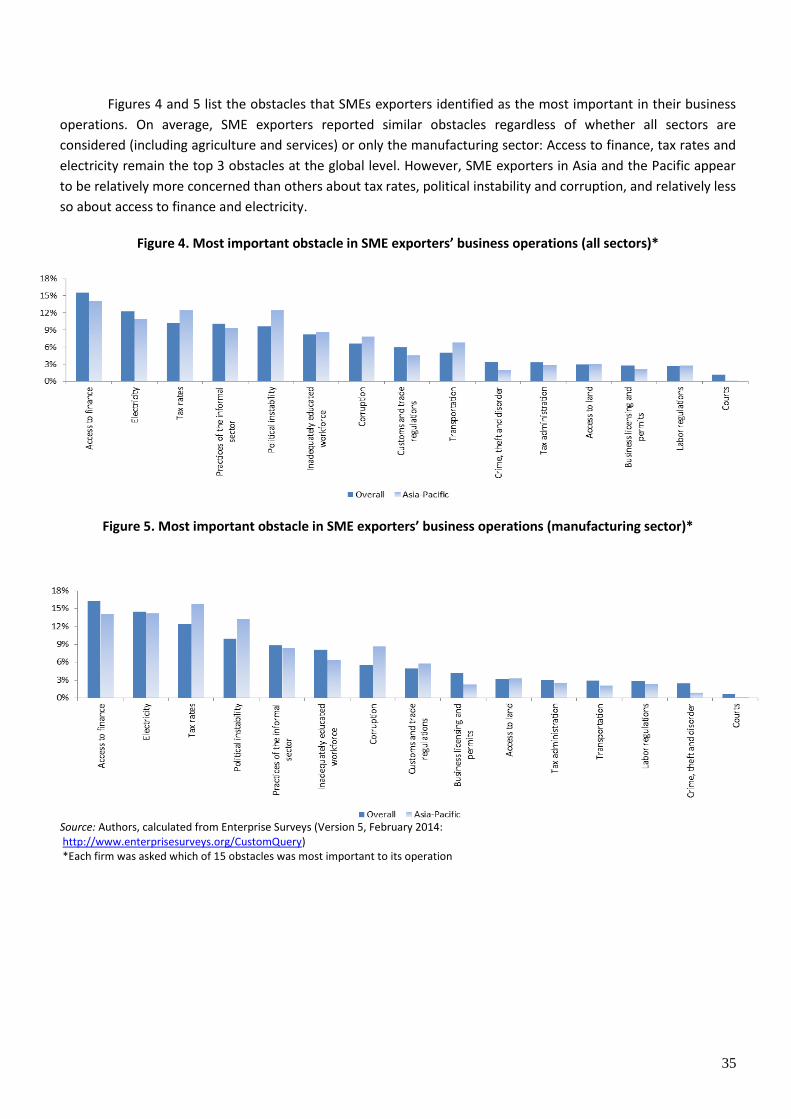
Figures 4 and 5 list the obstacles that SMEs exporters identified as the most important in their business
operations. On average, SME exporters reported similar obstacles regardless of whether all sectors are
considered (including agriculture and services) or only the manufacturing sector: Access to finance, tax rates and
electricity remain the top 3 obstacles at the global level. However, SME exporters in Asia and the Pacific appear
to be relatively more concerned than others about tax rates, political instability and corruption, and relatively less
so about access to finance and electricity.
Figure 4. Most important obstacle in SME exporters’ business operations (all sectors)*
Figure 5. Most important obstacle in SME exporters’ business operations (manufacturing sector)*
Source: Authors, calculated from Enterprise Surveys (Version 5, February 2014: http://www.enterprisesurveys.org/CustomQuery) *Each firm was asked which of 15 obstacles was most important to its operation
36
Asia-Pacific SME manufacturing exporters identified customs and trade regulations as a more important obstacle than transportation, although transportation was seen as more important than trade regulations when SME exporters from the agriculture and services sectors were included. This suggests that the transport infrastructure in rural areas and urban centres in Asia-Pacific may be relatively more underdeveloped than that available to manufacturing exporters – typically located in manufacturing zones and/or near major ports.
2. Sources of financing
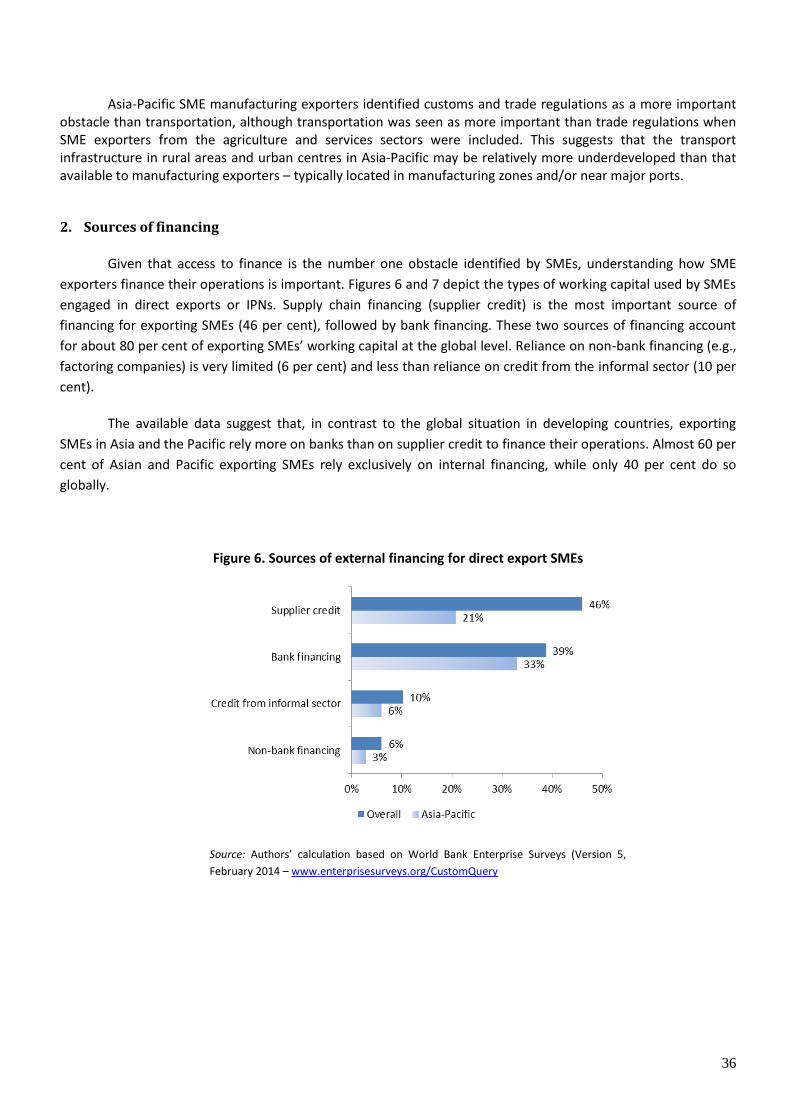
Given that access to finance is the number one obstacle identified by SMEs, understanding how SME
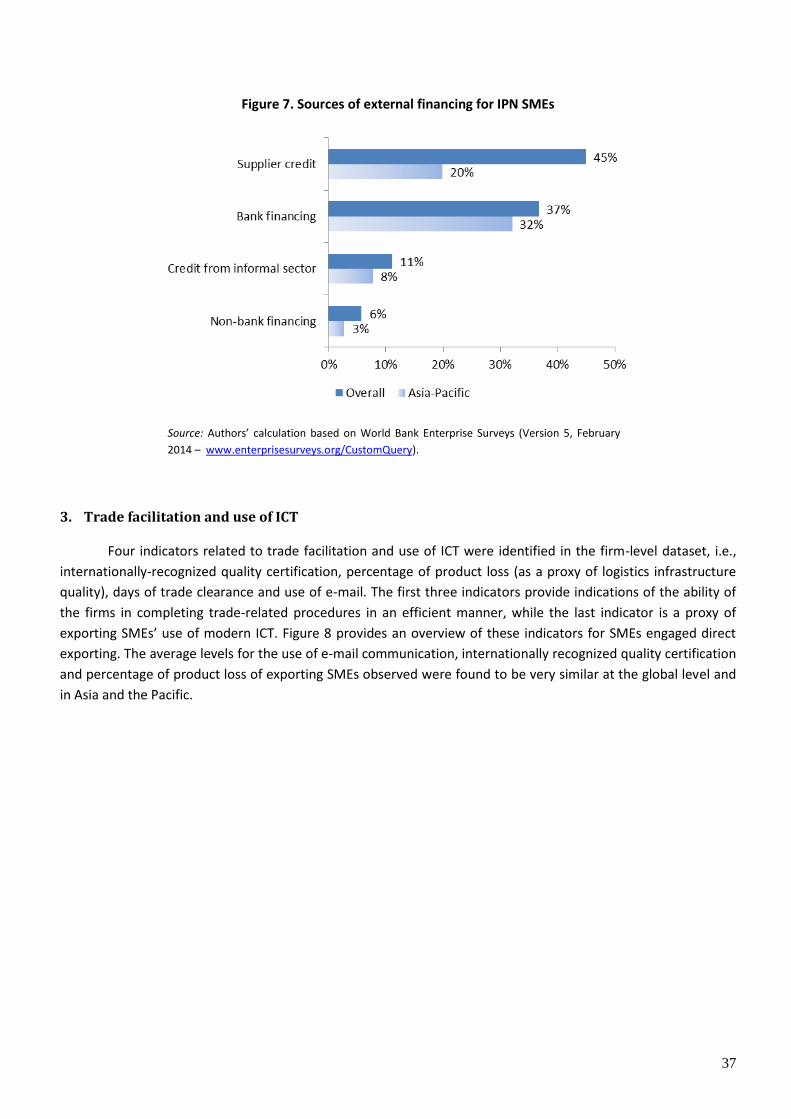
exporters finance their operations is important. Figures 6 and 7 depict the types of working capital used by SMEs
engaged in direct exports or IPNs. Supply chain financing (supplier credit) is the most important source of
financing for exporting SMEs (46 per cent), followed by bank financing. These two sources of financing account
for about 80 per cent of exporting SMEs’ working capital at the global level. Reliance on non-bank financing (e.g.,
factoring companies) is very limited (6 per cent) and less than reliance on credit from the informal sector (10 per
cent).
The available data suggest that, in contrast to the global situation in developing countries, exporting
SMEs in Asia and the Pacific rely more on banks than on supplier credit to finance their operations. Almost 60 per
cent of Asian and Pacific exporting SMEs rely exclusively on internal financing, while only 40 per cent do so
globally.
Figure 6. Sources of external financing for direct export SMEs
Source: Authors’ calculation based on World Bank Enterprise Surveys (Version 5,
February 2014 – www.enterprisesurveys.org/CustomQuery
37
Figure 7. Sources of external financing for IPN SMEs
Source: Authors’ calculation based on World Bank Enterprise Surveys (Version 5, February
2014 – www.enterprisesurveys.org/CustomQuery).
3. Trade facilitation and use of ICT
Four indicators related to trade facilitation and use of ICT were identified in the firm-level dataset, i.e.,
internationally-recognized quality certification, percentage of product loss (as a proxy of logistics infrastructure
quality), days of trade clearance and use of e-mail. The first three indicators provide indications of the ability of
the firms in completing trade-related procedures in an efficient manner, while the last indicator is a proxy of
exporting SMEs’ use of modern ICT. Figure 8 provides an overview of these indicators for SMEs engaged direct
exporting. The average levels for the use of e-mail communication, internationally recognized quality certification
and percentage of product loss of exporting SMEs observed were found to be very similar at the global level and
in Asia and the Pacific.

38
Figure 8. Trade facilitation performance and ICT use of SMEs engaged in direct exporting
Source: Authors’ calculation based on World Bank
Enterprise Surveys (Version 5, February 2014
www.enterprisesurveys.org/CustomQuery).
C. Key factors in SME participation in exporting and IPNs
While the descriptive analysis of the World Bank Enterprise Survey data provides some preliminary
insights of the obstacles faced by SMEs engaged in direct or indirect exporting, an empirical analysis is required to
identify statistically significant characteristics and factors that distinguish SMEs participating in exporting and
IPNs from those that do not. To formally estimate the relationship between various firm characteristics as well as
trade facilitation and trade finance on the participation of firms in direct export and IPNs – in the manufacturing
sector only – a series of regression models was used in the study.
The description of the variables used to specify various firm characteristics in the models of export and
IPC participation are shown in Table 3- see annex 1 for technical details of the empirical model estimated.
Econometric estimates of the models are reported in annex 2, from tables 2(a) to 2(d). More simply put, the
impact of variables on SME participation in exports are listed in annex table 2(a) and IPNs in annex table 2(b)
across firms of all sizes globally (model 1), SMEs globally (model 2), firms of all sizes within the Asia-Pacific subset

39
(model 3) and SMEs within the Asia-Pacific subset (model 4).19 The marginal effects on SME participation in
exports and IPNs are shown in annex tables 2(c) and 2(d), respectively.20
This study relied on the standardized World Bank Enterprise Survey data discussed above to estimate the
models. As in Hoekman and Shepherd (2013), and to ensure that only the most reliable data were used, the
dataset employed to estimate the models comprised only data from enterprise surveys for which survey
administrators indicated that (a) questions in the survey were answered truthfully or somewhat truthfully, and
(b) figures were taken directly from the record or estimates computed with some precision, i.e., data were
dropped if either criterion was not satisfied. In addition, the dataset uses stratified random sampling based on
size of firm, location and business sector.21
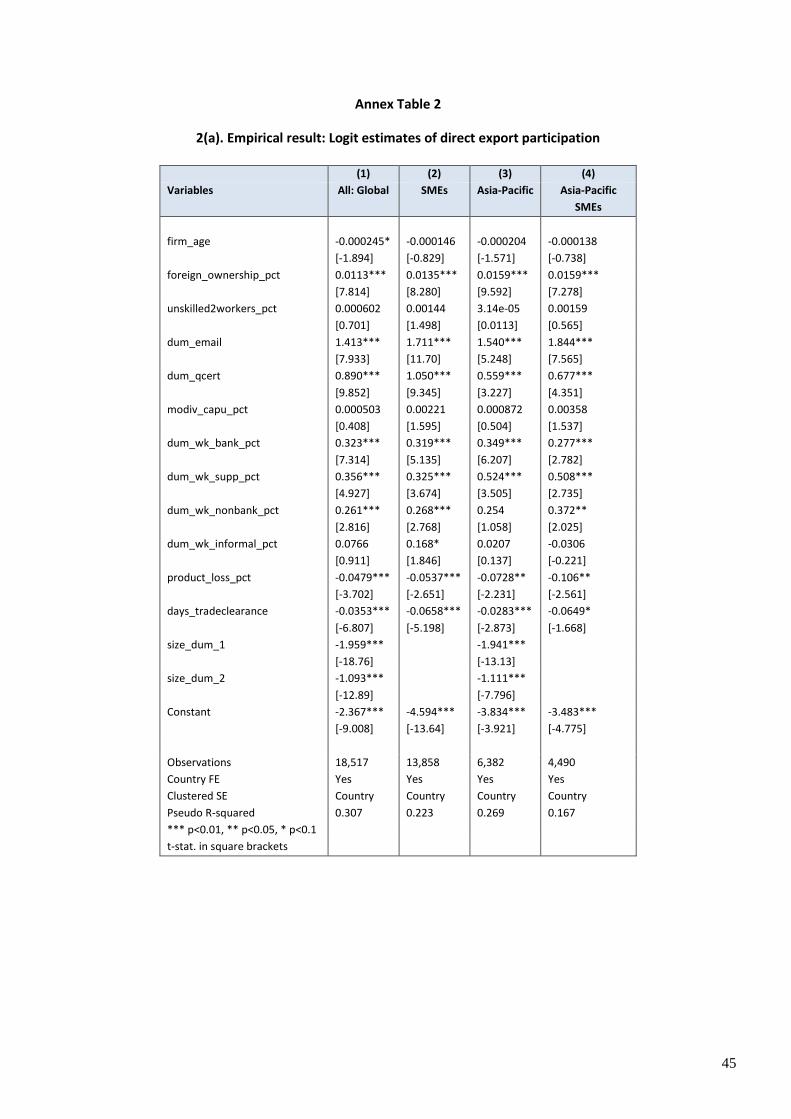
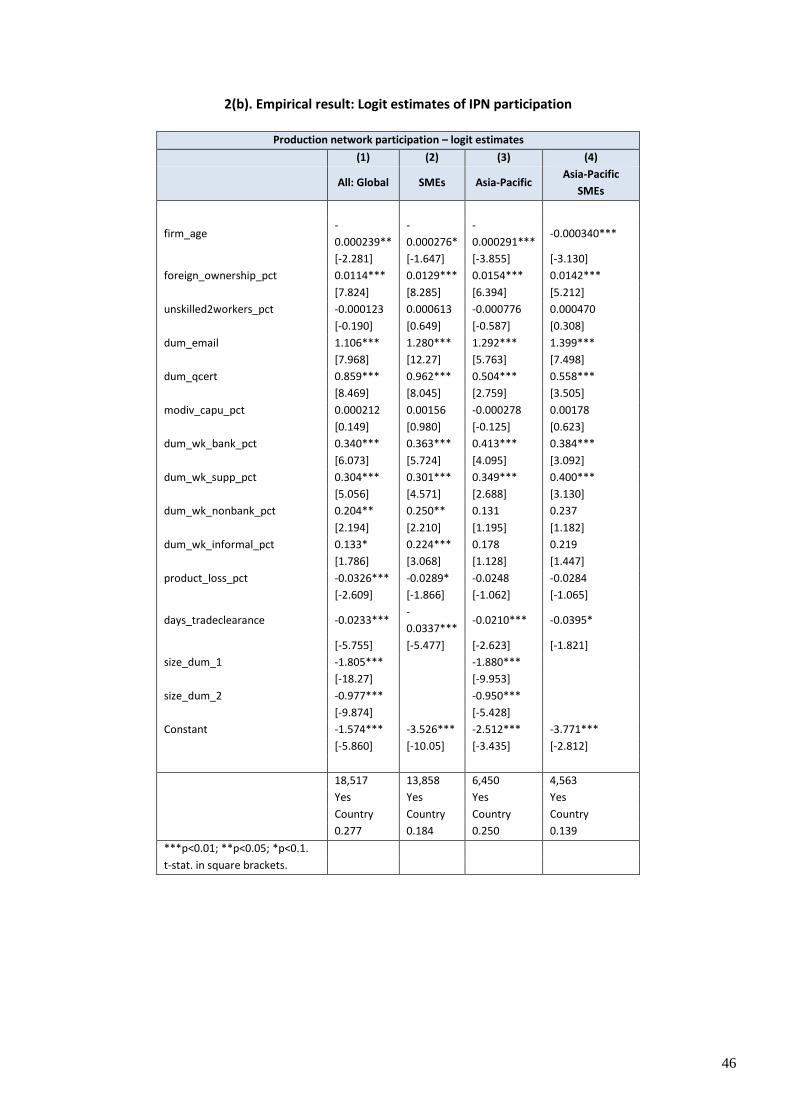
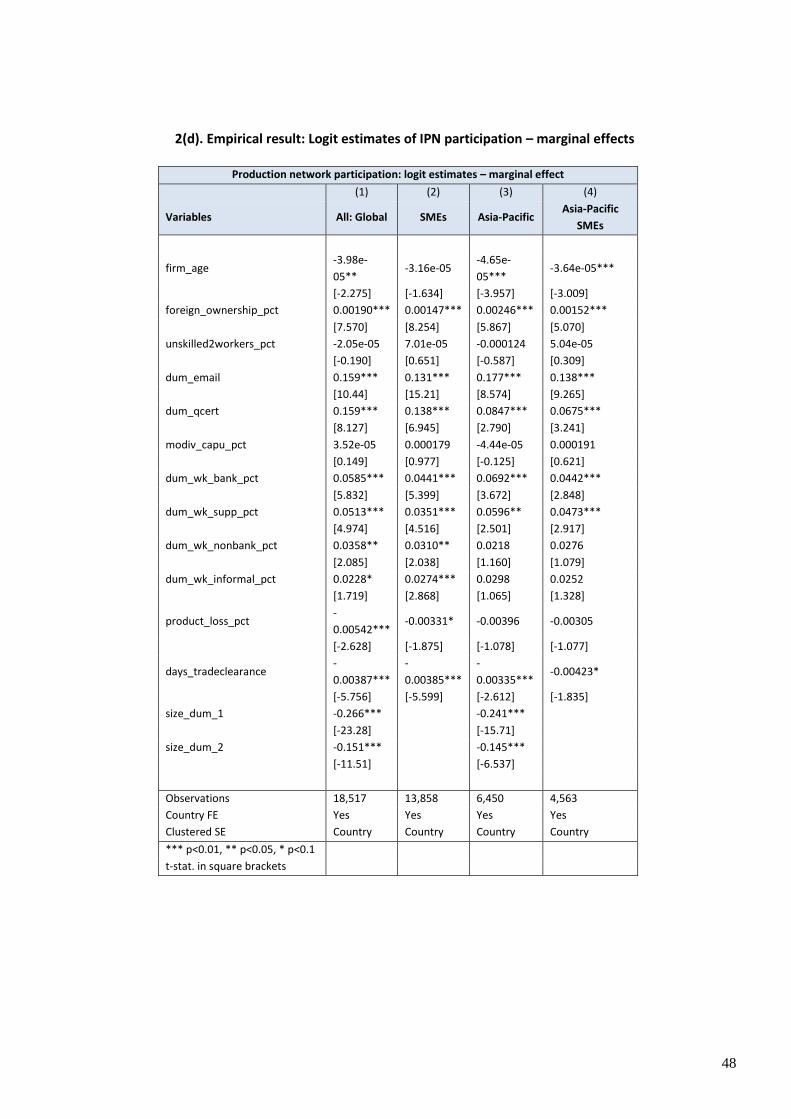
When considering the global dataset of SMEs (model 2), the importance of access to, and use of modern
information and communications technology as well as international quality certification are found to be the key
indicators to SME participation in exporting. Use of e-mail and international quality certification have the highest
marginal effects of any other explanatory variables included in the models, with firms that either use e-mail or
are certified being found at least 8 per cent more likely to be involved in exporting or IPN. The importance of
modern information technology appears to be particularly crucial to participation in IPNs (as opposed to only
direct exports), as the model suggests that firms using e-mail are 13 per cent more likely to be involved in such
networks.
The results also confirm the importance of access to finance. Having access to formal external sources of
working capital was also found to increase the probability of export participation on average for the global
dataset, depending on the types of financing. Supply chain financing (supplier credit) was found to be highly
significant, increasing the probability of SMEs participation in direct exporting and IPN participation probability by
2 per cent and 3.5 per cent, respectively. Non-bank financial institution credit is significant, both for SME direct
exporting and IPN, and increases the probability of participation by 1.8 per cent and 3.1 per cent, respectively.
Bank financing increases the probability of SME participation in direct export and IPN by 2.1 per cent and 4.4 per
cent, respectively.22 The results also highlight the importance of access to informal sources of financing (e.g.,
from family and friends), with those SMEs having such access being up to 2.7 per cent more likely to participate in
IPNs – although apparently through indirect exports.
Logistics infrastructure and trade facilitation are found to be important factors affecting SME
participation in export, with a 1 percent increase in product loss during transit (a proxy for quality of
infrastructure) reducing the likelihood that a firm would participate in direct export by approximately 0.3
percent. A one day increase in the time taken to complete customs and related clearance processes also reduces
the likelihood that a firm would participate in either direct export or IPNs by approximately 0.4 percent.
19 See full paper annex for descriptive statistics of variables. The full working paper is available at
www.unescap.org/sites/default/files/Staff%20Working%20Paper%2003-14_1.pdf. 20
Evaluation of marginal effects of explanatory variables is calculated at their means, i.e., they show how the dependent variable (e.g.,
direct export participation) changes as a result of a change of one given explanatory variable by one unit, holding all other variables at
their average values. 21
For more information on data stratification, see www.enterprisesurveys.org//Methodology. 22
All three formal sources of credit are significant when firms of all sizes are considered (model 1).

40
Table 3 .Variable description and expected sign
Variable Unit Expected
signs
Source Description
exporting_status - Author’s calculation
based on ESD23
Dummy variable indicating 1 if a firm
participates in direct exporting; 0 otherwise.
pn_exporting_status - Author’s calculation
based on ESD
Dummy variable indicating 1 if a firm
participates in IPN24
; 0 otherwise.
firm_age Year ? Author’s calculation
based on ESD
Age of a firm from its establishment to the year
of survey.
foreign_ownership_pct % + ESD Percentage of foreign ownership.
unskilled2workers_pct % - Author’s calculation
based on ESD
Percentage of unskilled labour to total labour.
dum_email - + Author’s calculation
based on ESD
Dummy variable indicating 1 if a firm uses e-
mail to communicate with clients/suppliers; 0
otherwise.
dum_qcert - + Author’s calculation
based on ESD
Dummy variable indicating 1 if a firm obtains
internationally-recognized quality certification;
0 otherwise
capu_pct % + Author’s calculation
based on ESD
Capacity utilization.
dum_wk_bank_pct - + Author’s calculation
based on ESD
Dummy variable indicating 1 if a firm has
working capital financed by banks; 0 otherwise.
dum_wk_supp_pct - + Author’s calculation
based on ESD
Dummy variable indicating 1 if a firm has
working capital financed by supplier credit; 0
otherwise.
dum_wk_nonbank_pct - + Author’s calculation
based on ESD
Dummy variable indicating 1 if a firm has
working capital financed by non-bank financial
institutions; 0 otherwise.
dum_wk_informal_pct - + Author’s calculation
based on ESD
Dummy variable indicating 1 if a firm has
working capital financed by informal sectors
(e.g., Moneylenders, friends, relatives); 0
otherwise.
product_loss_pct % - ESD Percentage of products shipped to supply
domestic markets lost due to breakage or
spoilage.
days_tradeclearance Day - Author’s calculation
based on ESD
Average number of days to clear imports
and/or exports from customs; the country-
average is used if firm-specific data are
missing.
23 ESD: Enterprise Survey Data. Available online at www.enterprisesurveys.org/.
24 Indication of a firm participating in a production network is when a firm participates in either direct or indirect exports or both, i.e., the
sum of direct and indirect exports is greater than zero.

41
Foreign ownership was found to be statistically significant but its marginal effect on export participation
was small. Other characteristics, such as firm age, the percentage of unskilled workers or capacity utilization,
were generally not found to be significant in affecting SME participation in either direct or indirect exporting.
In comparing the marginal effects of the model estimates using firms of all sizes (model 1 and 3) rather
than only SMEs (model 2 and 4), the time to complete customs and trade procedures was found to have a
stronger effect on SME export participation than on large firms, providing further evidence of the importance of
trade facilitation for SMEs.
In considering the estimates obtained using the Asia-Pacific SME dataset (model 4) as opposed to the
Global SME dataset (model 2), the results remain broadly the same as those found for SMEs in developing
countries globally. However, a few differences exist. The most striking one is the fact that the marginal effect of
supplier credit on SME direct export participation is approximately twice that of the marginal effect of bank
financing in Asia and the Pacific (3.2 per cent vs. 1.6 per cent), highlighting the importance of supply chain
financing for the region. Access to informal finance was not found to be a significant determinant of either direct
exporting or IPN participation for Asia-Pacific SMEs. The importance of international quality certification is
relatively less important for Asia-Pacific SMEs, although it remains very significant. Finally, foreign ownership has
a significant and positive, albeit minor, effect on export participation by Asia-Pacific SMEs.25
D. Conclusion and policy recommendations
The objective of this study was to identify key firm characteristics as well as external factors affecting
SME participation in direct exporting and IPNs. Enterprise level data from developing countries were analysed to
identify the main obstacles to establishment and operation of direct and indirect small and medium-sized
exporters. Models of SME exports and IPN participation were estimated, revealing the importance of several
trade facilitation- and trade- related factors. Use of modern information and communication technology was
found to be the most important factor in increasing the probability of participation by SMEs, both in direct
exports and in IPNs, followed by international quality certification and access to finance. Poor logistic
infrastructures as well as delays in customs and trade clearance were also found to significantly affect SME
participation, both in direct and indirect exporting.
Looking specifically at Asia-Pacific SMEs, the analysis further highlighted the importance of supply chain
financing in enabling SME participation in exports in that region, relative to other financing methods. In addition,
comparing the marginal effects of various factors on SMEs and LEs, a reduction in customs and trade clearance
times was found to increase the likelihood of participation by SMEs in exports or IPNs relatively greater than that
of LEs.
With the aim of fostering more inclusive and sustainable development in the Asia-Pacific region, the
following three main policy recommendations for developing national Governments and development partners
can be drawn from the results of this study:
25 The robustness of the results was checked by re-estimating the models by alternatively dropping each of the factors, including trade
clearance time. The results were found to be robust and still held both in the direct export and the IPN models. The results can be
provided upon request.

42
(a) Given the importance of ICT in enabling participation of SMEs in trade, prioritize efforts to provide
affordable access to the Internet and related services, including building the capacity of SMEs and
individuals in using the services;
(b) Noting that (i) supplier credit was found to be at least as important an enabler of SME participation in
exporting as is bank financing, and (ii) access to finance remains a key obstacle to SME development,
encourage the further development of supply chain finance in partnership with the private sector in
addition to the more traditional bank and non-bank financial services;
(c) Recognizing that the streamlining of customs and trade procedures was found to be of particular
benefits to SMEs, actively seek to simplify and increase transparency of the business environment in
general, and trade procedures in particular, including through – but not limited to – implementation
of measures included in the WTO trade facilitation agreements.
43
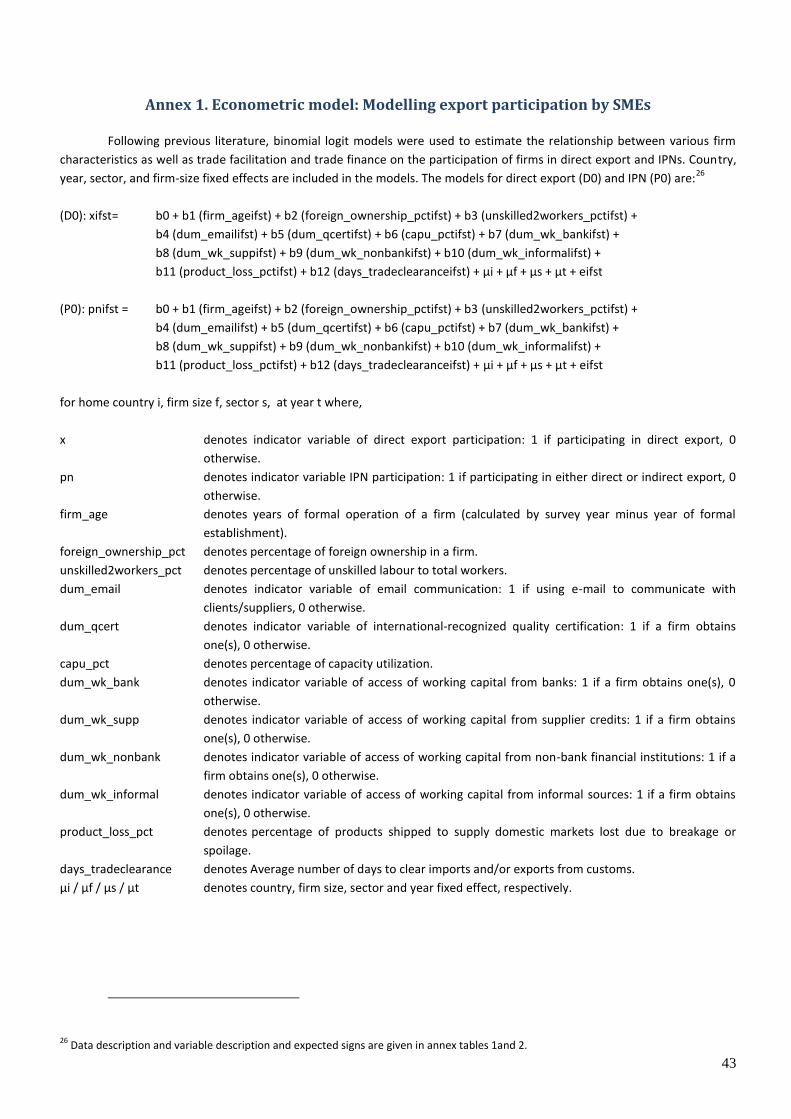
Annex 1. Econometric model: Modelling export participation by SMEs
Following previous literature, binomial logit models were used to estimate the relationship between various firm
characteristics as well as trade facilitation and trade finance on the participation of firms in direct export and IPNs. Country,
year, sector, and firm-size fixed effects are included in the models. The models for direct export (D0) and IPN (P0) are:26
(D0): xifst= b0 + b1 (firm_ageifst) + b2 (foreign_ownership_pctifst) + b3 (unskilled2workers_pctifst) +
b4 (dum_emailifst) + b5 (dum_qcertifst) + b6 (capu_pctifst) + b7 (dum_wk_bankifst) +
b8 (dum_wk_suppifst) + b9 (dum_wk_nonbankifst) + b10 (dum_wk_informalifst) +
b11 (product_loss_pctifst) + b12 (days_tradeclearanceifst) + µi + µf + µs + µt + eifst
(P0): pnifst = b0 + b1 (firm_ageifst) + b2 (foreign_ownership_pctifst) + b3 (unskilled2workers_pctifst) +
b4 (dum_emailifst) + b5 (dum_qcertifst) + b6 (capu_pctifst) + b7 (dum_wk_bankifst) +
b8 (dum_wk_suppifst) + b9 (dum_wk_nonbankifst) + b10 (dum_wk_informalifst) +
b11 (product_loss_pctifst) + b12 (days_tradeclearanceifst) + µi + µf + µs + µt + eifst
for home country i, firm size f, sector s, at year t where,
x denotes indicator variable of direct export participation: 1 if participating in direct export, 0
otherwise.
pn denotes indicator variable IPN participation: 1 if participating in either direct or indirect export, 0
otherwise.
firm_age denotes years of formal operation of a firm (calculated by survey year minus year of formal
establishment).
foreign_ownership_pct denotes percentage of foreign ownership in a firm.
unskilled2workers_pct denotes percentage of unskilled labour to total workers.
dum_email denotes indicator variable of email communication: 1 if using e-mail to communicate with
clients/suppliers, 0 otherwise.
dum_qcert denotes indicator variable of international-recognized quality certification: 1 if a firm obtains
one(s), 0 otherwise.
capu_pct denotes percentage of capacity utilization.
dum_wk_bank denotes indicator variable of access of working capital from banks: 1 if a firm obtains one(s), 0
otherwise.
dum_wk_supp denotes indicator variable of access of working capital from supplier credits: 1 if a firm obtains
one(s), 0 otherwise.
dum_wk_nonbank denotes indicator variable of access of working capital from non-bank financial institutions: 1 if a
firm obtains one(s), 0 otherwise.
dum_wk_informal denotes indicator variable of access of working capital from informal sources: 1 if a firm obtains
one(s), 0 otherwise.
product_loss_pct denotes percentage of products shipped to supply domestic markets lost due to breakage or
spoilage.
days_tradeclearance denotes Average number of days to clear imports and/or exports from customs.
µi / µf / µs / µt denotes country, firm size, sector and year fixed effect, respectively.
26 Data description and variable description and expected signs are given in annex tables 1and 2.
44
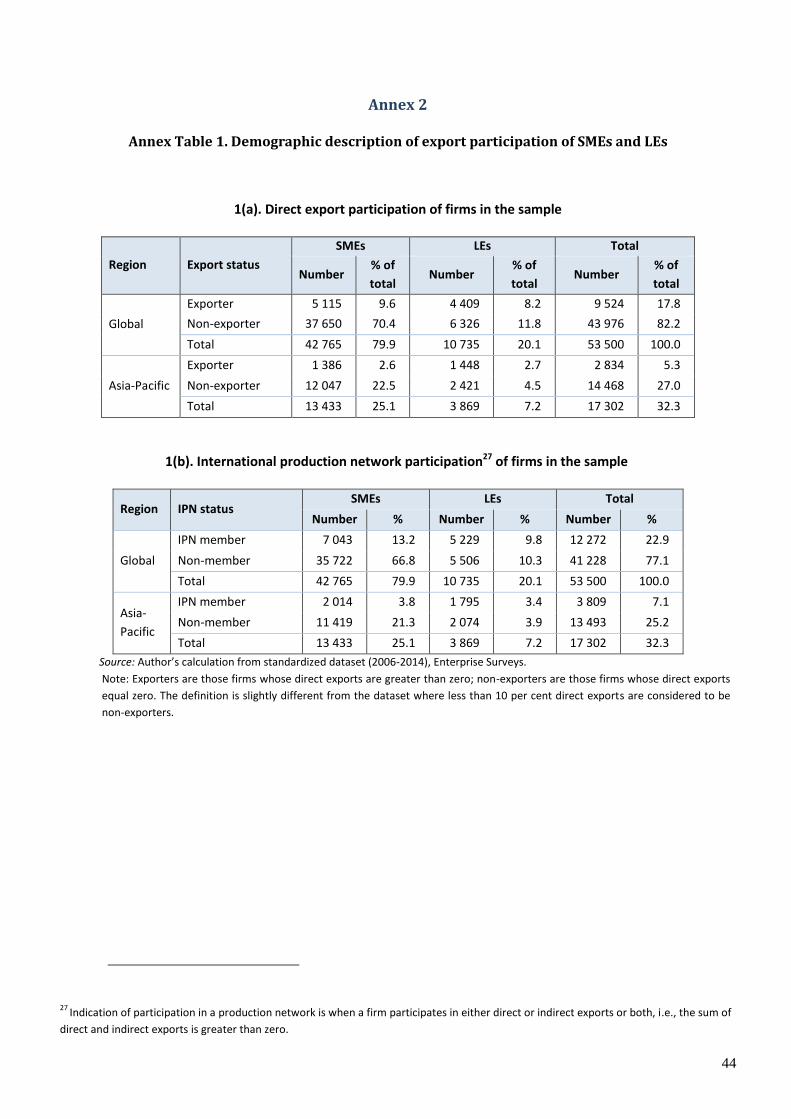
Annex 2
Annex Table 1. Demographic description of export participation of SMEs and LEs
1(a). Direct export participation of firms in the sample
Region Export status
SMEs LEs Total
Number % of
total Number
% of
total Number
% of
total
Global
Exporter 5 115 9.6 4 409 8.2 9 524 17.8
Non-exporter 37 650 70.4 6 326 11.8 43 976 82.2
Total 42 765 79.9 10 735 20.1 53 500 100.0
Asia-Pacific
Exporter 1 386 2.6 1 448 2.7 2 834 5.3
Non-exporter 12 047 22.5 2 421 4.5 14 468 27.0
Total 13 433 25.1 3 869 7.2 17 302 32.3
1(b). International production network participation27 of firms in the sample
Region IPN status SMEs LEs Total
Number % Number % Number %
Global
IPN member 7 043 13.2 5 229 9.8 12 272 22.9
Non-member 35 722 66.8 5 506 10.3 41 228 77.1
Total 42 765 79.9 10 735 20.1 53 500 100.0
Asia-
Pacific
IPN member 2 014 3.8 1 795 3.4 3 809 7.1
Non-member 11 419 21.3 2 074 3.9 13 493 25.2
Total 13 433 25.1 3 869 7.2 17 302 32.3
Source: Author’s calculation from standardized dataset (2006-2014), Enterprise Surveys.
Note: Exporters are those firms whose direct exports are greater than zero; non-exporters are those firms whose direct exports
equal zero. The definition is slightly different from the dataset where less than 10 per cent direct exports are considered to be
non-exporters.
27 Indication of participation in a production network is when a firm participates in either direct or indirect exports or both, i.e., the sum of
direct and indirect exports is greater than zero.
45
Annex Table 2
2(a). Empirical result: Logit estimates of direct export participation
(1) (2) (3) (4)
Variables All: Global SMEs Asia-Pacific Asia-Pacific
SMEs
firm_age -0.000245* -0.000146 -0.000204 -0.000138
[-1.894] [-0.829] [-1.571] [-0.738]
foreign_ownership_pct 0.0113*** 0.0135*** 0.0159*** 0.0159***
[7.814] [8.280] [9.592] [7.278]
unskilled2workers_pct 0.000602 0.00144 3.14e-05 0.00159
[0.701] [1.498] [0.0113] [0.565]
dum_email 1.413*** 1.711*** 1.540*** 1.844***
[7.933] [11.70] [5.248] [7.565]
dum_qcert 0.890*** 1.050*** 0.559*** 0.677***
[9.852] [9.345] [3.227] [4.351]
modiv_capu_pct 0.000503 0.00221 0.000872 0.00358
[0.408] [1.595] [0.504] [1.537]
dum_wk_bank_pct 0.323*** 0.319*** 0.349*** 0.277***
[7.314] [5.135] [6.207] [2.782]
dum_wk_supp_pct 0.356*** 0.325*** 0.524*** 0.508***
[4.927] [3.674] [3.505] [2.735]
dum_wk_nonbank_pct 0.261*** 0.268*** 0.254 0.372**
[2.816] [2.768] [1.058] [2.025]
dum_wk_informal_pct 0.0766 0.168* 0.0207 -0.0306
[0.911] [1.846] [0.137] [-0.221]
product_loss_pct -0.0479*** -0.0537*** -0.0728** -0.106**
[-3.702] [-2.651] [-2.231] [-2.561]
days_tradeclearance -0.0353*** -0.0658*** -0.0283*** -0.0649*
[-6.807] [-5.198] [-2.873] [-1.668]
size_dum_1 -1.959*** -1.941***
[-18.76] [-13.13]
size_dum_2 -1.093*** -1.111***
[-12.89] [-7.796]
Constant -2.367*** -4.594*** -3.834*** -3.483***
[-9.008] [-13.64] [-3.921] [-4.775]
Observations 18,517 13,858 6,382 4,490
Country FE Yes Yes Yes Yes
Clustered SE Country Country Country Country
Pseudo R-squared 0.307 0.223 0.269 0.167
*** p<0.01, ** p<0.05, * p<0.1
t-stat. in square brackets
46
2(b). Empirical result: Logit estimates of IPN participation
Production network participation – logit estimates
(1) (2) (3) (4)
All: Global SMEs Asia-Pacific Asia-Pacific
SMEs
firm_age -
0.000239**
-
0.000276*
-
0.000291*** -0.000340***
[-2.281] [-1.647] [-3.855] [-3.130]
foreign_ownership_pct 0.0114*** 0.0129*** 0.0154*** 0.0142***
[7.824] [8.285] [6.394] [5.212]
unskilled2workers_pct -0.000123 0.000613 -0.000776 0.000470
[-0.190] [0.649] [-0.587] [0.308]
dum_email 1.106*** 1.280*** 1.292*** 1.399***
[7.968] [12.27] [5.763] [7.498]
dum_qcert 0.859*** 0.962*** 0.504*** 0.558***
[8.469] [8.045] [2.759] [3.505]
modiv_capu_pct 0.000212 0.00156 -0.000278 0.00178
[0.149] [0.980] [-0.125] [0.623]
dum_wk_bank_pct 0.340*** 0.363*** 0.413*** 0.384***
[6.073] [5.724] [4.095] [3.092]
dum_wk_supp_pct 0.304*** 0.301*** 0.349*** 0.400***
[5.056] [4.571] [2.688] [3.130]
dum_wk_nonbank_pct 0.204** 0.250** 0.131 0.237
[2.194] [2.210] [1.195] [1.182]
dum_wk_informal_pct 0.133* 0.224*** 0.178 0.219
[1.786] [3.068] [1.128] [1.447]
product_loss_pct -0.0326*** -0.0289* -0.0248 -0.0284
[-2.609] [-1.866] [-1.062] [-1.065]
days_tradeclearance -0.0233*** -
0.0337*** -0.0210*** -0.0395*
[-5.755] [-5.477] [-2.623] [-1.821]
size_dum_1 -1.805*** -1.880***
[-18.27] [-9.953]
size_dum_2 -0.977*** -0.950***
[-9.874] [-5.428]
Constant -1.574*** -3.526*** -2.512*** -3.771***
[-5.860] [-10.05] [-3.435] [-2.812]
18,517 13,858 6,450 4,563
Yes Yes Yes Yes
Country Country Country Country
0.277 0.184 0.250 0.139
***p<0.01; **p<0.05; *p<0.1.
t-stat. in square brackets.

47
2(c). Empirical result: Logit estimates of direct export participation – marginal effects
Direct export participation: logit estimates – marginal effect
(1) (2) (3) (4)
Variables All: Global SMEs Asia-Pacific Asia-Pacific SMEs
firm_age -2.64e-05* -8.94e-06 -2.07e-05 -7.47e-06
[-1.882] [-0.822] [-1.543] [-0.720]
foreign_ownership_pct 0.00122*** 0.000829*** 0.00161*** 0.000864***
[7.121] [7.839] [6.480] [5.228]
unskilled2workers_pct 6.48e-05 8.83e-05 3.18e-06 8.61e-05
[0.703] [1.513] [0.0113] [0.576]
dum_email 0.124*** 0.0912*** 0.127*** 0.0914***
[12.32] [16.13] [10.90] [9.421]
dum_qcert 0.112*** 0.0884*** 0.0611*** 0.0439***
[9.618] [7.355] [3.673] [4.052]
modiv_capu_pct 5.42e-05 0.000135 8.85e-05 0.000194
[0.408] [1.588] [0.501] [1.486]
dum_wk_bank_pct 0.0363*** 0.0208*** 0.0373*** 0.0160**
[6.948] [4.840] [5.212] [2.488]
dum_wk_supp_pct 0.0393*** 0.0204*** 0.0608*** 0.0321***
[4.745] [3.584] [3.113] [2.613]
dum_wk_nonbank_pct 0.0308*** 0.0183** 0.0282 0.0235*
[2.611] [2.480] [1.007] [1.771]
dum_wk_informal_pct 0.00845 0.0109* 0.00212 -0.00164
[0.887] [1.740] [0.136] [-0.226]
product_loss_pct -
0.00516*** -0.00329*** -0.00738** -0.00577***
[-3.765] [-2.664] [-2.456] [-2.919]
days_tradeclearance -
0.00380*** -0.00403***
-
0.00287*** -0.00352*
[-6.745] [-5.520] [-2.851] [-1.769]
size_dum_1 -0.188*** -0.154***
[-21.89] [-12.58]
size_dum_2 -0.108*** -0.107***
[-17.31] [-12.80]
Observations 18,517 13,858 6,382 4,490
Country FE Yes Yes Yes Yes
Clustered SE Country Country Country Country
***p<0.01; **p<0.05; *p<0.1.
t-stat. in square brackets.
48
2(d). Empirical result: Logit estimates of IPN participation – marginal effects
Production network participation: logit estimates – marginal effect
(1) (2) (3) (4)
Variables All: Global SMEs Asia-Pacific Asia-Pacific
SMEs
firm_age -3.98e-
05** -3.16e-05
-4.65e-
05*** -3.64e-05***
[-2.275] [-1.634] [-3.957] [-3.009]
foreign_ownership_pct 0.00190*** 0.00147*** 0.00246*** 0.00152***
[7.570] [8.254] [5.867] [5.070]
unskilled2workers_pct -2.05e-05 7.01e-05 -0.000124 5.04e-05
[-0.190] [0.651] [-0.587] [0.309]
dum_email 0.159*** 0.131*** 0.177*** 0.138***
[10.44] [15.21] [8.574] [9.265]
dum_qcert 0.159*** 0.138*** 0.0847*** 0.0675***
[8.127] [6.945] [2.790] [3.241]
modiv_capu_pct 3.52e-05 0.000179 -4.44e-05 0.000191
[0.149] [0.977] [-0.125] [0.621]
dum_wk_bank_pct 0.0585*** 0.0441*** 0.0692*** 0.0442***
[5.832] [5.399] [3.672] [2.848]
dum_wk_supp_pct 0.0513*** 0.0351*** 0.0596** 0.0473***
[4.974] [4.516] [2.501] [2.917]
dum_wk_nonbank_pct 0.0358** 0.0310** 0.0218 0.0276
[2.085] [2.038] [1.160] [1.079]
dum_wk_informal_pct 0.0228* 0.0274*** 0.0298 0.0252
[1.719] [2.868] [1.065] [1.328]
product_loss_pct -
0.00542*** -0.00331* -0.00396 -0.00305
[-2.628] [-1.875] [-1.078] [-1.077]
days_tradeclearance -
0.00387***
-
0.00385***
-
0.00335*** -0.00423*
[-5.756] [-5.599] [-2.612] [-1.835]
size_dum_1 -0.266*** -0.241***
[-23.28] [-15.71]
size_dum_2 -0.151*** -0.145***
[-11.51] [-6.537]
Observations 18,517 13,858 6,450 4,563
Country FE Yes Yes Yes Yes
Clustered SE Country Country Country Country
*** p<0.01, ** p<0.05, * p<0.1
t-stat. in square brackets