chapter-i - inflibnetshodhganga.inflibnet.ac.in/bitstream/10603/33340/2/chapter-i-hplc... · liquid...
TRANSCRIPT

Chapter-I
1
1.1 INTRODUCTION TO CHROMATOGRAPY
Liquid chromatography (1-2) was defined in the early 1900s by the work
of the Russian botanist, Mikhail S. Tswett. His pioneering studies focused on
separating compounds [leaf pigments], extracted from plants using a solvent, in
a column packed with particles.
Tswett filled an open glass column with particles. Two specific materials
that he found useful were powdered chalk [calcium carbonate] and alumina. He
poured his sample [solvent extract of homogenized plant leaves] into the
column and allowed it to pass into the particle bed. This was followed by pure
solvent. As the sample passed down through the column by gravity, different
colored bands could be seen separating because some components were
moving faster than others. He related these separated, different-colored bands
to the different compounds that were originally contained in the sample (3-4). He
had created an analytical separation of these compounds based on the differing
strength of each compound’s chemical attraction to the particles. The
compounds that were more strongly attracted to the particles slowed down,
while other compounds more strongly attracted to the solvent moved faster.
This process can be described as follows: the compounds contained in the
sample distribute, or partition differently between the moving solvent, called
the mobile phase, and the particles, called the stationary phase. This causes
each compound to move at a different speed, thus creating a separation of the
compounds (5).
Tswett(6) (Figure-I.1) coined the name chromatography(7) [from the
Greek words chroma, meaning color, and graph, meaning writing—literally,
color writing] to describe his colorful experiment. [Curiously, the Russian name
Tswett means color.] Today, liquid chromatography, in its various forms, has
become one of the most powerful tools in analytical chemistry.

Chapter-I
2
Figure-I.1: Tswett's Experiment
1.1.1. Liquid Chromatography (LC) Techniques
Liquid chromatography can be performed using planar or column
techniques. Column liquid chromatography is the most powerful and has the
highest capacity for sample. In all cases, the sample first must be dissolved in a
liquid that is then transported either onto, or into, the chromatographic device.
1.1.2. Thin Layer Chromatography:
The sample is spotted onto, and then flows through, a thin layer of
chromatographic particles (8-10) [stationary phase] fixed onto the surface of a
glass plate [Figure I.2]. The bottom edge of the plate is placed in a solvent. Flow
is created by capillary action as the solvent [mobile phase] diffuses into the dry
particle layer and moves up the glass plate. This technique is called thin-layer
chromatography or TLC (11-13).
Note that the black sample is a mixture of FD&C yellow, red and blue
food dyes that has been chromatographically separated (14-15).
1.1.3. Paper Chromatography:
In Figure I.3, samples are spotted onto paper [stationary phase]. Solvent
[mobile phase] is then added to the center of the spot to create an outward
radial flow. This is a form of paper chromatography. [Classic paper
chromatography is performed in a manner similar to that of TLC with linear

Chapter-I
3
flow.] In the upper image, the same black FD&C dye sample is applied to the
paper.
Figure-I.2: Thin-layer Chromatography
Figure-I.3: Paper Chromatography
Notice the difference in separation power for this particular paper when
compared to the TLC plate. The green ring indicates that the paper cannot
separate the yellow and blue dyes from each other, but it could separate those

Chapter-I
4
dyes from the red dyes. In the bottom image, a green sample, made up of the
same yellow and blue dyes, is applied to the paper. As you would predict, the
paper cannot separate the two dyes. In the middle, a purple sample, made up of
red and blue dyes, was applied to the paper. They are well separated.
1.1.4. Column Chromatography:
In this, the most powerful approach, the sample passes through a
column or a cartridge device containing appropriate particles (16) [stationary
phase]. These particles are called the chromatographic packing material.
Solvent [mobile phase] flows through the device (Figure-I.4). In solid-phase
extraction [SPE], the sample is loaded onto the cartridge and the solvent stream
carries the sample through the device. As in Tswett’s experiment, the
compounds in the sample are then separated by traveling at different
individual speeds through the device. Here the black sample is loaded onto a
cartridge. Different solvents are used in each step to create the separation (17-
18).
Figure-I.4: Column Chromatography – Solid-Phase Extraction [SPE]
When the cartridge format is utilized, there are several ways to achieve
flow. Gravity or vacuum can be used for columns that are not designed to

Chapter-I
5
withstand pressure. Typically, the particles in this case are larger in diameter [>
50 microns] so that there is less resistance to flow. Open glass columns
[Tswett’s experiment] are an example of this. In addition, small plastic columns,
typically in the shape of syringe barrels, can be filled with packing-material
particles and used to perform sample preparation. This is called solid-phase
extraction [SPE]. Here, the chromatographic device, called a cartridge, is used,
usually with vacuum-assisted flow, to clean up a very complex sample before it
is analyzed further.
Smaller particle sizes [<10 microns] are required to improve separation
power. However, smaller particles have greater resistance to flow, so higher
pressures are needed to create the desired solvent flow rate. Pumps and
columns designed to withstand high pressure are necessary. When moderate to
high pressure is used to flow the solvent through the chromatographic column,
the technique is called HPLC.
1.2 HIGH PERFORMANCE LIQUID CHROMATOGRAPHY (HPLC)
The acronym HPLC, coined by the late Prof. Csaba Horváth for his 1970
Pittcon paper, originally indicated the fact that high pressure was used to
generate the flow required for liquid chromatography in packed columns
(Figure-I.5). In the beginning, pumps only had a pressure capability of 500 psi
[35 bar]. This was called high pressure liquid chromatography, or HPLC (19-20).
The early 1970s saw a tremendous leap in technology. These new HPLC
instruments could develop up to 6,000 psi [400 bar] of pressure, and
incorporated improved injectors, detectors, and columns. HPLC really began to
take hold in the mid-to late-1970s. With continued advances in performance
during this time [smaller particles, even higher pressure], the acronym HPLC
remained the same, but the name was changed to high performance liquid
chromatography (21).
High performance liquid chromatography is now one of the most
powerful tools in analytical chemistry. It has the ability to separate, identify,
and quantitate the compounds that are present in any sample that can be

Chapter-I
6
dissolved in a liquid. Today, compounds in trace concentrations as low as parts
per trillion [ppt] may easily be identified. HPLC can be, and has been, applied to
just about any sample, such as pharmaceuticals, food, nutraceuticals, cosmetics,
environmental matrices, forensic samples, and industrial chemicals (22-23).
Figure-I.5: HPLC Column
The components of a basic high-performance liquid chromatography
[HPLC] system are shown in the simple diagram in Figure I.6.
A reservoir holds the solvent [called the mobile phase, because it
moves]. A high-pressure pump [solvent delivery system or solvent manager] is
used to generate and meter a specified flow rate of mobile phase, typically
milliliters per minute. An injector [sample manager or auto sampler] is able to
introduce [inject] the sample into the continuously flowing mobile phase
stream that carries the sample into the HPLC column. The column contains the
chromatographic packing material needed to effect the separation. This packing
material is called the stationary phase because it is held in place by the column
hardware. A detector is needed to see the separated compound bands as they
elute from the HPLC column [most compounds have no color, so we cannot see
them with our eyes]. The mobile phase exits the detector and can be sent to
waste, or collected, as desired. When the mobile phase contains a separated
compound band, HPLC provides the ability to collect this fraction of the eluate
containing that purified compound for further study. This is called preparative
chromatography [discussed in the section on HPLC Scale].
Note that high-pressure tubing and fittings are used to interconnect the
pump, injector, column, and detector components to form the conduit for the
mobile phase, sample, and separated compound bands.

Chapter-I
7
Figure-I.6: High-Performance Liquid Chromatography [HPLC] System
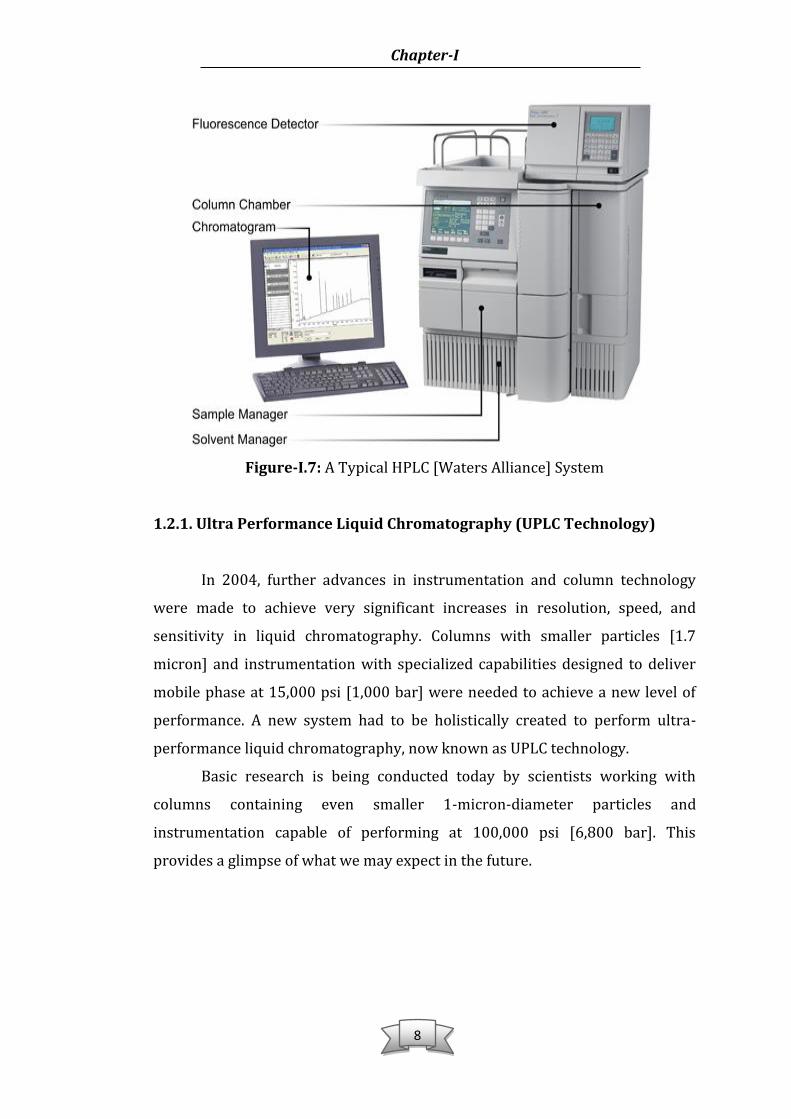
The detector is wired to the computer data station, the HPLC system
component that records the electrical signal needed to generate the
chromatogram on its display and to identify and quantitate the concentration of
the sample constituents (Figure I.7). Since sample compound characteristics
can be very different, several types of detectors have been developed. For
example, if a compound can absorb ultraviolet light, a UV-absorbance detector
is used. If the compound fluoresces, a fluorescence detector is used. If the
compound does not have either of these characteristics, a more universal type
of detector is used, such as an evaporative-light-scattering detector [ELSD]. The
most powerful approach is the use multiple detectors in series. For example, a
UV and/or ELSD detector may be used in combination with a mass
spectrometer [MS] to analyze the results of the chromatographic separation.
This provides, from a single injection, more comprehensive information about
an analyte. The practice of coupling a mass spectrometer to an HPLC system is
called LC/MS.
Chapter-I
8
Figure-I.7: A Typical HPLC [Waters Alliance] System
1.2.1. Ultra Performance Liquid Chromatography (UPLC Technology)
In 2004, further advances in instrumentation and column technology
were made to achieve very significant increases in resolution, speed, and
sensitivity in liquid chromatography. Columns with smaller particles [1.7
micron] and instrumentation with specialized capabilities designed to deliver
mobile phase at 15,000 psi [1,000 bar] were needed to achieve a new level of
performance. A new system had to be holistically created to perform ultra-
performance liquid chromatography, now known as UPLC technology.
Basic research is being conducted today by scientists working with
columns containing even smaller 1-micron-diameter particles and
instrumentation capable of performing at 100,000 psi [6,800 bar]. This
provides a glimpse of what we may expect in the future.

Chapter-I
9
1.2.2. HPLC Operation
A simple way to understand how we achieve the separation of the
compounds contained in a sample is to view the diagram in Figure G.
Mobile phase enters the column from the left, passes through the
particle bed, and exits at the right. Flow direction is represented by green
arrows (Figure: I.8) represents the column at time zero [the moment of
injection], when the sample enters the column and begins to form a band. The
sample shown here, a mixture of yellow, red, and blue dyes, appears at the inlet
of the column as a single black band. [In reality, this sample could be anything
that can be dissolved in a solvent; typically the compounds would be colorless
and the column wall opaque, so we would need a detector to see the separated
compounds as they elute.]
1.2.3. HPLC column:
After a few minutes [lower image], during which mobile phase flows
continuously and steadily past the packing material particles, we can see that
the individual dyes have moved in separate bands at different speeds (24-26). This
is because there is a competition between the mobile phase and the stationary
phase for attracting each of the dyes or analytes. Notice that the yellow dye
band moves the fastest and is about to exit the column. The yellow dye likes [is
attracted to] the mobile phase more than the other dyes. Therefore, it moves at
a faster speed, closer to that of the mobile phase (27-28). The blue dye band likes
the packing material more than the mobile phase. Its stronger attraction to the
particles causes it to move significantly slower. In other words, it is the most
retained compound in this sample mixture. The red dye band has an
intermediate attraction for the mobile phase and therefore moves at an
intermediate speed through the column. Since each dye band moves at different
speed, we are able to separate it chromatographically.

Chapter-I
10
Figure-I.8: Understanding How a Chromatographic Column Works – Bands
A column tube and fittings must contain the chromatographic packing
material [stationary phase] that is used to effect a separation. It must withstand
backpressure created both during manufacture and in use. Also, it must provide
a well-controlled [leak-free, minimum-volume, and zero-dead-volume] flow
path for the sample at its inlet, and analyte bands at its outlet, and be
chemically inert relative to the separation system [sample, mobile, and
stationary phases]. Most columns are constructed of stainless steel for highest
pressure resistance. PEEK™ [an engineered plastic] and glass, while less
pressure tolerant, may be used when inert surfaces are required for special
chemical or biological applications. [Figure I.8].
Figure-I.9: Column Hardware Examples

Chapter-I
11
A glass column wall offers a visual advantage. In the photo in
Figure I.9 & 10, flow has been stopped while the sample bands are still in the
column (29-30). You can see that the three dyes in the injected sample mixture
have already separated in the bed; the yellow analyte, traveling fastest, is just
about to exit the column.
Figure-I.10: A Look Inside a Column
1.2.4. Detectors:
As the separated dye bands leave the column, they pass immediately
into the detector (31-32). The detector contains a flow cell that sees [detects] each
separated compound band against a background of mobile phase [Figure I.11
&12]. [In reality, solutions of many compounds at typical HPLC analytical
concentrations are colorless.] An appropriate detector has the ability to sense
the presence of a compound and send its corresponding electrical signal to a
computer data station (33-34). A choice is made among many different types of
detectors, depending upon the characteristics and concentrations of the
compounds that need to be separated and analyzed, as discussed earlier (35).
Spectroscopic Detection Ultraviolet (UV) Absorption
An ultraviolet light beam is directed through a flow cell and a sensor
measures the light passing through the cell.
If a compound elutes from the column that absorbs this light energy, it will
change the amount of light energy falling on the sensor.
The resulting change in this electrical signal is amplified and directed to a
recorder or data system.
A UV spectrum is sometimes also obtained which may aid in the
identification of a compound or series of compounds.

Chapter-I
12
Figure-I.11: Variable Wavelength Detector
Figure-I.12: Diode Array Detector
1.2.5. Chromatogram
A chromatogram is a representation of the separation that has
chemically [chromatographically] occurred in the HPLC system. A series of
peaks rising from a baseline is drawn on a time axis. Each peak represents the

Chapter-I
13
detector response for a different compound. The chromatogram is plotted by
the computer data station [Figure I.13].
Figure-I.13: How Peaks Are Created
In Figure H, the yellow band has completely passed through the detector
flow cell; the electrical signal generated has been sent to the computer data
station. The resulting chromatogram has begun to appear on screen. Note that
the chromatogram begins when the sample was first injected and starts as a
straight line set near the bottom of the screen. This is called the baseline; it
represents pure mobile phase passing through the flow cell over time. As the
yellow analyte band passes through the flow cell, a stronger signal is sent to the
computer. The line curves, first upward, and then downward, in proportion to
the concentration of the yellow dye in the sample band. This creates a peak in
the chromatogram. After the yellow band passes completely out of the detector
cell, the signal level returns to the baseline; the flow cell now has, once again,
only pure mobile phase in it. Since the yellow band moves fastest, eluting first
from the column, it is the first peak drawn.
A little while later, the red band reaches the flow cell. The signal rises up
from the baseline as the red band first enters the cell, and the peak
representing the red band begins to be drawn. In this diagram, the red band has
not fully passed through the flow cell. The diagram shows what the red band
and red peak would look like if we stopped the process at this moment. Since

Chapter-I
14
most of the red band has passed through the cell, most of the peak has been
drawn, as shown by the solid line. If we could restart, the red band would
completely pass through the flow cell and the red peak would be completed
[dotted line]. The blue band, the most strongly retained, travels at the slowest
rate and elutes after the red band. The dotted line shows you how the
completed chromatogram would appear if we had let the run continue to its
conclusion. It is interesting to note that the width of the blue peak will be the
broadest because the width of the blue analyte band, while narrowest on the
column, becomes the widest as it elutes from the column. This is because it
moves more slowly through the chromatographic packing material bed and
requires more time [and mobile phase volume] to be eluted completely. Since
mobile phase is continuously flowing at a fixed rate, this means that the blue
band widens and is more dilute. Since the detector responds in proportion to
the concentration of the band, the blue peak is lower in height, but larger in
width.
1.2.6. Identification and Quantification of Compounds
In Figure H, three dye compounds are represented by three peaks
separated in time in the chromatogram. Each elutes at a specific location,
measured by the elapsed time between the moment of injection [time zero] and
the time when the peak maximum elutes. By comparing each peak’s retention
time [tR] with that of injected reference standards in the same
chromatographic system [same mobile and stationary phase], a
chromatographer may be able to identify each compound.
Figure-I.14: Identification

Chapter-I
15
In the chromatogram shown in Figure I-14, the chromatographer knew
that, under these LC system conditions, the analyte, acrylamide, would be
separated and elute from the column at 2.85 minutes [retention time].
Whenever a new sample, which happened to contain acrylamide, was injected
into the LC system under the same conditions, a peak would be present at 2.85
minutes [Sample B in Figure I.15].
Once identity is established, the next piece of important information is
how much of each compound was present in the sample. The chromatogram
and the related data from the detector help us calculate the concentration of
each compound. The detector basically responds to the concentration of the
compound band as it passes through the flow cell. The more concentrated it is,
the stronger the signal; this is seen as a greater peak height above the baseline.
Figure-I.15: Identification and Quantitation
In Figure I.15, chromatograms for Samples A and B, on the same time
scale, are stacked one above the other. The same volume of sample was injected
in both runs. Both chromatograms display a peak at a retention time [tR] of 2.85
minutes, indicating that each sample contains acrylamide. However, Sample A
displays a much bigger peak for acrylamide. The area under a peak [peak area
count] is a measure of the concentration of the compound it represents. This

Chapter-I
16
area value is integrated and calculated automatically by the computer data
station. In this example, the peak for acrylamide in Sample A has 10 times the
area of that for Sample B. Using reference standards, it can be determined that
Sample A contains 10 picograms of acrylamide, which is ten times the amount
in Sample B [1 picogram]. Note there is another peak [not identified] that elutes
at 1.8 minutes in both samples. Since the area counts for this peak in both
samples are about the same, this unknown compound may have the same
concentration in both samples.
1.2.7. Isocratic and Gradient program
Two basic elution modes are used in HPLC. The first is called isocratic
elution. In this mode, the mobile phase, either a pure solvent or a mixture,
remains the same throughout the run. A typical system is outlined in Figure I.16.
Figure-I.16: Isocratic LC System
The second type is called gradient elution, wherein, as its name implies,
the mobile phase composition changes during the separation. This mode is useful
for samples that contain compounds that span a wide range of
chromatographic polarity [section on HPLC Separation Modes]. As the
separation proceeds, the elution strength of the mobile phase is increased to
elute the more strongly retained sample components.

Chapter-I
17
Figure-I.17: High-Pressure-Gradient System
In the simplest case, shown in Figure I.17, there are two bottles of
solvents and two pumps. The speed of each pump is managed by the gradient
controller to deliver more or less of each solvent over the course of the
separation. The two streams are combined in the mixer to create the actual
mobile phase composition that is delivered to the column over time. At the
beginning, the mobile phase contains a higher proportion of the weaker solvent
[Solvent A]. Over time, the proportion of the stronger solvent [Solvent B] is
increased, according to a predetermined timetable. Note that in Figure I.18, the
mixer is downstream of the pumps; thus the gradient is created under high
pressure. Other HPLC systems are designed to mix multiple streams of solvents
under low pressure, ahead of a single pump. A gradient proportioning valve
selects from the four solvent bottles, changing the strength of the mobile phase
over time [Figure I.18].

Chapter-I
18
Figure-I.18: Low-Pressure-Gradient System
1.2.8. HPLC Scale [Analytical, Preparative, and Process]
We have discussed how HPLC provides analytical data that can be used
both to identify and to quantify compounds present in a sample. However,
HPLC can also be used to purify and collect desired amounts of each compound,
using a fraction collector downstream of the detector flow cell. This process is
called preparative chromatography [Figure I.19].
In preparative chromatography, the scientist is able to collect the
individual analytes as they elute from the column [e.g., in this example: yellow,
then red, then blue].
Figure-I.19: HPLC System for Purification: Preparative Chromatography

Chapter-I
19
The fraction collector selectively collects the eluate that now contains a
purified analyte, for a specified length of time. The vessels are moved so that
each collects only a single analyte peak.
A scientist determines goals for purity level and amount. Coupled with
knowledge of the complexity of the sample and the nature and concentration of
the desired analytes relative to that of the matrix constituents, these goals, in
turn, determine the amount of sample that needs to be processed and the
required capacity of the HPLC system. In general, as the sample size increases,
the size of the HPLC column will become larger and the pump will need higher
volume-flow-rate capacity. Determining the capacity of an HPLC system is
called selecting the HPLC scale. Table I.1 lists various HPLC scales and their
chromatographic objectives.
Table-I.1: Chromatography Scale
The ability to maximize selectivity with a specific combination of HPLC
stationary and mobile phases—achieving the largest possible separation
between two sample components of interest—is critical in determining the
requirements for scaling up a separation [discussion on HPLC Separation
Modes]. Capacity then becomes a matter of scaling the column volume [Vc] to
the amount of sample to be injected and choosing an appropriate particle size
[determines pressure and efficiency; discussion of Separation Power]. Column
volume, a function of bed length [L] and internal diameter [i.d.], determines the
amount of packing material [particles] that can be contained (Figure I.20).

Chapter-I
20
Figure-I.20: HPLC Column Dimensions
In general, HPLC columns range from 20 mm to 500 mm in length [L]
and 1 mm to 100 mm in internal diameter [i.d.]. As the scale of chromatography
increases, so do column dimensions, especially the cross-sectional area. To
optimize throughput, mobile phase flow rates must increase in proportion to
cross-sectional area. If a smaller particle size is desirable for more separation
power, pumps must then be designed to sustain higher mobile-phase-volume
flow rates at high backpressure. Table I.2 presents some simple guidelines on
selecting the column i.d. and particle size range recommended for each scale of
chromatography.
For example, a semi-preparative-scale application [red X] would use a
column with an internal diameter of 10–40 mm containing 5–15 micron
particles. Column length could then be calculated based on how much purified
compound needs to be processed during each run and on how much separation
power is required.
Table –I.2: Chromatography Scale vs. Column Diameter and Particle Size

Chapter-I
21
1.2.9. Separation Performance – Resolution
The degree to which two compounds are separated is called
chromatographic resolution [RS]. Two principal factors that determine the
overall separation power or resolution that can be achieved by an HPLC column
are: mechanical separation power, created by the column length, particle size,
and packed-bed uniformity, and chemical separation power, created by the
physicochemical competition for compounds between the packing material and
the mobile phase. Efficiency is a measure of mechanical separation power,
while selectivity is a measure of chemical separation power.
1.2.10. Mechanical Separation Power – Efficiency
If a column bed is stable and uniformly packed, its mechanical
separation power is determined by the column length and the particle size.
Mechanical separation power, also called efficiency, is often measured and
compared by a plate number [symbol = N]. Smaller-particle chromatographic
beds have higher efficiency and higher backpressure. For a given particle size,
more mechanical separation power is gained by increasing column length.
However, the trade-offs are longer chromatographic run times, greater solvent
consumption, and higher backpressure. Shorter column lengths minimize all
these variables but also reduce mechanical separation power, as shown in
Figure I.21.

Chapter-I
22
Column Length and Mechanical Separating Power [Same Particle Size]
Figure-I.21: Particle Size and Mechanical Separating Power [Same Column
Length]
For a given particle chemistry, mobile phase, and flow rate, as shown in
Figure I.21, a column of the same length and i.d., but with a smaller particle size,
will deliver more mechanical separation power in the same time. However, its
backpressure will be much higher.
1.2.11. Chemical Separation Power – Selectivity
The choice of a combination of particle chemistry [stationary phase] and
mobile-phase composition—the separation system—will determine the degree
of chemical separation power [how we change the speed of each analyte].
Optimizing selectivity is the most powerful means of creating a separation; this
may obviate the need for the brute force of the highest possible mechanical
efficiency. To create a separation of any two specified compounds, a scientist
may choose among a multiplicity of phase combinations [stationary phase and
Chapter-I
23
mobile phase] and retention mechanisms [modes of chromatography]. These
are discussed in the next section.
1.2.12. HPLC Separation Modes
In general, three primary characteristics of chemical compounds can be
used to create HPLC separations. They are:
• Polarity
• Electrical Charge
• Molecular Size
First, let’s consider polarity and the two primary separation modes that
exploit this characteristic: normal phase and reversed-phase chromatography.
1.2.12.a. Separations Based on Polarity
A molecule’s structure, activity, and physicochemical characteristics are
determined by the arrangement of its constituent atoms and the bonds
between them. Within a molecule, a specific arrangement of certain atoms that
is responsible for special properties and predictable chemical reactions is
called a functional group. This structure often determines whether the
molecule is polar or non-polar. Organic molecules are sorted into classes
according to the principal functional group(s) each contains. Using a separation
mode based on polarity, the relative chromatographic retention of different
kinds of molecules is largely determined by the nature and location of these
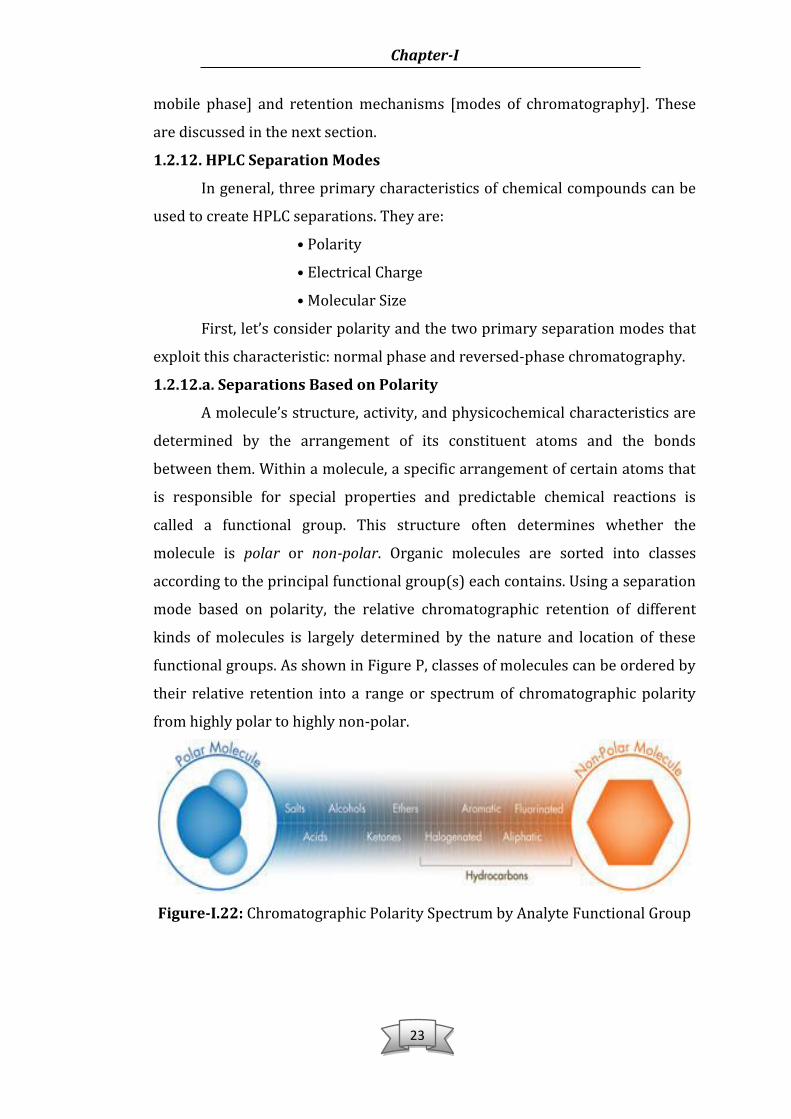
functional groups. As shown in Figure P, classes of molecules can be ordered by
their relative retention into a range or spectrum of chromatographic polarity
from highly polar to highly non-polar.
Figure-I.22: Chromatographic Polarity Spectrum by Analyte Functional Group

Chapter-I
24
Water [a small molecule with a high dipole moment] is a polar
compound. Benzene [an aromatic hydrocarbon] is a non-polar compound.
Molecules with similar chromatographic polarity tend to be attracted to each
other; those with dissimilar polarity exhibit much weaker attraction, if any, and
may even repel one another. This becomes the basis for chromatographic
separation modes based on polarity.
Another way to think of this is by the familiar analogy: oil [non-polar] and
water [polar] don’t mix. Unlike in magnetism where opposite poles attract each
other, chromatographic separations based on polarity depend upon the
stronger attraction between likes and the weaker attraction between opposites.
Remember, “Like attracts like” in polarity-based chromatography.
Figure-I.23: Proper Combination of Mobile and Stationary Phases Effects
Separation Based on Polarity
To design a chromatographic separation system [Figure I.23], we create
competition for the various compounds contained in the sample by choosing a
mobile phase and a stationary phase with different polarities. Then, compounds
in the sample that are similar in polarity to the stationary phase [column
packing material] will be delayed because they are more strongly attracted to
the particles. Compounds whose polarity is similar to that of the mobile phase
will be preferentially attracted to it and move faster.
In this way, based upon differences in the relative attraction of each
compound for each phase, a separation is created by changing the speeds of the
analytes.
Figures I.24, 25, and 26 display typical chromatographic polarity ranges
for mobile phases, stationary phases, and sample analytes, respectively. Let’s
consider each in turn to see how a chromatographer chooses the appropriate

Chapter-I
25
phases to develop the attraction competition needed to achieve a polarity-
based HPLC separation.
Figure-I.24: Mobile Phase Chromatographic Polarity Spectrum
A scale, such as that shown in Figure R-1, upon which some common
solvents are placed in order of relative chromatographic polarity is called an
eluotropic series. Mobile phase molecules that compete effectively with analyte
molecules for the attractive stationary phase sites displace these analytes,
causing them to move faster through the column [weakly retained]. Water is at
the polar end of mobile-phase-solvent scale, while hexane, an aliphatic
hydrocarbon, is at the non-polar end. In between, single solvents, as well as
miscible-solvent mixtures [blended in proportions appropriate to meet specific
separation requirements], can be placed in order of elution strength. Which end
of the scale represents the ‘strongest’ mobile phase depends upon the nature of
the stationary phase surface where the competition for the analyte molecules
occurs.
Figure-I.25: Stationary Phase Particle Chromatographic Polarity Spectrum
Silica has an active, hydrophilic [water-loving] surface containing acidic
silanol [silicon-containing analog of alcohol] functional groups. Consequently, it
falls at the polar end of the stationary-phase scale shown in Figure R-2. The
Chapter-I
26
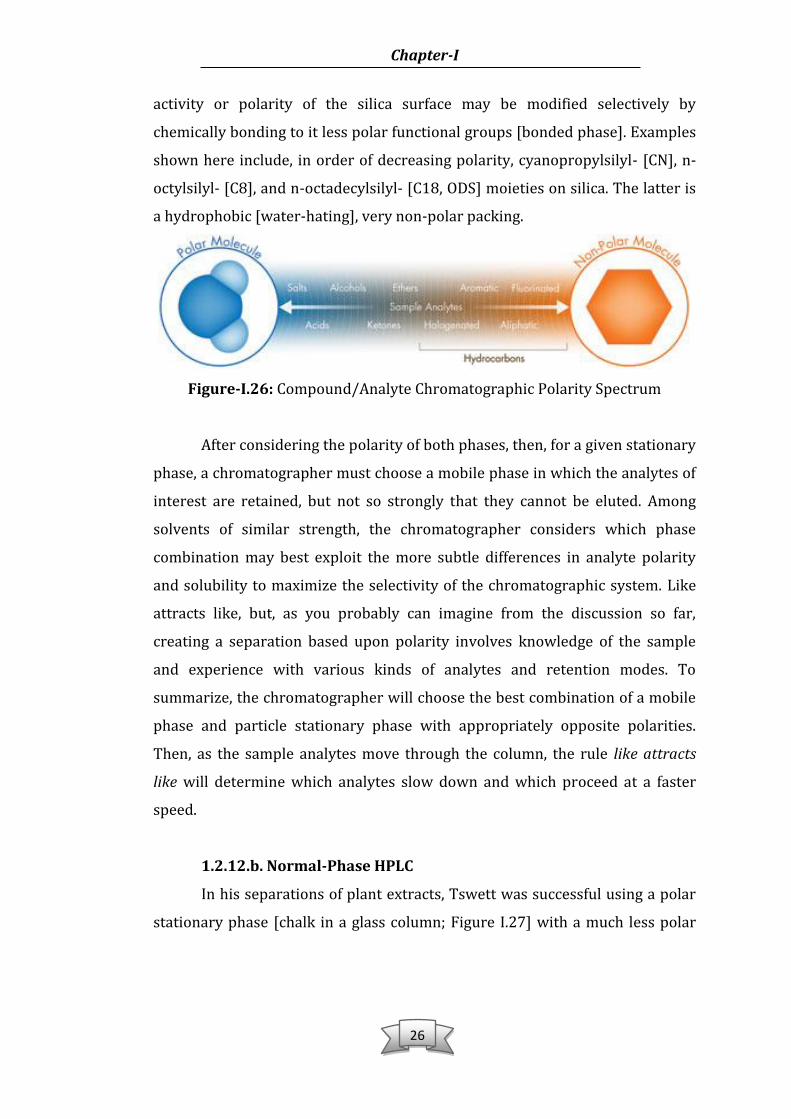
activity or polarity of the silica surface may be modified selectively by
chemically bonding to it less polar functional groups [bonded phase]. Examples
shown here include, in order of decreasing polarity, cyanopropylsilyl- [CN], n-
octylsilyl- [C8], and n-octadecylsilyl- [C18, ODS] moieties on silica. The latter is
a hydrophobic [water-hating], very non-polar packing.
Figure-I.26: Compound/Analyte Chromatographic Polarity Spectrum
After considering the polarity of both phases, then, for a given stationary
phase, a chromatographer must choose a mobile phase in which the analytes of
interest are retained, but not so strongly that they cannot be eluted. Among
solvents of similar strength, the chromatographer considers which phase
combination may best exploit the more subtle differences in analyte polarity
and solubility to maximize the selectivity of the chromatographic system. Like
attracts like, but, as you probably can imagine from the discussion so far,
creating a separation based upon polarity involves knowledge of the sample
and experience with various kinds of analytes and retention modes. To
summarize, the chromatographer will choose the best combination of a mobile
phase and particle stationary phase with appropriately opposite polarities.
Then, as the sample analytes move through the column, the rule like attracts
like will determine which analytes slow down and which proceed at a faster
speed.
1.2.12.b. Normal-Phase HPLC
In his separations of plant extracts, Tswett was successful using a polar
stationary phase [chalk in a glass column; Figure I.27] with a much less polar

Chapter-I
27
[non-polar] mobile phase. This classical mode of chromatography became
known as normal phase.
Figure-I.27: Normal-Phase Chromatography
Figure I.27 represents a normal-phase chromatographic separation of
our three-dye test mixture. The stationary phase is polar and retains the polar
yellow dye most strongly. The relatively non-polar blue dye is won in the
retention competition by the mobile phase, a non-polar solvent, and elutes
quickly. Since the blue dye is most like the mobile phase [both are non-polar], it
moves faster. It is typical for normal-phase chromatography on silica that the
mobile phase is 100% organic; no water is used.
1.2.12.c. Reversed-Phase HPLC
The term reversed-phase describes the chromatography mode that is
just the opposite of normal phase, namely the use of a polar mobile phase and a
non-polar [hydrophobic] stationary phase. Figure I.28 illustrates the black
three-dye mixture being separated using such a protocol.
Figure-I.28: Reversed-Phase Chromatography
Now the most strongly retained compound is the more non-polar blue
dye, as its attraction to the non-polar stationary phase is greatest. The polar
yellow dye, being weakly retained, is won in competition by the polar, aqueous

Chapter-I
28
mobile phase, moves the fastest through the bed, and elutes earliest like
attracts like.
Today, because it is more reproducible and has broad applicability,
reversed-phase chromatography is used for approximately 75% of all HPLC
methods. Most of these protocols use as the mobile phase an aqueous blend of
water with a miscible, polar organic solvent, such as acetonitrile or methanol.
This typically ensures the proper interaction of analytes with the non-polar,
hydrophobic particle surface. A C18–bonded silica [sometimes called ODS] is
the most popular type of reversed-phase HPLC packing.
Table I.3 presents a summary of the phase characteristics for the two
principal HPLC separation modes based upon polarity. Remember, for these
polarity-based modes, like attracts like.
Table-I.3: Phase Characteristics for Separations Based on Polarity
1.2.13. Hydrophilic-Interaction Chromatography [HILIC]
HILIC may be viewed as a variant of normal-phase chromatography. In
normal-phase chromatography, the mobile phase is 100% organic. Only traces
of water are present in the mobile phase and in the pores of the polar packing
particles. Polar analytes bind strongly to the polar stationary phase and may
not elute.
Adding some water [< 20%] to the organic mobile phase [typically an
aprotic solvent like acetonitrile] makes it possible to separate and elute polar
compounds that are strongly retained in the normal-phase mode [or weakly
retained in the reversed-phase mode]. Water, a very polar solvent, competes
effectively with polar analytes for the stationary phase. HILIC may be run in
either isocratic or gradient elution modes. Polar compounds that are initially
attracted to the polar packing material particles can be eluted as the polarity
[strength] of the mobile phase is increased [by adding more water]. Analytes

Chapter-I
29
are eluted in order of increasing hydrophilicity [chromatographic polarity
relative to water]. Buffers or salts may be added to the mobile phase to keep
ionizable analytes in a single form.
1.2.14. Hydrophobic-Interaction Chromatography [HIC]
HIC is a type of reversed-phase chromatography that is used to separate
large biomolecules, such as proteins. It is usually desirable to maintain these
molecules intact in an aqueous solution, avoiding contact with organic solvents
or surfaces that might denature them. HIC takes advantage of the hydrophobic
interaction of large molecules with a moderately hydrophobic stationary phase,
e.g., butyl-bonded [C4], rather than octadecyl-bonded [C18], silica. Initially,
higher salt concentrations in water will encourage the proteins to be retained
[salted out] on the packing. Gradient separations are typically run by decreasing
salt concentration. In this way, biomolecules are eluted in order of increasing
hydrophobicity.
1.2.15. Separations Based on Charge: Ion-Exchange Chromatography [IEC]
For separations based on polarity, like is attracted to like and opposites
may be repelled. In ion-exchange chromatography and other separations based
upon electrical charge, the rule is reversed. Likes may repel, while opposites are
attracted to each other. Stationary phases for ion-exchange separations are
characterized by the nature and strength of the acidic or basic functions on
their surfaces and the types of ions that they attract and retain. Cation exchange
is used to retain and separate positively charged ions on a negative surface.
Conversely, anion exchange is used to retain and separate negatively charged
ions on a positive surface [Figure I.29]. With each type of ion exchange, there
are at least two general approaches for separation and elution.

Chapter-I
30
Figure-I.29: Ion-Exchange Chromatography
Strong ion exchangers bear functional groups [e.g., quaternary amines or
sulfonic acids] that are always ionized. They are typically used to retain and
separate weak ions. These weak ions may be eluted by displacement with a
mobile phase containing ions that are more strongly attracted to the stationary
phase sites. Alternately, weak ions may be retained on the column, then
neutralized by in situ changing the pH of the mobile phase, causing them to lose
their attraction and elute.
Weak ion exchangers [e.g., with secondary-amine or carboxylic-acid
functions] may be neutralized above or below a certain pH value and lose their
ability to retain ions by charge. When charged, they are used to retain and
separate strong ions. If these ions cannot be eluted by displacement, then the
stationary phase exchange sites may be neutralized, shutting off the ionic
attraction, and permitting elution of the charged analytes.

Chapter-I
31
Table-I.4: Ion-Exchange Guidelines
When weak ion exchangers are neutralized, they may retain and
separate species by hydrophobic [reversed-phase] or hydrophilic [normal-
phase] interactions; in these cases, elution strength is determined by the
polarity of the mobile phase. Thus, weak ion exchangers may be used for
mixed-mode separations [separations based on both polarity and charge].
Table D outlines guidelines for the principal categories of ion exchange.
For example, to retain a strongly basic analyte [always positively charged], use a
weak-cation-exchange stationary phase particle at pH > 7; this assures a
negatively charged particle surface. To release or elute the strong base, lower
the pH of the mobile phase below 3; this removes the surface charge and shuts
off the ion-exchange retention mechanism.
Note that a pKa is the pH value at which 50% of the functional group is
ionized and 50% is neutral. To assure an essentially neutral, or a fully charged,
analyte or particle surface, the pH must be adjusted to a value at least 2 units
beyond the pKa, as appropriate [indicated in Table I.4].
Chapter-I
32
Do not use a strong-cation exchanger to retain a strong base; both
remain charged and strongly attracted to each other, making the base nearly
impossible to elute. It can only be removed by swamping the strong cation
exchanger with a competing base that exhibits even stronger retention and
displaces the compound of interest by winning the competition for the active
exchange sites. This approach is rarely practical, or safe, in HPLC and SPE. [Very
strong acids and bases are dangerous to work with, and they may be corrosive
to materials of construction used in HPLC fluidics!]
1.2.16. Separations Based on Size: Size-Exclusion Chromatography [SEC] –
Gel-Permeation Chromatography [GPC]
In the 1950s, Porath and Flodin discovered that biomolecules could be
separated based on their size, rather than on their charge or polarity, by
passing, or filtering, them through a controlled-porosity, hydrophilic dextran
polymer. This process was termed gel filtration. Later, an analogous scheme
was used to separate synthetic oligomers and polymers using organic-polymer
packings with specific pore-size ranges. This process was called gel-permeation
chromatography [GPC]. Similar separations done using controlled-porosity
silica packings were called size-exclusion chromatography [SEC]. Introduced in
1963, the first commercial HPLC instruments were designed for GPC
applications .
All of these techniques are typically done on stationary phases that have
been synthesized with a pore-size distribution over a range that permits the
analytes of interest to enter, or to be excluded from, more or less of the pore
volume of the packing. Smaller molecules penetrate more of the pores on their
passage through the bed. Larger molecules may only penetrate pores above a
certain size so they spend less time in the bed. The biggest molecules may be
totally excluded from pores and pass only between the particles, eluting very
quickly in a small volume. Mobile phases are chosen for two reasons: first, they
are good solvents for the analytes; and, second, they may prevent any
interactions [based on polarity or charge] between the analytes and the
stationary phase surface. In this way, the larger molecules elute first, while the

Chapter-I
33
smaller molecules travel slower [because they move into and out of more of the
pores] and elute later, in decreasing order of their size in solution. Hence the
simple rule: Big ones come out first.
Since it is possible to correlate the molecular weight of a polymer with its size
in solution, GPC revolutionized measurement of the molecular-weight
distribution of polymers that, in turn, determines the physical characteristics
that may enhance, or detract from, polymer processing, quality, and
performance [how to tell good from bad polymer].
1.3 DISSOLUTION
Drug absorption from a solid oral dosage depends on the release
of the drug substance from the drug product (dissolution), the solubility and
the permeability across the gastrointestinal tract (36-37). The first aspect of the
tablets is determined by the manufacture of the product. It is the process by
which a solid or liquid forms a solution in a solvent. In solids this can be
explained as the breakdown of the crystal lattice into individual ions, atoms or
molecules and their transport into the solvent. Dissolution testing is widely
used in the pharmaceutical industry for optimization of formulation (38-39).
A scientific framework for classifying drug substances based on their
aqueous solubility and intestinal permeability (40-43). According to the BCS
(biopharmaceutical classification system) the drug substances are classified as
follows,
Class-1: High Solubility-High Permeability
Class-2: Low Solubility-High Permeability
Class-3: High Solubility- Low Permeability
Class-4: Low Solubility-Low Permeability
1.3.1 Dissolution apparatus
Dissolution profiling methods can be developed based on drug
solubility, dosage form solubility, application of the drug/dosage form. Mainly
the dissolution method development is depends on the selection of dissolution
medium, apparatus, RPM (round per min) and dissolution profile time.

Chapter-I
34
Figure-I.30 shows the Lab India manufactured dissolution apparatus.
Based on application dissolution apparatus are seven types;
Apparatus 1: Basket (37º)
Apparatus 2: Paddle (37º)
Apparatus 3: Reciprocating Cylinder (37º)
Apparatus 4: Flow-Through Cell (37º)
Apparatus 5: Paddle over Disk (32º), Transdermal Delivery System, use
paddle and vessel from Apparatus 2 with a stainless steel disk assembly to hold
the transdermal on the bottom of vessel.
Apparatus 6: Cylinder (32º), Transdermal Delivery System, use
Apparatus 1 except replace the basket shaft with a stainless steel cylinder
element.
Apparatus 7: Reciprocating Holder, for transdermal delivery systems
and also a variety of dosage forms
Figure-I.30: Lab India dissolution apparatus.
1.3.2. Dissolution medium:
Dissolution medium can be selected based on the drug release profile
and application of the drug application in to the body. Generally used
dissolution mediums are, 0.1N (pH ~1.2) or 0.01N (pH ~2.0) hydrochloric acid,
0.05 M sodium acetate buffer, typically at pH 4.5, 0.05 M potassium phosphate

Chapter-I
35
buffer, typically at pH 6.0, 6.8, 7.0 or 7.5, Simulated Gastric Fluid, Simulated
Intestinal Fluid, 0.05 M sodium citrate buffer at pH 2.0 or 3.0 and sodium
borate buffer at pH 8-10. Dissolution profile calculations and acceptance
criteria mentioned in appendix.
1.4 . HPLC METHOD DEVELOPMENT
Reverse phase HPLC is the most commonly used form of HPLC. Recent
days a wide range of improvement has been observed in HPLC instrumentation
and method development (44-48). This is especially true for chromatographs and
detectors (MASS, NMR and IR). Isocratic and gradient reverse-phase HPLC have
evolved as the primary techniques for the analysis of non-volatile drug
substances and impurities. The HPLC detector of choice for many types of
methods development is the photodiode array (PDA) detector because it can be
used for both quantitative and qualitative analysis. The use of a PDA detector to
determine peak purity of the substances in stressed samples greatly facilitates
the development of stability-indicating assays. This trend will continue with the
need to better define degradation pathways. The ultraviolet (UV) absorbance
detector remains the most common HPLC detector for potency and impurity
analysis. Once specificity has been demonstrated, the PDA detector is replaced
with a variable wavelength detector and HPLC effluent is monitored at fixed
wavelengths.
Stability-indicating and impurity methods often are required to measure
analytes within a wide concentration range. Recent food and drugs
administration (FDA) and international conference on harmonization (ICH)
guidance about chiral drug products and impurities has posed new challenges
for methods development scientists (49-53). However, recent advances in the use
of chiral HPLC columns have greatly facilitated progress in this area. Advances
in laboratory robotics and automation are to be applied to method
development and validation. Development teams are using laboratory robotics
to develop automated methods for high-volume tests.

Chapter-I
36
Development steps:
Mainly the method development process consists of different
steps (54-58):
Define method objectives and understand the chemistry (10%):
Determine the goals for method development (e.g. purpose of method
like impurity profile, assay, dissolution and content uniformity) and to
understand the chemistry (UV absorbance, polarity, pH, pKa and solubility) of
the analytes and the drug product.
Initial HPLC conditions (20%):
Develop preliminary HPLC conditions to achieve minimally acceptable
separations, based molecule chemistry like polarity, pH of the molecule, UV
absorbance, selection of suitable buffers, organic modifiers, mobile pH, and
diluent for samples preparation.
Sample preparation procedure (10%):
Develop a suitable sample preparation scheme for the test sample based
on polarity, sample nature (solubility, stability, pH sensitivity and precipitate
property). If it requires heating then clearly monitor the time and temperature
of water bath.
Standardization (10%):
Determine the appropriate standardization method and the use of
relative response factors in calculations. Establish and standardize the sample
solution stability, mobile phase sensitivity (pH and ratio), relative retention
time (RRT), relative response factor (RRF), system suitability conditions
(theoretical plates, resolution and tailing factor).
Final method optimization/robustness (20%):
Identify the “weaknesses” of the method and optimize the method
through experimental design. Understand the method performance with
different conditions, different instrument set ups and different samples.
Method validation (30%):
Perform the complete method validation according to international
conference on harmonization (ICH) guidelines with precision, specificity,

Chapter-I
37
linearity, accuracy, limit of detection (LOD), limit of quantification (LOQ),
robustness and ruggedness.
Selection of chromatographic conditions:
Selection of chromatography:
Selection of chromatography is the primary step in method development
like reverse phase, normal phase and chiral chromatography. This can be
happened from molecule polarity, chiral centers, functional groups present in
the parent moiety.
Selection of detector:
Based on the molecule property UV activity, refractive index,
fluorescence and volatile nature, the detector can be selected. Generally used
detectors are UV/Visible, RI detector, fluorescence, evaporative light scattering
(ELS) detector, conductivity, mass (MS) detector, electro chemical and IR
detector.
Selection of buffer:
Buffer selection is the critical parameter in method development. Buffer
selection depends on molecule retention time, peak shape, column suitability
and resolution. Generally used buffer salts are phosphates, acetates, citrates,
formats, perchlorates, ammonium salts and metal alkyl sulphonates.
Selection of HPLC column:
In HPLC, the column selection is the major factor for better separation
and reproducible results. Column has selected based on the analyte elution,
peak shape and response. For column selection we need to know the molecule
chemistry then only the column selection is happened.
Selection of diluent:
Diluent plays a key role in solution stability. Select the suitable diluents
for standard and test solutions which are easily soluble without forming the
precipitate. Some samples soluble in acids or basic solutions at this time select
the acid or base up to soluble volume only then add neutral solutions as diluent
because this will give good peak shape and increase the life time of the column.

Chapter-I
38
Selection of run time and flow rate:
Run time selection depends on the elution of the analytes, un-retained
peaks. Before finalization of the method run the samples for up to three times
of the main peak elution or late eluted peak. Generally, flow rate range is
between used 0.5mL per min to 2.0mL per min.
Selection of standard and sample solution concentration:
Sample concentrations are selected based on the response of the
analytes at selected detector settings, mobile phase, limit of detection and limit
of quantification levels, resolution of the method, impurities limit for products,
strength of the dosage form and application of the method like dissolution,
assay, content uniformity, related substances.
Selection of mobile phase composition:
Mobile phase optimization depends on, type of modifier (acetonitrile,
methanol or tetra-hydro furan), solvent strength so that k' for all solutes is in
the range of 1-20 and perform stepwise isocratic study in 20% steps starting at
100% organic and gradient determination of % organic.
Selection of injection volume:
Generally used injection volume is 20µL per injection. Sometimes this is
not applicable due to lower strength of the dosage forms or non-coincides of
the combination ingredients at this time individual injection volumes can be
selected.
System suitability:
As per ICH guidelines system suitability parameters are theoretical
plates, resolution and tailing factor (59-62).
1.5 HPLC METHOD VALIDATION
Validation of analytical methods plays a major role in judging the
quality, reliability and consistency of analytical data, which is an integral part of
any good analytical practice. Validation of analytical methods is required by
most regulations and quality standards that impact laboratories (63-65).

Chapter-I
39
The analytical procedure validation defines as "Validation of an
analytical method is the process by which it is established by laboratory
studies, that the performance characteristics of the method meet the
requirements for the intended analytical application".
Typical analytical parameters used in method validation include (Table I.5):
1. Precision
2. Accuracy
3. Linearity
4. Range
5. Ruggedness
6. Limit of detection
7. Limit of quantitation
8. Selectivity/Specificity
9. Robustness
Table-I.5: Method validation parameters and Limits
METHOD VALIDATION PARAMETERS AND ACCEPTANCE CRITERIA Validation Parameter Acceptance Criteria
System suitability
Blank chromatogram shall not have any peak at the retention times of the all peaks (impurities and drug product) with an area more than 0.1%.
The tailing factor for drug product peak from first injection of diluted standard solution should be not more than 2.0.
The peak area ratio of two injections of standard preparation for drug product peak should be not less than 0.9 and not more than 1.1.
The resolution between each peaks like impurities and drug product from system suitability solution should be not less than 2.0
Specificity
Blank interference
No peak shall be detected in the blank at >0.1% of the average standard area response of standard solution at the RT of all impurities and drug product peak.
Placebo Interference
Placebo chromatogram shall not have any peak at the retention times of all peaks (impurities and drug product) with an area

Chapter-I
40
more than 0.1%. Peak purity of drug product shall pass.
Peaks shall not have any flag in purity results table.
Peak purity for each known impurity shall pass for spiked placebo preparation. Peaks shall not have any flag in purity results table.
Known Impurities
There shall be no interference from known impurities to drug product and any unknown impurities.
Impurities shall be adequately resolved from each other and from drug product as well as unknown impurities also.
Peak purity of impurities and drug product shall pass. All peaks shall not have any flag in purity results table.
Degradation Studies (Acid,
Base, Peroxide, Thermal, Humidity,
Neutral, UV light, Visible
light)
Peaks of degradation products shall be adequately resolved from each other and from drug product and known impurities.
Peak purity for drug product shall pass. Peaks shall not have any flag in purity results table.
Peak purity for each known impurities and drug product shall pass. Peaks shall not have any flag in purity results table.
Linearity
Correlation coefficient shall be ≥ 0.999 for each known impurity and drug product (specific cases the limit is 0.997).
Bias at 100% level (i.e., at target concentration) response shall be ≤ 5.0%.
If multiple strengths in the drug product then consider the concentration of samples and standards for linearity levels.
Precision %RSD of percent individual impurity from
6 replicate preparations shall be NMT 15.0%.
Intermediate Precision
%RSD of percent individual impurity from 6 replicate sample preparations of analyst 2 shall be NMT 15.0%.
Cumulative %RSD of assay from 12 replicate sample preparations (analyst 1 and analyst 2 combined) shall be NMT 15.0.
Accuracy If multiple strengths in the drug product,
then consider the standard and sample

Chapter-I
41
solution concentrations for both lower and higher strengths.
For Lower and higher levels need to perform the six preparations.
Individual percent recovery of each analyte at each spike level shall be 85.0% to 115.0%.
Limit of Detection (LOD) and Limit of Quantification (LOQ)
For LOQ, a signal to noise ratio of 9.0 to 11.4 shall be obtained.
For LOD, a signal to noise ratio of 2.0 to 3.4 shall be obtained.
The %RSD of percent individual impurity from 6 replicate preparations at LOQ shall be NMT 15.0%.
The mean recovery of each known impurity from 6 replicate preparations at LOQ shall be 85.0% to 115.0%.
Range
For linearity, correlation coefficient shall be ≥0.999 and bias at 100% response shall be not more than 5%
For precision, %RSD from 6 replicate preparations made in accuracy section (higher level) and at LOQ level shall be NMT 15.0%
For accuracy, individual recovery of each analyte at each spike level shall be 85.0% to 115.0%
Ruggedness (perform the
stability study for 1 and 2 days interval)
Solution stability at
Room Temperature
Standard solution-1 and 2 peak areas similarity factor shall be 0.90 to 1.10.
Difference in percent individual impurity at each time point compared to initial shall be ± 20%.
Difference in percent total impurities at each time point compared to initial shall be ±15%.
If the room temperature stability study results are satisfactory then refrigerator stability is not required.
Solution stability at
Refrigerator
Stability of system
suitability solution
System suitability parameters are within the limit as specified in the test method.

Chapter-I
42
Mobile phase at Room
Temperature
System suitability shall pass at each analysis.
If the room temperature stability study results are satisfactory then no need to perform the refrigerator stability.
Difference in percent individual impurity at each time point compared to initial shall be ± 20%.
Difference in percent total impurities at each time point compared to initial shall be ±15%.
Mobile phase at
Refrigerator
Robustness
(Variations: Mobile phase composition ratio, mobile
phase pH, Flow rate,
Column oven temperature)
System suitability criteria of the method shall be met for all experiments.
Adequate resolution shall be obtained for all impurities from each other and from drug product peak.
Peak purity shall pass for drug product. Peaks shall not have any flag in purity results table.
Peak purity shall pass for each known impurity. Peaks shall not have any flag in purity results table.
Filter validation
Filter validation should be performed with centrifuged, PVDF, NYLON type of filter samples.
Percent difference of each individual impurity for each filtered sample compared to unfiltered sample shall be ±20%.
Percent difference in total impurities of each filtered sample compared to unfiltered sample shall be ±15%.
1.6 CHROMATOGRAPHIC CALCULATIONS
Theoretical Plates (half-height method):

Chapter-I
43
Where:
N = Number of theoretical plates
Ve = Elution volume or retention time (mL, sec, or cm)
h = Peak height
w1/2 = width of the peak at half peak height (mL, sec, or cm)
Theoretical Plates (USP method):
Where:
N = Number of theoretical plates
Ve = Elution volume, retention time or retention distance (mL, sec, or
cm)
h = Peak height
wb = Width of the peak at the base line (mL, sec, or cm)
Peak Asymmetry Factor:
Where:
As = Peak asymmetry factor
b = Distance from the point at peak midpoint to the trailing edge (at
10% of peak height)
a = Distance from the leading edge of of peak to the midpoint (at 10%
of peak height)

Chapter-I
44
Tailing Factor (USP method):
Where:
T = Tailing factor (measured at 5% of peak height)
b = Distance from the point at peak midpoint to the trailing edge
a = Distance from the leading edge of the peak to the midpoint
Height Equivalent to a Theoretical Plate (HETP):
Where:
H = Height equivalent of a theoretical plate
L = Length of the column
N = Number of theoretical plates
Dimensions: when using HPLC or UPLC columns, H is usually expressed in µm.
Resolution:
Chapter-I
45
1.7 PHARMACEUTICAL PRODUCTS
1.7.1 INTRODUCTION
Pharmaceutical products – more commonly known as medicines or drugs – are
a fundamental component of both modern and traditional medicine. It is
essential that such products are safe, effective, and of good quality, and are
prescribed and used rationally.
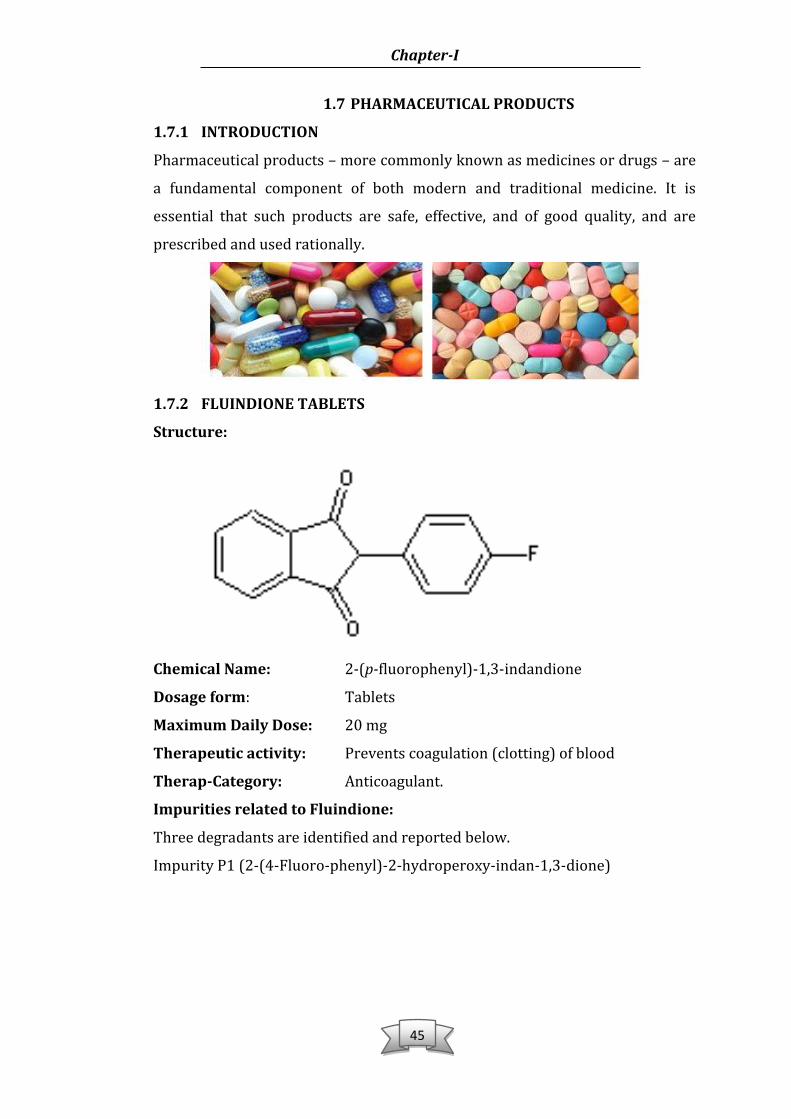
1.7.2 FLUINDIONE TABLETS
Structure:
Chemical Name: 2-(p-fluorophenyl)-1,3-indandione
Dosage form: Tablets
Maximum Daily Dose: 20 mg
Therapeutic activity: Prevents coagulation (clotting) of blood
Therap-Category: Anticoagulant.
Impurities related to Fluindione:
Three degradants are identified and reported below.
Impurity P1 (2-(4-Fluoro-phenyl)-2-hydroperoxy-indan-1,3-dione)

Chapter-I
46
Impurity P2 (2-(4-Fluoro-phenyl)-2-hydroxy-indan-1,3-dione)
Impurity A (2-phenyl-1,3-indanedione)
1.7.3 CALCIUM PANTOTHENATE, L-CYSTINE, PARA AMINO BENZOIC ACID
AND THIAMINE MONONITRATE CAPSULES
1.7.3.1 Calcium Pantothenate
Structure:

Chapter-I
47
Chemical Name: b-Alanine,N-(2,4-dihydroxy-3,3-dimethyl-1-
oxobutyl)-,calcium salt (2:1),(R)
Dosage form: Capsules
Maximum Daily Dose: 5-10 mg
Therapeutic activity: Pantothenic acid is important for our bodies to
properly use carbohydrates, proteins, and lipids
and for healthy skin
Therap-Category: Nutritional supplement (vitamin)
1.7.3.2 L-Cystine
Structure:
ChemicalName : 3,3’-Disulfanediylbis (2R)-2-aminopropanoic acid
Dosage form : Capsules
Maximum Daily Dose: 0.5 to 1.5 gm
Therapeutic activity: Reducing symptoms of hair pulling.
Cysteine is able to fulfil several important functions
in the human body due to its specific structure
including sulfur and contributes significantly to the
general well-being.
Therap-Category: L-cysteine has anti-inflammatory properties that it
can protect against various toxins, due to its
essential amino acid ability to neutralise toxic
heavy metals in the body.
1.7.3.3 Para amino benzoic acid
Structure:

Chapter-I
48
Chemical Name : 4-Aminobenzoic acid.
Dosage form: Capsules
Maximum Daily Dose: 300-400 mg
Therapeutic activity: PABA is used to improve the protein used in the
body, it relates to red blood cell formation as well
as assisting the manufacture of folic acid in the
intestines. Para-aminobenzoic acid is used in
sunscreen preparations since it can help protect
the skin against ultra-violet radiation.
Therap-Category: PABA has been suggested as a treatment
for Peyronie's disease & scleroderma ( that affects
the connective tissues of the skin and various
organs)
1.7.3.4 Thiamine mononitrate
Structure:
Chemical Name : Thiazolium,3-[(4-amino-2-methyl-5-
pyrimidinyl)methyl]-5-(2-hydroxyethyl)-4-methyl-
,nitrate
Dosage form: Capsules
Maximum Daily Dose: 300 mg
Therapeutic activity: Preventing kidney disease in people with type 2
diabetes.
Therap-Category: Nutritional supplement (vitamin)

Chapter-I
49
1.7.4 GLUCOSAMINE AND CHONDROITIN TABLETS
1.7.4.1 Glucosamine Hydrochloride
Structure:
Chemical Name: (3R,4R,5S)-3-Amino-6-(hydroxymethyl)oxane-
2,4,5-triol
Dosage form: Tablets
Maximum Daily Dose: 1.5 gm
Therapeutic activity: Treatment of osteoarthritis symptoms (knee
degenerative osteoarthritis)
Therap-Category: Bone Modulating
Impurities related to Glucosamine Hydrochloride :
Chemical name Structure
N – Acetyl –
Glucosamine
Pyrazine
5 – Hydroxymethyl – 2
– Furaldehyde

Chapter-I
50
2 – Furaldehyde
Pyrrole – 2 –
Carboxaldehyde
1.7.4.2 Chondroitin
Structure:
Chemical Name: Chondroitin-4-sulfate: R1=H; R2= SO3H; R3=H.
Chondroitin-6-sulfate; R1= SO3H; R2,R3= H
Dosage form: Tablets
Maximum Daily Dose: 800 - 1200 mg
Therapeutic activity:
Treatment of osteoarthritis symptoms (In of osteoarthritis, cartilage in the
joints breaks down. Taking chondroitin sulfate, one of the building blocks of
cartilage, might slow this breakdown). Therap-Category: Bone Modulating
1.8 SCOPE OF THE RESEARCH WORK
The scope of this study is to develop novel stability indicating HPLC
method & validate to know the complete performance of the method for the
below mentioned pharmaceutical products.

Chapter-I
51
1) Fluindione tablets.
2) Kercavit capsules (Calcium pantothenate 60 mg, L-Cystine 200 mg, Para
amino benzoic acid 30 mg & Thiamine mononitrate 60 mg).
3) Glucosamine HCl 500 mg and Chondroitin sulfate 400 mg SR tablets.
The present study is to develop & validate
Assay, Related substances, dissolution, and antioxidant content in
Fluindione tablets.
Single analytical stability indicating assay method for multivitamins in
capsule. ( Brand name: kercavit )
Quantification of Glucosamine HCl impurities in Glucosamine HCl 500
mg and Chondroitin sulfate 400 mg SR tablets.

Chapter-I
52
1.9 REFERENCES
1. http://www.cem.msu.edu/~cem333/Week16.pdf
2. http://www.und.edu/dept/chromatography/Docs/Chromatography.pdf
3. http://faculty.uml.edu/david_ryan/84.314/Instrumental%20Lecture%
2018.pdf
4. http://www.ecs.umass.edu/cee/reckhow/courses/772/772l20/772l20
print.pdf
5. http://www.javeriana.edu.co/Facultades/Ciencias/neurobioquimica/lib
ros/celular/programacell_archivos/Liquid%20Chromatography.pdf
6. Mikhail Tswett., "chromatography" Die Adsorption." 24, 316–326, 1906
7. http://www.chem.uwec.edu/Chem455_S05/Pages/Manuals/LC_Rubins
on.pdf
8. http://www.chem.umass.edu/~samal/269/tlc.pdf
9. http://infohost.nmt.edu/~jaltig/TLC.pdf
10. http://courses.chem.psu.edu/chem36/Experiments/PDF's_for_techniqu
es/TLC.pdf
11. http://www.chem.wisc.edu/courses/342/Fall2004/TLC.pdf
12. http://ocw.mit.edu/courses/chemistry/5-301-chemistry-laboratory-
techniques-january-iap-2012/labs/MIT5_301IAP12_TLC_Handout.pdf
13. http://www.chromsource.com/books/Milestones-TLC.pdf
14. http://sitesmedia.s3.amazonaws.com/chem/files/2012/08/TLC_Primer
15. http://www.watrex.cz/watrex/cz/dwn_ds.php?id=MACHEREY_NAGEL_
TLC.pdf
16. http://web.uvic.ca/~berryde/techniques/column%20chrom.pdf
17. http://www.gsgis.k12.va.us/facultyweb/ashore/chemstuff/handouts/c
hromatographypacket.pdf
18. http://courses.chem.psu.edu/chem36/Experiments/PDF's_for_techniqu
es/CC.pdf
19. http://polymer.ustc.edu.cn/xwxx_20/xw/201109/P020110906263097
048536.pdf

Chapter-I
53
20. http://www.ux1.eiu.edu/~cfjpb/teaching/ia/iaprojects/hplc.pdf
21. http://www.arlok.com/articles/High-
Performance%20Liquid%20Chromatography.pdf
22. http://www.hopkinsmedicine.org/mams/mams/middleframe_files/tea
ching_files/me330.884/2005/ms2005-lecture-4-chromatography.pdf
23. http://web.campbell.edu/faculty/bryan/CHEM441/JournalArticles/cer
eal.pdf
24. http://www.discoverysciences.com/uploadedFiles/Home/HPLCCols_Se
lectionInfo_p24to33.pdf
25. http://www.mac-mod.com/pdf/technical-report/036-
ColumnComparisonGuide.pdf
26. http://www.nestgrp.com/pdf/colcare.pdf
27. http://www.teknolab.no/pdf/Restek_p290-329_HPLCcolumns.pdf
28. http://www.chromtech.com/Catalog/ProductLine/brochures/Zorbax_G
uide.pdf
29. http://www.chromatographyonline.com/lcgc/data/articlestandard/lcg
ceurope/262003/61538/article.pdf
30. http://scholar.lib.vt.edu/theses/available/etd-12062002-
051420/unrestricted/JS_thesis.pdf
31. http://lipidlibrary.aocs.org/topics/detect92/file.pdf
32. http://faculty.ksu.edu.sa/Dr.almajed/Documents/LC%20Detector.pdf
33. http://www.colorado.edu/chemistry/chem5181/Lectures/C6_Detector
s.pdf
34. http://www.metabolomics.ca/Project/Presentations/Evaporative%20L
ight%20Scattering%20Detection%20in%20Application%20to%20Lipid
%20Separation%20by%20HPLC.pdf
35. http://www.forumsci.co.il/HPLC/Detectors_handouts.pdf
36. http://www.dissolutiontech.com/DTresour/0503art/DT0503art1.pdf
37. http://mediaserver.aaps.org/meetings/09_PPB/Wed/Track_I/Om_Anan
d.pdf

Chapter-I
54
38. http://www.globalresearchonline.net/journalcontents/volume2issue1/
Article%20008.pdf
39. http://www.dissolutiontech.com/DTresour/200505Articles/DT200505
_A01.pdf
40. http://cpb.pharm.or.jp/cpb/200007/c07_0951.pdf
41. http://www.dissolutiontech.com/DTresour/201211Articles/DT201211
_A05.pdf
42. http://www.usp.org/sites/default/files/usp_pdf/EN/USPNF/2011-02-
25711DISSOLUTION.pdf
43. http://www.fda.gov/downloads/Drugs/GuidanceComplianceRegulator
yInformation/Guidances/ucm070237.pdf
44. http://www.restek.com/pdfs/pres-2003-lc-md.pdf
45. http://www.chem.agilent.com/Library/eseminars/Public/Microsoft%2
0PowerPoint%20- 20rapid%20HPLC%20Method%20Development.pdf
46. http://www.cvg.ca/images/HPLC_Method_Development.pdf
47. http://www.uspnf.com/uspnf/login
48. http://www.edqm.eu/en/european-pharmacopoeia-7th-edition-
1401.html
49. http://www.pharmacopoeia.co.uk/
50. http://www.edqm.eu/en/edqm-homepage-628.html
51. http://www.ipc.gov.in/
52. http://www.fda.gov/
53. Q2 (R1) Validation of Analytical Procedures: Methodology
54. Q3A (R2) & Q3B (R2) Impurities in new drug substances and products
55. Q8 (R2) Pharmaceutical Development
56. Q6A Specifications; Test procedures and acceptance Criteria for new
drug substances and New drug products.
57. WHO The International Pharmacopoeia
58. http://www.fda.gov/downloads/Drugs/Guidances/UCM134409.pdf
59. http://www.cvg.ca/images/SystemStabilityTests.pdf
60. http://www.pharmacopeia.cn/v29240/usp29nf24s0_c621s12.html

Chapter-I
55
61. http://www.forumsci.co.il/HPLC/SST_abic.pdf
62. http://www.microsolvtech.com/calculators_chrom.asp#
63. http://www.separations.us.tosohbioscience.com/ServiceSupport/TechS
upport/ResourceCenter/ChromatographyCalculations/SystemSuitabilit
y Calculations.htm
64. http://technologyinscience.blogspot.in/2011/12/chromatography-
calculations-resolution.html#.UcmzNjCQaTU
65. http://www.ich.org/