chapter globalisationeconomic 9 - jaconline.com.au · globalisation is the extension of the trend...
TRANSCRIPT
CHAPTER 9 Economic globalisation
chapter
9Economic
globalisation
281
9.1 Definition and history of economic globalisation
DEFINITION OF GLOBALISATIONIn economics, the term globalisation involves the spread of busi-ness, trade and investment across national borders. Globalisa-tion is the economic unification of the world’s economies, andits various commercial and financial markets. Hence, instead ofcountries being seen as independent and closed sovereignstates, globalisation requires that nations see themselves asbelonging to the one big economy.
Globalisation is the extension of the trend that has beengoing on for well over 200 years towards increased international-
isation, specialisation and interdependence of many economiesincluding Australia. Leading the charge we find multinational ortransnational companies growing out of business operations inseveral countries.
THE RECENT ACCELERATION OF GLOBALISATIONEspecially during the 1990s and 2000s, globalisation has spreadquickly. It has been made possible by several developments:
Economics Down Under Book 1282
Relaxation of government controlsThere has been a general relaxation of government controls(deregulation) in most economies and their replacement indecision-making by the forces of freer markets (demand andsupply) and capitalism.
Better transport and communicationsImproved speed and cheapness in transport and communi-cations have meant that businesses are more aware of profitopportunities and able to move resources and productionbetween countries.
New technologyThere have been huge leaps in technology which permit evenunskilled workers to be involved in modern production.
Mobility of investmentAlthough some natural and labour resources are difficult tomove between countries, money capital or investment resourcesdo not suffer this difficulty. Businesses can, therefore, becomemobile multinationals.
Unlike days gone by, under globalisation, it is quite likely thatthe food we eat, the clothes we wear, the knowledge and enter-tainment we absorb, the environmental and other problems we
face, the policies adopted by our governments and the econ-omic conditions affecting our daily lives are all linked to theglobal economy and are even less under our control.
TRENDS IN GLOBALISATIONAs we shall see, the idea of globalisation is not a new one, but ithas gained far more momentum in recent times.
In 1817, an economist by the name of David Ricardo pub-lished his book in which he developed the theory of com-parative cost advantage. Here he noted that countries shouldspecialise in areas of production where their comparative costadvantage was greatest or their disadvantage least. Throughinternational free trade and specialisation, he argued that coun-tries would enjoy lower prices, better incomes and higher livingstandards. In turn, the growth of trade on this basis, along withother factors (e.g. better transport and communications), con-tributed to the development of globalisation.
TRY APPLIED ECONOMICS 1, p. 305EXERCISE
Globalisation — 1800–2003
� The 1800s–early 1900s. During the 1800s until World War I, there were plenty of examples of economies linked to the global economy as suppliers of resources, manufactured goods, services, and even money capital or investment. Colonisation by Europeans of Australia, parts of Asia (e.g. Vietnam, Malaysia, Indonesia), India, North America (e.g. the United States, Canada), South America (e.g. Cuba, Brazil, Argentina), the Pacific and Africa, involved encouraging production with a focus on exports of commodities such as wool, wheat, sugar, spices, cotton, tea, rubber and minerals. In some cases, pro-duction costs were held down by exploiting workers and by the use of slave labour. Indeed, European entrepreneurs had investments in colonies around the world to take full advantage of the resources available. These cheap commodities pro-duced by the colonies were then converted into value-added manufactured items back in countries such as Britain, Spain, Portugal, Holland, Germany and France. Finished goods were then re-exported at much higher prices. The 1800s thus saw the dramatic explosion of international trade and partial globalisation of capital on a scale not seen before. It was made possible by improvements in transport, industrialisation, rising incomes and technology.

CHAPTER 9 Economic globalisation 283
� 1915–47. However, the period between the wars, 1915 to 1945, saw less enthusiasm for internationalisation or globalisation.
Faced with massive disruption to international trade due to war, rising foreign debt and a period of global depression in the 1930s, many countries including Australia used high tariffs to repel imports and to protect their local producers.
� 1947–70s. In 1947, the previous situation started to change slowly. The General Agreement of Tariffs and Trade (GATT) was signed after the end of World War II. This had the aim of gradually reducing high tariffs which were an obstacle to international trade and global economic development. Between 1947 and 1972, world tariffs on manufactured goods fell from an average of 37.5 per cent to only 9 per cent (Australia did not follow the trend, choosing to maintain high rates of protection). Again, foreign investment and multinationals took off and free trade blocs (e.g. the European Economic Community or European Union as it is now known) started to emerge. These encouraged globalisation.
� 1970s–2007. Starting in the early 1970s with Labor Prime Minister Whitlam’s 25 per cent tariff cuts, the Australian Government began dismantling our system of protection. Accelerated microeconomic reforms, the encouragement of industry restructuring and further tariff cuts followed in the 1980s, 1990s and 2000s. Further tariff cuts by Australia occurred in 2005 and others are scheduled to 2010 and beyond. Elsewhere in the world, there were other important developments that helped globalisation including the establishment of new trading blocs (e.g. APEC, NAFTA, CER, the expanded EU) that were committed to tariff reductions and the idea of free trade. From 1995 on, this idea was reinforced by the World Trade Organization (WTO). By the 2000s, more than one-third of the world’s GDP was produced by foreign-owned companies and/or destined for overseas markets. Indeed, about 30 per cent of global economic activity is now created by the largest 200 companies (e.g. Microsoft, McDonald’s, IBM, General Electric, Exxon, Ford, General Motors, Nike, Shell), many adding more value annually to production than the entire GDPs of some countries (see figure 9.1).
Figure 9.1 Comparing the annual size of GDP in selected countries with the annual value added in production by large multinationals ($ billions), 2000
Note: * denotes estimate only
Sources: Data mostly derived from ‘How big are the big multinational companies?’ by Paul De Grauwe and Filip Camerman (2002).
16040 80 120 240 280 320 360 400 4402000
India
Australia
Russia
Indonesia
Israel
Singapore
Microsoft*
Chile
Wal-Mart Stores
General Motors
Ford Motor Co.
Mitsubishi
DaimlerChrysler
Shell
BP
Romania
Nippon T&T
Ukraine
AXA
General Electric
Vietnam
Toyota
Kuwait
ING Group
Deutsche Bank
IBM
Uruguay
Annual value of a country’s GDP or a multinational’s value added in production (US$ billions)
Cou
ntr
y o
r c
om
pan
y

Economics Down Under Book 1284
9.2 Reasons for economic globalisation There are many reasons that may help to explain the global-isation of business activity across national borders. However,globalisation basically stems from a desire to lift efficiency, cutcosts and lift profits and incomes.
GLOBALISATION HELPS MINIMISE LABOUR COSTSIn some labour-intensive industries (e.g. areas such as clothing,aspects of car manufacture, rubber production, toy making),wages represent the largest input cost for businesses. Given thatin some countries, labour is relatively dear while in others it ischeap, firms go hunting around the world in search of goodsupplies of docile and diligent workers. Looking at figure 9.2which compares average hourly levels and legal minimumhourly wages in different nations, it is hardly surprising thatsome firms take their operations offshore and move fromcountry to country. Currently, for example, many labour-intensive (i.e. as opposed to capital-intensive) areas of manufac-
turing and other types of production are located in countriessuch as Mexico, China, India, Sri Lanka and Indonesia wherehourly pay rates are between $0.30 and $2.00. In some cases(e.g. Mexico, Thailand and China), wages have actually fallenover the last decade, causing companies to review their locationstrategy. Furthermore, given that investment or money capitalcoming from richer nations is quite mobile and can be movedfairly readily, setting up a factory overseas where labour is cheapcan help boost company profits above levels that would haveapplied in the country of origin. Despite this trend, there arealso instances where improved labour efficiency in high-wagecountries has actually attracted industries back home byaffecting their comparative cost advantage. In figure 9.2 below,wage rates for all countries are compared as a percentage ofthose in the US where workers are paid average hourly wagerates of $22 or 100 per cent, or 100 points. In Mexico, forinstance, wage rates are only 10 per cent of the US, or 10 pointsmeasured in terms of the wage index, whereas in Denmark, theyare 145 per cent of US wages.
Pay packet
Name:
Time:
Amount:
.......................
.......................
...................
Denmark
Germany
Belgium
Netherlands
Sweden
Luxembourg
France
Australia
Canada
Italy
Spain
New Zealand
Asian industrialised
Taiwan
Brazil
Mexico
Hong Kong
Portugal
Singapore
Israel
OECD average
Ireland
Japan
United Kingdom
United States
Europe average
Austria
Finland
Switzerland
Norway
0 20 40 60 80 100 120 140 160
Index of wage rates (% of average wage in US)
International comparisons of hourly wage rates using an index(expressed as a % of US hourly wage = base of 100 points or $22), 2003
100 = base of $22 per hour

CHAPTER 9 Economic globalisation 285
Figure 9.2 Where in the world can firms find the lowest wage or labour costs?
Source: Data for the graph derived from US Bureau of Labour Statistics and other sources. Data for the table derived mainly from Wikipedia, the free encyclopedia.
GLOBALISATION INCREASES ACCESS TO NATURAL RESOURCESSome countries have very limited access to cheap naturalresources (e.g. minerals and agricultural land). Here we think ofSingapore, Britain, Taiwan and Switzerland. However, given theease of moving money capital and the desire by businesses to cutcosts and maximise profits, some firms relocate elements ofproduction abroad.
GLOBALISATION HELPS FIRMS GAIN ECONOMIES OF LARGE SCALEGlobalisation can help companies to grow bigger. For somefirms, large-scale production is cheaper than small productionruns. This is because fixed production costs (i.e. costs that do notrise much as output increases including research, advertising,product development, some aspects of management and, up toa point, equipment) can be spread more thinly over a greatervolume of sales. In cases where the size of the local market issmall, firms that expand their operations overseas can oftenlower their costs, improve efficiency and raise profitability. Thespreading of a firm’s fixed costs over higher annual levels ofoutput to gain economies of scale is illustrated in figure 9.3.
Sometimes economies of scale are possible because of theinternational integration of firms. Sometimes, this is done byhorizontal integration. Here, firms are joined together in the sameindustry (e.g. a beer company overseas with a beer company athome). At other times, firms are joined through verticalintegration downward or upward in different, but perhaps relatedindustries (e.g. an iron ore firm overseas combining with a steelproducer in the home country).
Figure 9.3 Globalisation can increase economies of large-scale production (i.e. reduce fixed costs of production per unit of output)
GLOBALISATION TAKES ADVANTAGE OF GOVERNMENT POLICIESGlobalisation of companies enables some firms to take advan-tage of government policies in both their home country and inthe country they visit. For instance, there is the willingness ofsome governments to:� pay out generous subsidies� provide lower tax rates and other concessions (e.g. cheap
power, water, transport) to producers� ignore environmental concerns and protect firms from imports.
COMPARISONS OF LEGAL MINIMUM WAGES IN SELECTED COUNTRIES
Ranked comparisons of legal minimum hourly wage rates or labour costs for manufacturing workers
Approximate US$ per hour (mostly for
2006 or 2007)
Ranked comparisons of legal minimum hourly wage rates or labour costs for manufacturing workers
Approximate US$ per hour (mostly for
2006 or 2007)
1. Ireland 11.25 10. Argentina 2.00
2. France 10.80 11. Taiwan 2.00
3. Australia 10.50 12. Russia 1.50
4. United Kingdom 10.00 13. Estonia 1.30
5. Canada 8.00 14. Pakistan 0.90
6. Japan 5.60 15. China 0.60
7. Brazil 5.40 16. India 0.40
8. United States (average) 5.15 17. Sri Lanka No minimum
9. South Korea 3.72 18. Indonesia No minimum
TAKE IN FIGURE 9.3
3
2
1
0
0 1 2 3 4 65
An
nu
al
fixed
cost
per u
nit
of
ou
tpu
t p
rod
uced
($
)
A firm’s annual level of production/sales
High perunit cost
Low perunit cost
Maximum economies of large scaleFew economies of scale
Notice that the per unit cost of each extra unit of production by this firm falls from $3.00 to only $1.00 as the company raises its annual production and sales from 1000 units to 5000 units. At higher levels of output, fixed costs can be spread more thinly. Exporting can help local firms justify higher output levels and can enable them to move from point A to point B on the fixed cost curve. This helps increase profits and competitiveness.
Fixedcostcurve
A
B

Economics Down Under Book 1286
All of these aspects can help to seduce overseas companies torelocate offshore in search of improved profits. For instance,some well-known multinational chemical, car and electroniccompanies have acted for these sorts of reason. More specifi-cally, a French multinational tyre manufacturer didn’t like itsgovernment’s decision to introduce indicative economic plan-ning some years back so it set up three plants overseas for everyone factory it built at home.
GLOBALISATION HELPS TO MINIMISE TRANSPORT COSTSThe actual setting up of subsidiary plants in key markets aroundthe world can sometimes help to lower shipping and othertransport costs. Again this can boost profits.
GLOBALISATION INCREASES FLEXIBILITY IN DECISION-MAKINGSometimes, companies become globalised to improve the flexi-bility or choice they have in decision-making about productionand investment. For instance, BHP–Billiton, Ford and Fiat haveplants located around the world. It is claimed by some that thisgives them advantages because they can move or source aspectsof production (e.g. engine assembly, car panels) wherever theoverall costs of specific operations are lowest.
9.3 The effects of economic globalisation for Australia
A few years back at the World Economic Forum, Nelson Man-dela posed the question: ‘Is globalisation only to benefit thepowerful and the financiers, speculators, investors and traders?Does it offer nothing to men, women and children who are rav-aged by the violence of poverty?’
Indeed, globalisation has become a hotly debated issue inrecent times as to whether it is a good or bad thing for the worldeconomy generally and individual economies in particular.Before looking at the costs and benefits, it is worth remem-bering that here, in Australia (as in many other countries),globalisation has meant dramatic change including:
� a move towards free trade with a need for much greater inter-national competitiveness
� increased specialisation of local production in areas of com-parative cost advantage
� better efficiency in resource allocation usually involving lessgovernment regulation and a greater reliance on marketforces
� the deregulation of the capital, financial, communications,transport and other markets to improve efficiency by encour-aging competition in these markets
� improved efficiency and cost-cutting through the restructuringof private and government businesses
� the widespread application of new technology
� the growth of globalised multinational businesses where pro-duction is sourced from the cheapest supplier in the world
� the fact that the success or otherwise of government policies, workerproductivity and business competitiveness is judged by inter-national yardsticks including the reaction of global markets towhat we do and how we perform.
Unfortunately, when it comes to judging the effects of global-isation, opinion is divided and conclusive evidence is thin. Tosome, it is a ‘panacea’ while, for others, it is a catastrophe. Perhapsthis reflects the fact that globalisation impacts on particular groupsand countries in different ways. However, for a moment, let us takea look at some of the good and bad effects on Australia’s economy.
TRY APPLIED ECONOMICS 2, p. 305EXERCISE

CHAPTER 9 Economic globalisation 287
THE EFFECT ON AUSTRALIA’S INFLATIONPerhaps the main benefit of the most recent wave of global-isation during the 1990s and 2000s is that Australian consumershave been able to buy better quality goods and services at lowerprices. Table 9.1 shows the dramatic 70 per cent fall in theinflation rate during the period 1990 to 2006 (i.e. with global-isation) as against the high levels during the period 1970 to1989 (i.e. before the last wave of globalisation). While reducedinflation is not solely the result of government policies thathelped to internationalise and globalise the Australian economy(e.g. tariff cuts, labour market deregulation, privatisation, com-petition policy involving the ACCC, deregulation of the capitalmarket, tax reform), these measures certainly helped.
It is likely that exposing Australia’s local and foreign-ownedfirms to greater international competition forced them toimprove quality and become more cost efficient. In turn, thishelped our companies to face up to imports and enabled someto avoid takeovers by multinationals looking for a new home.
THE EFFECT ON AUSTRALIA’S RATE OF ECONOMIC GROWTH Among other things, tariff cuts, the adoption of freer trade andthe easing of restrictions on foreign investment by theAustralian Government since the latter 1980s, has increased oureconomy’s exposure to globalisation. Supporters of global-isation claim that the widespread use of these policies hashelped to lift our rate of economic growth (GDP). Theirreasoning goes something like this: � Greater openness involving lower tariffs and less protection
has forced Australia to allocate resources more efficiently intoareas of production where we have a comparative cost advan-tage. Greater efficiency lifts economic growth because moreoutput is produced from fewer inputs of resources.
� Lower tariffs force Australian firms to cut production costsand lift efficiency in order to survive and compete againstimports. Some firms will then be able to grow by earningmore income from rising exports sales. This helps to boosteconomic growth.
Comparisons of Australia’s inflation rate before and during the most recent wave of globalisation
Sources: Data derived from ABS 1350.0 and RBA Occasional Paper No. 8.
PERIOD OF TIMEANNUAL AVERAGE
INFLATION RATE (%)
Average annual inflation rates ‘before’ the wave of globalisation, 1970–1989
Average annual inflation rates ‘during’ the last wave of globalisation, 1990–2006
Table 9.1
Economics Down Under Book 1288
� Lower tariffs mean that it is cheaper for Australian firms toimport new equipment, and use more up-to-date andefficient technology in their production.
� In the long term, protection of local industry onlyencourages slackness, inefficiency and waste of resources.
� The encouragement of foreign investment (by easing restric-tions on the international movement of money capital) hashelped to lift the total level of business investment in Aus-tralia. This boosts our productive capacity and increases econ-omic growth (GDP).
� Lower tariffs (resulting from cuts by most governments hereand around the world) have caused our exports to grow fasterthan otherwise. For Australia between 1984–85 and 2005–06,exported production rose from only 14 per cent of GDP tonearly 20 per cent of GDP. Indeed, exported GDP has grownalmost 60 per cent faster than the rest of the economy.By boosting Australia’s efficiency, competitiveness and exports,
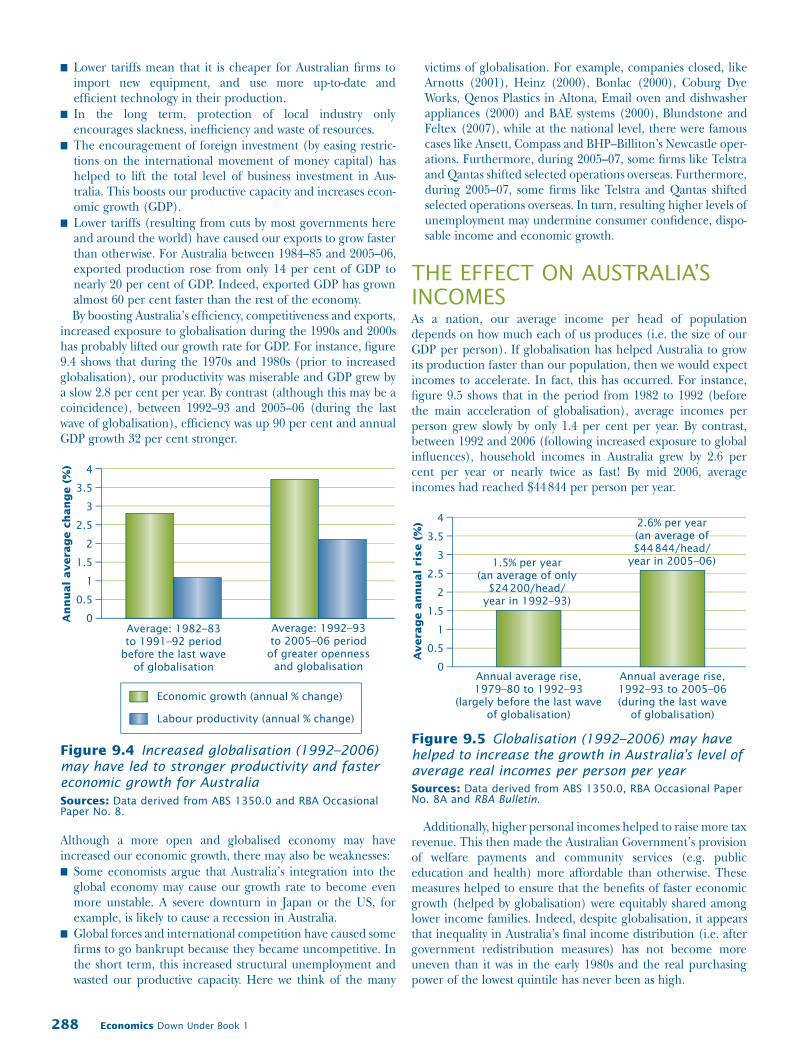
increased exposure to globalisation during the 1990s and 2000shas probably lifted our growth rate for GDP. For instance, figure9.4 shows that during the 1970s and 1980s (prior to increasedglobalisation), our productivity was miserable and GDP grew bya slow 2.8 per cent per year. By contrast (although this may be acoincidence), between 1992–93 and 2005–06 (during the lastwave of globalisation), efficiency was up 90 per cent and annualGDP growth 32 per cent stronger.
Figure 9.4 Increased globalisation (1992–2006) may have led to stronger productivity and faster economic growth for Australia
Sources: Data derived from ABS 1350.0 and RBA Occasional Paper No. 8.
Although a more open and globalised economy may haveincreased our economic growth, there may also be weaknesses: � Some economists argue that Australia’s integration into the
global economy may cause our growth rate to become evenmore unstable. A severe downturn in Japan or the US, forexample, is likely to cause a recession in Australia.
� Global forces and international competition have caused somefirms to go bankrupt because they became uncompetitive. Inthe short term, this increased structural unemployment andwasted our productive capacity. Here we think of the many
victims of globalisation. For example, companies closed, likeArnotts (2001), Heinz (2000), Bonlac (2000), Coburg DyeWorks, Qenos Plastics in Altona, Email oven and dishwasherappliances (2000) and BAE systems (2000), Blundstone andFeltex (2007), while at the national level, there were famouscases like Ansett, Compass and BHP–Billiton’s Newcastle oper-ations. Furthermore, during 2005–07, some firms like Telstraand Qantas shifted selected operations overseas. Furthermore,during 2005–07, some firms like Telstra and Qantas shiftedselected operations overseas. In turn, resulting higher levels ofunemployment may undermine consumer confidence, dispo-sable income and economic growth.
THE EFFECT ON AUSTRALIA’S INCOMESAs a nation, our average income per head of populationdepends on how much each of us produces (i.e. the size of ourGDP per person). If globalisation has helped Australia to growits production faster than our population, then we would expectincomes to accelerate. In fact, this has occurred. For instance,figure 9.5 shows that in the period from 1982 to 1992 (beforethe main acceleration of globalisation), average incomes perperson grew slowly by only 1.4 per cent per year. By contrast,between 1992 and 2006 (following increased exposure to globalinfluences), household incomes in Australia grew by 2.6 percent per year or nearly twice as fast! By mid 2006, averageincomes had reached $44 844 per person per year.
Figure 9.5 Globalisation (1992–2006) may have helped to increase the growth in Australia’s level of average real incomes per person per year
Sources: Data derived from ABS 1350.0, RBA Occasional Paper No. 8A and RBA Bulletin.
Additionally, higher personal incomes helped to raise more taxrevenue. This then made the Australian Government’s provisionof welfare payments and community services (e.g. publiceducation and health) more affordable than otherwise. Thesemeasures helped to ensure that the benefits of faster economicgrowth (helped by globalisation) were equitably shared amonglower income families. Indeed, despite globalisation, it appearsthat inequality in Australia’s final income distribution (i.e. aftergovernment redistribution measures) has not become moreuneven than it was in the early 1980s and the real purchasingpower of the lowest quintile has never been as high.
4
3.5
3
2.5
2
1.5
1
0.5
0
Economic growth (annual % change)
Labour productivity (annual % change)
An
nu
al
averag
e c
han
ge (
%)
Average: 1982–83to 1991–92 period
before the last waveof globalisation
Average: 1992–93to 2005–06 period
of greater opennessand globalisation
4
3.5
3
2.5
2
1.5
1
0.5
0
Averag
e a
nn
ual
ris
e (
%)
Annual average rise,1992–93 to 2005–06
(during the last waveof globalisation)
Annual average rise,1979–80 to 1992–93
(largely before the last waveof globalisation)
1.5% per year(an average of only
$24 200/head/year in 1992–93)
2.6% per year(an average of$44 844/head/
year in 2005–06)

CHAPTER 9 Economic globalisation 289
THE EFFECTS ON AUSTRALIA’S LABOUR MARKET
Since 1991 and the acceleration of globalisation, there has been adramatic change in Australia towards a more deregulated labourmarket. For instance, the federal government has encouraged thespread of enterprise bargaining and productivity(efficiency)-based workplace agreements (on a firm-by-firm basis), the simpli-fication and scaling back of the minimum wage system, the pro-motion of union amalgamation, the erosion of union influence inwage negotiations and relaxed the unfair dismissal laws, especiallyfor smaller firms employing fewer than 100 staff. All this wasintended to help make our workers and wage system more inter-nationally competitive. However, the effects of these measures onunemployment and the labour market varies. Workers in competi-tive and efficient firms and industries where the growth in salesand profits are strong, have gained better incomes and careerpaths. Nevertheless, those in internationally uncompetitive partsof the economy have suffered in the short to medium termsbecause of structural unemployment resulting from internationalexposure and its associated policies. Some of these changes in thelabour market are summarised in the panel below.
THE EFFECT ON AUSTRALIA’S FINANCIAL MARKETSDuring the 1980s, 1990s and 2000s, Australian financial marketswere deregulated and exposed to global pressures, competitionand judgements about the success of the Australian economy incontrolling inflation. In the foreign exchange market whereinternational currencies are swapped, the dollar was ‘floated’ sothat the exchange rate was decided by demand and supply. Inthe market for borrowing and lending credit, foreign banks andsome building societies were allowed to set up in competitionwith the main local banks and interest rates were no longer setby the Reserve Bank. In addition, financial markets were increas-ingly affected by the movement of large amounts of moneycapital and investment, both in and out of Australia. Thisexposed our markets to volatile developments overseas. Despitethis problem of greater instability and accountability, one benefitof global exposure and competition is that local interest rates(i.e. the cost of credit) have probably remained lower thanwould otherwise have been the case. This is good news forborrowers of credit (e.g. households, businesses) but less favour-able to lenders.
THE EFFECT ON CONSUMER CHOICEIn some ways, globalisation and internationalisation haveexpanded the range of consumer choice when buying goods andservices. This is because households and businesses are fairlyfree to buy whatever they like in markets around the world. Thesurge of e-commerce via the Internet, makes shopping andbanking as easy as a click of a mouse, provided there is the know-how and ownership of computers. In fact, it was claimed thatover 60 per cent of new Ford sales in the US were via theInternet. Despite the convenience, this raises the questions ofboth equity and quality in making choices. In addition, there areconcerns about whether, eventually, choice will be diminished asmore efficient multinational companies come in and destroylocal competitors and their product uniqueness.
Some effects of globalisation on the labour market
� There is a widening gap in market incomes and wages between those unskilled workers on minimum wages and those on enterprise agreements. During the 1990s and 2000s, the latter group of workers have gained average rises 2–3 times greater than those on minimum wages.
� There are growing numbers of part-time jobs relative to full-time jobs because employers seek greater flexibility in staffing.
� Some groups of workers are disadvantaged in wage negotiations in the workplace (e.g. often females, non-English-speaking employees, part-time workers, the inarticulate and uneducated).
� There has been a dramatic decline in unionism in Australia (i.e. to only 18 per cent in 2006 for the private sector) and around the world due partly to greater competition in labour and other markets. This means that unions are less able to take action to protect wages from being driven down towards the low levels existing in poorer countries.

Economics Down Under Book 1290
THE EFFECT ON GOVERNMENT
AND NATIONAL SOVEREIGNTYThe drive towards globalisation and internationalisation in the1990s and 2000s has impacted in several ways on Australia’sgovernment. Foremost, the government must select itseconomic management policies more carefully to ensure thatthese measures keep inflation down and government budgets incheck. Failure to do so could create awful consequences for
the economy, brought about by the judgements made byinternational markets and investors.
In Australia’s case, tighter control over budget spending hasrecently strengthened our international credit rating.
Another consequence of globalisation and visits by multi-national companies is the decline in national sovereignty.Foreign investors buy up Australian assets (e.g. resources, prop-erty, utilities, formerly locally owned company icons that werehousehold names to older generations including the makers ofAeroplane Jelly, Vegemite, Rosella and Kraft). The rising tideof private foreign debt and the huge CAD partly indicate thisloss of control over businesses and assets by Australians. Somewriters argue that these worries make government policy evenmore complicated and may present a problem during periodsof war or international conflict.
Finally, globalisation and the freer movement of people,goods, services and capital, present the government with someother very difficult issues — how to control the spread of ter-rorism (e.g. 11 September, 2001; Bali bombings 2002) and thespread of weapons of mass destruction, illegal hard drugs,crime, worsening global pollution, global warming, disease (e.g.SARS) and massive shifts of illegal immigrants that could swampan economy’s resources and infrastructure. Without effectivegovernment regulation, all these things could seriously under-mine our non-economic living standards or quality of life.
TRY APPLIED ECONOMICS 3, p. 305EXERCISE
TRY ONE OF THE TEAM 1, 2, 3, p. 306DEBATES
TRY THE ESSAY p. 306
TRY RESEARCH AND 1, 2, p. 307ANALYSIS

CHAPTER 9 Economic globalisation 291
9.4 A case study of a multinational corporation in Australia — Nestlé
This case study is about Nestlé, which is a well-known multi-national corporation that operates in Australia.
THE HISTORY AND EXPANSION OF NESTLÉ1867–1905
The Nestlé company is named after its Swiss founder, HenriNestlé. In 1867, Henri, a trained pharmacist, developed ahealthy and inexpensive milk-based food for babies who wereunable to be breastfed. He called this product Farine LactéeHenri Nestlé. It quickly proved to be a success in savingbabies’ lives at a time of very high infant mortality and malnu-trition. In 1874, Jules Monnerat purchased the Nestlé companyand launched its own condensed milk product in competitionwith the Anglo-Swiss Condensed Milk Company which hadstarted operations in 1866. Then, in the early 1880s, DanielPeter, a friend and neighbour of Henri Nestlé, invented milkchocolate and started up the leading company in this area.Shortly after, the chocolate company started by Daniel Petermerged with Nestlé. The company developed an even morediversified range of products. Later on, Nestlé joined forceswith a company owned by Julius Maggi, another Swiss firm thathad developed instant soups, sauces and meat cubes.
1905–18
Nestlé’s clear strategy of expansion and diversification throughresearch and acquisition of firms continued when, in 1905, itmerged with the Anglo-Swiss Condensed Milk Company. Soon,it began to open factories in the United States, Britain, Ger-many, Spain and Australia (the largest overseas market at thetime). It also operated warehouses in Singapore, Hong Kongand Bombay to supply the growing Asian market. While WorldWar I disrupted its European sales, due to milk shortages andtransport difficulties, it did mean an expanded demand forproducts because of government contracts. The company wasforced to rely more on its 40 overseas plants in the United Statesand elsewhere.
1918–45
The end of war in 1918 created challenges for Nestlé. Govern-ment contracts for condensed and powdered milk dried up, thecivilian population returned to consuming fresh milk, the costof raw materials rose sharply, there was a post-war globalrecession, exchange rates moved unfavourably and the companyrecorded its first loss. Following company reorganisation andrestructuring by a leading Swiss banker, prosperity and expan-sion returned. The 1920s and 1930s saw company productdiversification outside its two main areas of milk and chocolate.The range expanded to include malted milk, Milo (a productdeveloped in Australia) and a powdered buttermilk for infants.However, the most interesting development was the invention ofinstant coffee. This involved eight years of research and wasaimed at reducing Brazil’s huge surplus of coffee beans. It wasan ‘instant’ success and the market grew so that, today, nearly
4000 cups are served throughout the world every second ofevery day of every year. In the early 1940s, ‘Nestea’ was alsoadded to the product range.
1945–74
Between the end of World War II and 1974 marked the begin-ning of Nestlé’s most rapid period of expansion. This involveddiversification into soups, seasonings, jams, tinned fruit, frozenfood and cosmetics, along with further company acquisitionsincluding Alimentana S.A., Crosse and Blackwell, Findus,Libby’s, Stouffer’s and L’Oreal.
1975–81
This period of optimism soon faded in the early to mid 1970s.This was caused by the collapse of economic growth inindustrialised countries, an appreciation of the Swiss francwhich slowed exports, and the quadrupling of the cost of coffeebeans (1975–77). Although the company’s traditional marketscontracted, those in the developing world helped to offset thedownturn. Another response by Nestlé was to diversify outsidefood products as a way of creating a more stable cash flow. Itpurchased a United States pharmaceutical company, a bravemove in uncertain times.
1981–2007
Between 1981 and 1995, Nestlé set out to consolidate andrestructure its financial position by selling its unprofitable oper-ations. More recently from the mid 1990s up to 2007, Nestlé’sposition in the global market was helped by world events — thewidespread cuts in tariffs, trade liberalisation and expansion,the opening up of central and eastern Europe as well as China,and the dramatic rise of international investment flows. Inaddition, there was the growth of free trade areas including theNorth American Free Trade Agreement (NAFTA), the Organi-sation for Economic Cooperation and Development (OECD),extension of the European Union (EU) and monetary union,Closer Economic Relations (CER) and other free tradeagreements (e.g. with the US, Thailand, Singapore) and theattempted Multilateral Agreement on Investment (MAI). Againthe company increased its product range by purchasingadditional firms including Italian mineral water company,Pellegrino. Valio (ice-cream), Spillers Petfoods, Purina,Carnation Milk and Jenny Craig. Being a well-diversified multi-national corporation, these global events had a favourableimpact on sales and profits.
THE SIZE AND STRUCTURE OF NESTLÉ INTERNATIONAL TODAYIn 2006, Nestlé had over 487 factories employing over253 000 workers in more than 80 countries.
Its annual sales were in excess of 91 billion Swiss francs(i.e. where one franc equals A$1, with annual global salesequal to around 10 per cent of Australia’s entire GDP) andprofits of over seven billion francs. Both sales were up 6 percent and profits rose nearly 44 per cent over the last three

Economics Down Under Book 1292
years. This easily makes it the largest food company in theworld selling dairy products, bottled water, instant roast andground coffees, mineral water, coffee substitutes, infant foods,breakfast foods, soups, pasta, sauces, frozen food, ice-cream,
yogurt, confectionery, food services, pet care, food ingredients,ophthalmological products and cosmetics. Some of the com-pany’s vital statistical details are summarised in figure 9.6(p. 000).
Figure 9.6 Nestlé products and sales
Source: Data derived from Nestlé website.
GLOBAL INDICATORS FOR NESTLÉ 1998 2005
1. Value of sales (billion Swiss francs) 72 91
2. Value of food sales in Africa, Asia and Oceania (billion Swiss francs)
12.4 15.7
3. Value of food sales in Europe (billion Swiss francs) 26.8 27.6
4. Value of food sales in Americas 22.6 30.8
5. Value of non-food sales (billion Swiss francs) 10 16.5
6. Trading profit (billion Swiss francs) 7.1 8.9
7. Trading profit as % of sales 9.9 8.8
8. Market capitalisation (billion Swiss francs) 117 153
9. Global employment ’000 workers) 225.8 253
10. Spending on research and Development (billion Swiss francs) 0.7 N/A
11. Number of injuries with lost time per million hours worked 14 (2001) 7
12. Water consumption (m3) 7.6 (2001) 4.4
13. Energy consumption (gigajoules) 3.4 (2001) 2.4
14. Greenhouse gas emissions (kg CO2 per tonne delivered) 178 (2001) 118
15. Ozone depleting substances (g R-11 equiv.) 1.1 (2001) 0.28
35
30
25
20
15
10
5
0
Sw
iss f
ran
cs (
bil
lion
s)
Comparison of Nestlé product sales by globalregion or market (billion Swiss francs, 2005)
Americas Europe Africa, Asiaand Oceania
Other non-
food activities
Milk
pro
ducts,
nutritio
n and ice
-cre
am
30
25
20
15
10
5
0Sw
iss f
ran
cs (
bil
lion
s)
Beve
rage
s
Pet ca
re
Prep
ared
dishe
s an
d
cook
ing
aids
Cho
colate
, con
fectio
nary
and
bisc
uits
Phar
mac
eutic
al
prod
ucts
Comparison of Nestlé product range bysales importance (billion Swiss francs, 2005)

CHAPTER 9 Economic globalisation 293
THE REASONS FOR GLOBAL EXPANSION AND THE STRATEGIES USED BY NESTLÉAs indicated earlier, Nestlé grew in several ways: � being innovative in product development through research
in the area of processed foods� by means of company mergers and often horizontal inte-
gration with firms in the same or similar industry� by means of acquisitions of companies allowing for market
and product diversification to gain a more regular flow ofincome.
Globalisation of operations appeared to be a logical and naturalprocess for Nestlé:� The merger with the Anglo-Swiss Condensed Milk Company
in 1905 provided it with its first international operations. Thisgrew in subsequent years across many countries on severalcontinents.
� The disruptions to transport and raw materials caused byWorld War I encouraged growth and production outsideEurope, especially in the United States where milk supplieswere readily available.
� Innovation by Nestlé gave the company a cost and technologicaladvantage unmatched by its rivals anywhere in the world.
� Expansion gave Nestlé economies of large scale in inno-vation, plant and technology, product development and R&D,sales and marketing, and product distribution.
� Production facilities were located in the company’s mainmarkets in the United States, Australia and Europe. Produc-tion was commenced in countries where sales were greatest orwhere company acquisitions suited the expansion strategyrather than trying to take advantage of countries wherelabour was cheap.
� Nestlé’s expansion appears to have been enabled by the cre-ation of a range of products and brand names, often made byalready well-established companies that were trusted for theirquality. In this sense, their international market for products,which was expanded by global corporate acquisitions, wasalready proven.
THE RELATIONSHIPS BETWEEN NESTLÉ INTERNATIONAL,ITS AUSTRALIAN OPERATIONS AND THE AUSTRALIAN ECONOMYNestlé Oceania is an offshoot of Nestlé International which hasits headquarters in Switzerland. Mention has been made alreadyof Nestlé’s commencement of production here in 1908. Therewas also the addition in 1934 of Milo to its international productrange. This was a locally invented food. Indeed, the world nowconsumes over 21 million cups of Milo per day! By 2001, NestléAustralia:� employed around 5000 workers in production, sales and
distribution
� had operations located in over 20 towns throughout mostStates in Australia with is headquarters for Oceania in Sydney
� sold $2.4 billion of food and beverages (up 40 per cent in thefour years from 1997) under popular brands such as Nescafé,Milo, Nesquick, Sunshine Milk, Kit Kat, Maggi, Nestlé Yogurtand chocolates, Peters, Lean Cuisine, Buitoni, Minties, LifeSavers, Allens, Papa Giuseppi’s, Lucky Dog, Friskies and Go-cat
� exported $427 million of value-added processed foodproducts to destinations including Asia (56 per cent), Japan(23 per cent), Pacific Islands (11 per cent), New Zealand(8 per cent) and China (2 per cent)
� injected over $1 billion into the Australian economy throughthe payment of wages to employees, the provision of training,expenditure on research and development, support ofcommunity projects, and the purchase of goods and servicesfrom other companies that it needed for its manufacturingprocesses and distribution
� contributed substantially to federal, state and local govern-ment taxation revenues.
Some of the statistical details relating to Nestlé’s Oceania oper-ations are summarised in figure 9.7.
Figure 9.7 Vital statistics about Nestlé Australia
and Oceania
(continued)
Adelaide
Brisbane
Canberra
Melbourne
Launceston
Sydney
Smithtown
Blacktown
Blayney
Tongala
Broadford
Pakenham
Echuca
Maryborough
Mulgrave
Lane Cove
Campbellfield
Dennington
Gympie
Foods
Confectionery
Dairy Products
Pet Food
Beverages
Plants:
Sales office and distribution facilities – Headquarters for Oceania region
Sales offices only
Perth
Comparison ofNestlé Oceania
export sales byglobal region/market
(% of all exports)
Comparison ofNestlé Oceania
product sales by categoryin 2001 (%)
New Zealand (8%)
Asia (56%)
China (2%)Pacific
Islands(11%)
Japan (23%) Coffee
(22.2%)Culinary(10%)
Pet food
(7.8%)
Other (23.6%)
Confectionery(25.3%)
Ice-cream(11.1%)

Economics Down Under Book 1294
Source: Data derived from Nestlé website.
9.5 The effects of globalisation on low-income countries
Debate rages about the effects of globalisation and multinationalcorporations on low-income countries like China, India, Uganda,Nigeria, Thailand, Vietnam, Chad, South Africa and Bangla-desh. Some researchers claim that these developments havehelped to lift living standards and hope for millions of people,while others say that they have only added to the misery of theworld’s poor. Much of this disagreement about the effects ofglobalisation reflects the technical weaknesses of the statisticalevidence used by each side in the debate. Additionally, global-isation seems to have been more beneficial for some regionsand countries (e.g. in Asia), while creating problems for others(e.g. in Africa generally).
SOME POSSIBLE BENEFITS OF GLOBALISATION FOR POOR COUNTRIESMany economists believe that the last wave of globalisation(perhaps from the 1980s to at least to 2007) has been an impor-tant development that has helped to improve the wellbeing ofthe countries most involved. Their research has tried to provethis from many different angles and using a host of arguments.Let us examine some of their claims.
Globalisation has lifted economic
growth and the speed of rises in GDP
per person
There are many logical reasons why globalisation should help tolift the GDP and incomes per person per year (reflecting theactual purchasing power or living standards of individuals) inpoor countries.
Higher investment and access to technologyRapid rises in GDP and incomes largely depend on high levelsof business investment in capital equipment and buildingsincorporating the latest technology). Investment (financed byhousehold saving) helps to lift the efficiency of labour andnatural resources, so that each worker per hour can produce
more. It grows a country’s productive capacity or expands theproduction possibility frontier. Unfortunately, however, in low-income countries, investment and savings are very low becausehousehold production is at subsistence levels. However, global-isation has helped to overcome these problems. It has meantgreater openness and fewer government controls on the inflowof direct investment or money capital from rich to poor coun-tries. This inflow includes the introduction of new moreefficient technology. Capital inflow has also allowed local busi-nesses in these countries to expand faster. It is not just theexpansion of overseas firms that occurs but opportunities arecreated for growing small-scale local firms in related industries.Overall, this has helped some poorer countries to escape theoppressive poverty cycle that otherwise would follow (see figure9.11 and explanation p.298).
More jobs and lower unemployment rate.
In some countries like Zimbabwe, Turkmenistan, Nepal, Libyaand Namibia where there is little globalisation, unemploymentrates are very high ranging between 30 and 80 per cent of thelabour force. There are also similar percentages of peopleworking very few hours per day, well below their productivecapacity (i.e. high levels of underemployment). In turn, giventhe general absence of government welfare in poor countries,this lack of employment means low income and poverty. How-ever, following globalisation with higher levels of investment andbusiness expansion (even if this is by multinationals), more jobs,higher incomes and better living standards develop. Indeed, thewages paid by multinationals in low- and middle-income coun-tries are around 1.8–2.0 times higher than the average wage inthose countries. This raises living standards.
Greater efficiency in using resources
Without exception, low-income countries use their resourcesvery inefficiently. There is little output per person from theresources available, and so the nation’s productive capacity isrestricted. Greater openness, associated with globalisation andfreer trade (without tariffs and subsidies), cause countries toallocate or direct resources into specific areas of production,where they have a comparative cost advantage. That is, they pro-duce the types of goods and services that they are most efficient
Australian indicators for Nestlé 1997 2001
Value of Oceania sales (A$ billions) 1.71 2.4
Employed workers 5000 N/A
Value of all Oceania exports (A$ millions) 254 427
Value of investment in Australia/Oceania (A$ millions) 100 N/A
Planned value of overseas investment in 500 N/A
Australia/Oceania in the next 5 years (A$ millions)
Injection of money each year into the Australian 900 1200
economy through wages, purchases of supplies (est.)
(A$ millions)
TRY APPLIED ECONOMICS 4, p. 305EXERCISE
TRY THE MULTIPLE- p. 303CHOICE TEST
TRY THE REPORT ON p. 306AN INVESTIGATION
TRY COLLECTION AND 3, p. 14ANALYSIS OF NEWSPAPERS

CHAPTER 9 Economic globalisation 295
at making. This means that a bigger output, GDP or income,can then be produced from the same inputs or resources, andso poverty falls and welfare improves.
Globalisation has slowed inflation and increased purchasing powerInflation (i.e. generally rising prices paid for goods and servicesincluding food, building materials, steel, fertiliser, equipment,medicines, communications and electrical appliances) is mostlikely to be worse when there is weak competition (e.g. whengovernment businesses or a private monopoly control most ofthe output of an industry). Globalisation (and with it, lowertariffs) deliberately expose the economy to greater levels ofcompetition and business rivalry. This helps to limit inflationand protect the purchasing power of household incomes.Indeed, inflation was highest with rates often between 20 and200 per cent a year, in countries with low levels of globalisation(e.g. Angola, Eritrea, Ghana, Tajikistan, Zambia and Zim-babwe). By contrast, inflation was lowest with rates usually lessthan 3 per cent a year, in economies with greater exposure toglobalisation (e.g. China, India, Vietnam, United States, Aus-tralia, France, Japan and Singapore).
Globalisation reduces war and terrorism caused by povertyPoverty feeds the endless cycle of misery, sickness, despair, dis-content, war and terrorism. However, if globalisation can liftGDP and average incomes above poverty levels, it would have avery positive effect on the lives of many people in the worldtoday and lead to peace.
Globalisation makes governments more accountable and efficientGovernments play a critical role in most economies. Theyallocate scarce resources to provide health, education, water,communications, law and other services. In so doing, theycontribute to national production and living standards. Unfor-tunately, many governments, especially in low-income countries,are non-democratic (i.e. they are not elected by a majority of thepeople), inefficient, corrupt, incompetent and use their militarypower for squashing opponents and promoting their ownpolitical survival. However, because globalisation requiresgreater openness and exposure to the judgements of the outsideworld, it can help to make these governments far more account-able for their policies and improve the daily living standards ofordinary people.
Perhaps most importantly, some studies have tried to show thatthe rate of growth in GDP per head (i.e. a rough measure of theyearly rise in the level of average economic well-being or incomeper person) is faster in more globalised, open countries, than inthose that have had little exposure to the effects of global-isation. One such researcher (Axel Dreher) calculated a singleindex to measure the degree of globalisation. It was made up ofmany economic, social and political indicators for123 countries covering the years 1970–2000. This index wasthen compared to the average rate of growth in GDP ($) perhead, to see if there was some relationship. Indeed there was astrong connection. As shown in figure 9.8 covering 1996–2000,countries with low levels of globalisation only experienced anaverage rise in their value of production per person a year of1.16 per cent, against a rise of 2.04 per cent (i.e. about 75 percent faster) for those countries with relatively high levels ofglobalisation. Figure 9.8 also reveals the same sort of success for
globalisation, in all four periods investigated — 1981–85, 1996–90, 1991–95 and 1996–2000. As a specific example, this researchnoted that China’s index of globalisation rose by 2.14 per centbetween 1975 and 2000, causing its growth rate in GDP perhead to be an impressive 2.33 per cent higher than otherwise.By contrast, countries with low globalisation like Rwanda (withthe lowest globalisation index of only 0.92) that isolated them-selves from the rest of the world, had one of the slowest ratesof rise in economic wellbeing and further rises in its povertyrates. However, despite these impressive observations, manyresearchers note that, on its own and without suitable changesin other government policies, globalisation is not enough to liftincomes and abolish poverty.
Figure 9.8 The faster rate (%) of growth in GDP per person per year in countries with higher globalisation indexes than for those with lower globalisation
Source: Data derived from Does globalisation affect growth? by Axel Dreher (2002–03).
INDEX OF GLOBALISATION
Examples (high) Examples (low)
US 6.48 Pakistan 2.43
UK 5.62 Morocco 2.42
Germany 5.28 Uganda 2.31
Australia 5.08 Iran 2.08
Hong Kong 4.78 Albania 1.96
Spain 4.05 Saudi Arabia 1.84
Malaysia 3.54 Congo, Democratic Rep.
1.70
Brazil 3.17 Nepal 1.69
Indonesia 3.08 Papua New Guinea 1.37
China 3.04 Madagascar 1.28
India 2.78 Haiti 0.94
Thailand 2.64 Rwanda 0.92
3
2.5
2
1.5
1
0.5
0
Countries with low globalisation
Countries with high globalisation
Averag
e r
ate
sof
ris
e p
er y
ear (
%)
Rise in GDP
per head,1981–85
Rise in GDPper head,1986–90
Rise in GDPper head,1991–95
Rise in GDPper head,
1996–2000
Economics Down Under Book 1296
Globalisation has reduced poverty
and made basic goods and services
more affordable for the poor
If it is true that average incomes per person a year have increasedfaster with globalisation, have the lives of the poor benefited orhave the gains gone mostly to the rich? This question and how itis measured, is hotly debated. While some research shows a widergap between low- and high-income earners in many poor coun-tries (and in the world generally), there appears to have been abig decline in the number of people in poverty, especially incountries where there has been faster globalisation. Here, povertyrepresents the percentage of the population with incomes belowthe poverty line as measured by national statistics. It was foundthat the least globalised economies had much higher povertyrates than the more globalised countries. For example, the lowglobalised parts of Africa and eastern Europe (countriesincluding Zimbabwe, Zambia, Mozambique and Tajikstan), hadmassive poverty rates of between 60 and 86 per cent of their popu-lations in 2006. By contrast, more globalised countries such asChina, Vietnam, Indonesia, India, Taiwan, Malaysia, US, UK andAustralia had lower rates of between 1 and 25 per cent. Inaddition to poverty rates, the United Nations measures welfarelevels by comparing the percentage of people on incomes of lessthan $1 per day (allowing for different exchange rates and thepurchasing power or prices in various countries). This indicator(and a similar one for those on less than $2 per day) shows asignificant drop in the rates of low incomes for most regions inthe world, especially the more globalised countries. Even so, therehave been rises recorded in the percentage of population in somenations on less than $1 per day, especially in less globalisedcountries in sub-Saharan Africa.
Globalisation has helped to lift the
human development index and
improve daily lives
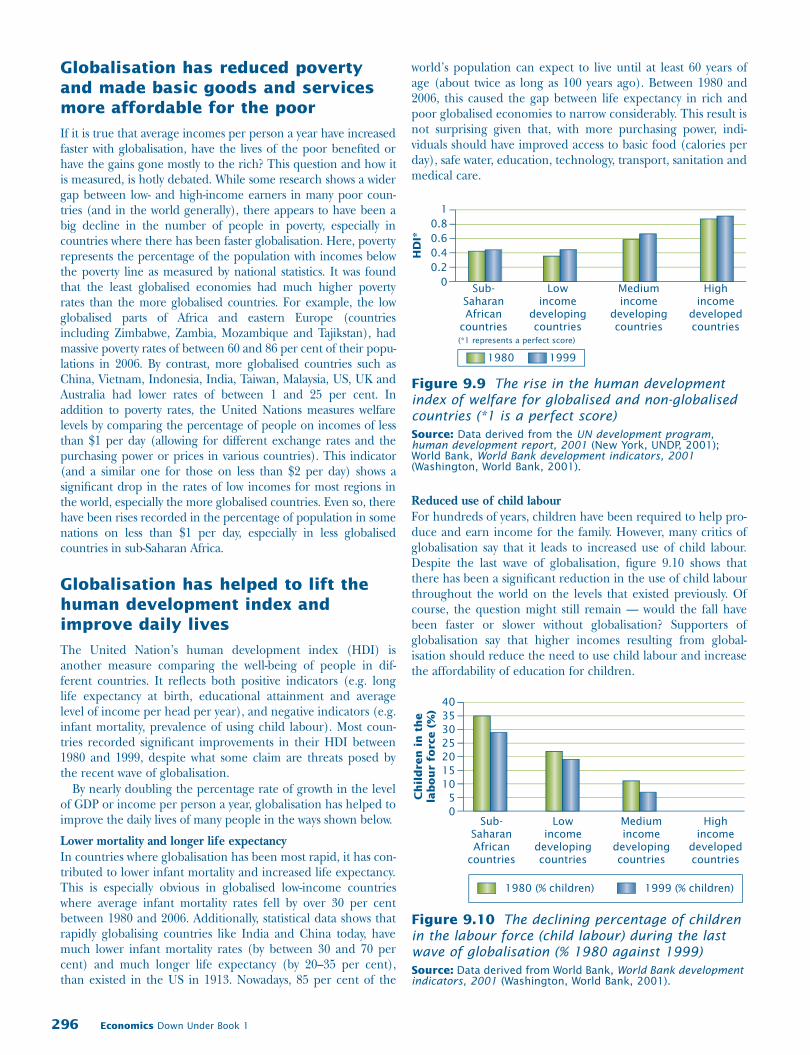
The United Nation’s human development index (HDI) isanother measure comparing the well-being of people in dif-ferent countries. It reflects both positive indicators (e.g. longlife expectancy at birth, educational attainment and averagelevel of income per head per year), and negative indicators (e.g.infant mortality, prevalence of using child labour). Most coun-tries recorded significant improvements in their HDI between1980 and 1999, despite what some claim are threats posed bythe recent wave of globalisation.
By nearly doubling the percentage rate of growth in the levelof GDP or income per person a year, globalisation has helped toimprove the daily lives of many people in the ways shown below.
Lower mortality and longer life expectancy
In countries where globalisation has been most rapid, it has con-tributed to lower infant mortality and increased life expectancy.This is especially obvious in globalised low-income countrieswhere average infant mortality rates fell by over 30 per centbetween 1980 and 2006. Additionally, statistical data shows thatrapidly globalising countries like India and China today, havemuch lower infant mortality rates (by between 30 and 70 percent) and much longer life expectancy (by 20–35 per cent),than existed in the US in 1913. Nowadays, 85 per cent of the
world’s population can expect to live until at least 60 years ofage (about twice as long as 100 years ago). Between 1980 and2006, this caused the gap between life expectancy in rich andpoor globalised economies to narrow considerably. This result isnot surprising given that, with more purchasing power, indi-viduals should have improved access to basic food (calories perday), safe water, education, technology, transport, sanitation andmedical care.
Figure 9.9 The rise in the human development index of welfare for globalised and non-globalised countries (*1 is a perfect score)
Source: Data derived from the UN development program, human development report, 2001 (New York, UNDP, 2001); World Bank, World Bank development indicators, 2001 (Washington, World Bank, 2001).
Reduced use of child labour
For hundreds of years, children have been required to help pro-duce and earn income for the family. However, many critics ofglobalisation say that it leads to increased use of child labour.Despite the last wave of globalisation, figure 9.10 shows thatthere has been a significant reduction in the use of child labourthroughout the world on the levels that existed previously. Ofcourse, the question might still remain — would the fall havebeen faster or slower without globalisation? Supporters ofglobalisation say that higher incomes resulting from global-isation should reduce the need to use child labour and increasethe affordability of education for children.
Figure 9.10 The declining percentage of children in the labour force (child labour) during the last wave of globalisation (% 1980 against 1999)
Source: Data derived from World Bank, World Bank development indicators, 2001 (Washington, World Bank, 2001).
1
0.8
0.6
0.4
0.2
0
HD
I*
Sub-
Saharan
African
countries
(*1 represents a perfect score)
Low
income
developingcountries
Mediumincome
developingcountries
Highincome
developedcountries
1980 1999
40
35
30
25
20
15
10
5
0Sub-
Saharan
African
countries
Low
income
developingcountries
Mediumincome
developingcountries
Highincome
developedcountries
1980 (% children)
Ch
ild
ren
in
th
e
lab
ou
r f
orce (
%)
1999 (% children)

CHAPTER 9 Economic globalisation 297
Increased daily food intakeIn general, the availability of adequate food (measured by theaverage number of calories of food intake per day) in poorcountries increased between 1960 and 2006. The rise was nearly40 per cent in low-income developing countries, but thisexcludes sub-Sarahan Africa where there was a miserable rise ofonly about 6 per cent. In addition, some say that globalisation(and the reduction of tariffs), has meant cheaper more afford-able food imports for low-income countries (as well as lowerprices generally for most household consumer items likeclothing and other manufactured goods). Despite the fright-ening 76 per cent growth in their populations between 1970 and2000, the total number of people suffering from chronic under-nourishment in low-income developing countries apparentlyfell from 35 per cent (920 million people) to 17 per cent(790 million people). This suggests that some of the improve-ments in food intake in poor countries were at least shared ordistributed across their populations, to those in great need.
SOME POSSIBLE COSTS OF GLOBALISATION FOR POOR COUNTRIESCritics of globalisation (often non-economists), refuse toaccept all the impressive claims made by the supporters ofglobalisation.
Unreliable statistical data limits
conclusions about globalisation
It has been said, ‘there are lies, damn lies, and statistics’, and that‘figures will show whatever you want if you torture them enough’.The claim has been made that the statistical data compiled bysome countries and used by the World Bank, the United Nationsand others, to show the supposed benefits of globalisation, canbe unreliable and may lead to misleading conclusions.
Globalisation may not be the driver or
cause of economic progress
Depending on how it is defined, it is possible that globalisationmay not be the factor that is driving improvements in economicgrowth and poverty reduction. Lots of other events like govern-ment microeconomic efficiency reforms may have also played arole in accelerating growth, and improving income and livingstandards. Additionally, some countries that are quoted as goodexamples of more globalised economies (e.g. India, China, SouthKorea, Vietnam), started to have faster economic growth in theyears before they could be properly classified as globalised.
Globalisation has increased the
exploitation of workers
In recent years, the media and various action groups have helpedto raise our awareness about the effects of some multinationalcorporations on workers in Asia (e.g. Indonesia, Thailand andVietnam) and parts of Africa where wages and conditions are notprotected by enforced labour laws (e.g. minimum wages and ageof workers). For example, despite the high prices charged for
their products and often glitzy advertising images, and codes ofethical conduct projected by several major sporting and exclusiveclothing manufacturers, it seems that some of their workers havebeen exploited. Frequently, despite huge hours of work, pay is solow that it barely covers the rent, and leaves little for buying foodor medicine. The employment of child labour is all too common,disrupting the education of the young. Additionally, someworkers lead miserable lives in factory sweatshops and urbanghettos, where their bosses use threats and even violence to meettheir production and cost targets.
In response to these and other criticisms from the media, themultinationals have often claimed that they are changing theirpolicies. Apparently, some were attempting to only source theirsupplies from factories that met acceptable international labourstandards (e.g. not employing children under 15 years of age).Additionally, some companies pointed out that while pay ratesappear very poor by Western standards, they are relatively goodfor low-income countries. In this way, globalised firms mayactually be raising average incomes and reducing poverty ratesin poorer countries.
Globalisation emphasises profitable
cash crops for international markets
at the expense of basic food for locals
Globalisation and trade can help to lift the incomes of somefarmers in the poor countries of Africa. This is why somefarmers in low-income nations choose to grow internationalcash crops (rice, sugar, coffee, rubber) that fetch good prices.However, sometimes this means that the production of cheapbasic food items for the local community is neglected, becauseprofits here are relatively lower. Besides, poor people on lowincomes (often less than $1 per day) cannot compete with thehigh prices paid abroad in richer countries. As a result, localfood consumption is often inadequate and some people starveor are undernourished.
Globalisation accelerates world
inequality
The gap in incomes between those in the poorest 20 per cent ofcountries and those in the richest 20 per cent, has increasedfrom a ratio of 1:30 in 1960, to around 1:80 in the year 2002. Itis claimed that globalisation has helped rich countries morethan the poorer ones (although some commentators acknowl-edge that wars and natural disasters have also played a role inlowering average incomes in some countries and regions).
Globalisation has undermined local
culture and national identity
For some, globalisation stands for Americanisation or Western-isation, with all its imperfections. This places it in conflict withlocal cultures and national identities. Globalisation means thatsome countries are losing their unique identity or difference,and their ability to determine their destiny and who they are(e.g. as defined by their religion, language, education, values,traditions, dress, food and clothing). Such a monoculture is notdesirable or beneficial for society generally.

Economics Down Under Book 1298
Globalisation has worsened environmental damage in poor countries
Some critics of globalisation are greatly worried about its environ-mental effects and unsustainability. Here there are severalconcerns. For instance, there are examples of multinationalmining, chemical and other manufacturing companies thatdeliberately set up plants in poorer countries overseas (e.g. India,China, Indonesia, Papua New Guinea or Mexico) to avoid thetougher pollution and emission standards in their home country.This helps to cut their costs and raise profits. The countries theyare visiting are often reluctant to strengthen controls, becausethey fear they will suffer economically if the company pulls out.Despite this claim, it is still a matter of debate about whether ornot locally owned corporations are any more environmentallyresponsible in their conduct, than foreign business visitors.
Globalisation may lead to social unrest
If the differences in incomes between the world’s rich and poorare growing and become even more obvious through mediaimages (as is the case according to some), then according toProfessor Wade of the London School of Economics, this maypose a real worry.� To improve their financial position, will the politically
powerful in low-income countries try to extract even moreincome from the poor, or become more corrupt to achievetheir own financial goals?
� Will the educated leave poor countries (i.e. a ‘brain drain’that has disastrous economic effects) and seek illegal entryinto richer countries?
� Will the failure to share the world’s resources more fairly leadto illegal mass migration that could weaken the economies ofrich countries?
� Will frustration and a feeling of injustice, inequality andjealousy, promote international terrorism, directed againstrich nations?
ON ITS OWN, GLOBALISATION IS NOT ENOUGHDespite its strengths, globalisation on its own, can do little to helppoor countries escape daily poverty. More is needed, involvingchanges in policy by both rich and poor nations, and no oneshould pretend that the task ahead would be easy or quick.
Growing productive capacity in poor
countries
Poor countries have very limited resources and often use theminefficiently. For example, they face problems like high unem-ployment, a lack of skilled labour, low levels of investment inequipment and technology, poor efficiency, often corrupt andincompetent governments and the inadequate provision ofbasic infrastructure (e.g. roads, power, water, sewerage, schools,communications, hospitals). These problems limit their level ofnational output and reduce the size of their productionpossibility frontiers (see pp. 5–6). The task then is to grow theproduction possibility frontier (i.e. shift it outward) and GDPmore quickly, through new policies and strategies.
Lifting national savings and
investment to break the poverty cycle
As mentioned, Third World nations have low subsistence levelsof income and high levels of poverty. After purchasing basicnecessities, little or no household income remains for saving.However, without saving (either by households, firms or govern-ments), there is no finance for investment in capital equipmentthat is needed to start and grow businesses, or provide govern-ment infrastructure, unless there is a rise in borrowing. Even ifcredit is available, it is very expensive. This is reflected in highinterest rate repayments. In turn, this makes starting privatebusinesses almost impossible and most households lack thebasic requirements for gaining a credit rating so that they areeligible for borrowing from a bank. In addition, if governmentsborrow, there is the ongoing burden of repayments. In turn,with low levels of investment in equipment and new technology,labour output per hour worked (i.e. efficiency) is very small
CHAPTER 9 Economic globalisation 299
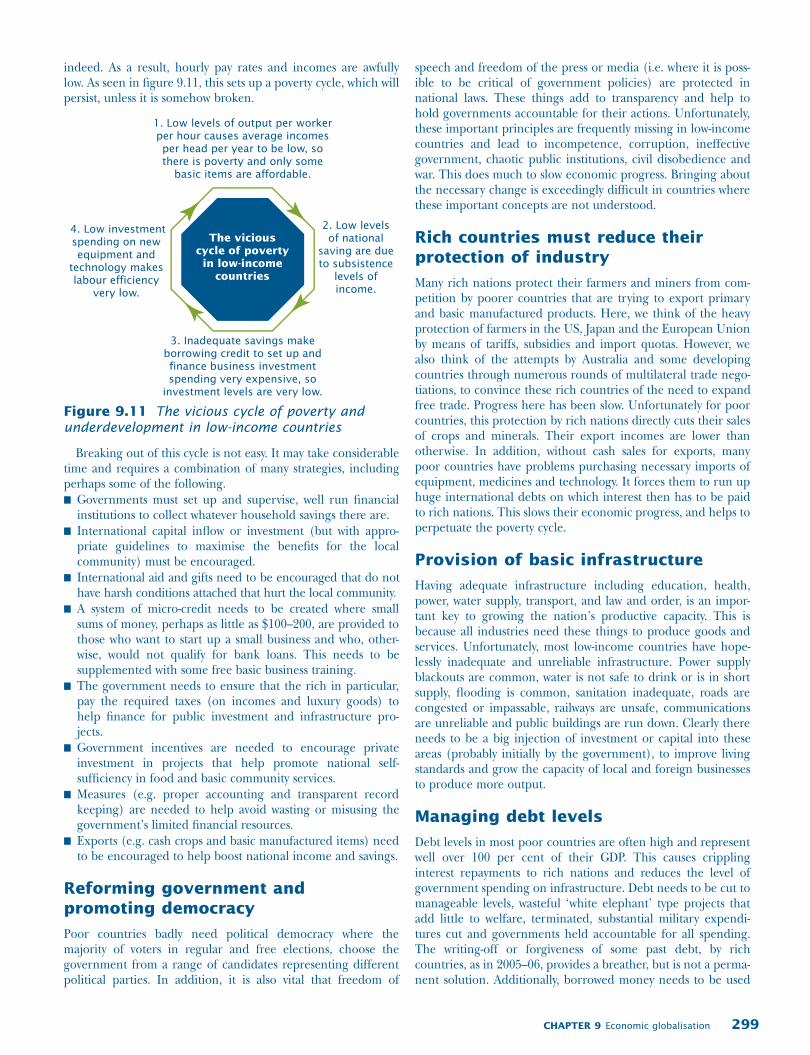
indeed. As a result, hourly pay rates and incomes are awfullylow. As seen in figure 9.11, this sets up a poverty cycle, which willpersist, unless it is somehow broken.
Figure 9.11 The vicious cycle of poverty and underdevelopment in low-income countries
Breaking out of this cycle is not easy. It may take considerabletime and requires a combination of many strategies, includingperhaps some of the following.� Governments must set up and supervise, well run financial
institutions to collect whatever household savings there are.� International capital inflow or investment (but with appro-
priate guidelines to maximise the benefits for the localcommunity) must be encouraged.
� International aid and gifts need to be encouraged that do nothave harsh conditions attached that hurt the local community.
� A system of micro-credit needs to be created where smallsums of money, perhaps as little as $100–200, are provided tothose who want to start up a small business and who, other-wise, would not qualify for bank loans. This needs to besupplemented with some free basic business training.
� The government needs to ensure that the rich in particular,pay the required taxes (on incomes and luxury goods) tohelp finance for public investment and infrastructure pro-jects.
� Government incentives are needed to encourage privateinvestment in projects that help promote national self-sufficiency in food and basic community services.
� Measures (e.g. proper accounting and transparent recordkeeping) are needed to help avoid wasting or misusing thegovernment’s limited financial resources.
� Exports (e.g. cash crops and basic manufactured items) needto be encouraged to help boost national income and savings.
Reforming government and
promoting democracy
Poor countries badly need political democracy where themajority of voters in regular and free elections, choose thegovernment from a range of candidates representing differentpolitical parties. In addition, it is also vital that freedom of
speech and freedom of the press or media (i.e. where it is poss-ible to be critical of government policies) are protected innational laws. These things add to transparency and help tohold governments accountable for their actions. Unfortunately,these important principles are frequently missing in low-incomecountries and lead to incompetence, corruption, ineffectivegovernment, chaotic public institutions, civil disobedience andwar. This does much to slow economic progress. Bringing aboutthe necessary change is exceedingly difficult in countries wherethese important concepts are not understood.
Rich countries must reduce their
protection of industry
Many rich nations protect their farmers and miners from com-petition by poorer countries that are trying to export primaryand basic manufactured products. Here, we think of the heavyprotection of farmers in the US, Japan and the European Unionby means of tariffs, subsidies and import quotas. However, wealso think of the attempts by Australia and some developingcountries through numerous rounds of multilateral trade nego-tiations, to convince these rich countries of the need to expandfree trade. Progress here has been slow. Unfortunately for poorcountries, this protection by rich nations directly cuts their salesof crops and minerals. Their export incomes are lower thanotherwise. In addition, without cash sales for exports, manypoor countries have problems purchasing necessary imports ofequipment, medicines and technology. It forces them to run uphuge international debts on which interest then has to be paidto rich nations. This slows their economic progress, and helps toperpetuate the poverty cycle.
Provision of basic infrastructure
Having adequate infrastructure including education, health,power, water supply, transport, and law and order, is an impor-tant key to growing the nation’s productive capacity. This isbecause all industries need these things to produce goods andservices. Unfortunately, most low-income countries have hope-lessly inadequate and unreliable infrastructure. Power supplyblackouts are common, water is not safe to drink or is in shortsupply, flooding is common, sanitation inadequate, roads arecongested or impassable, railways are unsafe, communicationsare unreliable and public buildings are run down. Clearly thereneeds to be a big injection of investment or capital into theseareas (probably initially by the government), to improve livingstandards and grow the capacity of local and foreign businessesto produce more output.
Managing debt levels
Debt levels in most poor countries are often high and representwell over 100 per cent of their GDP. This causes cripplinginterest repayments to rich nations and reduces the level ofgovernment spending on infrastructure. Debt needs to be cut tomanageable levels, wasteful ‘white elephant’ type projects thatadd little to welfare, terminated, substantial military expendi-tures cut and governments held accountable for all spending.The writing-off or forgiveness of some past debt, by richcountries, as in 2005–06, provides a breather, but is not a perma-nent solution. Additionally, borrowed money needs to be used
The vicious
cycle of poverty in low-income
countries
1. Low levels of output per worker per hour causes average incomes per head per year to be low, so there is poverty and only some
basic items are affordable.
2. Low levels of national
saving are due to subsistence
levels of income.
4. Low investment spending on new equipment and
technology makes labour efficiency
very low.
3. Inadequate savings make borrowing credit to set up and finance business investment spending very expensive, so
investment levels are very low.

Economics Down Under Book 1300
efficiently for projects that bring widespread improvements inthe capacity of the economy to produce goods and services thatencourage national self-sufficiency and independence.
Reducing inequality in income and
wealth
Income inequality is often larger in poor countries (e.g. the Ginicoefficient is between 0.5 and 0.7 in Namibia, Central AfricanRepublic, Zambia, Papua New Guinea and Nigeria), than in richnations (e.g. the Gini is less than 0.35 in Australia, Canada, US,UK, Japan). Frequently, inequality is reinforced by unequalownership of land, official corruption, the absence of democracy,closed markets, state and private monopolies, special favoursinvolving deals with the government and the abuse of social,political and economic power. Democratic governments can bestdeal with economic inequality by introducing fairly progressiveincome taxes, promoting proper competition in markets tocheck personal greed, tacking corruption, and providing basiccommunity services.
Reducing population pressures
Population in some low-income countries is growing quickly atmore than double the rate of high-income nations (some ofwhich actually have declining populations). This places greatstrain on the government’s provision of infrastructure andservices including transport, water, education, law and health.However, the great burden created by population pressures canbe eased. Historical experience tells us that birthrates slow andfamilies get smaller if there are improvements in general health(e.g. clean water supply and control of malaria) and educationstandards, and by lowering the child mortality (death) rate. Thisis because apart from common ignorance about family planningand health matters, to some extent, large families often reflect theuncertainties of infant survival and old age, in countries wherethere is no government welfare system (e.g. age pensions).
Tackling unemployment and idle
resources
Unemployment and underemployment (workers operatingbelow their productive capacity) are huge problems in mostpoor countries. Rates can be as high 80–90 per cent as inZimbabwe, Nauru and Liberia, for example. In part, theproblem reflects a lack of investment, political instability, anuneven distribution of land ownership, inadequate skills,training and education, a poor business climate where invest-ment is low, and the absence of government infrastructure orservices. Mention has already been made about possiblesolutions to many of these problems.
IS THERE AN ALTERNATIVE TO
GLOBALISATION? Is there an alternative to the full acceptance of globalisation?According to some, the answer to this question is ‘yes’. Anumber of protestors and opponents of globalisation (and itsmain body, the World Trade Organization or WTO) have pro-posed a different and supposedly more beneficial way to helplow-income countries escape poverty. For example, in her
article, ‘Time to replace globalisation’ (2004), Caroline Lucas ofthe Greens–European Free Alliance in the European Parlia-ment, is critical of globalisation. She raises a number of issues.� She argues that globalisation is based on the Darwin-type
theory of competition, survival of the fittest, the race to thebottom (who can have the lowest production costs), greed bythe richer nations and the unsustainability of globalisation’smaterial emphasis. She also claimed that globalisation isbased on ‘myths’ that she tries to expose, one by one. Thesemyths include the following:– globalisation is the only alternative path to economic devel-
opment– globalisation’s progress is inevitable– globalisation is good for the poor– comparative cost advantage is the most efficient way to use
resources– more globalisation means more jobs.
� She outlines an alternative to the failed and unsustainablesystem of globalisation. She calls her proposal, ‘localisation’which is more or less the exact opposite to globalisation. Thisis explained as ‘a set of interrelated and self-reinforcingpolicies that actively discriminate in favour of the more local’.Localisation helps to provide an economic and politicalframework for people, community groups and local busi-nesses to rebuild and rediversify their economies that havebeen partly destroyed by exposure to uncontrolled inter-national free market competition. She believes that thefollowing proposals will also help to rebuild social cohesion incommunities and help to heal environmental damage causedby the unsustainable practices of some greedy multinationals.It is not based ‘. . . on competition for the cheapest, but oncooperation for the best . . . ’. Promoting this ideal couldinvolve the introduction of following measures: – the selective use of tariffs and import quotas to give infant
industries a chance to get established– controlling capital or investment flows, along with tax
evasion by multinationals– giving preference to producers and suppliers that manufac-
ture locally (i.e. ‘site here to sell here’)– developing a local competition policy to eradicate protected
monopolies that push up prices and exploit consumers– trying to increase the level of democratic involvement in
decision making, both economically and politically– introducing ecological taxes on energy, polluters and users
of non-renewable resources– redirecting international aid and trade rules (e.g. those set
down by the WTO) so they are more flexible and friendliertowards building sustainable local industry and nationaleconomies
– encouraging rich nations to show far greater internationalleadership, and adopting a more ethical and responsibleposition.
TRY APPLIED ECONOMICS 5, p. 305EXERCISE
TRY COLLECTION AND 1, 2, p. 312ANALYSIS OF NEWSPAPERS
TRY WATCHING A VIDEO p. 315

CHAPTER 9 Economic globalisation 301
9.6 The nature and effect of Australia’s foreign aid
Foreign aid represents the transfer of funds and other types of assistance
by governments and private individuals from high income to lower
income countries. If used properly, aid can be an important way ofhelping poor countries to improve their living standards. Mostimportantly, this assistance can help to break the vicious cycle ofpoverty and raise per capita incomes. It does this by raising thefunds available for investment, lifting efficiency and acceleratingproductive capacity.
There are three types of foreign aid summarised below:
Figure 9.12 (below) shows Australia’s level and direction ofgovernment foreign aid for 2005–06 which totalled $2491million. The largest recipients of our foreign aid include PapuaNew Guinea, Indonesia, Solomon Islands, Regional Pacific,Vietnam, Africa, Middle East and Central Asia, and China.Figure 9.12 also compares aspects of levels of foreign aid inselected countries. Impressive as this may seem, it is sad knowingthat many other countries are far more generous with theirforeign aid programs as judged by the ratio of aid to GDP. InAustralia’s case, this is a mere 0.26 per cent of our GDP.
Figure 9.12 Snapshot of foreign aid donated by the Australian Government, 2005–06
(continued)
The three forms of foreign aid
1. Loans. There are three types of loans — hard loans or credit offered at the normal market rate of interest; soft loans offered at a special discounted interest rate; and tied loans, where conditions are imposed such as requiring that the money be used to purchase exports from the donor country. Of these, soft loans are probably the most beneficial for the recipient country.
(continued)
2. Grants. Grants are straight-out donations of cash that do not need to be repaid. When used wisely, this is perhaps the best type of help that high income countries can offer.
3. Technical and other assistance. This involves the donor country providing scientific, economic, educational, technical, industrial, agricultural or military personnel. With the possible exception of the latter group, these people advise on matters relating to economic development.
400100 200 300 6005000
Thailand
Naiuru (additions funding)
Kiribati
Tonga
Laos
Samoa
Sri Lanka
Regional south Asia
India
Bangladesh
Vanuatu
East Timor
Cambodia
Regional East Asia
China
Philippines
Middle East and Central Asia
Africa
Vietnam
Regional Pacific
Solomon Islands
Indonesia
Papua New Guinea
A$ (millions)
Key destinations of Australian Governmentforeign aid for 2005–06 ($ millions — excludes private aid)

Economics Down Under Book 1302
Source: Graph data derived from Year Book Australia, 2006 ABS 1301.0. Table data derived from CIA Factbook.
NET GOVERNMENT FOREIGN AID FOR SELECTED COUNTRIES, 2005–06
COUNTRY
AMOUNT OF GOVERNMENT FOREIGN
AID DONATED (US$ MILLIONS) COUNTRY
AMOUNT OF GOVERNMENT FOREIGN
AID DONATED (US$ MILLIONS)
1. Japan 8900 7. Italy 1000
2. United Kingdom 7900 8. Australia 894
3. United States 6900 9. South Korea 423
4. Denmark 2000 10. Portugal 271
5. Norway 1400 11. New Zealand 99
6. Switzerland 1100 12. Lesotho 4
TRY APPLIED ECONOMICS 6, p. 306EXERCISE
TRY COLLECTION AND 3, p. 314ANALYSIS OF NEWSPAPERS
TRY TEAM DEBATES 4, 5, 6, p. 306

and learning activities
CHAPTER 9 Economic globalisation
9.7 School Assessment tasks
303
school a
ssessm
ent ta
sks a
nd
learn
ing
activ
ities
In order to satisfactorily complete VCE Economics Unit 2, part 2,the teacher must decide whether a student has demonstrated theachievement of the specified key knowledge and key skills forOutcome 2 (see details on p. 228). The teacher’s decision shouldreflect results from school-based assessment. Generally, this
should take place as part of the normal teaching and learningprogram. In addition, most assessment will be completed in classunder a limited time frame. With this in mind, teachers mayselect from an appropriate range of tasks that could include thefollowing.
A range of these activities has been provided in the following pages.
MULTIPLE-CHOICE test questionsUsing the multiple-choice answer grid below, select the letter (A, B, C, D) thatrepresents the most appropriate answer for each question by marking it with a tick (�).
Answer grid
Question 1Economic globalisation involves:A multinational and transnational companiesB the movement of money capital and production from country
to countryC a move towards the creation of a single international market
for particular goods or servicesD all of the above features.
Question 2Concerning economic globalisation, which statement is generallyfalse?A The process has been under way now for over 200 years.
B The process did not start until the 1940s.C The process did not start until the 1980s.D The process did not start until the 1990s.
Question 3The process of economic globalisation has not been helped by:A the continued existence of tariffs and other government
controls in different economiesB market deregulation in Australia and elsewhereC cheap electronic communication and faster transport
systemsD international differences in the cost of labour and other
resources needed for production.
SCHOOL ASSESSMENT TASKS AND LEARNING ACTIVITIES
1. Multiple-choice and short-answer tests 9. Case studies
2. Folio of applied economics exercises 10. Report of an investigation
3. Analysis of written, visual and statistical evidence 11. Web quests
4. Essays 12. Web page design
5. Debates 13. Simulations
6. Presentations(oral, multimedia, visual, posters)
14. A folio of economic exercises using print or electronic materials
7. Multimedia presentations 15. Problem-solving tasks
8. Role plays
QUESTION 1 2 3 4 5 6 7 8 9 10 11 12
A
B
C
D
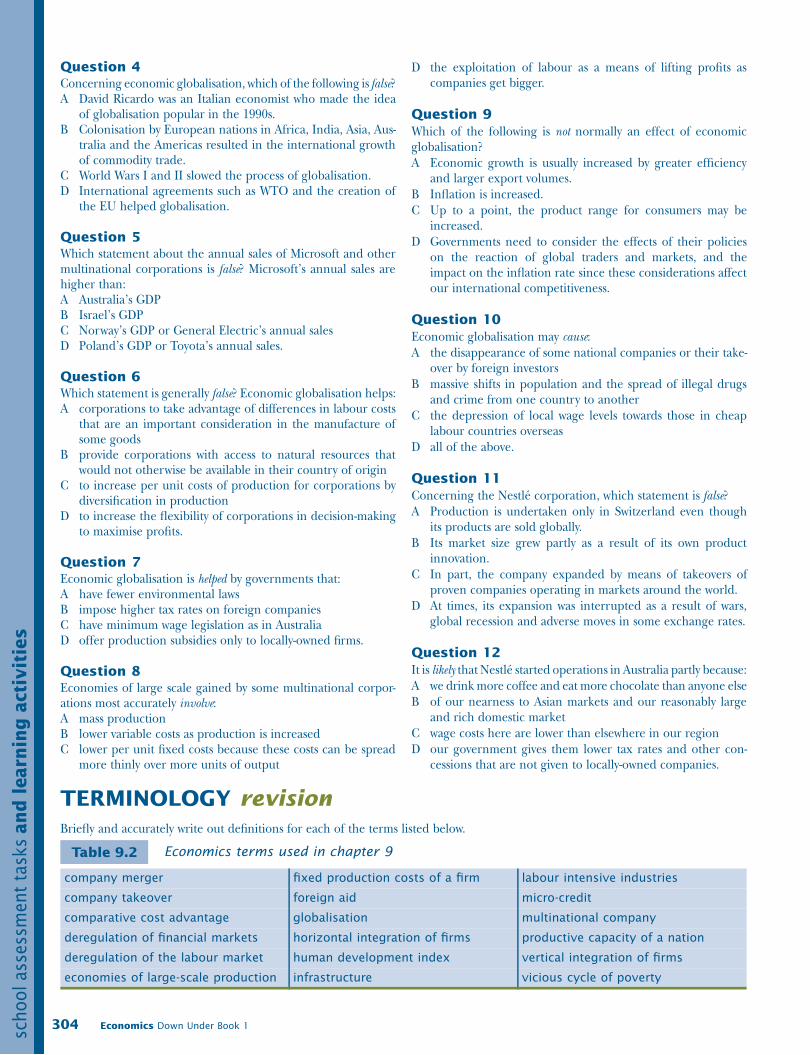
Economics Down Under Book 1304
school ass
ess
ment
task
s an
d l
earn
ing
acti
vit
ies
Question 4Concerning economic globalisation, which of the following is false?A David Ricardo was an Italian economist who made the idea
of globalisation popular in the 1990s.B Colonisation by European nations in Africa, India, Asia, Aus-
tralia and the Americas resulted in the international growthof commodity trade.
C World Wars I and II slowed the process of globalisation.D International agreements such as WTO and the creation of
the EU helped globalisation.
Question 5Which statement about the annual sales of Microsoft and othermultinational corporations is false? Microsoft’s annual sales arehigher than:A Australia’s GDPB Israel’s GDPC Norway’s GDP or General Electric’s annual salesD Poland’s GDP or Toyota’s annual sales.
Question 6Which statement is generally false? Economic globalisation helps:A corporations to take advantage of differences in labour costs
that are an important consideration in the manufacture ofsome goods
B provide corporations with access to natural resources thatwould not otherwise be available in their country of origin
C to increase per unit costs of production for corporations bydiversification in production
D to increase the flexibility of corporations in decision-makingto maximise profits.
Question 7Economic globalisation is helped by governments that:A have fewer environmental lawsB impose higher tax rates on foreign companiesC have minimum wage legislation as in AustraliaD offer production subsidies only to locally-owned firms.
Question 8Economies of large scale gained by some multinational corpor-ations most accurately involve:A mass productionB lower variable costs as production is increasedC lower per unit fixed costs because these costs can be spread
more thinly over more units of output
D the exploitation of labour as a means of lifting profits ascompanies get bigger.
Question 9
Which of the following is not normally an effect of economicglobalisation?
A Economic growth is usually increased by greater efficiencyand larger export volumes.
B Inflation is increased.
C Up to a point, the product range for consumers may beincreased.
D Governments need to consider the effects of their policieson the reaction of global traders and markets, and theimpact on the inflation rate since these considerations affectour international competitiveness.
Question 10
Economic globalisation may cause:
A the disappearance of some national companies or their take-over by foreign investors
B massive shifts in population and the spread of illegal drugsand crime from one country to another
C the depression of local wage levels towards those in cheaplabour countries overseas
D all of the above.
Question 11
Concerning the Nestlé corporation, which statement is false?
A Production is undertaken only in Switzerland even thoughits products are sold globally.
B Its market size grew partly as a result of its own productinnovation.
C In part, the company expanded by means of takeovers ofproven companies operating in markets around the world.
D At times, its expansion was interrupted as a result of wars,global recession and adverse moves in some exchange rates.
Question 12
It is likely that Nestlé started operations in Australia partly because:
A we drink more coffee and eat more chocolate than anyone else
B of our nearness to Asian markets and our reasonably largeand rich domestic market
C wage costs here are lower than elsewhere in our region
D our government gives them lower tax rates and other con-cessions that are not given to locally-owned companies.
TERMINOLOGY revision
Briefly and accurately write out definitions for each of the terms listed below.
Economics terms used in chapter 9
company merger fixed production costs of a firm labour intensive industries
company takeover foreign aid micro-credit
comparative cost advantage globalisation multinational company
deregulation of financial markets horizontal integration of firms productive capacity of a nation
deregulation of the labour market human development index vertical integration of firms
economies of large-scale production infrastructure vicious cycle of poverty
Table 9.2

CHAPTER 9 Economic globalisation 305
school a
ssessm
ent ta
sks a
nd
learn
ing
activ
ities
APPLIED ECONOMICS exercises
Question 1A What is meant by the term, ‘economic globalisation’?B It took 38 years after its invention for radio to be used by
50 million consumers, 16 years for personal computers,13 years for TV, and only four years for the World Wide
Web! How has the WWW helped to accelerate the global-isation of commerce and business?
C Examine the data contained in table 9.3 showing changingtransport and communication costs. How have decliningtransport and communication costs helped the process ofglobalisation and the spread of multinationals?
Changing transport and communication costs ($US)
Source: Data derived from Human Development Report, 1999 (OUP, 1999); IMF, 1997a.
D How did colonisation by European powers some centuriesago help to lead to globalisation?
E Using an encyclopedia in your school library (or one such asEncarta on CD-ROM), find out details about David Ricardo’seconomic theory of international specialisation and com-parative cost advantage and use this to write a brief report.
Question 2A Which countries are seen by multinationals as low-wage coun-
tries? Explain how wage differences lead to globalisation.B What are economies of large scale? Explain how globalisation
can help multinationals gain economies and better profits.C Explain the methods used by some governments to attract
multinationals. Why are governments often keen to do this?
Question 3A Globalisation has meant that the Australian economy has
had to undergo change and become more internationalised.What sorts of change have been forced upon the AustralianGovernment and society due to economic globalisation?
B Outline one cost and two benefits to Australia of economicglobalisation.
Question 4A What makes Nestlé a multinational corporation?B What methods did Nestlé use to gain its dominant position
of the world’s largest food producing company?C Did Nestlé try to exploit the situation by locating production
in low-wage countries or was the decision determined by thelocation of its main international markets?
D Discuss the costs and benefits to Australia of Nestlé’s localoperations.
E For a very critical look at Nestlé’s international activities youmay (with your teacher’s approval) search the Internet forappropriate references.
Question 5Examine table 9.4 showing statistical indicators (mostly for 2005or 2006) for high and low globalised countries.
Source: Data derived from NationMaster website.
YEARSEA FREIGHT/
TONAIR TRANSPORT/
MILE
TELEPHONE CALL/3 MINUTES, LONDON–
NEW YORKCOMPUTERS INDEX
(1990 = 100 POINTS)
1920 $95 NA NA NA
1930 $60 $0.68 $245 NA
1960 $27 $0.16 $32 12 500
1990 $29 $0.11 $3 100
Table 9.3
COUNTRY
INDEX OF GLOBALISATION (higher value means more
globalised or open economies)
GDP PER HEAD(US$ in purchasing power parity terms
that allow for inflation and the cost of living)
POVERTY RATES(% population)
Australia 5.08 30 161 NA
Rwanda 0.92 1 321 60
China 3.23 5 453 10
Iran 2.08 7 424 40
Zimbabwe 2.22 NA 80
Switzerland 5.57 33 062 NA
Niger 1.50 832 63
Table 9.4
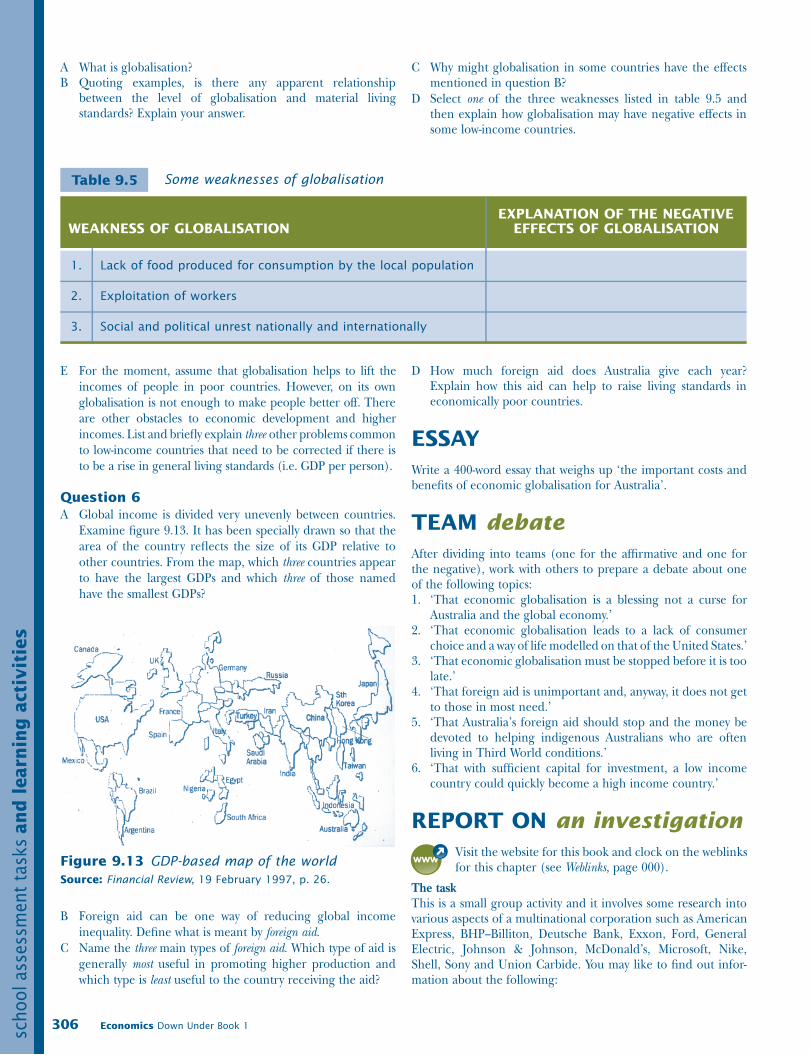
Economics Down Under Book 1306
school ass
ess
ment
task
s an
d l
earn
ing
acti
vit
ies
A What is globalisation?B Quoting examples, is there any apparent relationship
between the level of globalisation and material livingstandards? Explain your answer.
C Why might globalisation in some countries have the effectsmentioned in question B?
D Select one of the three weaknesses listed in table 9.5 andthen explain how globalisation may have negative effects insome low-income countries.
Some weaknesses of globalisation
E For the moment, assume that globalisation helps to lift theincomes of people in poor countries. However, on its ownglobalisation is not enough to make people better off. Thereare other obstacles to economic development and higherincomes. List and briefly explain three other problems commonto low-income countries that need to be corrected if there isto be a rise in general living standards (i.e. GDP per person).
Question 6
A Global income is divided very unevenly between countries.Examine figure 9.13. It has been specially drawn so that thearea of the country reflects the size of its GDP relative toother countries. From the map, which three countries appearto have the largest GDPs and which three of those namedhave the smallest GDPs?
Figure 9.13 GDP-based map of the world
Source: Financial Review, 19 February 1997, p. 26.
B Foreign aid can be one way of reducing global incomeinequality. Define what is meant by foreign aid.
C Name the three main types of foreign aid. Which type of aid isgenerally most useful in promoting higher production andwhich type is least useful to the country receiving the aid?
D How much foreign aid does Australia give each year?Explain how this aid can help to raise living standards ineconomically poor countries.
ESSAY
Write a 400-word essay that weighs up ‘the important costs andbenefits of economic globalisation for Australia’.
TEAM debate
After dividing into teams (one for the affirmative and one forthe negative), work with others to prepare a debate about oneof the following topics:1. ‘That economic globalisation is a blessing not a curse for
Australia and the global economy.’2. ‘That economic globalisation leads to a lack of consumer
choice and a way of life modelled on that of the United States.’3. ‘That economic globalisation must be stopped before it is too
late.’4. ‘That foreign aid is unimportant and, anyway, it does not get
to those in most need.’5. ‘That Australia’s foreign aid should stop and the money be
devoted to helping indigenous Australians who are oftenliving in Third World conditions.’
6. ‘That with sufficient capital for investment, a low incomecountry could quickly become a high income country.’
REPORT ON an investigation
Visit the website for this book and clock on the weblinksfor this chapter (see Weblinks, page 000).
The task
This is a small group activity and it involves some research intovarious aspects of a multinational corporation such as AmericanExpress, BHP–Billiton, Deutsche Bank, Exxon, Ford, GeneralElectric, Johnson & Johnson, McDonald’s, Microsoft, Nike,Shell, Sony and Union Carbide. You may like to find out infor-mation about the following:
WEAKNESS OF GLOBALISATIONEXPLANATION OF THE NEGATIVE
EFFECTS OF GLOBALISATION
1. Lack of food produced for consumption by the local population
2. Exploitation of workers
3. Social and political unrest nationally and internationally
Table 9.5
➜

CHAPTER 9 Economic globalisation 307
school a
ssessm
ent ta
sks a
nd
learn
ing
activ
ities
� the structure and size of the organisation� the reasons for its global expansion� how the company gains a competitive advantage� the use of technology in the corporation� the nature of the relationship between the corporation and
the host country� use ‘Google’ as a search engine to try and find criticisms of
these companies.OR
An alternative to the research theme outlined on the previouspage is to conduct a survey in your home of the basic goods andservices purchased by your family. Discover what proportion ofthe basket of items in your home is produced or sold by foreign-owned multinationals as opposed to locally-owned firms (note— the AusBuy Guide is useful for this purpose). Your basket ofitems for the survey might include:1. electrical appliances2. car3. breakfast cereal4. banking5. shoes6. fruit7. underwear8. hair shampoo9. insurance
10. magazines.Use your survey results to:
� construct graphs showing the degree of foreign businesspenetration into the Australian market
� find out more about a number of the companies noted in yoursurvey (e.g. their home base, their size, their marketing strat-egies, their impact on the Australian economy and so on).
Presentation
Your group’s findings could be reported in various ways. Forexample:� a PowerPoint data show involving computer-generated slides
presented to the class� a wall chart or poster� a class talk, perhaps illustrated using overhead transparencies
containing graphs, diagrams, flow charts, advertising mat-erials, photographs
� a written report of 400 words containing graphs and otherillustrative evidence.
References
Use of the Internet can be a great way to obtain informationabout some multinational corporations. Most companies runtheir own home pages.
RESEARCH and analysis
The task
Working individually or in small groups, your task here is toimagine that you are an owner of an Australian manufacturingbusiness wanting to expand your operations to become a multi-national. You are investigating possible countries for yourexpansion plans. For example, would you want to grow yourAustralian business, or would you go offshore, perhaps to China,Fiji, Philippines, Indonesia, India, United Kingdom, UnitedStates or Brazil?
To get you thinking, start by reading the article, ‘AdvanceAustralia where? Our brand drain’. Also examine the tableshowing what has happened to dwindling number of Australianfirms and their well-known brand names over the years.
Advance Australia where? Our brand drain
By KATE ADAMSON, Consumer reporter
THERE are only a handful of iconic
Aussie brands still made in Australia
and owned by Australians.
A Sunday Herald Sun survey found
only eight of 42 well-known Aus-
tralian brands remain truly Australian.
The mass exodus to foreign shores
comes as companies resort to using
cheaper labour in China and other
developing countries.
Or the brands have been victims of
takeover deals by global giants.
One of the few remaining Aus-
tralian made and owned products,
Blundstone boots, announced last
week it would make the boots in Thai-
land and India.
It will shut its Hobart plant, sacking
more than 300 workers.
It joins other Australian brands
being made overseas such as King
Gee Jeans, Kookaburra cricket bats
and Pelaco shirts.
Tim Tam, Holden, Milo and Sherrin
footballs are still made here, but are
owned by foreign companies.
And the Hills Hoist clothes line,
featured in the Sydney Olympics
opening ceremony, moved production
to China last month.
‘The cost to make some things in
Australia is higher than to make the
same thing in China,’ Hills Hoist
spokesman Graham Twartz said.
Australian Manufacturing Workers’
Union Victorian secretary Steve
Dargavel said manufacturing, which
employed more than a million
Australians, was dying.
‘It’s not because wages are too
high, it’s because Federal Government
policy has failed us,’ Dargavel said.
Social analyst David Chalke said
Australians were emotionally attached
to many brands, but hip pockets came
first.
‘On a simple level we want the
Australian cricket team to win and we
want Australian manufacturing to
win,’ Mr Chalke said.
‘But if it can’t, we think it’s not our
fault. It’s not our job to save
companies. Our job is to feed the kids
and pay the mortgage.’

Economics Down Under Book 1308
school ass
ess
ment
task
s an
d l
earn
ing
acti
vit
ies
Select one of the products mentioned in the article andimagine you owned the company that produced this item. Indeciding in which country to locate your new operations, try toconsider a selection of the following aspects (as applied to theproduct you selected):
� the level of wage rates or labour costs
� labour force size and level of education and training
� market size (located domestically and overseas)
� transport or freight costs of materials and finished goods(both domestically and to overseas)
� the cost of borrowing business credit to finance your expan-sion
� government policy towards overseas firms and the environ-ment (in the selected country)
� the provision of infrastructure (e.g. government provision ofwater, power, transport)
� rates of company tax
� the availability and cost of the natural and other resourcesyou require
� the level of competition faced (e.g. are there rival firms?).
References
You will need access to a computer and the Internet in order toconduct research into the areas of consideration that are listedabove. Some statistical and other data might be found using thefollowing sites that provide general information about manycountries:� CIA data base� OECD data base� World Bank data base� NationMaster� ACTU or the international labour movement.
In addition, use various search engines (e.g. Google) to locatethe necessary information. The statistical data found in table 9.6(pp. 309–12), for example, have been mainly extracted from theInternet. It may give you a useful start. Try to select a countryfor which relevant information is available.
AUSTRALIAN OWNED AND MADE
Rosella tomato sauce
Four’N Twenty pie
Akubra hat
Bonds singlet
Kookaburra cricket ball
Drizabone oilskin coat
RM Williams boots
Victa lawn mower
FOREIGN OWNED, BUT MADE IN AUSTRALIA
Vegemite — Kraft, US
Holden Commodore —General Motors, US
Sherrin football — Russell Athletic, US
SPC Ardmona — Coca Cola, US
Uncle tobys — Nestlé, Switzerland
Tim Tam — Campbell’s, US
Aeroplane Jelly —McCormick, US
Streets ice-cream — Unilever, Britain/Netherlands
Berri juice — National Foods, Philippines
Big M — National Foods, Philippines
Milo — Nestlé, Switzerland
Western Star butter — Fonterra, New Zealand
Allens sweets — Nestlé, Switzerland
Cherry Ripe — Cadbury, Britain
Cheezels — Campbell’s, US
Violet Crumble — Nestle, Switzerland
Nobbys Nuts — PepsiCo, US
Mortein — Reckitt Benckiser, Britain
Aerogard — Reckitt Benckiser,
Britain
AUSTRALIAN OWNED BUT MADE OVERSEAS
Jockey underpants — China
Sunbeam kettles — China
Sheridan sheets — China
Hills Hoist — China
Kookaburra cricket bats — India
Billabong — China
Pelaco shirts — China
KingGee —China
Stubbies — China
Slazenger — China
Malvern Star — China
FOREIGN OWNED AND MADE
Bushells — Unilever, Britain/Netherlands — Indonesia
Speedo — Pentland, Britain — China
Vicks Vaporub — Procter and Gamble, US — India
Redheads — Swedish Match — Sweden
Source: Herald Sun, 28 January 2007.

CHAPTER 9 Economic globalisation 309
school a
ssessm
ent ta
sks a
nd
learn
ing
activ
ities
Some factors affecting where multinational companies locate their operations
PART 1 COMPARISONS OF WORKER EFFICIENCY (LEVEL OF OUTPUT PRODUCED PER WORKER PER HOUR)
Ranked comparisons of labour productivity (GDP per hour worked adjusted to purchasing power parity) from highest to lowest
Productivity index as % US
(US = 100 points)
Ranked comparisons of labour productivity (GDP per hour worked adjusted to purchasing power parity) from highest to lowest
Productivity index as % US
(US = 100 points)
1. Netherlands 129 15. Australia 80
2. Luxembourg 126 16. Spain 80
3. Belgium 111 17. Italy 78
4. Ireland 104 18. Canada 77
5. France 101 19. Iceland 73
6. Netherlands 101 20. Japan 70
7. United States 100 = base 21. Greece 61
8. Germany 92 22. New Zealand 59
9. Denmark 89 23. Portugal 48
10. Sweden 89 24. Hungary 46
11. Austria 85 25. Korea 40
12. United Kingdom 84 26. Poland 39
13. Finland 83 27. Mexico 30
14. Switzerland 82 28. Turkey 28
PART 2 COMPARISONS OF WORKER EFFICIENCY BY INDUSTRY AGAINST THAT FOR THE US
Industry US
(the base for comparison = 100%)
Australia
(% US worker
efficiency)
Germany
(% US worker
efficiency)
Japan
(% US worker
efficiency)
United Kingdom
(% US worker
efficiency)
South Korea
(% US worker
efficiency)
1. Rubber and plastics 100 67 65 82 118 10
2. Textile products 100 66 91 64 80 28
3. Basic fabricated metals 100 56 81 81 43 31
4. Chemicals, petroleum and coal 100 51 54 71 65 18
5. Paper, printing and publishing 100 45 77 55 48 19
6. Food products 100 44 65 32 43 10
7. Machinery, transport and equipment 100 44 86 98 59 28
8. Electricity, machinery and equipment 100 37 71 80 51 30
Table 9.6
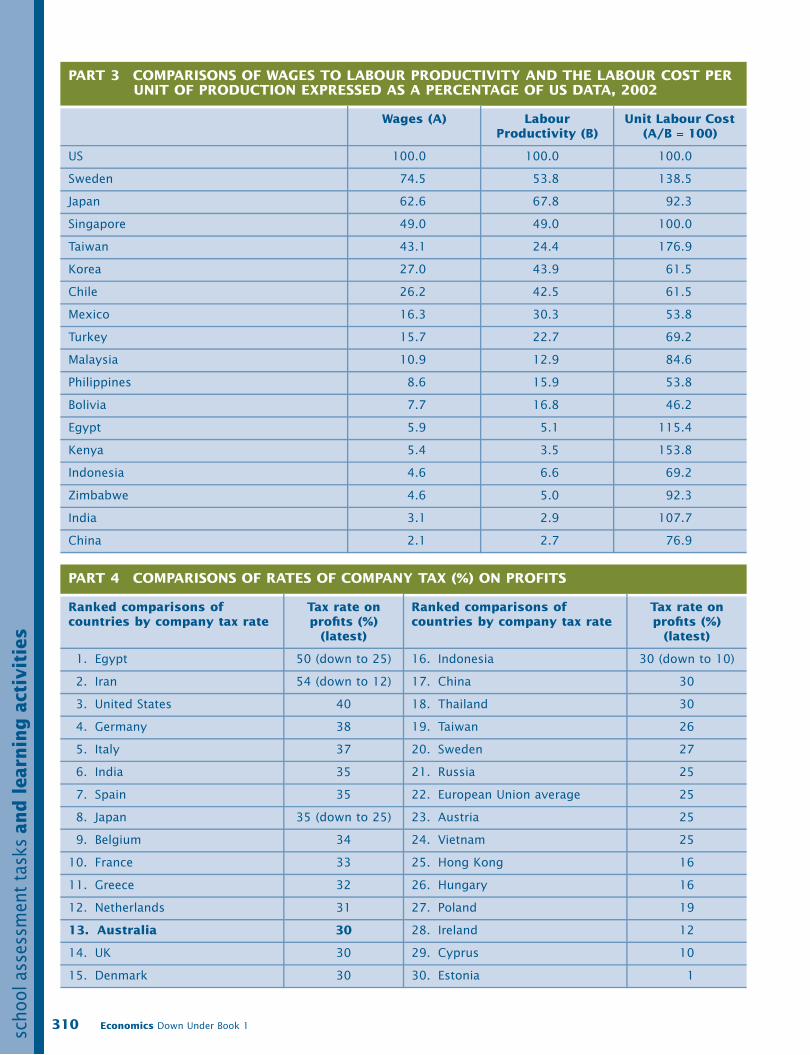
Economics Down Under Book 1310
school ass
ess
ment
task
s an
d l
earn
ing
act
ivit
ies
PART 3 COMPARISONS OF WAGES TO LABOUR PRODUCTIVITY AND THE LABOUR COST PER UNIT OF PRODUCTION EXPRESSED AS A PERCENTAGE OF US DATA, 2002
Wages (A) Labour Productivity (B)
Unit Labour Cost (A/B = 100)
US 100.0 100.0 100.0
Sweden 74.5 53.8 138.5
Japan 62.6 67.8 92.3
Singapore 49.0 49.0 100.0
Taiwan 43.1 24.4 176.9
Korea 27.0 43.9 61.5
Chile 26.2 42.5 61.5
Mexico 16.3 30.3 53.8
Turkey 15.7 22.7 69.2
Malaysia 10.9 12.9 84.6
Philippines 8.6 15.9 53.8
Bolivia 7.7 16.8 46.2
Egypt 5.9 5.1 115.4
Kenya 5.4 3.5 153.8
Indonesia 4.6 6.6 69.2
Zimbabwe 4.6 5.0 92.3
India 3.1 2.9 107.7
China 2.1 2.7 76.9
PART 4 COMPARISONS OF RATES OF COMPANY TAX (%) ON PROFITS
Ranked comparisons of countries by company tax rate
Tax rate on profits (%)
(latest)
Ranked comparisons of countries by company tax rate
Tax rate on profits (%)
(latest)
1. Egypt 50 (down to 25) 16. Indonesia 30 (down to 10)
2. Iran 54 (down to 12) 17. China 30
3. United States 40 18. Thailand 30
4. Germany 38 19. Taiwan 26
5. Italy 37 20. Sweden 27
6. India 35 21. Russia 25
7. Spain 35 22. European Union average 25
8. Japan 35 (down to 25) 23. Austria 25
9. Belgium 34 24. Vietnam 25
10. France 33 25. Hong Kong 16
11. Greece 32 26. Hungary 16
12. Netherlands 31 27. Poland 19
13. Australia 30 28. Ireland 12
14. UK 30 29. Cyprus 10
15. Denmark 30 30. Estonia 1
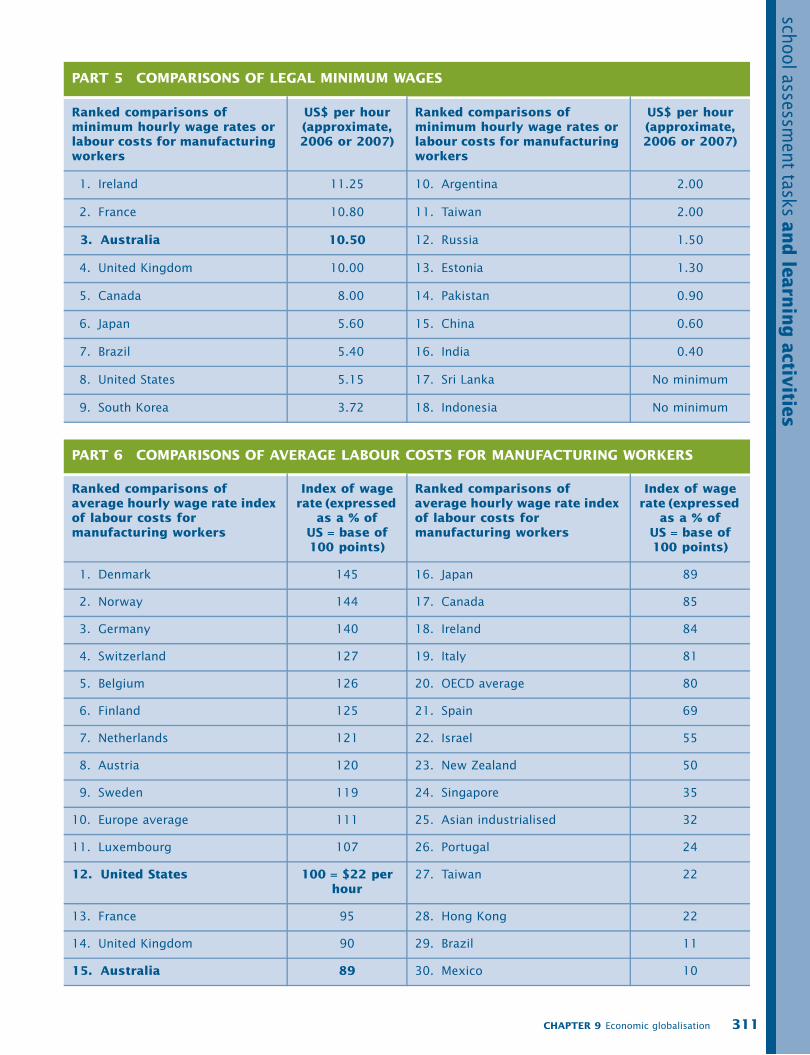
CHAPTER 9 Economic globalisation 311
school a
ssessm
ent ta
sks a
nd
learn
ing
activ
ities
PART 5 COMPARISONS OF LEGAL MINIMUM WAGES
Ranked comparisons of minimum hourly wage rates or labour costs for manufacturing workers
US$ per hour (approximate, 2006 or 2007)
Ranked comparisons of minimum hourly wage rates or labour costs for manufacturing workers
US$ per hour (approximate, 2006 or 2007)
1. Ireland 11.25 10. Argentina 2.00
2. France 10.80 11. Taiwan 2.00
3. Australia 10.50 12. Russia 1.50
4. United Kingdom 10.00 13. Estonia 1.30
5. Canada 8.00 14. Pakistan 0.90
6. Japan 5.60 15. China 0.60
7. Brazil 5.40 16. India 0.40
8. United States 5.15 17. Sri Lanka No minimum
9. South Korea 3.72 18. Indonesia No minimum
PART 6 COMPARISONS OF AVERAGE LABOUR COSTS FOR MANUFACTURING WORKERS
Ranked comparisons of average hourly wage rate index of labour costs for manufacturing workers
Index of wage rate (expressed
as a % of US = base of 100 points)
Ranked comparisons of average hourly wage rate index of labour costs for manufacturing workers
Index of wage rate (expressed
as a % of US = base of 100 points)
1. Denmark 145 16. Japan 89
2. Norway 144 17. Canada 85
3. Germany 140 18. Ireland 84
4. Switzerland 127 19. Italy 81
5. Belgium 126 20. OECD average 80
6. Finland 125 21. Spain 69
7. Netherlands 121 22. Israel 55
8. Austria 120 23. New Zealand 50
9. Sweden 119 24. Singapore 35
10. Europe average 111 25. Asian industrialised 32
11. Luxembourg 107 26. Portugal 24
12. United States 100 = $22 per hour
27. Taiwan 22
13. France 95 28. Hong Kong 22
14. United Kingdom 90 29. Brazil 11
15. Australia 89 30. Mexico 10

Economics Down Under Book 1312
school ass
ess
ment
task
s an
d l
earn
ing
act
ivit
ies
Source: Part 1, Data derived from OECD, productivity database, January 2006. Part 2, These figures should only be used as a general guide, they are now rather dated and probably tend to exaggerate the current difference in worker efficiency with US workers following government efficiency policies (e.g. tariff cuts, workplace agreements) and improved productivity growth, 1994–2006. Data derived from an article by Fiona Carruthers, ‘US workers twice as efficient in factory output’, The Australian, 24 August 1994, p.4. Part 3, derived from China in Transition, ‘The myth of Chinese Competitiveness — are low wages China’s strength or weakness?’ by Chi Hung Kwan, (August 2002, p. 2) quoted from the United Nations Conference on Trade and Development (UNCTAD), Trade and development report, 2002. Part 4, Data derived mainly from Business Council of Australia, KPMG Corporate Tax Survey, 2004, World Bank and other sources. Part 5, Data derived mainly from Wikepedia, the free encyclopedia. Part 6, Data derived from the US Bureau of Labour Statistics and other sources. Part 7, Data derived from RBA Bulletin (table F14) and other sources.
Presentation
You need to prepare and submit either:� A written company report OR� A multimedia presentation that reports your findings and
conclusions to the class (involving a PowerPoint presen-tation)In setting out your findings, you might include the following:
� Introduction. An introduction that outlines the product orcompany you chose to research.
� Factors considered important. Select, justify and explain the mainconsiderations (select a range from the list given and orinclude other important factors) that would be important foryour expanding company, in making a decision about whichcountry you would choose for location. You should alsoinclude why you selected one country over another?
� Conclusion. Sum up your findings.
Presentation ideas
Illustrate your work with diagrams, downloaded digital photos,cartoons, tables, and Excel generated graphs.
This activity would take a minimum of 6–7 lessons to complete.
COLLECTION AND ANALYSIS of newspapers
1. Collect any two newspaper articles about the issue ofglobalisation. For instance, these articles may report:� the activities and impact of a multinational corporation� international discussions relating to reducing tariffs and
farm subsidies� the expansion of international free trade areas� recent government policies to make the Australian
economy more internationally competitive.Use the newspaper reports as the basis of analysing the
particular issue or topic you have selected. You may presentyour analysis in different ways, perhaps as a short written
piece of work or why not try a class presentation (e.g. aPowerPoint data show, class talk with overhead projectortransparencies, a wall poster for display).
2. There is much poverty around the world and incomeinequality between countries is huge. Sometimes people inrich countries would like to help but do not know where tostart. They often feel powerless. However, each of us couldmake a difference. It is not always a matter of giving large‘handouts’ to those in poor countries, but rather, a matter ofproviding them with a ‘helping hand’ so that they canbecome economically self-sufficient and permanentlyindependent. Years ago, an Australian, David Bussau had theidea of using micro-credit to make a difference. It involves pro-viding individuals and groups (often women) with a smallamount of money capital to start up a business (perhapsmade possible by the purchase of a sewing machine to manu-facture clothes, an oven to prepare food, or basic tools forfarming). This could involve lending as little as $100–$200.In addition, interest rates on these loans are low and repay-ment times are very flexible to help improve the oppor-tunities for business success. A strength of this scheme, is thatthe original money can be used over and over again to helpstart up new income-generating activities. Normally, thesepeople would not be able to borrow credit from banks,because they are considered a bad risk. Alternatively, thosewanting to go into business were at the mercy of ‘loansharks’, who charged huge interest rates and were harsh onpeople who default on repayments. Once started, a smallbusiness can earn income, grow household savings, createjobs for others and reduce poverty in local communities.Indeed, according to the World Bank, these projects mayeradicate 10 per cent of the world's poverty by 2020. Asrecognition of the importance of the idea, the UnitedNations declared 2005 as the International Year of Micro-credit.
Armed with this background information, read the news-paper article ‘For aid, just help yourself’.
PART 7 COMPARISONS OF THE COST TO BUSINESSES OF BORROWING CREDIT OR FINANCE
Ranked comparisons of bank interest rates on loans to businesses, 2006 or 2007
Annual interest rate (%)
Ranked comparisons of bank interest rates on loans to businesses, 2006 or 2007
Annual interest rate (%)
1. Australia 9.60 6. Hong Kong 7.75
2. United Kingdom 8.30 7. Indonesia 6.25
3. United States 8.25 8. Germany 4.38
4. New Zealand 8.20 9. Singapore 5.33
5. Canada 7.85 30. Japan 1.63

CHAPTER 9 Economic globalisation 313
school a
ssessm
ent ta
sks a
nd
learn
ing
activ
ities
For aid, just help yourselfShunned by traditional lenders, people in the Third World can now get low-collateral loans to help them improve their lives. The results are encouraging, as MATT WADE reports.
THE First World’s reaction to great
natural disasters, such as the Boxing
Day tsunami, the Niger famine and the
Pakistan earthquake, and to Third
world poverty generally, is usually
monetary aid.
At the United Nations General
Assembly in September the Prime
Minister, John Howard, vowed to
double the overseas aid allocation to
about $4 billion a year by 2010, as
Australia joined other wealthy nations
in pledging billions of dollars in
additional aid and debt relief for poor
countries.
But this year has also been the UN’s
International Year of Microcredit — a
scheme to promote the use of tiny
loans to help impoverished families
increase their incomes. While it has
received less attention than natural dis-
asters and political rhetoric, this
method of helping the poor is
flourishing.
A report released today by the
poverty advocacy group RESULTS
found that more than 92 million
people in developing countries were
granted microloans last year. Of those,
66.6 million were classified as very
poor — surviving on less than $US1
($1.34) a day.
Microcredit is the provision of
small, collateral-free loans and other
financial services, mostly to very poor
women who would normally be
excluded from mainstream financial
institutions. Loans of about $150 to
$200 are used to start or expand small
income-generating activities.
The State of the Microcredit Summit
Report says the number of very poor
people receiving a small loan grew
from 7.6 million in 1997 to last year’s
66.6 million, an average annual
growth of 36 per cent.
It is possible that 1100 million
people will receive a microloan this
year — that’s five times the population
of Australia. The report estimates that
more than 80 per cent of microloans
for the poor are taken by women. ‘The
increase represents an additional 45.3
million poorest women reported as
receiving microloans in the last five
years,’ it says.
Bangladesh, once synonymous with
famine and natural disasters, has
become the showpiece for the effec-
tiveness of microcredit, Millions of
microloans have been made in Bangla-
desh and research by the World Bank,
an advocate of microfinance, has con-
cluded they have been crucial in
reducing poverty in that country.
A World Bank researcher, Shahidur
Khandker, studied three Bangladeshi
groups that provide microcredit — the
Bangladesh Rural Advancement
Committee, Grameen Bank and a
government program called RD-12.
Khandker concluded that 3 per cent of
clients got out of poverty each year
because of their microloans and that
microcredit accounted for 40 per cent
of the reduction of moderate poverty
in rural Bangladesh.
The UN Development Program’s
Human Development Report found
that Bangladesh had overtaken its
giant neighbour India in reducing
child mortality, despite having lower
average incomes and a lower econ-
omic growth rate. It said Bangladesh
had achieved rapid human develop-
ment and the prevalence of micro-
credit had helped.
Microcredit had been especially
important in expanding choice and
empowering women. ‘While dis-
parities still exist, women have
become increasingly powerful cata-
lysts for development, demanding
greater control over fertility and birth
spacing, education for their daughters
and access to services,’ the Human
Development Report says.
Microcredit for the poor was first
tried in the early 1970s and has
become an integral part of the drive to
alleviate poverty. Initially, the idea of
using loans to help the poor was
treated with suspicion by many aid
agencies. But the strategy’s success in
generating income for poor families
meant it could not be ignored.
Most big aid agencies now have
microcredit projects. Thousands of
organisations specialising in micro-
credit have also emerged.
Opportunity International, which
made more than a million microloans
last year, says the average loan in
developing countries is about $180
over six months. It says 87 per cent of
(continued )
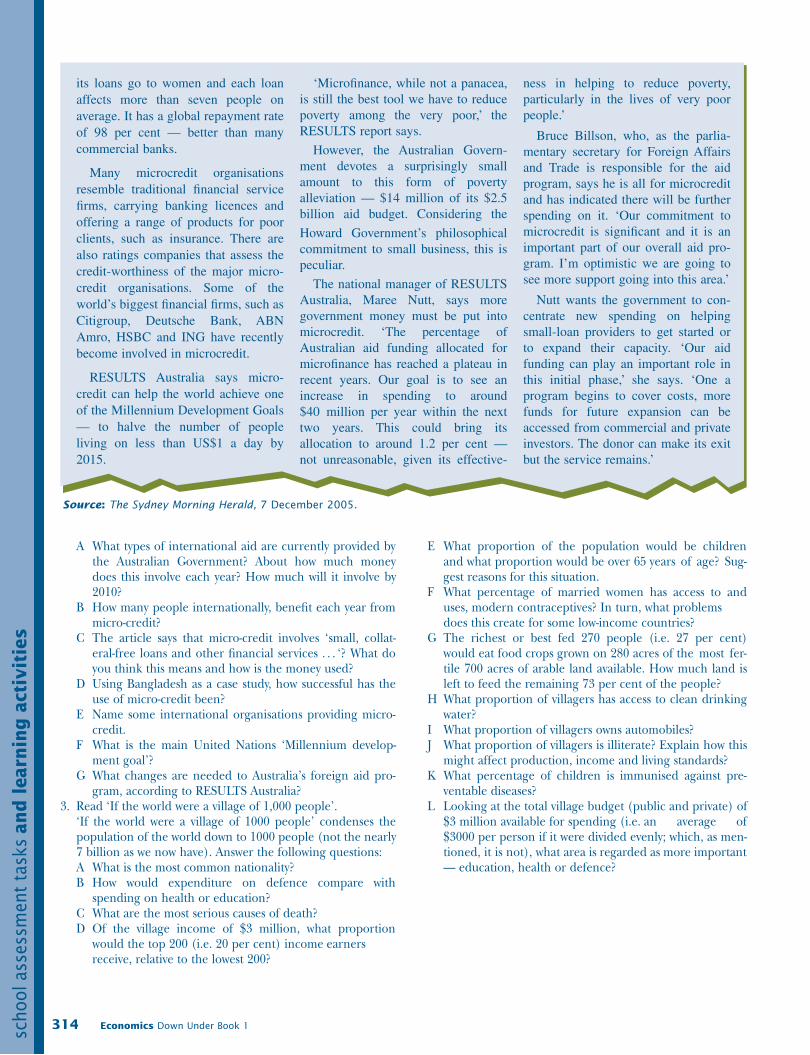
Economics Down Under Book 1314
school assessm
ent
tasks a
nd
learn
ing
acti
vit
ies
A What types of international aid are currently provided bythe Australian Government? About how much moneydoes this involve each year? How much will it involve by2010?
B How many people internationally, benefit each year frommicro-credit?
C The article says that micro-credit involves ‘small, collat-eral-free loans and other financial services . . . ‘? What doyou think this means and how is the money used?
D Using Bangladesh as a case study, how successful has theuse of micro-credit been?
E Name some international organisations providing micro-credit.
F What is the main United Nations ‘Millennium develop-ment goal’?
G What changes are needed to Australia’s foreign aid pro-gram, according to RESULTS Australia?
3. Read ‘If the world were a village of 1,000 people’.‘If the world were a village of 1000 people’ condenses thepopulation of the world down to 1000 people (not the nearly7 billion as we now have). Answer the following questions:A What is the most common nationality?B How would expenditure on defence compare with
spending on health or education?C What are the most serious causes of death?D Of the village income of $3 million, what proportion
would the top 200 (i.e. 20 per cent) income earnersreceive, relative to the lowest 200?
E What proportion of the population would be childrenand what proportion would be over 65 years of age? Sug-gest reasons for this situation.
F What percentage of married women has access to anduses, modern contraceptives? In turn, what problemsdoes this create for some low-income countries?
G The richest or best fed 270 people (i.e. 27 per cent)would eat food crops grown on 280 acres of the most fer-tile 700 acres of arable land available. How much land isleft to feed the remaining 73 per cent of the people?
H What proportion of villagers has access to clean drinkingwater?
I What proportion of villagers owns automobiles?J What proportion of villagers is illiterate? Explain how this
might affect production, income and living standards?K What percentage of children is immunised against pre-
ventable diseases?L Looking at the total village budget (public and private) of
$3 million available for spending (i.e. an average of$3000 per person if it were divided evenly; which, as men-tioned, it is not), what area is regarded as more important— education, health or defence?
its loans go to women and each loan
affects more than seven people on
average. It has a global repayment rate
of 98 per cent — better than many
commercial banks.
Many microcredit organisations
resemble traditional financial service
firms, carrying banking licences and
offering a range of products for poor
clients, such as insurance. There are
also ratings companies that assess the
credit-worthiness of the major micro-
credit organisations. Some of the
world’s biggest financial firms, such as
Citigroup, Deutsche Bank, ABN
Amro, HSBC and ING have recently
become involved in microcredit.
RESULTS Australia says micro-
credit can help the world achieve one
of the Millennium Development Goals
— to halve the number of people
living on less than US$1 a day by
2015.
‘Microfinance, while not a panacea,
is still the best tool we have to reduce
poverty among the very poor,’ the
RESULTS report says.
However, the Australian Govern-
ment devotes a surprisingly small
amount to this form of poverty
alleviation — $14 million of its $2.5
billion aid budget. Considering the
Howard Government’s philosophical
commitment to small business, this is
peculiar.
The national manager of RESULTS
Australia, Maree Nutt, says more
government money must be put into
microcredit. ‘The percentage of
Australian aid funding allocated for
microfinance has reached a plateau in
recent years. Our goal is to see an
increase in spending to around
$40 million per year within the next
two years. This could bring its
allocation to around 1.2 per cent —
not unreasonable, given its effective-
ness in helping to reduce poverty,
particularly in the lives of very poor
people.’
Bruce Billson, who, as the parlia-
mentary secretary for Foreign Affairs
and Trade is responsible for the aid
program, says he is all for microcredit
and has indicated there will be further
spending on it. ‘Our commitment to
microcredit is significant and it is an
important part of our overall aid pro-
gram. I’m optimistic we are going to
see more support going into this area.’
Nutt wants the government to con-
centrate new spending on helping
small-loan providers to get started or
to expand their capacity. ‘Our aid
funding can play an important role in
this initial phase,’ she says. ‘One a
program begins to cover costs, more
funds for future expansion can be
accessed from commercial and private
investors. The donor can make its exit
but the service remains.’
Source: The Sydney Morning Herald, 7 December 2005.

CHAPTER 9 Economic globalisation 315
school a
ssessm
ent ta
sks a
nd
learn
ing
activ
ities
If the world were a village of 1000 people
by DONA MEADOWS
If the world were a village of 1000people, it would include� 584 Asians� 124 Africans� 95 East and West Europeans� 84 Latin Americans� 55 Soviets (including for the
moment Lithuanians, Latvians, Esto-nians and other national groups)
� 52 North Americans� 6 Australians and New Zealanders.
The people of the village have con-siderable difficulty in communicating� 165 people speak Mandarin� 86 English� 83 Hindi/Urdu� 64 Spanish� 58 Russian� 37 Arabic.That list accounts for the mothertongues of only half the villagers. Theother half speak (in descending orderof frequency) Bengali, Portuguese,Indonesian, Japanese, German, Frenchand 200 other languages.
In this village of 1000 there are� 329 Christians (among them 187
Catholics, 84 Protestants, 31Orthodox)
� 178 Moslems� 167 ‘non-religious’� l32 Hindus� 60 Buddhists� 45 atheists� 3 Jews� 86 people of all other religions.� One-third (330) of the 1000 people
in the world village are children andonly 60 are over the age of 65. Halfthe children are immunized againstpreventable infectious diseases suchas measles and polio.
� Just under half of the marriedwomen in the village have access toand use modern contraceptives.
� This year 28 babies will be born. Tenpeople will die, 3 of them for lack offood, 1 from cancer, 2 of the deathsare of babies born within the year.
One person of the 1000 is infectedwith the HIV virus; that person mostlikely has not yet developed a full-blown case of AIDS.
� With the 28 births and 10 deaths, thepopulation of the village next yearwill be 1018.
� In this 1000-person community, 200people receive 75 percent of theincome; another 200 receive only 2percent of the income.
� Only 70 people of the 1000 own anautomobile (although some of the70 own more than one automobile).
� About one-third have access to clean,safe drinking water.
� Of the 670 adults in the village, halfare illiterate.
The village has six acres of land perperson, 6000 acres in all, of which� 700 acres are cropland� 1400 acres pasture� 1900 acres woodland� 2000 acres desert, tundra, pavement
and other wasteland.� The woodland is declining rapidly;
the wasteland is increasing. The otherland categories are roughly stable.
The village allocates 83 percent of itsfertilizer to 40 percent of its cropland— that owned by the richest and best-fed 270 people. Excess fertilizer run-ning off this land causes pollution inlakes and wells. The remaining 60 per-cent of the land, with its 17 percent ofthe fertilizer, produces 28 percent of
the food grains and feeds 73 percent ofthe people. The average grain yield onthat land is one-third the harvestachieved by the richer villagers.
In the village of 1000 people, there are� 5 soldiers� 7 teachers� 1 doctor� 3 refugees driven from home by war
or drought.The village has a total budget eachyear, public and private, of over $3million — $3000 per person if it is dis-tributed evenly (which, we have alreadyseen, it isn’t).
Of the total $3 million� $181 000 goes to weapons and war-
fare� $159 000 for education� $l32 000 for health care.The village has buried beneath itenough explosive power in nuclearweapons to blow itself to smithereensmany times over. These weapons areunder the control of just 100 of thepeople. The other 900 people arewatching them with deep anxiety, won-dering whether they can learn to getalong together; and if they do, whetherthey might set off the weapons anywaythrough inattention or technical bun-gling; and, if they ever decide to dis-mantle the weapons, where in theworld village they would dispose of theradioactive materials of which theweapons are made.
Source: Sustainability Institute, 31 May 1990.

Economics Down Under Book 1316
sum
mary
WATCHING a video or DVD
There are a number of interesting videos covering the topic ofglobalisation. Try viewing one of the following programs:� No Sweat — Nike� The New Rulers of the World� Ketchup in the Curry� Exploring the Global Economy (Learning Essentials & Video
Classroom)
� Impacts of Globalisation (Classroom Video)� The Global Market Impact (VEA Production)� Tales from the Global Economy — The Cuppachino Trail (Learning
Essentials)

chapter 9
CHAPTER 9 Economic globalisation
Summary
317
sum
mary
Definition and history of economic globalisation
Economic globalisation refers to the spread of business, tradeand investment across national borders, and the unification oflocal markets to become international markets. Globalisationhas been accelerated by the deregulation of markets and econ-omies by national governments, improved speed and cheapnessof transport and communications, technological advances andthe increased mobility of money and capital. Globalisation is nota new development but the process has recently accelerated. Forinstance, colonisation by European powers over the past fewhundred years and the growth of commodity trade in wool, min-erals and grains started the process. As noted by economist,David Ricardo, international specialisation in areas of compara-tive cost advantage assisted the trend, as did the move towardstariff reductions, freer trade and the formation of internationaltreaties, trading blocs and agreements (e.g. WTO, IMF, EU).
Reasons for economic globalisation
Corporations go global because it is beneficial for theirefficiency, costs, profitability and growth. More specifically, thebenefits relate to:� the minimisation of labour costs by moving to low-wage coun-
tries for labour intensive production� a greater access to natural resources than would be available
in the country of origin� the gaining of better economies of large scale by expanding
the size of the business; in this way costs that are relatively fixed(e.g. product development, management) can be spread morethinly reducing the per unit cost or price of the product
� an ability to take advantage of helpful government policiesoffered in some countries (e.g. absence of environment con-trols, tax concessions or exemptions, free land or cheappower) that are good for profits
� the desire to minimise transport and storage costs� improving the flexibility in company decision-making.
The effects of economic globalisation for Australia
Globalisation has both good and bad effects on individuals,countries and regions. For Australia:� Globalisation and openness have helped to lower inflation by
exposing local producers to intense foreign competition astariffs are reduced.
� Globalisation and openness increased structural unem-ployment in the short term by forcing the closure of uncom-petitive local industries and firms. However, in the long term,globalisation can probably help to increase employment inareas where there is good efficiency and a comparative costadvantage exists.
� By forcing governments, firms and workers to lift efficiency,globalisation has probably helped to accelerate economicgrowth.
� Globalisation and openness have helped to lower the cost ofcredit or interest rates through stiffer competition amongfinancial institutions (e.g. banks).
� Globalisation has increased consumer choice or product var-iety by giving our consumers access to foreign items, providedthat the unique local product is not forced out of the market.
� Globalisation has forced government policy to focus on thecontrol of inflation, the promotion of economic efficiencyand cost reduction, responsible budgetary and monetary pol-icies, and the acceleration of microeconomic reforms.
� Globalisation may create environmental problems if foreigncompanies are encouraged by governments not concerned bypollution or damage to the natural environment.
� Globalisation may have led to the spread of crime, terrorism,illegal drugs and uncontrollable migration which couldundermine both economic and non-material living standardsof countries.
A case study of a multinational corporation in Australia —Nestlé
Nestlé is a multinational which originated in Switzerland in the1860s. Today, the company employs over 253 000 workers in80 countries with annual sales equal to about 10 per cent ofAustralia’s GDP. � The company expanded quickly using several strategies.
These included the use of technology and research to inventpopular products (e.g. instant coffee, infant and powderedmilks), advertising, takeovers of successful food and otherproducers in local and foreign countries that produced goodquality products, business rationalisation, and the expansioninto strategic high income markets for their products aroundthe world.
� In Australia, Nestlé employs around 5000 workers in over 20towns, produces $2.4 billion in sales (e.g. Nescafé, Milo, Sun-shine Milk, Kit Kat, Maggi, Nestlé Yogurt, Peters, Lean Cui-sine, Minties, Life Savers, Papa Giuseppi’s, Lucky Dog andAllens), has annual exports valued at around $427 millionand injects about $1.2 billion (estimate only) into theAustralian economy in wages, tax and purchases.
The effects of globalisation on low-income countries
Commentators find difficulty reaching agreement about theeffects that the last wave of globalisation (1980 to at least 2007)has had on low-income countries in Asia and Africa. Someresearch suggests that it has greatly helped to accelerate GDPper head, improved the Human Development Index andreduced poverty rates. In addition, it is claimed that it hashelped to reduce global income inequality. However, criticspoint out the weaknesses in the statistical data used to concludethat globalisation is beneficial for low-income countries. Theyalso note that globalisation may not be the main driver behindfaster economic growth, and they focus on growing world pov-erty, inequality, the exploitation of workers, starvation, theattack on the environment, and adverse global social develop-ments caused by widening incomes between countries. In con-clusion, it was suggested that, on its own, globalisation(openness in international trade and capital movements) will do

Economics Down Under Book 1318
sum
mary
little to raise poor living standards and reduce poverty in poorcountries. Other strategies are also needed including encour-aging democratic principles to control government corruptionand incompetence, encouraging national saving and invest-ment, improving infrastructure, solving unemployment,reducing population pressures and lowering income inequality.
The nature and effect of Australia’s foreign aid
Foreign aid refers to financial (hard and soft loans, and gifts)and other assistance, usually given by richer countries to poorer
countries. Australia gives almost $2.5 billion annually in govern-ment foreign aid, but this is only a miserable 0.26 per cent ofour GDP. Aid goes to countries including Papua New Guinea,Solomon Islands, China, Indonesia, Vietnam, Philippines, EastTimor and Fiji. Aid helps make up for the deficiency of savingand investment funds in poorer countries, and can help breakthe circle of poverty by raising efficiency and per capita incomelevels.
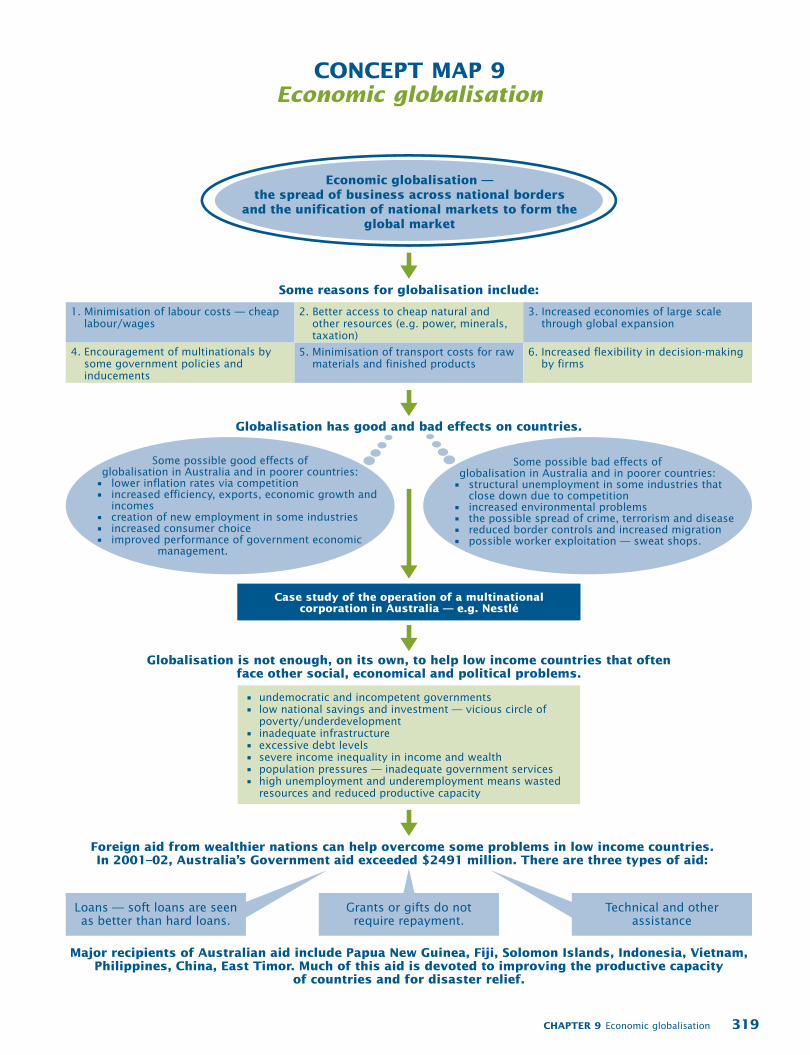
CHAPTER 9 Economic globalisation 319
Some possible good effects of globalisation in Australia and in poorer countries:• lower inflation rates via competition• increased efficiency, exports, economic growth and
incomes• creation of new employment in some industries• increased consumer choice• improved performance of government economic
management.
Some reasons for globalisation include:
Globalisation has good and bad effects on countries.
Globalisation is not enough, on its own, to help low income countries that oftenface other social, economical and political problems.
Foreign aid from wealthier nations can help overcome some problems in low income countries.In 2001–02, Australia’s Government aid exceeded $2491 million. There are three types of aid:
Major recipients of Australian aid include Papua New Guinea, Fiji, Solomon Islands, Indonesia, Vietnam,Philippines, China, East Timor. Much of this aid is devoted to improving the productive capacity
of countries and for disaster relief.
Economic globalisation —the spread of business across national borders
and the unification of national markets to form the global market
1. Minimisation of labour costs — cheap labour/wages
2. Better access to cheap natural and other resources (e.g. power, minerals, taxation)
• undemocratic and incompetent governments• low national savings and investment — vicious circle of
poverty/underdevelopment• inadequate infrastructure• excessive debt levels• severe income inequality in income and wealth• population pressures — inadequate government services• high unemployment and underemployment means wasted
resources and reduced productive capacity
3. Increased economies of large scale through global expansion
4. Encouragement of multinationals by some government policies and inducements
5. Minimisation of transport costs for raw materials and finished products
6. Increased flexibility in decision-making by firms
Case study of the operation of a multinational corporation in Australia — e.g. Nestlé
Some possible bad effects of globalisation in Australia and in poorer countries:• structural unemployment in some industries that
close down due to competition• increased environmental problems• the possible spread of crime, terrorism and disease• reduced border controls and increased migration• possible worker exploitation — sweat shops.
Loans — soft loans are seen
as better than hard loans.
Technical and other
assistance
Grants or gifts do notrequire repayment.
CONCEPT MAP 9
Economic globalisation