chapter four science and sustainability
TRANSCRIPT
SCIENCE AND SUSTAINABILITY | 53
4. SCIENCE AND SUSTAINABILITY
4 CHAPTER FOUR
THE SECTION IS DIVIDED AS FOLLOWS Over the past few years, the kiwifruit industry has vastly increased its focus on sustainability. Therefore, this chapter was expanded in 2019 and divided into five sections to give a broad overview of science topics under the sustainability lens. Firstly, in sections 4.1 and 4.2, the key drivers for sustainability and the industry’s priorities are laid out. In sections 4.3, 4.4 and 4.5, these key priorities are expanded to provide an extensive overview of sustainability including topical subjects such as biosecurity, climate change and water management.
4.1 The Drivers for Sustainability 54
4.2 Sustainability Priorities 55
4.3 Our Kiwifruit 56
4.4 Our Environment 62
4.4.1 Packaging 62
4.4.2 Water 62
4.4.3 Sustainable Nutrient Management 64
4.4.4 Climate Change 67
4.4.5 Agrichemical Use 71
4.5 Our Communities 74
4.5.1 Biosecurity 74
4.5.2 Industry Response to Psa 78
4.5.3 Positive Market Contribution 82
SCIENCE AND SUSTAINABILITY

| SCIENCE AND SUSTAINABILITY 54
4.1 THE DRIVERS FOR SUSTAINABILITY
In the mid-2000s, global retailers were challenged by non-government organisations to reveal the environmental cost of sourcing products. At that time, kiwifruit was cited as an example of a product that was grown, stored and shipped long distances to be sold in Europe. By partnering with government, including the Ministry of Foreign Affairs and Trade and the Ministry for Primary Industries, Zespri co-funded research on determining the carbon and water footprints for kiwifruit grown in New Zealand and consumed in Europe.
Essentially, the findings highlighted that the environmental impacts of New Zealand kiwifruit were comparable to those of competitors, including kiwifruit grown within Europe. This information was then communicated to Zespri’s retail customers, where it helped alleviate major concerns about New Zealand’s Kiwifruit. This example highlighted to the kiwifruit industry that there was a need to better understand the environmental impacts of kiwifruit so that Zespri could respond more quickly to any questions related to this topic from the markets or local communities.
Right: Zespri Kiwifruit displayed in a supermarket in Europe

SCIENCE AND SUSTAINABILITY | 55
4.2 SUSTAINABILITY PRIORITIES
In 2010, Zespri developed a strategy to manage the environmental risks associated with fresh kiwifruit production and consumption. At that time, the top five globally important environmental impact areas were identified. These areas were greenhouse gas emissions (carbon footprint), water, waste, non-renewable resources and biodiversity. The state of these across the New Zealand kiwifruit sector were then assessed over the ensuing years to manage the associated risks and opportunities.
More recently, the kiwifruit industry has increased its focus on sustainability. Consumers are expecting more from businesses in terms of sustainability – they care about what their food is wrapped in and want to know more about where it comes from and that it has been grown in a way that enhances the environment and supports livelihoods. As the industry adopts sustainable business practices that earn the trust of consumers and communities, the value of the Zespri brand will strengthen as well as enable the continued growth of our industry.
Zespri is developing a framework for sustainability, setting out their priorities under the three pillars of:
4.3 Our Kiwifruit - Helping people live healthier lives through great nutrition, supported by the highest standards of food safety.
4.4 Our Environment - Addressing how production, supply and sales impact on and enhance the environment, focusing on packaging, water quality and climate change.
4.5 Our Communities - Making a positive contribution to peoples’ livelihoods and wellbeing, through delivering returns to growers, protecting our investment from new pests and diseases, good working conditions for our people and positive contributions in overseas markets.

| SCIENCE AND SUSTAINABILITY 56
4.3 OUR KIWIFRUIT
Right: Comparison of the nutrient adequacy and nutrient density properties of Zespri kiwifruit and other commonly eaten fruit
Nutrient Density
Health and Wellbeing Benefits of Kiwifruit
NUTRIENT ADEQUACY
NUTRIENT DENSITY
KIWIFRUIT, ZESPRI SUNGOLD
14.2KIWIFRUIT, ZESPRI SUNGOLD
22.5
LONGAN 12.8 LONGAN 21.3
AVOCADO 10.8 MELON (CANTALOUPE) 20.6
KIWIFRUIT, ZESPRI GREEN 8.7 TOMATO 14.9
DURIAN 8.5 ORANGES 14.4
MELON (CANTALOUPE) 7.0KIWIFRUIT, ZESPRI GREEN
14.3
ORANGE 6.8 MANDARINS 12.7
MANDARINS 6.7 STRAWBERRIES 9.7
POMEGRANATES 6.2 WATERMELON 8.9
PEARS 4.1 POMEGRANATES 7.4
MANGO 4.0 PINEAPPLE 7.3
BANANAS 3.7 PEARS 7.2
PINEAPPLE 3.7 CRANBERRIES 6.8
CHERRIES 3.4 MANGO 6.7
CRANBERRIES 3.1 DURIAN 5.8
STRAWBERRIES 3.1 AVOCADO 5.4
TOMATO 2.7 CHERRIES 5.4
WATERMELON 2.7 BLUEBERRIES 4.5
BLUEBERRIES 2.6 PAPAYA 4.4
GRAPES 2.5 BANANAS 4.2
APPLES 1.9 APPLES 3.6
PAPAYA 1.9 GRAPES 3.6
Nutrient adequacy is a measure of how many nutrients the fruit provides relative to its weight. The calculation factors the nutrient composition of each fruit as a percentage of the of the Recommended Daily Allowance (RDA) for 16 specific vitamins and minerals, including protein, fibre, calcium, iron, vitamin A, thiamin B1, riboflavin B2, niacin B3, vitamin B6, vitamin B12, folate, vitamin C, vitamin D, vitamin E, pantothenic acid B5, and magnesium.
Nutrient density measures how many nutrients the fruit provides relative to the number of calories it contains i.e., the nutrient adequacy score is divided by the number of calories the fruit has. The high amount of vitamin C in kiwifruit is the primary driver of its high nutrient adequacy score. Other nutrients boosting this score include fibre, folate, and vitamin E. Kiwifruit’s high nutrient density is one of the key advantages it has over other commonly eaten fruit.

SCIENCE AND SUSTAINABILITY | 57
Vitamin C
Vitamin C plays a significant role in maintaining good health by influencing various components of the immune system and promoting a general feeling of vitality. Vitamin C helps to activate a number of enzymes in your body that improve metabolic energy levels and different neurochemicals in the brain.
Humans can only obtain vitamin C through their diet, and because the body can only store a limited amount vitamin C needs to be ingested daily. Various fruits and vegetables are rich in vitamin C, and kiwifruit is one of the best sources of vitamin C among fruit and vegetables.
Dietary Fibre
Dietary fibre is made up of plant components that reach the intestine without being digested and undergo total or partial fermentation in the large bowel by gut bacteria. Dietary fibre has been linked with a multitude of health benefits including digestive health, the regulation of glucose in the blood, blood cholesterol levels and weight management.
There are two types of fibre, both necessary for good health:
• Soluble fibre (pectin, gums and mucilage) found mainly in plant cells: Helps to lower blood cholesterol levels and can help to reduce constipation. Found in fruits, vegetables, oat bran, barley, flaxseeds, dried beans, lentils, peas and soy products.
• Insoluble fibre (cellulose, hemicellulose and lignin) from the structural part of plant cells: The main effect of insoluble fibre is to add bulk of faeces, and to alleviate constipation and associated problems such as haemorrhoids. It is also linked to reduced cardio-vascular risk. Found in wheat bran, corn bran and rice bran, the skins of fruits and vegetables, nuts, seeds, legumes and wholegrain cereals.
Kiwifruit contains both soluble and insoluble fibre at a ratio of approximately 1:4 in Green Kiwifruit and 1:3 in SunGold. Pectic polysaccharides (the soluble fibre in kiwifruit) have the ability to retain water and form gels, which supports digestive comfort.
Right: Vitamin C content comparison graph
Kiwifruit is high in vitamin C which helps strengthen the body’s natural defenses

| SCIENCE AND SUSTAINABILITY 58
Right: Fibre content comparison graph
Folate
Folate (vitamin B9) is an essential nutrient for cell growth and development and is important in the formation of the red blood cells which transport oxygen, iron and other minerals. Women need significantly higher levels of folate before and during pregnancy. It is vital for normal fetal development e.g., for reducing the incidence of neural tube defects. Folate is so important for healthy body functioning that many countries fortify bread and flour with folic acid (synthetic form) to ensure more of their population, particularly women, have an adequate dietary intake. However, between 50 to 80% of folate is destroyed if cooked, so kiwifruit that are generally eaten raw are an excellent source.
MEASUREDIETARY FOLATE
US RDA* US RDA EU PRI* EU RDA NZ RDI* NZ RDI
g µg µg % µg % µg %
AVOCADO 100 110.0 400 27.50 330 33.33 400 27.50
MANGO 100 43.0 400 10.75 330 13.03 400 10.75
KIWIFRUIT, ZESPRI GREEN
100 38.0 400 9.50 330 11.52 400 9.50
POMEGRANATES 100 38.0 400 9.50 330 11.52 400 9.50
PAPAYA 100 37.0 400 9.25 330 11.21 400 9.25
DURIAN 100 36.0 400 9.00 330 10.91 400 9.00
MANDARINS 100 34.0 400 8.50 330 10.30 400 8.50
KIWIFRUIT, ZESPRI GOLD
100 31.0 400 7.75 330 9.39 400 7.75
ORANGES 100 27.0 400 6.75 330 8.18 400 6.75
STRAWBERRIES 100 20.0 400 5.00 330 6.06 400 5.00
MELON (CANTALOUPE) 100 19.0 400 4.75 330 5.76 400 4.75
BLUEBERRIES 100 12.0 400 3.00 330 3.64 400 3.00
PEARS 100 7.0 400 1.75 330 2.12 400 1.75
CHERRIES 100 6.0 400 1.50 330 1.82 400 1.50
PINEAPPLES 100 5.0 400 1.25 330 1.52 400 1.25
TOMATO 100 2.6 400 0.65 330 0.79 400 0.65
GRAPES 100 2.0 400 0.50 330 0.61 400 0.50
CRANBERRIES 100 1.0 400 0.25 330 0.30 400 0.25
APPLES 100 0.0 400 0.00 330 0.00 400 0.00
BANANAS 100 0.0 400 0.00 330 0.00 400 0.00
WATERMELON 100 0.0 400 0.00 330 0.00 400 0.00
LONGAN 100 N/A 400 N/A 330 N/A 400 N/A
Below: Folate content comparison table
1.4
5
4
3
Tota
l fib
re c
on
ten
t (g
/10
0g)
Zesp
ri S
un
Go
ld*
* USDA Nutrient Database 2012 (Release 28) ** New Zealand FOODfiles 2014 Version 01
Zesp
ri G
reen
*
Ap
ple
s
Ban
anas
Gra
pes
Cra
nb
erri
es
Ora
nge
s
Man
dar
ines
Staw
ber
ries
Mel
on
s
Blu
eber
ries
Pea
rs
Wat
erm
elo
ns
Po
meg
ran
ates
Pap
aya
Man
goes
Pin
eap
ple
s
Lon
gan
s
Du
rian
s
2
1
0
3.0
2.6
0.9
2.4
1.82.0
0.8
4.0
1.8 1.8
1.41.1
3.8
2.4
4.6
2.4
3.1
0.4

SCIENCE AND SUSTAINABILITY | 59
Right: Potassium content comparison graph
Potassium
Potassium is an important mineral for the normal function of the nervous system and muscular contraction. It is also beneficial in maintaining normal blood pressure and heart health. Potassium maintains fluid and electrolyte balance. Food processing tends to lower potassium levels and increase sodium levels (with associated negative impacts on health). Whole, fresh foods such as fruits, green vegetables and cereals or wholemeal bread are generally higher in potassium and lower in sodium. Kiwifruit is a great natural source of potassium, almost comparable to bananas – the fruit traditionally linked with potassium.
Actinidin
Uniquely, Kiwifruit contains actinidin, a highly active cysteine protease enzyme. This enzyme can break down a wide range of food proteins more completely and faster than the body’s digestive enzymes can do on their own. Actinidin may also play a role in maintaining muscle health as enhanced food protein digestion in the small intestine improves protein absorption, which is linked to muscle repair. It has been observed that the presence of actinidin causes a more rapid emptying of the stomach when digesting beef. This means that eating kiwifruit with a protein-rich meal can offer benefits for people with a compromised digestive system and help reduce the sensation of heaviness and the gastric disturbances typical of protein-rich diets.
Levels of actinidin in kiwifruit differ between varieties although the methods of testing and reporting differ so comparison is difficult. Generally, Green kiwifruit contain the highest amounts of actinidin, with lesser amount in Gold varieties and virtually none in Red. Actinidin levels may also be a function of maturity of the fruit.
Kiwifruit, Actinidin and food allergies
Actinidin may be responsible for a small number of people who report allergic reactions to kiwifruit. Those that have mild allergies to Green Kiwifruit do not typically have the same reaction to SunGold but should consult a healthcare professional before trialling it.
315
500
400
300
Po
tass
ium
(mg/
100
g)
Zesp
ri S
un
Go
ld*
* USDA Nutrient Database 2012 (Release 28) ** New Zealand FOODfiles 2014 Version 01
Zesp
ri G
reen
*
Ap
ple
s
Ban
anas
Gra
pes
Cra
nb
erri
es
Ora
nge
s
Man
dar
ines
Staw
ber
ries
Mel
on
s
Blu
eber
ries
Pea
rs
Wat
erm
elo
ns
Po
meg
ran
ates
Pap
aya
Man
goes
Pin
eap
ple
s
Lon
gan
s
Du
rian
s
200
100
0
301
358
191 181166
153
228 236257
156
108
266
436
EU RDA 15%
7785107 119 112

| SCIENCE AND SUSTAINABILITY 60
Antioxidants
Antioxidants, found in certain foods, scavenge and neutralise free radicals from the body’s cells and prevent or reduce the cell damage caused by oxidation. These include the nutrient antioxidants vitamins A, C and E and a range of biologically active phytochemicals. Vitamin E and the polyphenols and flavonoids found in both Green and SunGold are the major contributors to the antioxidant capacity of kiwifruit. Quercetin, a flavonoid in kiwifruit, has both antioxidant and anti-inflammatory properties. Carotenoids lutein and zeaxanthin also support antioxidant function in the body, particularly in eye health. Gold kiwifruit is particularly high in the polyphenol epicatechin, and Green kiwifruit has a range including epicatechin, lutein and kaempferol. While it is not possible to link the polyphenolic compounds in kiwifruit to any specific health benefit, strong evidence exists demonstrating that eating foods with polyphenolic compounds contributes to good overall health. 30% of the total polyphenols in SunGold are found in the skin, so plan to eat them with the skin on.
Glycaemic Index
The Glycaemic Index (GI) is a relative ranking of carbohydrates in foods according to how they affect blood glucose levels. Different foods are classified as High, Medium or Low on the Glycaemic Index.
• High GI >70 • Medium GI 55-70 • Low GI <55
High GI foods are rapidly digested and absorbed, and result in a rapid, marked rise in plasma glucose levels, whereas the same amount of carbohydrate in low GI foods are more slowly digested and absorbed, resulting in a gradual rise in plasma glucose response and insulin levels. Management of blood sugar levels is particularly important for people with Pre-diabetes and Diabetes, a growing portion of the population.
Right: Glycaemic Index table Serving Size Glycaemic Index
Glycaemic Index Rank
9Glucose comparison
- 10g CHOL.M.H
Avocado 100 15 L
Tomato 100 15 L
Kiwifruit, Zespri SunGold 100 38 L
Apples 120 39 L
Kiwifruit, Zespri Green 120 39 L
Strawberries 120 40 L
Oranges 120 43 L
Bananas 120 47 L
Mandarins 120 47 L
Durian 100 49 L
Mango 120 51 L
Bluberries 100 53 L
Papaya 120 56 M
Grapes 120 59 M
Pineapple 120 59 M
Cherries 120 63 M
Melon (Cantaloupe) 120 70 H
Watermelon 120 76 H
Cranberries 100 n/a n/a
Longan 100 n/a n/a
Pears 100 n/a n/a
Pomegranates 100 n/a n/a

SCIENCE AND SUSTAINABILITY | 61
Right: How foods affect your blood sugar
Low GI foods looks
like this!
An unhealthy response looks like this: spike and rapid fall
Foods differ in their impact on blood sugar
Approximately 80% of the dry weight of ripe kiwifruit consists of available carbohydrates, including glucose, fructose and sucrose at a ratio of about 2:2:1. The remaining 20% of the dry weight of kiwifruit consists of protein (10%) and fibre (10%).
Of these sugars, glucose has a GI of 100% (the benchmark), fructose 19% and sucrose 68%. With a low GI of 38-39, combined with a modest content of carbohydrate, and a fibre component that slows the rate of absorption, kiwifruit is an excellent fruit choice for people with diabetes trying to manage their blood sugar levels.
There is growing evidence highlighting that consuming of kiwifruit has a positive impact on the microbiota in the colon which have also recently been identified as a new potential factor in obesity-related disorders. Growing evidence in clinical studies suggests that alterations in the colonic microbiota of people with obesity may lead to chronic low-level inflammation, insulin resistance and onset of Type 2 diabetes.
There is growing evidence highlighting that consuming of kiwifruit has a positive impact on the microbiota in the colon which have also recently been identified as a new potential factor in obesity-related disorders.

| SCIENCE AND SUSTAINABILITY 62
4.4 OUR ENVIRONMENT
Organic Production
Consumers are becoming increasingly concerned about how their food is produced and the associated impacts of getting fruit to market. Some consumers look for options that are more environmentally friendly, in particular organics, and this is driving significant growth - “The organic market is the fastest expanding, multi-food category globally, pushing double digit global growth over the last decade and is now mainstream. The world wants safe, clean, honest food.” (2018 OANZ Report).
In 2017, about 165 orchards in New Zealand were growing organic kiwifruit representing about 480 hectares. Organically grown kiwifruit generally has lower average yields than conventionally grown kiwifruit, however this is offset by a premium over conventional fruit. It is therefore possible for the returns of organic growers to be as good if not better than conventional growers. The core markets for Zespri Organic are North America, Europe and Japan which account for over 80% of global sales by volume (2018 OANZ Report).
Zespri Organic Kiwifruit is grown to the strictest organic standards and is certified by Bio-Gro, New Zealand’s organic protocol organisation. Key input differences are that fewer agrichemicals can be used on organic orchards and synthetic nitrogen (e.g., CAN, urea) is not permitted.
A study undertaken by The Agriculture Research Group on Sustainability (ARGOS) found that the environment of kiwifruit orchards is good regardless of whether they are organic or conventional, but that there are some differences between organic and conventional systems. For more information visit: www.argos.org.nz.
4.4.1 Packaging
Like many other products, kiwifruit is exported around the world in packaging designed to protect it and ensure the best quality fruit is delivered to consumers. In recent years, images of damage to wildlife caused by plastic have put a spotlight firmly on plastics in supply chains. In recognition of this concern and to meet increasing customer requirements for less plastic, in 2019, Zespri signed up to a New Plastics Economy Global Commitment to have packaging that is 100% reusable, recyclable, or compostable by 2025.
4.4.2 Water
Declining freshwater quality and availability has become a global concern. Although by world standards, New Zealand has clean and abundant freshwater, the quality in some of New Zealand’s rural and urban areas has been come under increased pressure due to land use intensification and the loss of nutrients (e.g., urine and fertilisers) from farms into waterways.
See: https://www.ellenmacarthurfoundation.org/our-work/activities/newplastics-economy
Significant pieces of research are underway to achieve this goal related to better understanding the current packaging used and it’s impacts, and to find alternative materials or solutions that will allow the continued deliver of high-quality fruit to consumers.

SCIENCE AND SUSTAINABILITY | 63
Water Strategy
Sustainability is a key driver in the NZ kiwifruit industry – both in terms of our returns and our impact on communities and the environment. The industry has developed a water strategy to protect and enhance water resources for our people, our environment and our communities while enabling the industry to grow. The Water Strategy includes looking at how we use water, how we can do so in the most sustainable way and how we can gather data to measure our progress and improve. The strategy was created in 2019 by NZKGI, Zespri, Maori Kiwifruit Growers, Horticulture NZ and growers. It is supported by four working groups who are working towards a range of objectives that will improve water quality and use on orchards.
National Water Policy
The government is focussed on improving water quality around New Zealand and making sure that people only use what they need. To ensure that this happens, the government has developed Essential Freshwater Policy which has a number of regulatory measures, which include:
1. National Policy Statement for Freshwater Management The clearing of native vegetation, New Zealand’s growing population, urbanisation, farming/forestry, the drainage of wetlands and the damming and modification of rivers and streams have all had significant effects on our land and placed increasing pressure on our water bodies and ecosystems. In response to this, and to protect freshwater quality, the New Zealand Government established a National Policy Statement for Freshwater Management (NPSFM) in 2014 which was amended in 2017 and in 2020. The NPSFM directs regional councils, in consultation with their communities, to set objectives for the state of freshwater bodies in their regions and to set limits on resource use to meet these objectives.
The strategy can be found on NZKGI website: https://www.nzkgi.org.nz/wp-content/uploads/2020/09/J002013_Water_Strategy_Document_Update_R2_Final_WEB_Small.pdf
Regional Councils are currently implementing the NPSFM via regional plans and are required to notify plans no later than 31 December 2024. The NPSFM can be found on the Ministry for the Environment website: https://www.mfe.govt.nz/sites/default/files/media/Fresh%20water/national-policy-statement-for-freshwater-management-2020.pdf
2. National Environmental Standard Freshwater A new national standard was released in 2020 and provides specific direction on water use, in particular where rapid action is required, for example, in at-risk catchments.
The new rules can be found on the Ministry for the Environment website: https://www.mfe.govt.nz/sites/default/files/media/Fresh%20water/action-for-healthy-waterways-information-for-horticultural-growers-updated.pdf
3. Review of the Resource Management Act (RMA) A review of the RMA was completed in 2020 and was undertaken in recognition that the current is no longer considered fit for purpose. The specific aim of the review was to improve environmental outcomes and better enable urban and other development within environmental limits.
The review provided a summary of key recommendations which can be found on the Ministry for the Environment website: https://www.mfe.govt.nz/rmreview The next step in the reform process will be consultation to develop government policy and the form of future legislation.

| SCIENCE AND SUSTAINABILITY 64
4.4.3 Sustainable Nutrient Management
When the term ‘sustainable nutrient management’ is used, it is often in relation to maintaining or improving freshwater quality. The most prevalent problem is eutrophication which is the nutrient enrichment of freshwater bodies leading to the growth of unwanted aquatic plants like algae and rooted plants. Excessive levels of nutrients in water can also be harmful to animals and humans, particularly infants.
Nitrogen (N) and Phosphorus (P) are presently the main nutrients of concern and must be carefully managed as the input of these into a water body can significantly affect its quality. Consequently, there is growing social and regulatory pressure to mitigate the impacts of these. Understanding the N and P cycles, and how these can move from land and into water bodies is key to managing these nutrients effectively. Losses of sediment and E. coli to freshwater are also a concern in some places.
Leaching
Leaching refers to the loss of nutrients and other chemicals through the soil with water as it drains through. Weather (particularly rainfall), soil characteristics, irrigation, fertiliser practices and plant uptake are the main factors that contribute to leaching from kiwifruit orchards. An orchard with a free draining soil that is saturated, where soluble fertiliser is applied prior to a major drainage event (e.g., heavy downpour) may lose a significant amount of nutrients.
Nitrogen (N) is the main leaching risk for freshwater quality. This is because nitrogen applied to or already present in the soil is converted to nitrates (NO3-), which are not strongly held by the soil and are therefore are readily leached with water as it drains down through the soil profile. Although N is usually available in the soil for plant uptake initially in the form of ammonium, which leaches much less, this is converted to nitrate through the microbial process of nitrification (see figure below).
Right: Soil nitrogen cycle for a plant-based system

SCIENCE AND SUSTAINABILITY | 65
How Much N is applied to Kiwifruit Orchards and How Much is Leached?
Generally, mature kiwifruit orchards generally receive around 100 kg N/ha/yr (Nitrogen/per hectare/per year), give or take about 20%. Developing orchards may receive more to develop canopy quickly. On conventional orchards, more soluble fertilisers like calcium ammonium nitrate (CAN; 27% N) are commonly applied while on organic orchards, relatively insoluble inputs like composts are often used, at 5-10 tonnes/ha; developing orchards and orchards where soil organic matter is low may receive considerably more compost than this.
The associated N losses to water from kiwifruit orchards has previously been modelled to be typically less than 20kg NO3-N/ha/yr on average (for orchards in the Bay of Plenty where most orchards are located) . However, the model (OVERSEER™) used for this has not been well calibrated for kiwifruit so there is some uncertainty around the accuracy of these values. Research is therefore underway to better understand losses from orchards. In this, nitrogen losses are being directly measured using drainage fluxmeters.
As far as ecological and human health concerns are framed, it’s the concentration of nitrate-nitrogen (mg N/L, or parts per million) in water that is important, not the loading (kg N/ha/yr). High concentrations of nitrate in drinking water can pose a health risk for certain people, particularly bottle-fed babies who drink formula made with the water. For this reason, the Ministry of Health has a Maximum Acceptable Level (MAV) of 11.3 mg/L (or parts per million) for nitrate-nitrogen. Measured and modelled values for kiwifruit on average have been found to be below this.
How are Nutrient Losses Determined?
Directly measuring nutrient losses from farms is not practical and is expensive. Therefore, models are often used to estimate losses. In kiwifruit, two models called OVERSEER™ and SPASMO have been used previously as these have dedicated kiwifruit components. OVERSEER™ is the most widely used model in New Zealand agriculture and is being used to develop nutrient budgets i.e., reports showing the amounts of nutrients added and lost from farms. In some places it is mandatory for OVERSEER™ to be used in order to obtain consent to farm. Overseer is not used much in the kiwifruit industry, one of the reasons being that it has not yet been well calibrated for kiwifruit and should therefore be used with caution.
Phosphorus
Phosphorus is the other main nutrient of concern for freshwater quality. Like N, too much P in aquatic environments can lead to excessive plant growth, algal blooms and the depletion of oxygen dissolved in the water. But unlike N, the main pathway for P entering our waterways is via run-off, unless the soils are coarse pumice or sandy in which case leaching could occur. Generally, P losses from kiwifruit orchards are thought to be low because orchards are relatively flat and so surface run-off of water is lower. Also, features like grass swards and shelterbelts impede run off. Research is underway to measure P run-off from kiwifruit orchards.
For more information, visit http://overseer.org.nz.

| SCIENCE AND SUSTAINABILITY 66
Recommended Practices for Sustainable Nutrient Management in Kiwifruit
The 4Rs of Nutrient Stewardship
This is the concept of applying the right fertiliser source at the right rate at the right times in the right place. More specifically:
• Fertiliser inputs should match what the plant requires taking into account production goals as well as the availability of nutrients in the soil. The process of mineralisation (i.e., release of N from organic matter) should be considered as this can supply nitrogen for plants. Applying higher amounts of N may not necessarily increase production but result in unwanted vigour.
• Don’t apply N when the drainage risk is high, for example in the wetter winter months and when the soil is waterlogged.
• If N is applied in one application, then some of that will not be taken up by the plant and be available in the soil to be leached. First application of the season should be as close to bud break as practical. Applying well before in wetter months does not advantage N uptake but increases the risk of leaching. Generally, for kiwifruit it is recommended to split applications i.e., apply around two thirds prior to budbreak and the rest in late spring/early summer, prior to fruitset.
Other options for minimising nutrient losses in a kiwifruit orchard are presented below. Growers should consider how these might affect their economic and production objectives.
Plant Vegetation Around Waterways
Buffer zones of vegetation adjacent to waterways act as a last line of defence and will filter nutrients as well as reduce erosion and enhance biodiversity. These zones are commonly referred to as riparian zones.
Minimise Bare Ground
Plants present in orchards will take up nutrients that would otherwise
be lost. Ground cover also protects the soil which is beneficial. Research is proposed to better understand the benefits of ground covers in kiwifruit orchards where low light conditions are a challenge to establishment, as are other practices such as agrichemical use. Having a sward with clover present instead of bare ground is beneficial as it will add N to the orchard system because the clover assimilates N from the atmosphere (through the process of nitrogen fixation).
Sustainable Management Practices: How does your region measure up?
For the regions where kiwifruit is mostly grown, freshwater quality is generally stable or improving although some individual measures in some regions have been deteriorating. To view freshwater quality trends for a specific region or catchment, visit the Land Air Water Aotearoa (LAWA) website http://www.lawa.org.nz.
Maintain Plant Health
Ensuring good plant health and healthy root systems will help to prevent leaching by ensuring the plants are functioning optimally to take up nitrogen.
Consider Less Soluble Forms of N
Organic fertilisers for example are thought to be inherently less soluble and N leaching risk is less. However, they may not deliver sufficient available nutrients to meet fruit production goals. Less soluble forms of synthetic fertiliser (e.g., slow or controlled release) are also available, however like organic forms they may not supply sufficient nutrient when required and are usually more expensive.

SCIENCE AND SUSTAINABILITY | 67
4.4.4 Climate Change
Scientists say there is no longer any doubt that the Earth’s climate is warming. In New Zealand, this is projected to lead to the following changes in climate1:
Higher Temperatures
• Greater increases in the North Island than the South, with the greatest warming in the northeast.
A Change in Rainfall Patterns
• Increased summer rainfall in the north and east of the North Island and increased winter rainfall in many parts of the South Island.
• Increased frequency of dry days for much of the North Island, and for some parts of the South Island.
• Increased frequency of heavy rainfall events over the South Island and some parts of the North Island.
• Increased frequency and intensity of droughts over time, particularly under a high emissions scenario. The strongest increases are over the northern and eastern North Island and along the eastern side of the Southern Alps.
Stronger Winds and Storms
• Some increase in storm intensity, small-scale wind extremes and thunderstorms is likely to occur.
• Ex-tropical cyclones will likely be stronger and cause more damage as a result of heavy rain and strong winds.
• Increased north-easterly airflow in summer and stronger westerlies in winter, particularly in the south.
Change in the Number of Hot and Cold Days
• Increase in the number of hot days and decrease in the number of frost days and snow days.
The above all have the potential to impact on kiwifruit production. The anticipated impacts are shown in the table below. For example, yield is expected to decline due to a decrease in winter chilling associated with less cold in the winter, particularly in Hayward. Gold varieties don’t need as much chilling and are therefore less impacted by warmer winters.
Temperature Apples Grapes Kiwifruit
Temperature means
Yield Quality Disease risk Sunburn
Yield Quality Disease risk
Yield Quality (and )Disease risk
Temperature extremesFrost Heatwaves
Frost damage Frost damage Frost damage
CO2 Biomass Biomass Biomass
Rainfall variability Irrigation Irrigation
Drought risk Irrigation
Water quality Leachate load Leachate load Leachate load
Extreme events• Hail -• Wind -
Damage to fruit -Damage to trees -
Damage to fruit - Damage to vines -
Damage to fruit -Damage to vines -
Combined impacts - Unless pest &
disease impacts override
Unless pest & disease impacts override
Right: Summary of climate-change impacts for the main horticultural industries in New Zealand (from Chapter 6. Horticulture - Adapting the Horticulture and Vegetable Industries to Climate Change. Impacts of climate change on land-based sectors and adaptation options. MPI Technical Report Paper No. 2012/33. Prepared for the Ministry for Primary Industries by NIWA).
1 Source: 2016 MFE Climate Projections for New Zealand – Snapshot. Info 765.

| SCIENCE AND SUSTAINABILITY 68
Preparing for Climate Change
The research which the above table came from proposed that adapting to climate change in horticulture can be considered using the following tri-level scheme.
• Tactical adaptation: This involves modifying production practices within the current system, which in horticulture might involve different sprays, irrigation practices, pest management strategies, or pruning practices.
• Strategic adaptation: At this second level, a change is made to the current production system in a substantive way which in horticulture might mean a change in cultivar, a change to the tree/vine support trellising system, or the installation of netting for hail protection or shade. As discussed above, climate change is expected to impact on current kiwifruit cultivars. In response to this, the kiwifruit industry’s cultivar development programme is considering traits that will deliver new cultivars that are better suited to a changing climate. The includes a focus on greater pest and disease resistance and no reliance on bud-break enhancers.
• Transformational adaptation: At the highest level, adaptation involves adoption of a new production system, or a change in the location of the industry. In horticulture, this could be the development of new plantings of a new crop in a new region, or new plantings of an existing crop in a different region. This would also result in infrastructural changes. Potentially, climate change could see kiwifruit being grown in parts of New Zealand where it currently isn’t due to the climate in those areas becoming more favourable for kiwifruit. Other factors like soil and water availability would need to be favourable too to support this.
Understanding the Contribution of the New Zealand Kiwifruit Industry to Climate Change
Carbon footprint represents the amount of greenhouse gas emissions associated with an organisation, event or production. An increase in greenhouse gas emissions is the primary driver of global warming and climate change. In NZ, the main greenhouse gas is methane from agriculture. For horticulture, including kiwifruit production and distribution, the main greenhouse gas is carbon dioxide.
Carbon footprint is one of the most common measures of the effect of an individual, community, industry, or country on the environment. In addition to doing their part to fight climate change by identifying how emissions can be mitigated or reduced, businesses are interested in carbon foot-printing as it allows them to identify efficiencies and in doing so save money.
In 2020, Zespri published the latest carbon footprint of kiwifruit produced in NZ and distributed and consumed globally. This was 2.0kg of carbon equivalents per 1.0kg of kiwifruit across its lifecycle from orchard to consumer. The break down was as follows:
• Orchard operations made up 6 %
• Packhouse and cool store processes accounted for 11 %
• Port operations made up 1%
• Shipping accounted for 43 %
• Repacking and retailer emissions made up 8 %
• Consumer consumption and disposal comprised 31 %
Zespri is in the process of reassessing the carbon footprint.
You can find more information about where emissions come from here: https://www.zespri.com/en-NZ/newsroomdetail/sustainability-carbon-footprint

SCIENCE AND SUSTAINABILITY | 69
Right: Biological sequestration
Carbon Sequestration
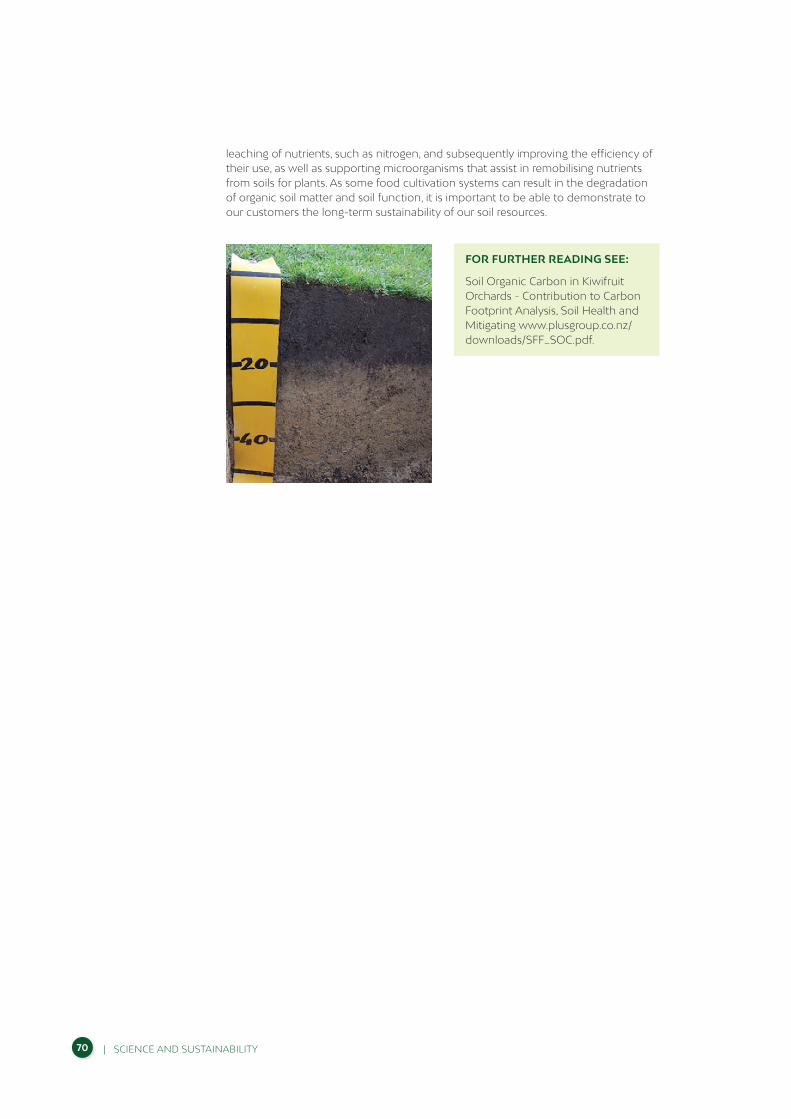
This is the process by which carbon dioxide is absorbed during photosynthesis, and is stored as carbon in biomass (trunks, branches, foliage, and roots) and in the soil (Image below). Kiwifruit orchards therefore have the potential to sequester carbon in vines plus shelterbelts (“Biomass”) and ultimately in the soil in the form of organic matter. This could go some way to offsetting emissions associated with producing the fruit. Research is underway to understand the amount of carbon being sequestered in NZ kiwifruit orchards.
The Role of Soil
For many growers, the health and quality of their soils is an important consideration in their management activities. Globally, health and quality of soils is also seen as important by consumers, retail customers and society. Reasons for this include the role of soil in supporting food production, filtering of water, supporting ecosystem biodiversity and function in the carbon cycle.
Storage of carbon in kiwifruit soils as organic matter occurs because of how we grow and manage our orchards. Many Bay of Plenty orchards are located on allophanic soils that, due to their chemical properties, are good at stabilising any organic carbon deposited within the soil profile. Kiwifruit vines have a root system that can explore soils at depth, and typically can turnover about 40 percent of their root mass annually. For soil carbon accumulation, this root turnover has two main benefits. Firstly, it can deposit carbon from the roots not remobilised into the plant, and secondly, the channels created by roots that have died back can provide earthworms with deeper access into the soil profile. Pergola-trained kiwifruit vines also maintain a moist soil surface over summer, allowing surface organic matter to be broken down by soil microorganisms, and digested by earthworms or washed into root channels for deeper deposition. Once deposited, this organic matter can improve water storage capacity of soils; reducing the amount of irrigation required or in some cases the need for irrigation. Soil organic matter also plays an important role in reducing the
| SCIENCE AND SUSTAINABILITY 70
FOR FURTHER READING SEE:
Soil Organic Carbon in Kiwifruit Orchards - Contribution to Carbon Footprint Analysis, Soil Health and Mitigating www.plusgroup.co.nz/downloads/SFF_SOC.pdf.
leaching of nutrients, such as nitrogen, and subsequently improving the efficiency of their use, as well as supporting microorganisms that assist in remobilising nutrients from soils for plants. As some food cultivation systems can result in the degradation of organic soil matter and soil function, it is important to be able to demonstrate to our customers the long-term sustainability of our soil resources.
SCIENCE AND SUSTAINABILITY | 71
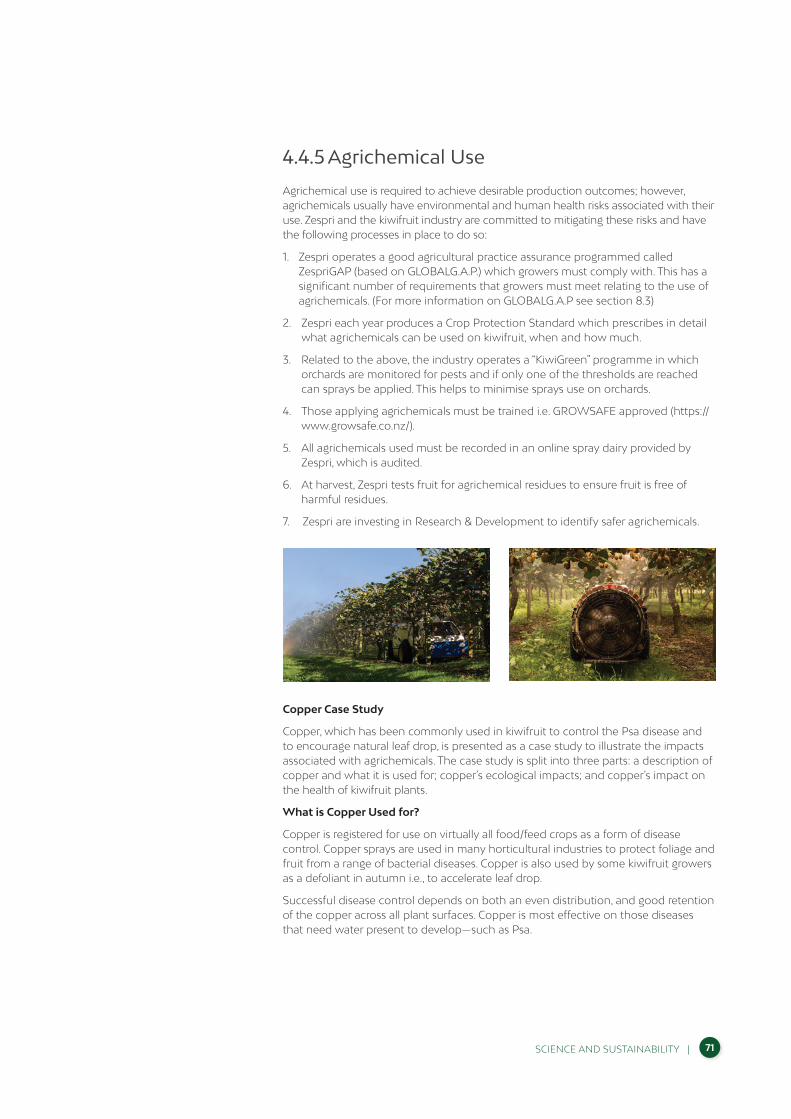
Agrichemical use is required to achieve desirable production outcomes; however, agrichemicals usually have environmental and human health risks associated with their use. Zespri and the kiwifruit industry are committed to mitigating these risks and have the following processes in place to do so:
1. Zespri operates a good agricultural practice assurance programmed called ZespriGAP (based on GLOBALG.A.P.) which growers must comply with. This has a significant number of requirements that growers must meet relating to the use of agrichemicals. (For more information on GLOBALG.A.P see section 8.3)
2. Zespri each year produces a Crop Protection Standard which prescribes in detail what agrichemicals can be used on kiwifruit, when and how much.
3. Related to the above, the industry operates a “KiwiGreen” programme in which orchards are monitored for pests and if only one of the thresholds are reached can sprays be applied. This helps to minimise sprays use on orchards.
4. Those applying agrichemicals must be trained i.e. GROWSAFE approved (https://www.growsafe.co.nz/).
5. All agrichemicals used must be recorded in an online spray dairy provided by Zespri, which is audited.
6. At harvest, Zespri tests fruit for agrichemical residues to ensure fruit is free of harmful residues.
7. Zespri are investing in Research & Development to identify safer agrichemicals.
Copper Case Study
Copper, which has been commonly used in kiwifruit to control the Psa disease and to encourage natural leaf drop, is presented as a case study to illustrate the impacts associated with agrichemicals. The case study is split into three parts: a description of copper and what it is used for; copper’s ecological impacts; and copper’s impact on the health of kiwifruit plants.
What is Copper Used for?
Copper is registered for use on virtually all food/feed crops as a form of disease control. Copper sprays are used in many horticultural industries to protect foliage and fruit from a range of bacterial diseases. Copper is also used by some kiwifruit growers as a defoliant in autumn i.e., to accelerate leaf drop.
Successful disease control depends on both an even distribution, and good retention of the copper across all plant surfaces. Copper is most effective on those diseases that need water present to develop—such as Psa.
4.4.5 Agrichemical Use

| SCIENCE AND SUSTAINABILITY 72
Copper is a bactericide, and it can kill the bacteria on contact. The copper ions travel through the cell walls of the bacteria and disrupt the cellular enzyme activity. It is non-systemic i.e., it is not absorbed or circulated by a plant; it only kills bacteria on the plant surface. As copper is a protectant, it needs to be applied evenly to the plant surface before the disease develops. It is often applied in conjunction with adjuvants that have super spreading capabilities, to allow better coverage with a lower total dose of copper.
Ecological Impacts
Small quantities of copper are necessary for the functioning of most forms of life, but to most aquatic organisms excess levels of copper are highly toxic. The main cause of copper toxicity to fish and aquatic invertebrates is through rapid binding of copper to the gill membranes, which causes damage and interferes with osmoregulatory processes. The amount of cupric ion in the environment, and its toxicity to aquatic animals through gill damage, is dependent on a number of water quality parameters including pH, alkalinity, and dissolved organic carbon.
Many terrestrial animals have the ability to cope with some amount of excess copper exposure by storing it in the liver and bone marrow. Laboratory toxicity studies have shown that exposure to high levels of copper in the diet can overwhelm the ability of birds and mammals to maintain the stability of their body’s internal environment in response to changes in external conditions. However, animals which are repeatedly exposed to levels of copper (which do not cause permanent harm) may undergo enzymatic adaptation which allows them to cope with greater levels of exposure. Available data from a honeybee acute toxicity study indicated that copper is practically nontoxic to honeybees.
To reduce ecological exposures, product use labels have been amended, by way of a reduction of application rates, defining application intervals, and determining seasonal maximum application rates. Monitoring weather conditions and minimising spray drift go some way to reducing non-desirable impacts.
Plant Impacts
Copper (Cu) is considered as a micronutrient for plants. Enhanced industrial and mining activities have contributed to the increasing occurrence of Cu in ecosystems. Excess copper in the soil can induces stress and causes toxicity in plants. This leads to plant growth retardation and leaf chlorosis and/or burning. In kiwifruit vines copper toxicity often appears first in the leaves, similar to many other nutrient toxicities. Some key factors that play a role in toxicity problems are listed below:
• Using products that are not designed as agrichemicals
• Excessive chemical rates
• Tank mixing of multiple chemicals
• Poor tank agitation
• Slow drying conditions
• High temperatures during application
• An excessive use of spreader/super-spreaders at high water rates
• An excessive build-up of chemicals on leaves

SCIENCE AND SUSTAINABILITY | 73
Right: Leaf speckling
Far right: Leaf burn at the leaf margin
Right: Bronzing of the upper leaf surface
Far right: Brown staining of leaf veins
Growers must weigh up the risk of disease killing their vines, the risk of chemical use to the environment, and the risk of phytotoxicity resulting in small, light green leaves that cannot support the development of high yielding high quality fruit.
Zespri works closely with growers to ensure that copper, a critically necessary tool to manage Psa, is used effectively with minimum environmental impact. An upper limit is placed on the amount of copper that a grower can apply in one year and this is closely monitored by Zespri – 8 kg/ha/yr for conventional and 6 kg/ha/yr for organic.

| SCIENCE AND SUSTAINABILITY 74
4.5 OUR COMMUNITIES
4.5.1 Biosecurity
International Shipping Routes
Worldwide, there is an increasing amount of kiwifruit loaded directly into containers at cool stores before the containers are trucked to the wharf and shipped to receiving countries. Border officials must ensure that unwanted pests are not being transported to new locations by being lodged in vehicles, machinery, cavities in a container, or in soil, plant material or debris. The image below shows in yellow, the many and varied international shipping routes of vessels entering and exiting New Zealand’s ports. Border officials at each port need to be highly vigilant to ensure unwanted organisms which are currently not present in New Zealand do not cross our borders.
Right: Map showing world shipping movements in yellow
Case Study: Brown Marmorated Stink Bug
The Brown Marmorated Stink Bug (BMSB) is one of the kiwifruit industry’s ‘most unwanted’ biosecurity threats. It is native to parts of Asia but has been invading North America, Europe and Chile in recent years. The risk of it entering New Zealand is considered extreme. The high-risk season for incursions is September through to April. As of January 2021, there had been 42 live BMSB finds - most at the border where they were found on imported equipment, but also in parcels.
BMSB can hitchhike on inanimate objects such as cars and shipping containers from Asia, USA and Europe. If it were to enter the country, it would have no problem establishing due to New Zealand’s highly suitable climate and abundance of host material. Its entry and establishment would result in significant production impacts to many horticultural industries. Kiwifruit is a host species and BMSB feeding results in fruit drop and post-harvest rot. Anecdotal reports (based on evidence in Italy) suggest fruit loss could be up to 30% on some kiwifruit orchards.

SCIENCE AND SUSTAINABILITY | 75
Look for black & white
banding on the sides of the abdomen
Look for black & white
banding on the antennae
If you are unsure, don’t kill it, catch it, snap it and report it
to KVH on
0800 665 825
Identification
There are many other species of stink or shield bugs found in New Zealand that could be confused with BMSB. However, BMSB are larger than the other shield bugs (14-17mm). The banding on the side of the abdomen and on the antennae are characteristic. BMSB emits a pungent odour when disturbed.
The white or pale green cylindrical shaped eggs are laid on the undersides of leaves in clusters of about 25. The eggs are only 1mm in diameter but become apparent when nymphs emerge as they stay with the egg mass for several days. Nymphs are brightly coloured with black and white banding on legs, dark reddish eyes and yellow-reddish underbelly with black stripes.
Signs and Symptoms
BMSB feed on a wide range of plants with seeds or fruit including ornamental plants and vegetables. They pierce the outer surface of the fruit and suck out juices while injecting saliva, which causes dimpling on the fruit’s surface and rotting and corking of the flesh. Adults are mobile and readily move from plants with early ripening fruit to ones with later ripening fruit. They seek shelter in houses/protected areas in autumn/winter. Egg masses and nymphs may be seen on the undersides of leaves.
Right: Nymph and egg mass
Far right: BMSB feeding damage on an apple

| SCIENCE AND SUSTAINABILITY 76
Right: BMSB distribution shown in red
Distribution and Climate Range
BMSB is now present across three major continents. It is native to Asia and found in China, Japan and Korea. In 1996 it invaded the USA where it has been found in 44 states and four Canadian provinces. In 2007, it was detected in Switzerland and 13 countries across Europe are now reported to have established populations. BMSB has been found in Santiago, Chile, the first population in the Southern Hemisphere. This potentially increases the risk to New Zealand given our seasonal alignment.
Control
Eradication of BMSB is extremely difficult and early detection is crucial for success. While traps are available for monitoring, these are not suitable for use in a surveillance network for early detection, like we have for fruit fly. Therefore, public reporting of suspect finds is critical.
Insecticides may be an important tool in an eradication attempt but are unsuitable for long term management given the residue issues that would be associated with repeat applications at high dosage rates. The most promising tool for BMSB management in New Zealand – if BMSB were to establish – is a parasitoid known as the Samurai Wasp, which is capable of parasitizing over 80% of BMSB egg populations. In August 2018, the EPA (Environmental Protection Agency) granted approval for the release of Samurai Wasp if BMSB establishment occurs.
Right: A Samurai Wasp (the size of a poppy seed) making its way out of a BMSB egg.

SCIENCE AND SUSTAINABILITY | 77
GIA (Government Industry Agreement)
The importance of being prepared for future biosecurity incursions is one of the biggest lessons the kiwifruit industry learnt from the outbreak of Psa, the vine killing disease, in 2010. Although the industry responded well to that crisis, there is always the risk of another unwanted exotic pest or disease making its way to New Zealand’s shores and affecting kiwifruit once again. The industry has a much better understanding of how to manage biosecurity risks, along with more tools to identify emerging risks. There is also a more engaged biosecurity relationship with government and increased capability to respond thanks to the formalising of the Government Industry Agreement for Biosecurity Readiness and Response (GIA) Deed (signed in 2014), and Operational Agreements (OA) for specific threats.
GIA commits the kiwifruit industry to work with government and other primary sector industries to improve readiness for future biosecurity events, and jointly respond to future outbreaks. What makes the GIA concept so important to the kiwifruit industry is that it enables industry and government to achieve better biosecurity outcomes through the work undertaken jointly. Because decision making, costs and responsibilities are shared, all partners can have the confidence that the best decisions are being made about managing biosecurity – there isn’t just one group making the big calls.
GIA was put into action in 2019 when KVH and other horticultural industry groups worked in partnership with the Ministry for Primary Industries (MPI) to respond to detections of fruit flies in three Auckland suburbs. The responses set up in Otara, Northcote and Devonport ran well under the GIA partnership, following the pre-agreed operational plans established and tested in previous responses. By being involved in decision-making processes, KVH was able to ensure the interests of New Zealand’s kiwifruit growers were represented fully.
Between mid-February and mid-November 2019, the kiwifruit industry contributed 43 people and 540 staff days to the response, assisting in operational activities that included surveillance, fruit collection, baiting, and public awareness.
| SCIENCE AND SUSTAINABILITY 78
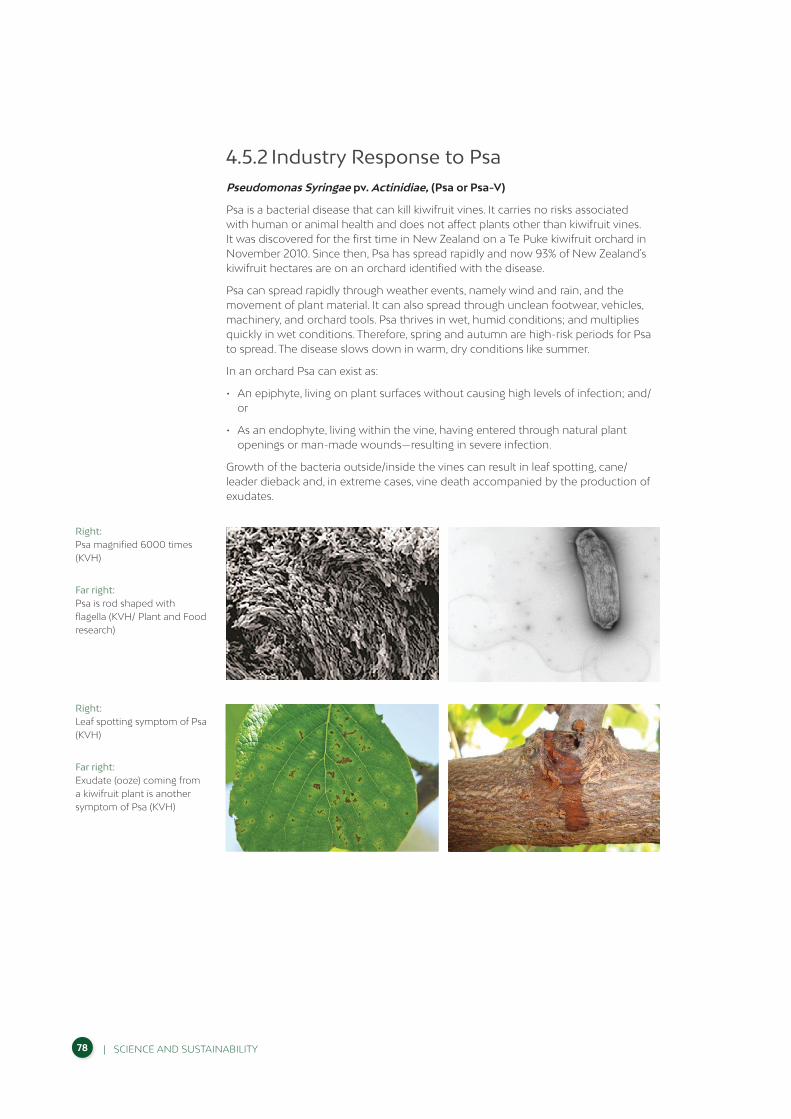
Pseudomonas Syringae pv. Actinidiae, (Psa or Psa-V)
Psa is a bacterial disease that can kill kiwifruit vines. It carries no risks associated with human or animal health and does not affect plants other than kiwifruit vines. It was discovered for the first time in New Zealand on a Te Puke kiwifruit orchard in November 2010. Since then, Psa has spread rapidly and now 93% of New Zealand’s kiwifruit hectares are on an orchard identified with the disease.
Psa can spread rapidly through weather events, namely wind and rain, and the movement of plant material. It can also spread through unclean footwear, vehicles, machinery, and orchard tools. Psa thrives in wet, humid conditions; and multiplies quickly in wet conditions. Therefore, spring and autumn are high-risk periods for Psa to spread. The disease slows down in warm, dry conditions like summer.
In an orchard Psa can exist as:
• An epiphyte, living on plant surfaces without causing high levels of infection; and/or
• As an endophyte, living within the vine, having entered through natural plant openings or man-made wounds—resulting in severe infection.
Growth of the bacteria outside/inside the vines can result in leaf spotting, cane/leader dieback and, in extreme cases, vine death accompanied by the production of exudates.
Right: Psa magnified 6000 times (KVH)
Far right: Psa is rod shaped with flagella (KVH/ Plant and Food research)
Right: Leaf spotting symptom of Psa (KVH)
Far right: Exudate (ooze) coming from a kiwifruit plant is another symptom of Psa (KVH)
4.5.2 Industry Response to Psa
SCIENCE AND SUSTAINABILITY | 79
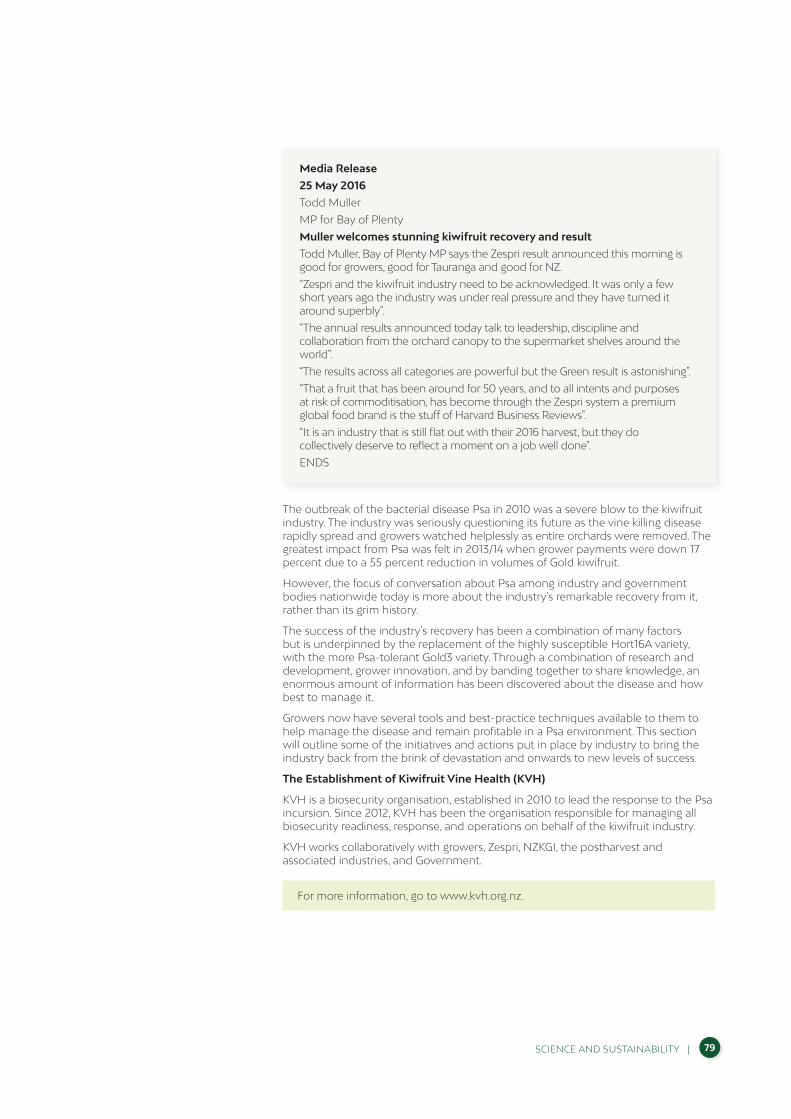
The outbreak of the bacterial disease Psa in 2010 was a severe blow to the kiwifruit industry. The industry was seriously questioning its future as the vine killing disease rapidly spread and growers watched helplessly as entire orchards were removed. The greatest impact from Psa was felt in 2013/14 when grower payments were down 17 percent due to a 55 percent reduction in volumes of Gold kiwifruit.
However, the focus of conversation about Psa among industry and government bodies nationwide today is more about the industry’s remarkable recovery from it, rather than its grim history.
The success of the industry’s recovery has been a combination of many factors but is underpinned by the replacement of the highly susceptible Hort16A variety, with the more Psa-tolerant Gold3 variety. Through a combination of research and development, grower innovation, and by banding together to share knowledge, an enormous amount of information has been discovered about the disease and how best to manage it.
Growers now have several tools and best-practice techniques available to them to help manage the disease and remain profitable in a Psa environment. This section will outline some of the initiatives and actions put in place by industry to bring the industry back from the brink of devastation and onwards to new levels of success.
The Establishment of Kiwifruit Vine Health (KVH)
KVH is a biosecurity organisation, established in 2010 to lead the response to the Psa incursion. Since 2012, KVH has been the organisation responsible for managing all biosecurity readiness, response, and operations on behalf of the kiwifruit industry.
KVH works collaboratively with growers, Zespri, NZKGI, the postharvest and associated industries, and Government.
Media Release
25 May 2016
Todd Muller
MP for Bay of Plenty
Muller welcomes stunning kiwifruit recovery and result
Todd Muller, Bay of Plenty MP says the Zespri result announced this morning is good for growers, good for Tauranga and good for NZ.
“Zespri and the kiwifruit industry need to be acknowledged. It was only a few short years ago the industry was under real pressure and they have turned it around superbly”.
“The annual results announced today talk to leadership, discipline and collaboration from the orchard canopy to the supermarket shelves around the world”.
“The results across all categories are powerful but the Green result is astonishing”.
“That a fruit that has been around for 50 years, and to all intents and purposes at risk of commoditisation, has become through the Zespri system a premium global food brand is the stuff of Harvard Business Reviews”.
“It is an industry that is still flat out with their 2016 harvest, but they do collectively deserve to reflect a moment on a job well done”.
ENDS
For more information, go to www.kvh.org.nz.

| SCIENCE AND SUSTAINABILITY 80
Innovation - the Development of Psa Tolerant Cultivars
Plant & Food Research is the sole research provider to the New Zealand Kiwifruit Research Consortium, jointly funded by the Ministry of Business, Innovation and Employment (MBIE) and Zespri. Together they are developing new cultivars of superior quality that command a market premium, with a focus on taste, novelty and convenience. Additionally, new cultivars are bred with tolerance to diseases, including Psa.
For more information on Plant and Food’s contribution go to: https://www.plantandfood.co.nz/growingfutures/case-studies/breeding-for-psa-resistance/
Research and Development Programme
Investment in science to understand the nature of significant biosecurity threats, and developing tools for their management should they arrive, is a big priority for the kiwifruit industry. KVH and Zespri have already invested over $16 million in Psa research and innovation to understand how we can manage the disease, and $1 million is invested each year in research for other biosecurity threats.
KVH and Zespri Innovation run a global research and development (R&D) programme into Psa. The programme was established in early 2011 and has enlisted the best scientific minds globally to provide solutions for Psa. The Innovation team partners with around 20 global researchers to provide the best available expertise to the New Zealand kiwifruit industry. The programme includes product testing to identify, rigorously test and get permission from MPI to use suitable products to help manage and control the spread of Psa. To date, more than 300 products have been tested for efficacy against Psa.
To read more about the R&D programme go to: https://www.kvh.org.nz/Psa_RD
National Psa Pest Management Plan (NPMP)
The NPMP was established in May 2013 to prevent the spread of Psa-V and minimise its impacts on kiwifruit production. Key elements of the plan involved movement controls, monitoring, reporting, incursion response and managing the disease, along with a continued focus on awareness, education and research. KVH review the Operational Plan for the NPMP on an annual basis and make changes as necessary to ensure the NPMP objectives continue to be met.
As time has moved on the situation has changed. The focus of the plan on preventing spread has changed, with only the South Island and Far North still Psa-V free. There is now more emphasis on new Psa-V biovars (strains) that have and will continue to arise, including strains resistant to current chemical control tools. New kiwifruit varieties need to be monitored for tolerance to Psa in orchard environments.
KVH have established protocols for controlling the movement of risk items, which differ depending on the nature and level of risk these items pose.
For more information go to: https://www.kvh.org.nz/KVH_Protocols

SCIENCE AND SUSTAINABILITY | 81
Kiwifruit Plant Certification Scheme (KPCS)
Long term growth and success of the kiwifruit industry requires biosecurity risks (including Psa) to be managed right across the supply chain – this includes kiwifruit nurseries. KVH introduced the KPCS in October 2016 to reduce the risk of pests and diseases being spread through the movement of nursery plants. By joining the KPCS, kiwifruit nurseries demonstrate they are managing biosecurity risks, have been independently audited, visually inspected for target organisms and returned a non-detected result for a very comprehensive testing regime for Psa.
Only KPCS-certified nursery plants may be bought, sold or moved between properties. However, growers may still produce plants on their own property for use on that property; and produce up to 1000 plants for movement between their own properties within the same Psa region.
For more information go to: https://www.kvh.org.nz/guidelines
For more information about the KPCS go to: https://www.kvh.org.nz/indnurseries
On-orchard Biosecurity
Border biosecurity starts at the orchard gate. Growers are now aware that any equipment, vehicle or person entering their orchard could potentially introduce and/or spread Psa, not to mention other pests or diseases. Growers should have robust hygiene practices in place to protect their orchard; and anyone entering orchards should be aware of these measures.
To support this, KVH produced Kiwifruit Growers Biosecurity Guidelines in June 2019. The 5-step on-orchard biosecurity guidelines are a set of measures designed to protect a property from the entry and spread of pests and diseases and have been developed to provide guidance, help identify risks, and how to address them.
By using the guidelines to develop a biosecurity plan, growers are able to identify and prioritise biosecurity practices that are relevant to their orchard and property and are able to treat biosecurity planning in a similar manner to quality assurance or risk planning such as Health & Safety or emergency preparedness.
The five steps are:
• Understand your risks (what pests and diseases could arrive from offshore, who and what enters the orchard and might being them in)
• Agree what must happen on site (share knowledge and agree requirements)
• Source and trace clean plant material and keep tracking records updated
• Check and clean (sanitise high-risk items, ensure everything that comes on to the orchard is free of soil and plant material)
• Report the unusual to MPI or KVH immediately
| SCIENCE AND SUSTAINABILITY 82
4.5.3 Positive Market Contribution
Our industry’s foundations lie in the people who choose to be a part of our broader kiwifruit family. We know that without their collective efforts, whether that be on orchard, in the supply chain, or within one of our market-facing roles here at Zespri, the kiwifruit industry would not be able to achieve the success it does today. This sense of community defines our industry and it’s important that we protect and enhance it. At Zespri, this means making sure that we continue to support organisations and projects that help strengthen our people and our communities. As our business and footprint across the world grows, so too must the contribution we make. The pillars in our community investment framework are:
• Happy and Healthy Communities,
• a Sustainable Environment,
• and a Skilled Workforce.