chapter four integrated food crop pest management in...
TRANSCRIPT

90
Chapter Four
INTEGRATED FOOD CROP PEST MANAGEMENT IN
INDONESIA: A COMPUTABLE GENERAL
EQUILIBRIUM MODEL
Abstract The excessive use of pesticides in Indonesia during the 1970s and 1980s caused serious environmental problems such as acute and chronic human pesticide poisoning, animal poisoning and contaminated agricultural products, destruction of both beneficial natural parasites and pest predators, and pesticide resistance in pests. To overcome these environmental problems, since 1989 the Indonesian government has actively adopted a strategy of integrated pest management (IPM).1 The first goal of this essay is to build a Computable General Equilibrium model that includes various links from pesticide use in agricultural sectors to human health problems, and the links from human health problems to societal health costs and the effectiveness of production activities. The second goal of this essay is to analyze the impact of the IPM program on Indonesian economic growth and household incomes for different socioeconomic groups.
4.1 Introduction
The chronic food shortage during the first two decades of Indonesian
independence (1945-1965) stimulated the Indonesian government to establish
a comprehensive food intensification program as a national priority.
Achieving and maintaining self-sufficiency in food, increasing farmers’
income, and providing strong support for the rapidly expanding industrial
and service sectors were the main goals of this food intensification program
(Oka, 1995). The food intensification program included large-scale adoption
1 This essay limits its analysis to the implementation of the IPM program in the food crop sector. The reason for this limitation is that, first, until now the implementation of the IPM program in Indonesia has been limited to food crops. Second, the government has not yet planned to implement the IPM program in the non-food crop sector.

91
of high-yielding modern seed varieties, development of irrigation systems,
expansion of food crop producing areas, increased use of chemical fertilizers
and pesticides, expansion of agricultural extension services, establishment of
farmer cooperatives and input subsidies, and stabilization of national food
crop prices (Oka, 1991).
During the 1970s and 1980s, this food intensification program caused
food crop production to grow at an annual rate of approximately 3.74 percent2
(CBS, 1973-1991). A major miracle occurred in rice production. Pushing the
average annual growth rate of rice production to approximately 4.67 percent,
the rice intensification program transformed Indonesia from the world’s
largest importer of rice, importing approximately two million tons per year by
the end of the 1970s, to self-sufficiency in 1983 and thereafter (Oka, 1991 and
1995).
Despite the remarkable success of the food intensification program, the
excessive use of pesticides caused serious environmental problems3 such as
acute and chronic human pesticide poisoning, animal poisoning and
contaminated agricultural products, destruction of beneficial natural parasites
and pest predators, and pesticide resistance in pests (Achmadi, 1992; Oka,
1995; and Pimentel et al., 1992). To overcome these environmental problems
2 The average annual population growth was approximately 2.3 percent in the 1970s and 1980s. 3 In 1988, Achmadi found 1267 cases of acute pesticide poisoning in 182 general hospitals throughout the islands of Java and Bali. He also observed that approximately 20 to 50 percent of the farmers who utilized pesticides contracted chronic pesticide-related illnesses. These illnesses included headaches, weakness, insomnia, and difficulties in concentrating (Achmadi, 1992). In the case of pesticide resistance in pests, brown planthoppers and green leafhoppers became resistant to pesticides and damaged more than 450,000 hectares of rice fields in 1976/1977. The estimated yield loss was 364,500 tons of milled rice, which could have fed three million people for an entire year. In 1980 and 1986, the same pest problem broke out again, causing damage to at least 12,000 and 75,000 hectares of rice fields, respectively (Oka, 1995).

92
caused by the overuse of pesticide, the Indonesian government adopted a
strategy of integrated pest management (IPM). The program altered the
predominant government policy of pest control from a unilateral method,
depending solely on pesticide, to a combination of various control tactics to
manage pests, including synchronized planting, crop rotation, natural
predator, and pesticides. During the first two years of the IPM program (1989-
1991), the government trained approximately 100,000 food crop farmers,
mostly rice farmers, to implement the IPM. With the IPM, these farmers have
been able to reduce the use of pesticides by approximately 56 percent, and
increase yields by approximately 10 percent4 (Oka, 1995). With this positive
result, the Indonesian government is eager to train more food crop farmers to
implement the IPM.
Economic literature which analyzes the impact of the IPM program on
household incomes and national economic performance is very limited. The
Indonesian IPM National Program Monitoring and Evaluation Team in 1993
argued that IPM farmers would increase their incomes by approximately 50
percent. The team also estimated that, if the IPM were to become a common
practice throughout Indonesia, the reduction in pesticide use would result in
total savings for farmers of approximately 212 billion rupiahs. This study by
the IPM National Program Monitoring and Evaluation Team, however, only
observed the partial impact of the IPM program on farmer incomes, i.e. the
team did not take into account the multiplier impact of an IPM program on
incomes of both farmers and other household groups. The team also did not
mention the impact of the IPM program on national economic growth.
4 The increasing yields are caused by the elimination of serious or large-scale pest outbreaks.

93
This essay utilizes a Computable General Equilibrium (CGE) model to
analyze the total impact, including the multiplier impact, of the Indonesian
IPM program on national economic growth and household incomes for
various socioeconomic groups. A CGE model is a system of equations that
represent all agents' behaviors and market clearing conditions in a national
economy.
The main goal of this essay is to build a CGE model that is appropriate to
analyze the impact of an IPM program on a national economy.
Implementation of an IPM program has three immediate impacts. A
government has to reallocate its budget to finance the implementation. The
implementation of an IPM program causes a reduction in the use of pesticides,
and an increase in agricultural output. The CGE should be able to model how
these immediate changes impact production and consumption behaviors in
the economy, and in the end, affect national economic growth and household
incomes. To capture these impacts, the CGE should include various
relationships among pesticide use in agriculture, human health problems,
societal health cost, and production activities.
4.2 Computable General Equilibrium Model
This section explains some important features of the CGE utilized in
this essay. To become familiar with other features of this CGE, one should
review the Indonesian CGEs developed by Lewis (1991) and Thorbecke
(1992).5 This essay combines the Indonesian CGEs just mentioned to create a
new CGE model. The model describes various relationships to represent the
5 See also Appendix I.

94
impact of an IPM program on the economy. Finally, several dynamic
equations are added to the model to transform the new CGE into a multi-
period CGE.
Facts and relationships modeled in the CGE to represent the impact of
an IPM program on the economy are as follows:
• Government needs to spend a certain amount of money to implement the
IPM program. In this essay, government is assumed to take this IPM
budget from government savings, resulting in a smaller government
capital investment.
• Most of the government IPM budget is allocated to the education or public
service sectors, since the main activity of the IPM program is to educate
food crop farmers in IPM.
• The first direct impact of the IPM program is a reduction in the use of
pesticides by food crop farmers.
• The second direct impact of the IPM program is a more efficient food crop
production sector, i.e. with a lesser amount of pesticides and the same
amount of other inputs, IPM farmers are able to increase their output.6
This increased output is due to the fact that the IPM program can better
control pest problems than a program that solely depends on pesticides.
• Since the use of pesticides causes pesticide poisoning cases among farmers,
the reduction in the amount of pesticide use in the food crop sector
decreases the number of these pesticide poisoning cases.7
6 Dr. Oka, former chairman of the Indonesian Working Group on IPM (1991-1994), argues that the IPM program does not require more factor inputs than a program that solely depends on pesticides. 7 Non-farmers also may be poisoned by pesticides used in agriculture. Available data, however, concern the number of farmers poisoned by these pesticides. This essay thus limits its analysis to pesticide poisoning cases which affect farmers.

95
• This reduction in the number of pesticide-related illnesses lowers food
crop farmer households’ spending on necessary treatment to recover from
pesticide-related illnesses. These lower health costs enable households to
spend money on other goods and services, mostly food.
• The occurrence of pesticide-related illnesses negatively affects the
productivity of agricultural labor input. This negative effect might reduce
the productivity of other agricultural factor inputs, i.e. land and capital.
The reduction in the number of pesticide-related illnesses among food crop
farmers hence improves the productivity of all factor inputs in the food
crop production sector.
The detailed modeling of the impact of the IPM program now follows.
Figure 4.1 shows a diagram of sectoral production activities. The CGE in this
essay has 20 different sectoral production activities. The important features of
these sectoral production activities are the value-added function, sectoral
production function, and the input-output coefficient of the quantity of
pesticide used in the food crop sector.
Let us first observe the value added function. Value added is a
function of human pesticide-related illnesses and factor inputs. The factor
inputs are expressed in the Constant Elasticity of Substitution (CES) function.

96
OutputX
IntermediateInput
ValueAdded
X1 X2AgLab
CES
CESFixed Prop.
XnManCler
ProfLab
Capi-tal Land
Note: CES is the Constant Elasticity of Substitution production function Fixed Prop. is the Fixed Proportion (Leontief production function)
Figure 4.1 Structure of the Sectoral Production Function
VA HE FACDEMi i i i fv
i ff
iv i
v
= ⋅ ⋅ ⋅�
��
�
��
−
−
�α β ρρ
, ,
1
(4.1)
where:
i is the index for production sectors
VAi is the value-added input for sector i
HEi is the impact of human pesticide-related illnesses on the
value-added production activity
FACDEMi,f is the demand for factor input f in sector i.

97
The factors represented by f are agricultural workers, manual-clerical
personnel, professional laborers, land, and capital. Land and capital are fixed.
The market for professional workers is assumed to be in a full-employment
condition. Both the agricultural and manual-clerical labor markets experience
unemployment.
In this essay the impact of human pesticide-related illnesses on
production activity, i.e. HEi, is simply a function of restricted activity days
caused by pesticide-related illnesses. Furthermore, since data on the number
of restricted activity days are limited to farmers only, the HEi function is:
HERADDAi
i
i
= −�
��
�
��1 ∀ i ∈ crop sectors (4.2)
and
HEi = 1 ∀ i ∉ crop sectors (4.3)
where:
RADi is the number of restricted activity days caused by pesticide-
related illnesses
DAi is the number of man-days that should be available if no
pesticide-related illness occur.
The second important point about sectoral production activities is the
production of sectoral output. The form of the sectoral production function is:
( )X IN VAi ix
ix
i ix
iix
ix
ix= ⋅ ⋅ + − ⋅− − −
α β βρ ρ ρ( )11
(4.4)
where:
Xi is gross domestic sectoral outputs
98
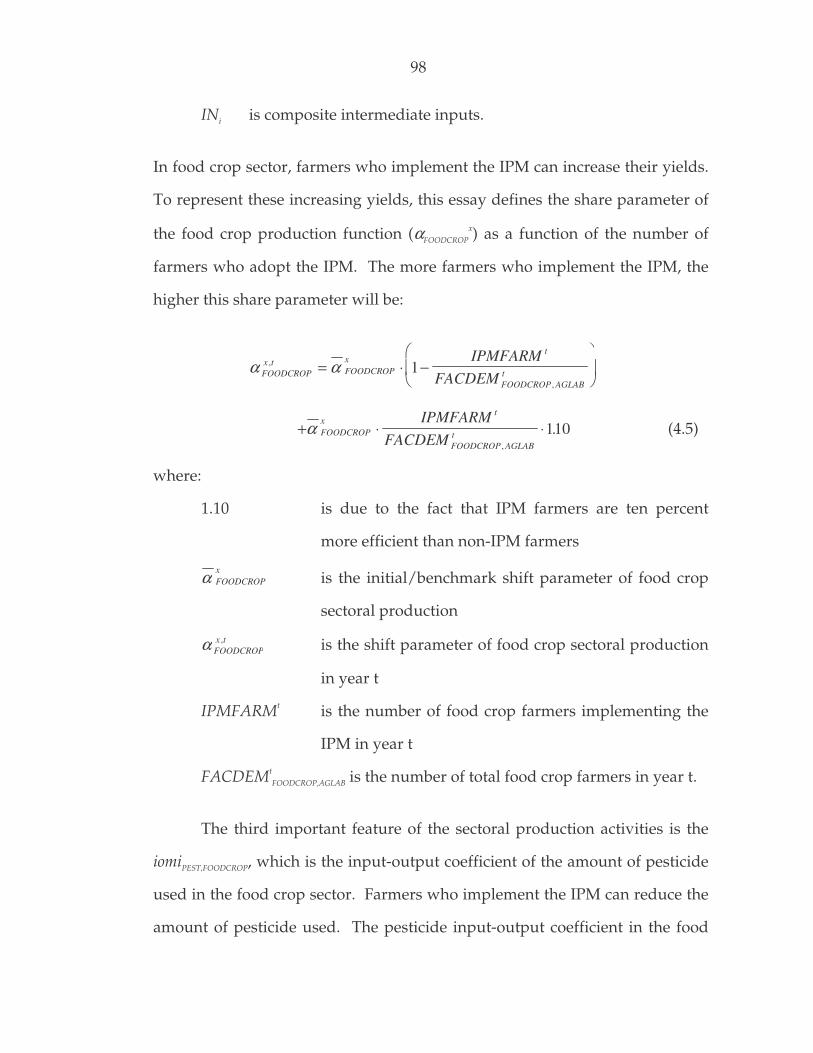
INi is composite intermediate inputs.
In food crop sector, farmers who implement the IPM can increase their yields.
To represent these increasing yields, this essay defines the share parameter of
the food crop production function (αFOODCROPx) as a function of the number of
farmers who adopt the IPM. The more farmers who implement the IPM, the
higher this share parameter will be:
α αFOODCROPx t
FOODCROPx
t
FOODCROP AGLABt
IPMFARMFACDEM
,
,
= ⋅ −�
��
�
��1
+ ⋅ ⋅α FOODCROPx
t
FOODCROP AGLABt
IPMFARMFACDEM ,
.110 (4.5)
where:
1.10 is due to the fact that IPM farmers are ten percent
more efficient than non-IPM farmers
α FOODCROPx
is the initial/benchmark shift parameter of food crop
sectoral production
α FOODCROPx t, is the shift parameter of food crop sectoral production
in year t
IPMFARMt is the number of food crop farmers implementing the
IPM in year t
FACDEMtFOODCROP,AGLAB is the number of total food crop farmers in year t.
The third important feature of the sectoral production activities is the
iomiPEST,FOODCROP, which is the input-output coefficient of the amount of pesticide
used in the food crop sector. Farmers who implement the IPM can reduce the
amount of pesticide used. The pesticide input-output coefficient in the food

99
crop sector is a function of the number of IPM farmers. The more farmers
who adopt the IPM, the smaller this pesticide coefficient will be:
iomi iomiIPMFARM
FACDEMPEST FOODCROPt
PEST FOODCROP
t
FOODCROP AGLABt, ,
,
= ⋅ −�
��
�
��1
+ ⋅ ⋅iomiIPMFARM
FACDEMPEST FOODCROP
t
FOODCROP AGLABt,
,
.0 44 (4.6)
where:
0.44 is due to the fact that IPM farmers are able to reduce
the use of pesticides by 56 percent
iomi PEST FOODCROP, is the initial/benchmark input-output coefficient of
pesticide use in the food crop sector
iomiPEST FOODCROPt
, is the input-output coefficient of pesticide use in the
food crop sector in year t.
This essay considers ten different types of household groups. Each
household group maximizes its utility as a Cobb-Douglas function of all goods
and services, except for the necessary health treatments related to pesticide-
related illnesses, subject to its budget constraint:
( )U HCDh h i h
chs
i aph
i h
= ⋅≠∏α ,
,
; chsi hi aph
,≠� = 1 (4.7)
subject to:
PQ HCD YH HTAX HSAV CDHE HHTRi i hi aph
h h h h h⋅ ≤ − − − −≠� , (4.8)
where:
h is the index for household groups

100
aph is the index for health services consumed by households which
experience pesticide-related illnesses
YHh is the income of household h
HCDi,h is household consumption
PQi is the price of commodity i
HTAXh is income taxes
HSAVh is household savings
HHTRh is net household transfers
CDHEh is necessary health costs to recover from pesticide-related
illnesses.
Note that this essay limits its analysis to the case of pesticide-related
illnesses among farmers. The health costs associated with pesticide-related
illnesses (CDHEh) in the relationship (4.8) hence only appear in agricultural
household groups’ budget constraint, i.e. for non-agricultural households,
CDHEh always equals zero. From the relationship (4.8), one can see that a
reduction in health costs associated with pesticide-related illnesses creates
“extra income” for agricultural households to spend on goods and services. In
developing countries, agricultural households mostly spend this extra income
on food.
The amount of health spending by households depends on the number
of pesticide-related illnesses which occur. The quantity of pesticide-related
illnesses is a function of the quantity of pesticide used in agricultural sectors:
PESHLT apesht iomi IN R AGLABag ph ag ph PEST ag ag, , , ( )= ⋅ ⋅ ⋅ (4.9)
where:

101
ag is the index for agricultural sectors
ph is the index for the pesticide-related illnesses
PESHLTag,ph is the number of pesticide-related illnesses
apeshtag,ph is the pesticide-health coefficient
iomiPEST,ag⋅INag is the amount of pesticide used in agricultural sector ag
R(AGLAB) is the ratio between agricultural labor in any simulation
scenario and in the benchmark situation.
The pesticide-related illnesses are chronic and acute pesticide poisoning.
Farmers who contract chronic or acute pesticide poisoning usually cannot
work for at least one day.
In this CGE, the capital accumulation equation is the important
dynamic equation related to the implementation of the IPM program. Capital
accumulates as new capital is invested; the amount of capital next year is a
function of the existing capital plus new capital, minus depreciated capital.
( )FACDEM FACDEM depr DKi CAPITAL
ti CAPITALt
i it
, , .+ = − +1 1 (4.10)
where:
depri is the depreciation rate
DKit is the new capital invested in year t.
Government and private savings fund new capital investments. Government
savings also must provide the budget for IPM program implementation. In
the absence of this program, the government would use the funds allocated
for the IPM budget for new capital investment. Implementation of the IPM
program, hence, reduces the amount of new capital invested, and, in the end,
decreases the rate of capital accumulation.

102
Other important dynamic equations, although not related to the
implementation of the IPM program, are the equations which determine the
wages for manual-clerical and agricultural workers. For manual-clerical
laborers, wages increase as a function of the growth in both total value added
and employment.8 Growth in total value added this year increases the wage
next year. In contrast, growth in total employment this year decreases the
wage next year.
WA WA
WAGDVA GDVA
GDVAMANCLERt
MANCLERt
MANCLERt
mn mnt t
t
+ −
−
−= + ⋅
−1
0 1
1
1α α
− ⋅− −
−α 2
1
1mn
t t
t
TOTLAB TOTLABTOTLAB
(4.11)
where:
GDVAt is the gross domestic value added in year t
TOTLABt is the total employment in year t.
For agricultural workers, wage growth is a function of growth in both
agricultural value added and agricultural employment:
WA WA
WAAGVA AGVA
AGVAAGLABt
AGLABt
AGLABt
ag agt t
t
+ −
−
−= + ⋅
−1
0 1
1
1α α
− ⋅− −
−α 2
1
1ag
t t
t
AGLAB AGLABAGLAB
(4.12)
where:
AGVAt is the total value added in the agricultural sector in year t
8 Indonesia exhibited wage relationships (4.11) and (4.12) during the 1970s and 1980s. See Thorbecke (1992). In Thorbecke’s work, wages are a function of the price deflator, value added, and total employment. This essay omits the price deflator variable from the wage function since in any year of the simulation wages (also other prices) are in real terms. See also footnote 17.

103
AGLABt is the number of agricultural workers in year t.
4.3 Integrated Food Crop Pest Management in Indonesia
This section reviews the history of the implementation of the integrated
food crop pest management (IPM) program in Indonesia. The description in
this section serves as the base to develop the simulation scenarios in later
sections.
The Plant Protection Directorate under the Ministry of Agriculture
introduced the IPM program at the end of the 1970s. Until the mid-1980s, the
implementation of this program was very limited. No systematic effort to
educate extension workers and farmers existed. Government subsidies for
pesticides continued to reach 80 percent of total prices for pesticides. Farmers
really had no incentive to implement the IPM.
The massive outbreak of brown planthoppers (caused by pesticide
resistance) and human pesticide poisoning problems in the mid-1980s
motivated high-ranking government officers to consult Indonesian
agricultural scientists. The scientists convinced the government that the
solution to the two problems associated with the overuse of pesticide was to
implement actively the IPM program. Indonesian agricultural scientists
believed that, with implementing the IPM program, farmers would be able to
reduce the use of pesticides without decreasing yields. The government then
issued Presidential Decree No. 3 of 1986. This presidential decree established
the IPM program as a national policy that all government agencies would
support. The decree had the following objectives (Oka, 1995):

104
• develop manpower, both farmers and field personnel, at the grassroots
level to implement the IPM
• increase efficiency of input use, in particular pesticides
• improve the quality of the environment and its influence on human health.
Along with this decree, the government decreased subsidies for
pesticides from 75-80 percent of total prices for pesticides in 1986 to 40-45
percent in 1987. Finally in January 1989 these subsidies were totally
abolished.9 The government also banned 57 broad-spectrum insecticides, and
only allowed the use of a few relatively narrow-spectrum insecticides.
To actively implement the IPM, in 1989 the National Development
Planning Agency (BAPPENAS) established an Advisory Board which
consisted of high-ranking officers from BAPPENAS, the Ministry of
Agriculture, and the Ministry of Home Affairs. The Board was the supreme
policy-making body, and responsible for the success of the IPM program.
Under the Board, a Steering Committee was formed to direct the project
activities, and to ascertain the need for policy improvement. The Committee
consisted of IPM experts from various government agencies, universities, and
international institutions. Certain members of the Committee formed the
Working Group which conducted the day-to-day tasks of the Committee.
The central activity of this national IPM program was to educate
farmers in IPM using the “learning by doing” method. The Working Group
first trained extension workers and field pest observers to teach farmers. By
the end of 1991, 2,000 extension workers and 1,000 field pest observers had
been able to train approximately 100,000 farmers. After 1991, approximately
9 With the abolishment of pesticide subsidies, the Indonesian government saved approximately 200-300 billion rupiahs (100-150 million dollars) per year.

105
200,000 farmers were trained each year.10 Approximately ten percent of these
200,000 farmers became one-on-one trainers. Each of these farmer trainers
was required to train one farmer twice per year, and repeat this training with a
new farmer in the following year. The cost of all IPM training activities is
approximately 11.25 billion rupiahs (5.36 million dollars) each year.11 The
central government provides approximately 80 percent of this total cost; the
various regional governments provide the rest.12
4.4 Data Sources and Initial Situation
This section discusses data sources utilized in this essay. The main
sources of data are the 1990 Indonesian Social Accounting Matrix (SAM) and
Input-Output (I-O) Table which are available from the Indonesian Central
Bureau of Statistics (CBS). This essay modifies the 1990 SAM in two ways.
First, it reduces the classification of factor inputs to five categories:
agricultural labor, manual-clerical labor, professional labor, capital, and land.
Second, by disaggregating certain production sectors (using the I-O Table) and
combining others, the number of production sectors decreases from 22 to 20.
Important to note in the new classification is that three agricultural sectors
exist: Food Crop, Non-food Crop, and Other Agriculture. Pesticide
production also is removed from the Chemical and Basic Metal sector to
become a separate Pesticide sector. In addition, the health activities related to
pesticide poisoning illnesses are separated from the Public Service sector to
become the Pesticide-Health sector.
10 During the beginning years of this IPM training program, the training was mostly for rice farmers. Later, training for other food crop farmers was also provided. 11 For a national program, this IPM budget is relatively small. The budget is approximately 0.08 percent of total government spending on goods and services in 1990.

106
The SAM in this essay uses the same categories for household classes
that the CBS SAM does. The categories are as follows:
• Agricultural Employee : Agricultural workers who do not own land
• Small Farmer : Agricultural land owners with land between 0.0
and 0.5 ha
• Medium Farmer : Agricultural land owners with land between 0.5
and 1.0 ha
• Large Farmer : Agricultural land owners with land larger than
1.0 ha
• Rural Low : Non-agricultural households, consisting of small13
retail store owners, small entrepreneurs, small
personal service providers, and clerical and
manual workers in rural areas
• Rural Non-labor : Non-agricultural households, consisting of non-
labor force and unclassified households in rural
areas
• Rural High : Non-agricultural households, consisting of
managers, technicians, professionals, military
officers, teachers, big14 entrepreneurs, big retail
store owners, big personal service providers, and
skilled clerical workers in rural areas
• Urban Low : Non-agricultural households, consisting of small
retail store owners, small entrepreneurs, small
12 Based on an interview with Dr. Oka. 13 Small refers to a low income level. 14 Big refers to a high income level.

107
personal service providers, and clerical and
manual workers in urban areas
• Urban Non-labor : Non-agricultural households, consisting of non-
labor force and unclassified households in urban
areas
• Urban High : Non-agricultural households, consisting of
managers, technicians, professionals, military
officers, teachers, big entrepreneurs, big retail
store owners, big personal service providers, and
skilled clerical workers in urban areas.
Table 4.1 shows characteristics of each household group in 1990.
Column 1 lists the proportions of the total population of Indonesia that
belonged to certain household groups. From column 1, one can see that 39
percent of the total Indonesian population belonged to Small Farmer
households. Since the total population in Indonesia in 1990 was
approximately 180 million people, Small Farmer households equaled
approximately 70.2 billion people.
Column 2 shows the ratio between the income of each household group
and total household income of all groups. In 1990, total household income
was approximately 161,544.5 billion rupiahs.15 From columns 1 and 2, one can
see that, although Urban High households formed only five percent of the
total population in the country, the total income of Urban High households
contributed 25 percent to total household income. In contrast, Agricultural
Employee and Small Farmer households represented 10 and 39 percent of the
15 Gross of Domestic Product in Indonesia in 1990 was 210,866.5 billion rupiahs.

108
total population, respectively, but only received 4 and 20 percent of total
household income.
Table 4.1 Characteristics of Household Groups in 1990
Population Household
Income Transfer from:
Income Ag. Lab. Man-Cler. Prof. Lab. Land Capital (1) (2) (3) (4) (5) (6) (7)
Ag. Employee 0.10 0.04 0.13 0.01 0.00 0.04 0.02 Small Farmer 0.39 0.20 0.45 0.09 0.03 0.44 0.07 Medium Farmer 0.07 0.05 0.12 0.02 0.01 0.11 0.02 Large Farmer 0.07 0.06 0.17 0.02 0.01 0.13 0.02 Rural Low 0.10 0.05 0.03 0.07 0.02 0.04 0.02 Rural Non-labor 0.01 0.02 0.00 0.01 0.01 0.01 0.02 Rural High 0.04 0.16 0.08 0.21 0.27 0.18 0.04 Urban Low 0.16 0.13 0.01 0.18 0.05 0.02 0.07 Urban Non-labor 0.01 0.04 0.00 0.02 0.01 0.03 0.03 Urban High 0.05 0.25 0.01 0.37 0.59 0.00 0.12 Total 1.00 1.00 1.00 1.00 1.00 1.00 0.43 Source: CBS, 1991.
Columns 3 to 7 show income transfers from factors of production to
households. For example, column 3 shows that 45 percent of payments
received by agricultural laborers in 1990 were transferred to Small Farmer
households, i.e. approximately 45 percent of agricultural workers were small
farmers. Note that only 43 percent of capital revenues in 1990 were
transferred to households. The remaining capital returns were distributed to
companies, the government, and international institutions.
Achmadi’s work provides the estimate of the number of acute and
chronic pesticide poisoning cases. He estimated that in 1988 approximately
3000 cases of acute poisoning were associated with the use of pesticides in
agricultural sectors. This essay assumes that the number of acute pesticide
poisoning cases in 1990 is the same as in 1988. This essay uses a figure of 35

109
percent (based on Achmadi’s estimate, see the third footnote) as the
proportion of farmers who utilized pesticides and contracted chronic
pesticide-related illnesses. CBS (1991) estimated that approximately 40 million
people worked in agricultural sectors in 1990 and approximately 28 million of
them were farmers (and agricultural workers) who utilized pesticides. Thus,
the estimate of chronic pesticide-related illness cases for 1990 is approximately
9.8 million. Achmadi also noticed that, on average, each time a farmer
contracts acute pesticide poisoning, the farmer misses work approximately
five days. Each time a farmer contracts chronic pesticide poisoning, the
farmer, on average, misses work approximately one day.
4.5 Simulation Scenarios
This section explains the five scenarios simulated in this essay. It is
important to note that, in the simulation scenarios, the IPM program is only
implemented in the food crop sector.16 Another point to note is that this essay
considers the simulation period to be 10 years long.17 The five simulation
scenarios are as follows:
1. Base Condition (No IPM Program):18 This scenario assumes that the
Indonesian government does not implement the IPM program at all.19 The
16 See also footnote 1. 17 Throughout these 10 years, the Price Index is set at a constant level. Hence prices in any year of the simulation are in real terms. 18 In all scenarios, the CGE assumes that during the ten-year simulation horizon: • world prices of goods and services remain at a constant level • total annual government loans from international institutions decrease at a rate of three
percent; this same reduction rate applies to total annual private sector loans from international institutions
• government interest and amortization payments of international loans increase at annual rates of five and two percents, respectively
• private sector interest and amortization payments of international loans increase at annual rates of seven and four percent, respectively

110
Indonesian government does not spend 11.25 billion rupiahs each year to
educate farmers. Thus no farmers are aware of IPM practice. Pesticides
continue to be overused.
2. Basic IPM Program: This scenario simulates the IPM program planned by
the Indonesian government. From year one, the government spends 11.25
billion rupiahs annually throughout the ten year time horizon to educate
food crop farmers. Each year, 200,000 farmers graduate from IPM training.
Approximately ten percent of them are required to teach two other farmers
IPM practices each year. It is assumed that farmers who implement the
IPM are able to reduce their use of pesticides by 56 percent, and increase
their yields by 10 percent.
3. IPM Plus Tax Program: It is assumed that the Indonesian government
implements the IPM program by spending 11.25 billion rupiahs each year
to train farmers. To further reduce the use of pesticides, the government
collects a five percent sales tax on pesticides. This five percent sales tax is
implemented at the start of the ten year simulation period, and continues
through year ten.
4. Ambitious IPM Program: In this scenario, the Indonesian government is
assumed to double its training budget for farmers in the IPM program,
compared with the budget in the Basic IPM Program. Starting with the
first year of the simulation, the Indonesian government spends 22.50
billion rupiahs annually to train 400,000 food crop farmers. Government
savings provides the money for this training. By implementing this
• foreign capital investment grows at an annual rate of 15 percent. 19 The benchmark data set in this essay is the Indonesian economy in 1990. The IPM program in that year was in its preliminary stage. It is, hence, reasonable to assume that there was no IPM program yet in 1990.

111
Ambitious IPM strategy, the Indonesian government is assumed to expect
a greater growth in the output of the food crop sector and a larger
reduction in the number of pesticide-related illnesses.
5. Strategic IPM Program: The Indonesian government spends 11.25 billion
rupiahs annually to train 200,000 food crop farmers each year in the IPM in
the first five year simulation period. In the sixth and later years, the
Indonesian government doubles its spending on this IPM training
program, i.e. 400,000 food crop farmers receive IPM training each year
from year six.
4.6 Results and Discussion
This section presents and discusses the results of all simulation
scenarios. The discussion focuses on how each scenario affects national
economic growth and household incomes, and how the results from the
various scenarios differ from those of the Base Condition scenario.
Table 4.2 exhibits the Gross Domestic Product (GDP), household
incomes for different socioeconomic classes, and the total health costs of
pesticide-related illnesses in the benchmark/initial year (t0) and in the last
year of simulation (t10) from the Base Condition scenario.

112
Table 4.2 GDP, Household Incomes, and Health Costs of Pesticide-Related Illnesses Under the Base Condition Scenario
(in billions of rupiahs)
Benchmark Base Condition Percentage Difference t0 t10
GDP 210866.5 329549.6 56.28%
Ag. Employee 6337.09 10814.86 70.66% Small Farmer 31911.62 56179.98 76.05% Medium Farmer 7390.52 13194.53 78.53% Large Farmer 9839.94 17543.98 78.29% Rural Low 8894.81 14951.09 68.09% Rural Non-labor 2948.40 3896.09 32.14% Rural High 25765.43 44844.62 74.05% Urban Low 20698.48 32893.04 58.92% Urban Non-labor 6610.97 10253.11 55.09% Urban High 41147.27 67492.64 64.03%
Pesticide-Health 9.01 15.20 68.71% Note:
t0 = initial year t10 = year ten (the last year of the simulation period) Benchmark = the situation in the initial year of simulation Base Condition = the government does not implement the IPM program
Table 4.3 shows the estimated impact of various IPM programs on GDP,
average annual GDP growth rate, household incomes, and health costs
associated with pesticide-related illnesses. These impacts are presented as
percentage differences between the results from the Base Condition scenario
and those from other scenarios.20 From Table 4.3 one can see that the impact
20 To calculate the percentage differences, first determine the differences between results from other scenarios and the Base Condition, i.e. results from other scenarios minus results from the Base Condition. Then, divide these differences by results from the Base Condition and multiply by 100 percent.

113
Table 4.3 Estimated Impact of Various IPM Program Scenarios on GDP, Average Annual GDP Growth Rate, Household Incomes, and
Health Costs of Pesticide-Related Illnesses
Basic IPM IPM+Tax Ambitious Strategic Program Program IPM IPM t10 t10 t10 t10
GDP 0.056% 0.021% 0.111% 0.145% Annual Growth 0.131% 0.050% 0.260% 0.331%
Ag. Employee 0.046% 0.024% 0.090% 0.094% Small Farmer 0.009% -0.024% 0.017% 0.066% Medium Farmer 0.007% -0.025% 0.014% 0.061% Large Farmer 0.014% -0.016% 0.028% 0.067% Rural Low 0.087% 0.048% 0.172% 0.183% Rural Non-labor 0.046% 0.006% 0.092% 0.130% Rural High 0.075% 0.036% 0.149% 0.171% Urban Low 0.109% 0.069% 0.216% 0.216% Urban Non-labor 0.055% 0.010% 0.110% 0.153% Urban High 0.112% 0.071% 0.223% 0.225%
Pesticide-Health -4.606% -4.814% -9.206% -6.093% Note:
Basic IPM = the government spends 11.25 billion rupiahs to train farmers in IPM
IPM+Tax = in addition to training farmers, the government imposes a tax on pesticides
Ambitious IPM = the government doubles (compared with the Basic IPM Program) its IPM budget from the first year
Strategic IPM = the government doubles (compared with the Basic IPM Program) its IPM budget after the first five years
of the IPM programs on the average annual GDP growth rate are relatively
small. The rates under the programs are 0.050 to 0.331 percent higher than the
average annual GDP growth rate under the Base Condition. The impacts of
the IPM programs on household incomes are relatively small. The largest
impact on household incomes is 0.225 percent. This percentage represents the
increase in income that Urban High households experience in year ten, as
compared to the Urban High household situation under the Base Condition.

114
The IPM programs, however, effectively reduce health costs associated with
pesticide-related illnesses. The range of health cost reduction is 4.606 to 9.206
percent.
Table 4.4 summarizes the impact of various scenarios on annual GDP
growth rate and health costs of pesticide-related illnesses. For the annual GDP
growth rate, more stars mean a higher GDP growth rate. For health costs
associated with pesticide-related illnesses, more stars mean lower health costs
associated with pesticide-related illnesses.
Table 4.4 Summary of Impact of Various Scenarios on Annual GDP Growth Rate and Health Costs of Pesticide-Related Illnesses
Basic IPM IPM+Tax Ambitious Strategic Program Program IPM IPM t10 t10 t10 t10
Annual Growth ** * *** ****
Pesticide-Health * ** **** *** Note that more stars mean a higher GDP growth rate or lower health costs associated with pesticide-related illnesses.
4.6.1 Base Condition
From Table 4.2 one can see that, under the Base Condition scenario, the
GDP is growing throughout the ten year simulation period, from 210,886.5
billion rupiahs in the initial year (t0) to 329,549.6 in year ten (t10), i.e. the GDP
in year ten is 56.28 percent higher than that in the initial year.
Table 4.2 also shows that incomes for all household groups increase
under the Base Condition scenario. Medium Farmer households experience
the highest increase in income, while Rural Non-labor households experience
115
the least increase. All agricultural households increase their incomes more (in
percentage terms) than the urban households do. Since the average income of
agricultural households on a per capita basis is smaller than that of urban
households (see Table 4.1), a greater increase in incomes of agricultural
households could contribute to a more equal income distribution in the
country.
Under the Base Scenario, societal health costs caused by the use of
pesticides grow from 9.01 billion rupiahs in the initial year to 15.20 billion
rupiahs in year ten.
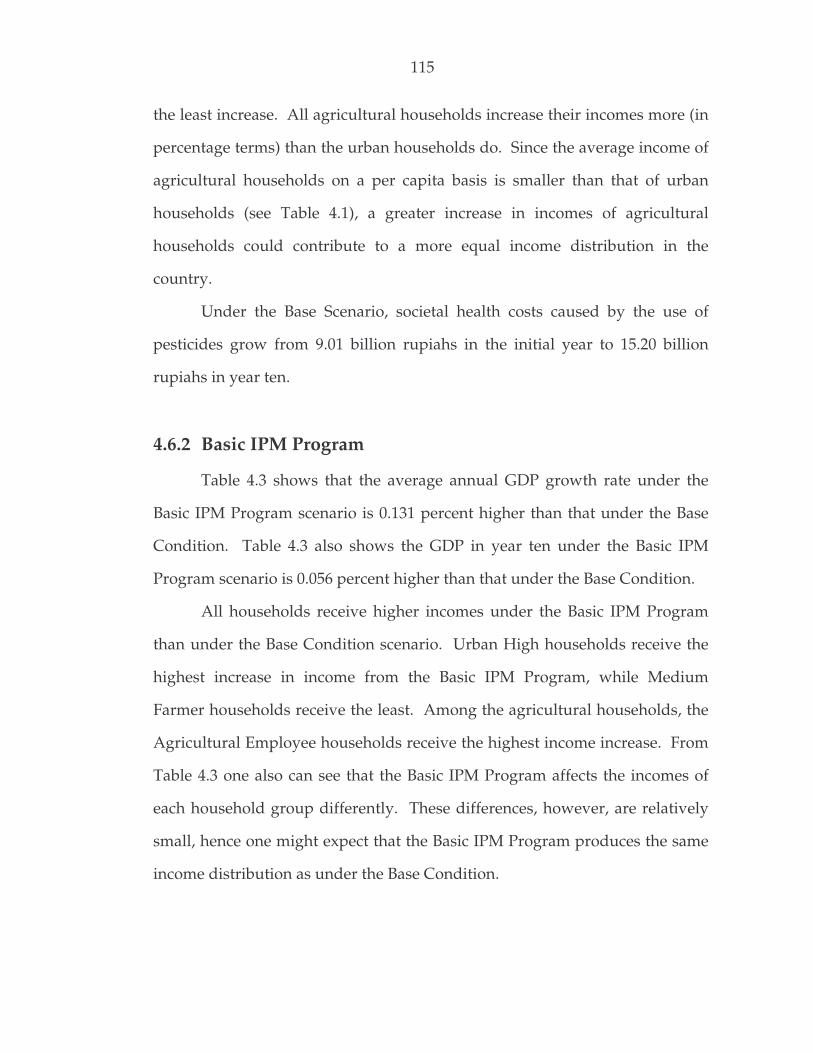
4.6.2 Basic IPM Program
Table 4.3 shows that the average annual GDP growth rate under the
Basic IPM Program scenario is 0.131 percent higher than that under the Base
Condition. Table 4.3 also shows the GDP in year ten under the Basic IPM
Program scenario is 0.056 percent higher than that under the Base Condition.
All households receive higher incomes under the Basic IPM Program
than under the Base Condition scenario. Urban High households receive the
highest increase in income from the Basic IPM Program, while Medium
Farmer households receive the least. Among the agricultural households, the
Agricultural Employee households receive the highest income increase. From
Table 4.3 one also can see that the Basic IPM Program affects the incomes of
each household group differently. These differences, however, are relatively
small, hence one might expect that the Basic IPM Program produces the same
income distribution as under the Base Condition.

116
Societal health costs associated with the use of pesticides is 4.606
percent lower compared to that under the Base Condition, i.e. the Basic IPM
Program successfully reduces the health cost associated with the use of
pesticides.
4.6.3 IPM Plus Tax Program
The average annual GDP growth rate under the IPM Plus Tax Program
is 0.050 percent higher than the average annual GDP growth rate under the
Base Condition. This average annual GDP growth rate under the IPM Plus
Tax Program is certainly lower than that under the Basic IPM Program (see
Table 4.3). One, then, can argue that implementing a tax on pesticides
adversely affects national economic growth.
Another negative impact of implementing a tax on pesticides is that the
total incomes of Small, Medium, and Large Farmer households under the IPM
Plus Tax Program scenario are lower than those under the Base Condition
scenario. Medium Farmer households incur the highest negative impact of
this tax policy. Note that this negative impact does not happen under the
Basic IPM Program.
The goal of combining a tax on pesticides and the IPM Program is to
further reduce the quantity of pesticide-related illnesses than the reduction
obtained under the Basic IPM Program scenario. From Tables 4.3, one can see
that this goal is achieved. The societal health cost associated with pesticide-
related illnesses under the Basic IPM Program is 4.606 percent lower than that
under the Base Condition. The societal health cost associated with pesticide-

117
related illnesses under the IPM Plus Tax Program is 4.814 percent lower than
that under the Base Condition.
4.6.4 Ambitious IPM Program
In the Ambitious IPM Program, the government doubles its annual
budget (compared to the Basic IPM Program) for the IPM Program to achieve
faster economic growth and to decrease health costs associated with pesticide-
related illnesses. Table 4.3 shows the achievement of this ambition. The
average annual growth rate of GDP is 0.260 percent higher than that under the
Base Condition, and is also higher than the annual GDP growth rates under
the Basic IPM Program and the IPM Plus Tax Program.
Under the Ambitious IPM Program, the total incomes of all household
groups in year ten are higher than those under the Base Condition, the Basic
IPM Program, and the IPM Plus Tax Program (see Table 4.3). Similar to the
situation under the Basic IPM Program, urban household groups receive
higher benefits than agricultural household groups under the Ambitious IPM
Program. While the Urban High households receive the most benefits from
the Ambitious IPM Program, the Medium Farmer households receive the
least. One issue is that this higher income received by urban households
might induce a more unequal income distribution in the country.
However, comparing Tables 4.2 and 4.3, one can see the impact of the
Ambitious IPM Program on household incomes is relatively small. The
differences between the increase in incomes that all household groups receive
under the Ambitious IPM Program and the Base Condition are trivial. One
then may expect that the Ambitious IPM Program generates approximately
118
the same income distribution as that under the Base Condition. Since the Base
Condition scenario mostly likely produces a more equal income distribution, a
more equal income distribution also most likely occurs under the Ambitious
IPM Program.
Reviewing the performance of GDP growth and household incomes
under the Ambitious IPM Program, one can conclude that most households
would prefer the Ambitious IPM Program rather than the Base Condition or
the Basic IPM Program (see also Table 4.4).
Societal health costs associated with pesticide-related illnesses in year
ten under this Ambitious IPM Program are 9.206 percent lower than those
under the Base Condition, and are also lower than the health costs associated
with pesticide-related illnesses under the Basic IPM Program and the IPM Plus
Tax Program.
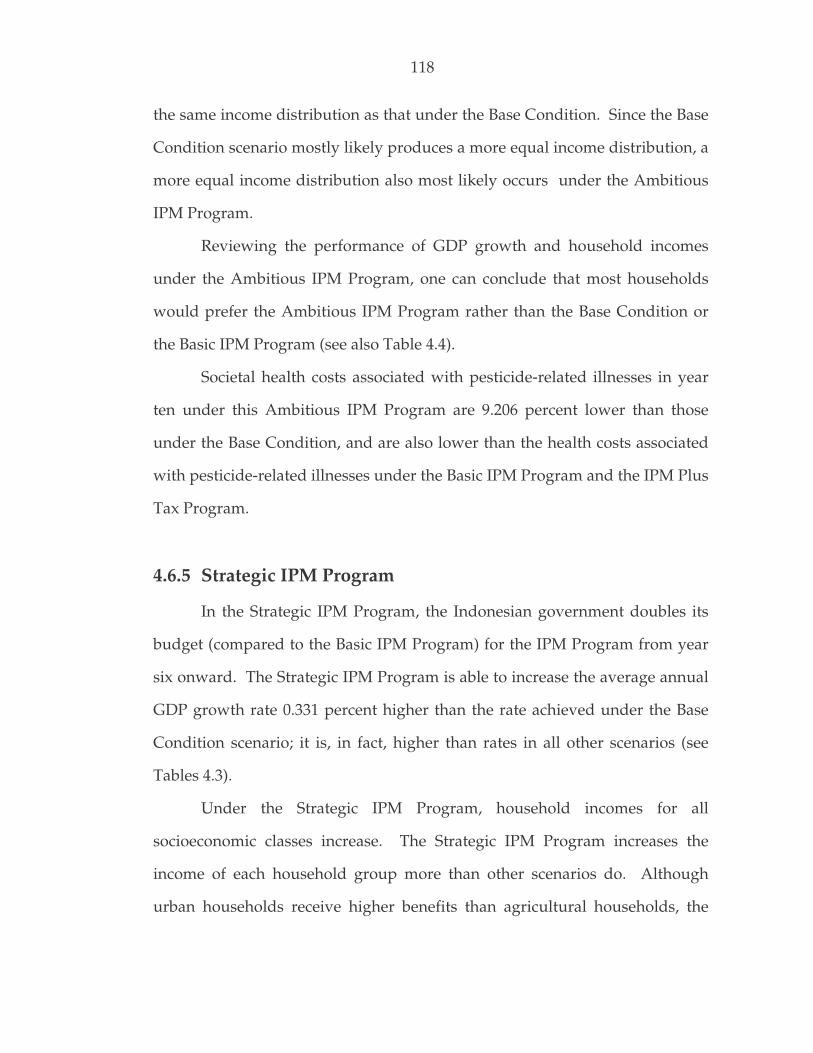
4.6.5 Strategic IPM Program
In the Strategic IPM Program, the Indonesian government doubles its
budget (compared to the Basic IPM Program) for the IPM Program from year
six onward. The Strategic IPM Program is able to increase the average annual
GDP growth rate 0.331 percent higher than the rate achieved under the Base
Condition scenario; it is, in fact, higher than rates in all other scenarios (see
Tables 4.3).
Under the Strategic IPM Program, household incomes for all
socioeconomic classes increase. The Strategic IPM Program increases the
income of each household group more than other scenarios do. Although
urban households receive higher benefits than agricultural households, the
119
distribution of household income group under the Strategic IPM Program is
most likely the same as the distribution of household income under the Base
Condition (for the same reason as in the Ambitious IPM Program).
Under the Strategic IPM Program, societal health costs associated with
pesticide-related illnesses in year ten are 6.093 percent lower than those under
the Base Condition, the Basic IPM Program, and the IPM Plus Tax Program,
but higher than those under the Ambitious IPM Program. Hence, while the
Strategic IPM Program performs better in increasing the growth rates of GDP
and household incomes as compared with other scenarios, the Strategic IPM
Program does not reduce societal health costs lower than the Ambitious IPM
Program (see Table 4.4).
4.7 Conclusion
The CGE developed in this essay analyzes the total impacts of an IPM
program on national economic growth and income distribution. This CGE
includes various relationships including:
• the relationship between the use of pesticides and human pesticide
poisoning problems (pesticide-related illnesses)
• the relationship between human health problems and both societal health
costs and human productivity in production activities
• the relationship between the implementation of an IPM program and a
more efficient food crop production sector
• the relationship between the government budget to support an IPM
program and future investment.
120
This essay then implements the CGE to analyze the IPM program in
Indonesia. To conduct the analysis, this essay constructs four different
scenarios -- Basic IPM, IPM Plus Tax, Ambitious IPM, and Strategic IPM
Programs -- and a scenario in which no IPM program is implemented, the
Base Condition.
Before discussion of the results, it is important to note that these results
need to be qualified. Since data are limited, the CGE in this essay cannot
capture perfectly all relationships within the economy, within the
environment, and between the economy and the environment. The
underlying assumptions for the CGE and the simulation scenarios also should
be carefully examined.
Five major findings result from the CGE.21 First, a more equal income
distribution in Indonesia results from the Base Condition scenario; each year
during the ten year horizon, this income distribution becomes increasingly
more equal. Second, the implementation of the IPM program, either the Basic
IPM, IPM Plus Tax, Ambitious IPM, or Strategic IPM Program, most probably
produces an almost identical income distribution as that which occurs under
the Base Condition scenario. In effect, implementation of any IPM program
produces a more equal income distribution in Indonesia.
Third, the implementation of only an IPM Program, i.e. the Basic IPM,
Ambitious IPM, or Strategic IPM Program, successfully increases the average
annual GDP growth rate and the incomes of all household groups, while
decreasing the health costs associated with pesticide-related illnesses. The
combination of an IPM Program with a tax on pesticides is capable of
reducing health costs associated with pesticide-related illnesses to a level

121
lower than that produced with only an IPM Program, and is capable of
increasing the average annual growth rate of GDP higher than that under the
Base Condition. This combination program, however, reduces the incomes of
farm owners.
Fourth, the Ambitious IPM program is able to reduce the health costs
associated with pesticide-related illnesses to a level lower than that of other
program scenarios. Hence, if the goal of the government is to reduce the use
of pesticides to as low a level as possible, i.e. reducing the environmental
damage associated with pesticides, increasing the budget for the IPM Program
from the first year of the IPM implementation might be the appropriate choice.
Finally, the Strategic IPM Program is able to increase all household
incomes and produce a higher annual GDP growth rate than the rates
achieved under the Basic IPM, IPM Plus Tax, and Ambitious IPM Programs.
Therefore, if the goal of the government, besides reducing the environmental
damage caused by the use of pesticides, is to increase national economic
growth and household incomes as high as possible, it might be wise for the
government to periodically increase the budget for the IPM Program.
21 Please see footnote 17 for several assumptions imposed during the ten-year simulation.

122
4.8 References
Achmadi, U.F. “Agricultural Injuries in Indonesia: Estimates and Surveys.”
Department of Public Health Working Paper, University of Indonesia,
Jakarta, 1991.
Central Bureau of Statistics. Statistical Yearbook of Indonesia 1990. Jakarta:
Central Bureau of Statistics, 1991.
IPM National Program Monitoring and Evaluation Team. The Impact of IPM
Training on Farmers’ Behavior: A Summary of Results from the Second Field
School Cycle. Jakarta: BAPPENAS, 1993.
Lewis, J.D. “A Computable General Equilibrium (CGE) Model of Indonesia.”
Development Discussion Papers, Harvard Institute for International
Development, Cambridge, 1991.
Oka, I.N. “Success and Challenges of the Indonesian National Integrated Pest
Management Program in the Rice-based Cropping System.” Crop
Protection, 10 (3 1991): 163-65.
____. “Integrated Crop Pest Management With Farmer Participation in
Indonesia.” Working Papers, Food Crop Research Center, Bogor, 1995.
Pimentel, D., H. Acquay, M. Biltonen, P. Rice, M. Silva, J. Nelson, V. Lipner, S.
Giordano, A. Horowitz, and M. D’AMore. “Environmental and
Economic Costs of Pesticide Use.” BioScience, 42 (November 1992): 750-
60.
Thorbecke, E. “A Computable General Equilibrium Model Integrating Real
and Financial Transactions.” Adjustment and Equity in Indonesia. E.
Thorbecke et al., pp. 85-102. Paris: OECD Publications, 1992.