chapter existing conditions summary - · pdf filechapter 2 existing conditions summary ......
TRANSCRIPT

Final Report New Haven Hartford Springfield Commuter Rail Implementation Study
________________________________________________________________________ Page 2-1
2 Existing Conditions
Chapter 2 Existing Conditions Summary
This chapter is a summary of the existing conditions report, necessary for comprehension of the remaining chapters. The entire report can be found in Appendix B of this report.
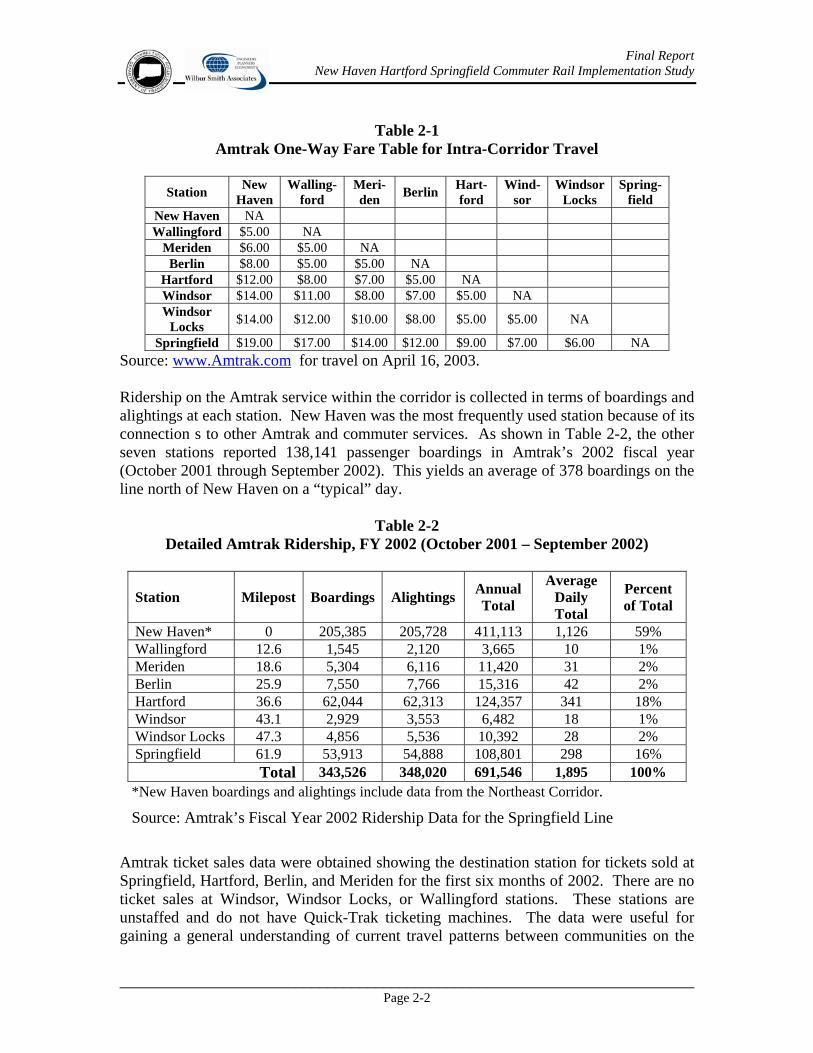
2.1 Existing Passenger Services on the Line The only existing passenger rail service on the Springfield Line is a regional service operated by Amtrak. Schedules for alternatives in Chapter 3 and the Recommended Action in Chapter 4 include current Amtrak service. Most Amtrak service on the line is shuttle trains, running between Springfield and New Haven, where they connect with other Amtrak Northeast Corridor trains. One round-trip train each day operates through the corridor to Boston to the north and Washington to the south. One round trip train each day operates to and from St. Albans, Vermont from New Haven. The trains also permit connections at New Haven with Amtrak’s Northeast Corridor (Washington to Boston) service, as well as Metro North service to New York, and Shore Line East local commuter service to New London. Departures are spread throughout the day, with trains typically operating at intervals of two to three hours. Springfield line services are designed as extensions of Amtrak’s Northeast Corridor service, and are not scheduled to serve local commuter trips (home to work trips). The Amtrak fare structure was substantially reduced in price since this study began. The original fare structure from November 2002 was shown in the existing conditions report, which can be found in Appendix B. Table 2-1 provides a complete listing of the Amtrak fares within the corridor as of April 2003, which is similar to the fare structure in early 2005 as this report is being finalized. 10-ride tickets and monthly passes are also available for the Amtrak service. Although the one-way fare structure for Amtrak is approximately twice the one-way fare structure proposed for start-up commuter rail service, the proposed monthly pass fares for the start-up commuter rail service are approximately the same as the monthly pass fares for current Amtrak service.
Final Report New Haven Hartford Springfield Commuter Rail Implementation Study
________________________________________________________________________ Page 2-2
Table 2-1 Amtrak One-Way Fare Table for Intra-Corridor Travel
Station New
Haven Walling-
ford Meri-den Berlin Hart-
ford Wind-
sor Windsor
Locks Spring-
field New Haven NA Wallingford $5.00 NA
Meriden $6.00 $5.00 NA Berlin $8.00 $5.00 $5.00 NA
Hartford $12.00 $8.00 $7.00 $5.00 NA Windsor $14.00 $11.00 $8.00 $7.00 $5.00 NA Windsor
Locks $14.00 $12.00 $10.00 $8.00 $5.00 $5.00 NA
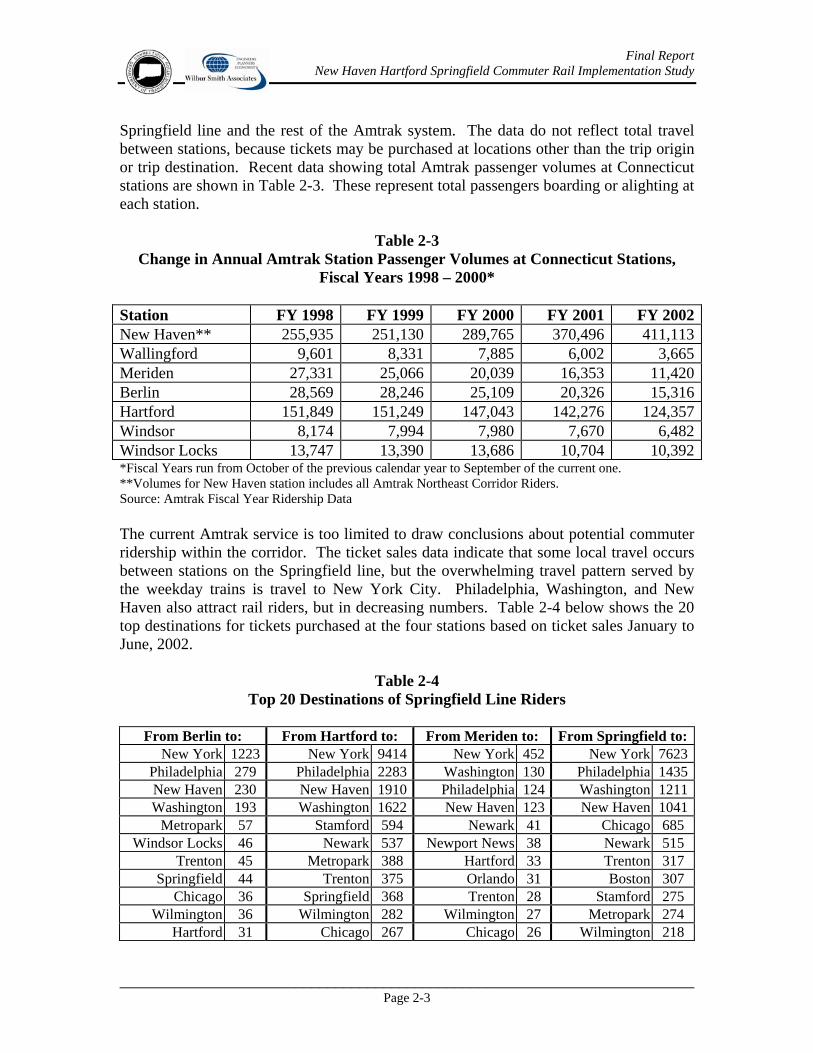
Springfield $19.00 $17.00 $14.00 $12.00 $9.00 $7.00 $6.00 NA Source: www.Amtrak.com for travel on April 16, 2003. Ridership on the Amtrak service within the corridor is collected in terms of boardings and alightings at each station. New Haven was the most frequently used station because of its connection s to other Amtrak and commuter services. As shown in Table 2-2, the other seven stations reported 138,141 passenger boardings in Amtrak’s 2002 fiscal year (October 2001 through September 2002). This yields an average of 378 boardings on the line north of New Haven on a “typical” day.
Table 2-2 Detailed Amtrak Ridership, FY 2002 (October 2001 – September 2002)
Station Milepost Boardings Alightings Annual Total
Average Daily Total
Percent of Total
New Haven* 0 205,385 205,728 411,113 1,126 59% Wallingford 12.6 1,545 2,120 3,665 10 1% Meriden 18.6 5,304 6,116 11,420 31 2% Berlin 25.9 7,550 7,766 15,316 42 2% Hartford 36.6 62,044 62,313 124,357 341 18% Windsor 43.1 2,929 3,553 6,482 18 1% Windsor Locks 47.3 4,856 5,536 10,392 28 2% Springfield 61.9 53,913 54,888 108,801 298 16%
Total 343,526 348,020 691,546 1,895 100% *New Haven boardings and alightings include data from the Northeast Corridor.
Source: Amtrak’s Fiscal Year 2002 Ridership Data for the Springfield Line
Amtrak ticket sales data were obtained showing the destination station for tickets sold at Springfield, Hartford, Berlin, and Meriden for the first six months of 2002. There are no ticket sales at Windsor, Windsor Locks, or Wallingford stations. These stations are unstaffed and do not have Quick-Trak ticketing machines. The data were useful for gaining a general understanding of current travel patterns between communities on the
Final Report New Haven Hartford Springfield Commuter Rail Implementation Study
________________________________________________________________________ Page 2-3
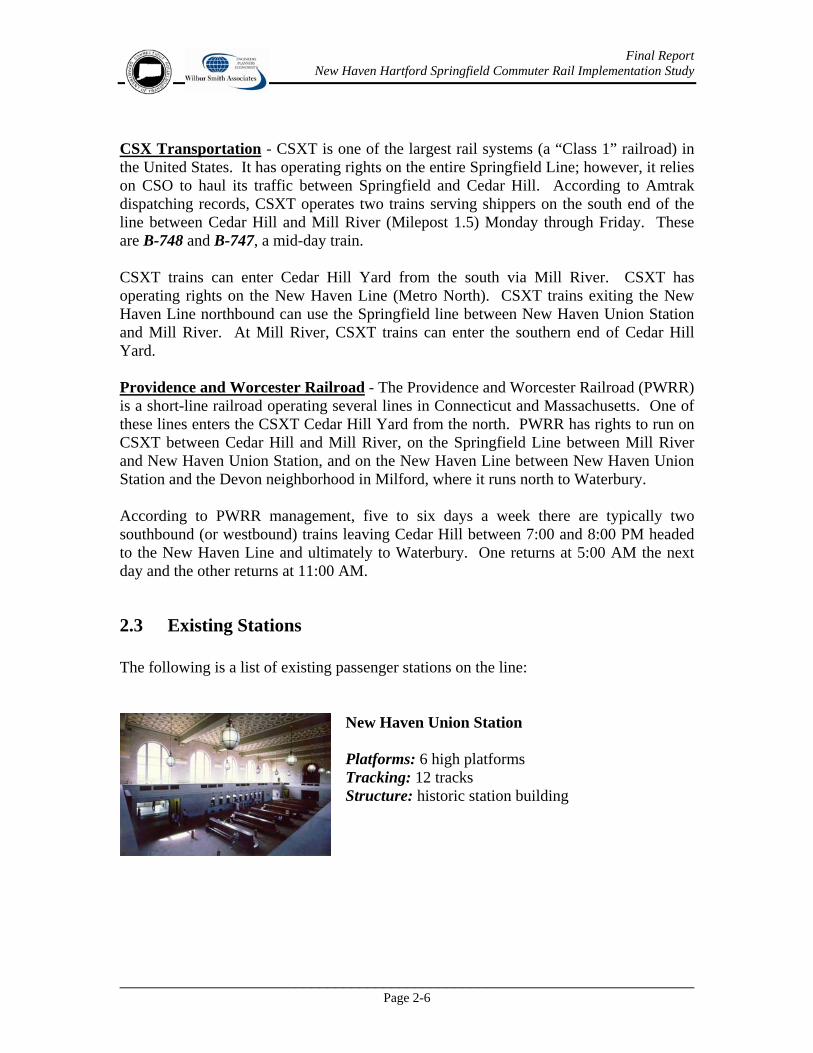
Springfield line and the rest of the Amtrak system. The data do not reflect total travel between stations, because tickets may be purchased at locations other than the trip origin or trip destination. Recent data showing total Amtrak passenger volumes at Connecticut stations are shown in Table 2-3. These represent total passengers boarding or alighting at each station.
Table 2-3 Change in Annual Amtrak Station Passenger Volumes at Connecticut Stations,
Fiscal Years 1998 – 2000* Station FY 1998 FY 1999 FY 2000 FY 2001 FY 2002New Haven** 255,935 251,130 289,765 370,496 411,113Wallingford 9,601 8,331 7,885 6,002 3,665Meriden 27,331 25,066 20,039 16,353 11,420Berlin 28,569 28,246 25,109 20,326 15,316Hartford 151,849 151,249 147,043 142,276 124,357Windsor 8,174 7,994 7,980 7,670 6,482Windsor Locks 13,747 13,390 13,686 10,704 10,392*Fiscal Years run from October of the previous calendar year to September of the current one. **Volumes for New Haven station includes all Amtrak Northeast Corridor Riders. Source: Amtrak Fiscal Year Ridership Data The current Amtrak service is too limited to draw conclusions about potential commuter ridership within the corridor. The ticket sales data indicate that some local travel occurs between stations on the Springfield line, but the overwhelming travel pattern served by the weekday trains is travel to New York City. Philadelphia, Washington, and New Haven also attract rail riders, but in decreasing numbers. Table 2-4 below shows the 20 top destinations for tickets purchased at the four stations based on ticket sales January to June, 2002.
Table 2-4 Top 20 Destinations of Springfield Line Riders
From Berlin to: From Hartford to: From Meriden to: From Springfield to:
New York 1223 New York 9414 New York 452 New York 7623Philadelphia 279 Philadelphia 2283 Washington 130 Philadelphia 1435New Haven 230 New Haven 1910 Philadelphia 124 Washington 1211Washington 193 Washington 1622 New Haven 123 New Haven 1041
Metropark 57 Stamford 594 Newark 41 Chicago 685 Windsor Locks 46 Newark 537 Newport News 38 Newark 515
Trenton 45 Metropark 388 Hartford 33 Trenton 317 Springfield 44 Trenton 375 Orlando 31 Boston 307
Chicago 36 Springfield 368 Trenton 28 Stamford 275 Wilmington 36 Wilmington 282 Wilmington 27 Metropark 274
Hartford 31 Chicago 267 Chicago 26 Wilmington 218

Final Report New Haven Hartford Springfield Commuter Rail Implementation Study
________________________________________________________________________ Page 2-4
From Berlin to: From Hartford to: From Meriden to: From Springfield to:Windsor 29 Baltimore 234 Baltimore 20 Baltimore 187 Orlando 25 Boston South 220 Springfield 19 St. Albans 155 Newark 24 New Rochelle 203 New Carrolton 19 New Rochelle 151
Baltimore 18 Bridgeport 197 Metropark 16 Windsor Locks 147 Baltimore
Washington Airport
18 St. Albans 164 Baltimore Washington
Airport
15 Amherst 145
Boston 16 Windsor 161 Wallingford 15 Orlando 141 New Carrolton 14 Orlando 152 Stamford 10 Toledo 127
Montreal 13 Windsor Locks 108 Buffalo 10 Albany 126 Richmond 13 New Carrolton 107 Boston 8 Bridgeport 110
* Note-- Excludes tickets purchased at a station with the destination being the same station. For example, 1,141 tickets were sold at Berlin with a destination of Berlin. These represent sales of return tickets from another location to Berlin.
2.2 Existing Freight Services on the Line There are four freight carriers using the Springfield Line between Springfield (Milepost 62.0) and New Haven Union Station (Milepost 0.0). They include Connecticut Southern (CSO), Boston and Maine Corporation (B&M), CSX Transportation (CSXT), and Providence and Worcester Railroad (PWRR). Connecticut Southern - The Connecticut Southern Railroad (CSO) is a short-line operator running trains on the line between Springfield and CSX Transportation’s Cedar Hill Yard (Milepost 7). Part of the RailAmerica Inc. short-line family of railroads, the carrier is the major freight operator on the line. CSO hauls its own traffic and traffic for CSX Transportation (see below) between Springfield and Cedar Hill. CSO management reported the following train movements. CSO has four trains on the line Monday through Saturday, with occasional use on Sunday. These trains are:
• CSO-1, southbound, departing Springfield at about 6:00 AM, working toward Cedar Hill. The train returns to Springfield in the afternoon.
• CSO-2, southbound, departing Hartford at about 7:00 PM working toward Wallingford. The train returns to Hartford at 4:30 AM the next day.
• CSO-3, northbound, departing Hartford at about 7:00 AM, working north to Enfield. The train returns to Hartford between 2:00 and 6:00 PM.
• CSO-4, northbound, departing about 5:00 PM, working between Hartford and Enfield. The train returns to Hartford in the early morning of the next day.
Traffic on the CSO is growing. When Conrail turned over operations on the line to CSO, Conrail’s activity on the line was 20,000 carloads a year, with volumes declining. According to CSO, Conrail was not actively developing traffic on the line. The lowest traffic volume was in 1996, when there were only 16,000 carloads. Presently the annual

Final Report New Haven Hartford Springfield Commuter Rail Implementation Study
________________________________________________________________________ Page 2-5
total is about 18,000 carloads per year, and rising, with customers returning. By 2007, CSO forecasts that there will be between 22,000 and 23,000 carloads per year, if the construction debris haulage market remains stable. Growth commodities include trash, hazmat and “dirty dirt”, i.e. the construction debris market. CSO indicated that CSXT has targeted removing trash, or solid municipal waste, as a market that may grow faster than the economy. Markets that will grow with the economy include chemicals (hauled in tank cars), lumber (box cars and flat cars), plastics (hopper cars), paper and pulp (box cars), steel (gondolas), and scrap paper (box cars). CSO management reported the following concerns over a new commuter rail service on the Springfield line:
• Commuter rail service would restrict the time windows available for freight operations, making it more difficult to run freight trains. Freight transit time would increase.
• Sidings are not in strategic locations to facilitate the passing of freight and passenger trains.
• Sidings are not long enough. The typical train length for the CSO-1 service is 60 to 100 cars, or about 4,000 to 6,000 feet long. According to CSO, sidings need to be 8,000 feet long. (If the route were double-tracked, these concerns would no longer exist.)
• Traffic on the Suffield Branch (the potential rail link to Bradley International Airport from Windsor Locks) is increasing. Customers include wood pulp and special paper shippers and aviation-related shippers. There is also potential for construction debris removal.
• A new commuter rail service would require new maintenance windows (during which time trains cannot operate), which would hinder freight movement on the line.
• The CSO-1 service needs to return to Springfield before 2:00 PM in order to avoid waiting for CSXT and Amtrak operations to clear the CSXT Albany-Boston line before the train can enter CSXT’s West Springfield Yard (the train’s origin and destination).
Boston & Maine Corporation - Boston & Maine is a short-line railroad operating on the Springfield line between Springfield and Berlin (Milepost 26) and a switch to Waterbury. B&M is part of the Guilford Rail System. Guilford management declined to comment on either its train volumes, traffic, or concerns over a new commute rail service. According to Amtrak dispatching records, B&M has two trains operating on the line. These are:
• PLED, northbound, operating twice a week with no set schedule between Berlin and Springfield.
• EDPL, southbound, operating twice a week with no set schedule between Springfield and Berlin.
Reportedly, B&M has operating rights as far south as the Cedar Hill Yard (Milepost 7).
Final Report New Haven Hartford Springfield Commuter Rail Implementation Study
________________________________________________________________________ Page 2-6
CSX Transportation - CSXT is one of the largest rail systems (a “Class 1” railroad) in the United States. It has operating rights on the entire Springfield Line; however, it relies on CSO to haul its traffic between Springfield and Cedar Hill. According to Amtrak dispatching records, CSXT operates two trains serving shippers on the south end of the line between Cedar Hill and Mill River (Milepost 1.5) Monday through Friday. These are B-748 and B-747, a mid-day train. CSXT trains can enter Cedar Hill Yard from the south via Mill River. CSXT has operating rights on the New Haven Line (Metro North). CSXT trains exiting the New Haven Line northbound can use the Springfield line between New Haven Union Station and Mill River. At Mill River, CSXT trains can enter the southern end of Cedar Hill Yard. Providence and Worcester Railroad - The Providence and Worcester Railroad (PWRR) is a short-line railroad operating several lines in Connecticut and Massachusetts. One of these lines enters the CSXT Cedar Hill Yard from the north. PWRR has rights to run on CSXT between Cedar Hill and Mill River, on the Springfield Line between Mill River and New Haven Union Station, and on the New Haven Line between New Haven Union Station and the Devon neighborhood in Milford, where it runs north to Waterbury. According to PWRR management, five to six days a week there are typically two southbound (or westbound) trains leaving Cedar Hill between 7:00 and 8:00 PM headed to the New Haven Line and ultimately to Waterbury. One returns at 5:00 AM the next day and the other returns at 11:00 AM.
2.3 Existing Stations The following is a list of existing passenger stations on the line:
New Haven Union Station Platforms: 6 high platforms Tracking: 12 tracks Structure: historic station building

Final Report New Haven Hartford Springfield Commuter Rail Implementation Study
________________________________________________________________________ Page 2-7
State Street Station Note: serves Shore Line East, not Amtrak Platforms: 2 high platforms Tracking: 5 tracks Structure: station structure below street level, station opened in June 2002
Wallingford Station Platforms: 1 low platform Tracking: 1 track Structure: historic station structure
Meriden Station Platforms: 2 low platforms Tracking: 2 tracks Structure: enclosed station with seating
Berlin Station Platforms: 1 low platform Tracking: 1 track Structure: historic station structure
Hartford Union Station Platforms: 1 low platform Tracking: 1 track Structure: historic station structure

Final Report New Haven Hartford Springfield Commuter Rail Implementation Study
________________________________________________________________________ Page 2-8
Windsor Station Platforms: 1 low platform Tracking: 1 track Structure: historic station structure
Windsor Locks Station Platforms: 1 high platform (newly reconstructed) Tracking: 1 track Structure: none
Springfield Union Station Platforms: 4 low platforms. Tracking: 4 tracks Structure: minimal shelter; Union Station to be restored
2.4 Station Parking and Access for Cars The existing stations within the study area corridor are served by parking facilities in use by Amtrak passengers, other transit passengers and park and ride users. Table 2-5 provides the existing number of parking spaces and usage rates. Significant parking is available at the three Union Stations. Most of the parking at these stations is filled, however some parking is typically available. As has been noted in other studies, parking is often difficult to find at New Haven Union Station, with parking at the station filled at a very early hour of the morning rush. Currently, a Temple Street Garage Shuttle bus allows parking at other area facilities. The pending construction of a second garage at New Haven Union Station would increase parking, but would temporarily reduce the number of available spaces by 300 due to the loss of the surface lot. Hartford Union Station and Springfield Union Station have nearby privately-owned parking facilities that are within walking distance of the stations.
Final Report New Haven Hartford Springfield Commuter Rail Implementation Study
________________________________________________________________________ Page 2-9
Table 2-5 Station Parking Availability and Use
Station Parking
Spaces Average 10-
Year Use Highest Use in 10 years
Available spaces at
highest use New Haven Union Station 11531 N/A2 N/A2 03
New Haven State Street 04 N/A4 N/A4 N/A4
Wallingford 96 25 65 (1993) 31Meriden 16 7 16 (1993) 0Berlin 60 28 43 (1998) 17Hartford Union Station 197 81 125 (1998) 72Windsor 86 8 16 (2001) 70Windsor Locks 100 17 23 (1996) 77Springfield Union Station 05 N/A N/A N/A1This figure only includes the New Haven Union Station parking structure and adjoining surface parking lot. It does not include a private parking structure (unknown number of spaces) across Union Avenue, nor does it include 600 available spaces at the Temple Street Garage, a quarter-mile away, which is served by a free bus shuttle. An additional parking structure is planned at New Haven Union Station. 2This figure is not available for New Haven Union Station because the 10-year data available did not break down availability at Union Station as listed above in footnote 1. 3Current utilization for year 2003, using assumptions in footnote 1. 4There are 300 private parking spaces in downtown surface lots near the State Street station that are not exclusively dedicated for station use. The State Street Station opened for operation in June, 2002. 5There is no dedicated parking available at this station at this time, although on-street parking is available, and a total of 3,170 spaces in structures, surface lots, and on-street were inventoried within a few blocks of the station in 1999 . After renovation, the station is planned to have 1,100 new spaces available. Sources: ConnDOT Parking Survey, Union Station [Springfield] Draft Environmental Impact Report/Environmental Assessment (Feb. 2000), PVTA web site
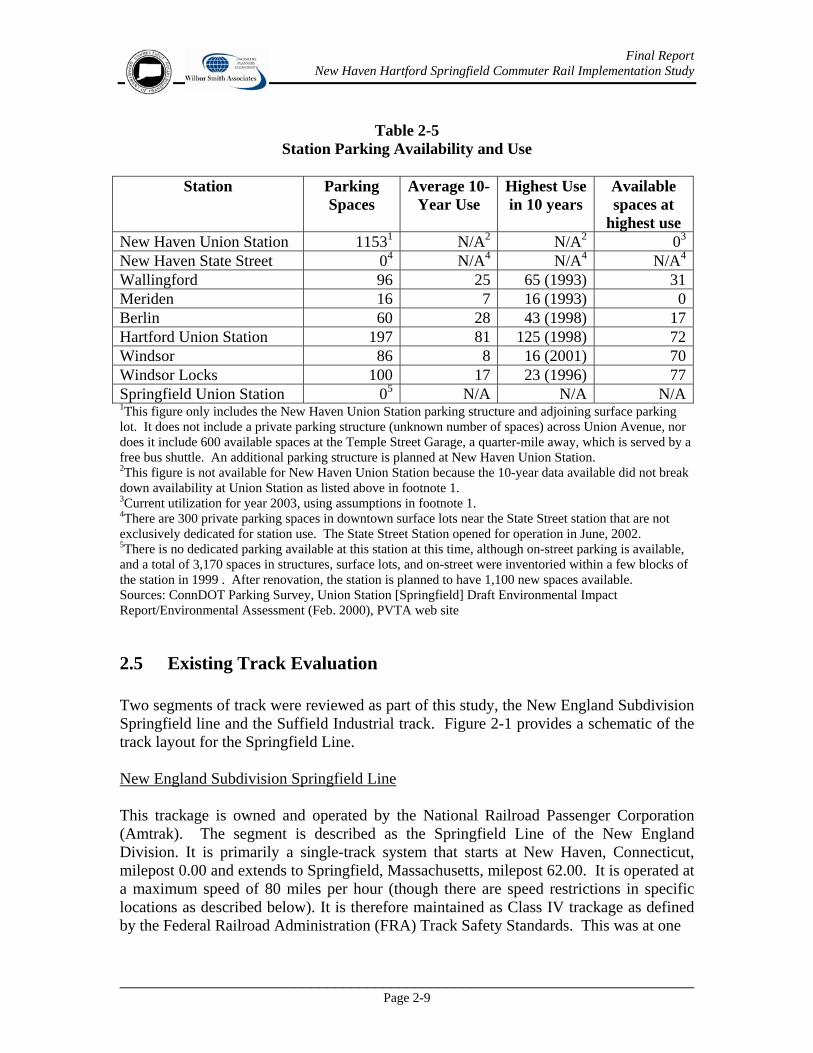
2.5 Existing Track Evaluation Two segments of track were reviewed as part of this study, the New England Subdivision Springfield line and the Suffield Industrial track. Figure 2-1 provides a schematic of the track layout for the Springfield Line. New England Subdivision Springfield Line This trackage is owned and operated by the National Railroad Passenger Corporation (Amtrak). The segment is described as the Springfield Line of the New England Division. It is primarily a single-track system that starts at New Haven, Connecticut, milepost 0.00 and extends to Springfield, Massachusetts, milepost 62.00. It is operated at a maximum speed of 80 miles per hour (though there are speed restrictions in specific locations as described below). It is therefore maintained as Class IV trackage as defined by the Federal Railroad Administration (FRA) Track Safety Standards. This was at one

FIGURE 2-1
SCHEMATIC OF EXISTING TRACK LAYOUTS, SPRINGFIELD LINENEW HAVEN - HARTFORD – SPRINGFIELD COMMUTER RAIL FEASIBILITY STUDYENGINEERS
PLANNERSECONOMISTS
Wilbur Smith Associates
East WindsorSuffield
48 49 50 51 52 53 54 55 56 57 58 59 60 61 62
80m.p.h.
Enfield, CT. Longmeadow, MA.
Spur Rail ToBradley Airport
30 m.p.h. Speed Limit CrossingBridge St., 4:15 – 4:45 P.M.
80 m.p.h.
PedC
ross
ingDe
xter
Route
140
(Brid
ge S
t.)
70m.p.h.
80m.p.h.
Springfield
20 m.p.h.10 m.p.h.
80m.p.h.
45 m.p.h.
WindsorLocks
50m.p.h.
Mack
town
32 33 36 37 38 39 41 42 43 44 46 47 48
HartfordNewington
80m.p.h.
50m.p.h.
Oakw
ood
Flatb
ush
Hami
lton
Flowe
r
Mead
ow
Wils
on
E. B
arbo
ur
Islan
d
Centr
al
Pier
son’s
Hayd
en S
ta.
34 35
West Hartford
40 45
Windsor
0 1 2 3 4 5 6 7 8 9 10 11 12 14 15 16
New Haven
60m.p.h.
80m.p.h.
35m.p.h.
Winc
heste
rs
Sack
ettPo
int
Stile
sDe
vine
War
d
Quinn
ipiac
Hall
Parke
rHo
sford
N. P
lains
Pent
Hwy.
Toell
es
Hamden North Haven Wallingford
13
Coop
erCh
erry
S. C
olony
E. M
ainBr
ooks
Cros
sCa
mp
Brita
innia
N. C
olony
16 17 18 20 21 22 23 24 25 26 27 28 29 30 31 32
BerlinWallingford NewBritain Newington
80m.p.h.
Meriden
19
60 m.p.h.
80m.p.h.
25m.p.h.
80m.p.h.
80m.p.h.
25 m.p.h.
NNot to Scale
35m.p.h.
WindsorLocks
LEGEND
Milepost
Railroad Tracks
Town / City Line
Existing Station
Maximum PassengerTrain Speed
At Grade Crossing(Only Public CrossingsShown)
Connecticut River Bridge
80m.p.h.
18
20m.p.h.
7.3
16.95 20.6 31.1
35.2 43.0 46.3
54.7

Final Report New Haven Hartford Springfield Commuter Rail Implementation Study
________________________________________________________________________ Page 2-11
time a double-track railroad but has since been rationalized for centralized traffic control. Train dispatching is handled out of Boston, Massachusetts. As is illustrated in Figure 2-1 the corridor contains 23.7 miles of double track and 38.2 miles of single track. Double track is available:
• Through New Haven into North Haven (7.2 mi) • Most of Meriden (3.5 mi) • A small segment in Newington and West Hartford (2.3 mi, not including Parkville
industrial track) • Windsor to Windsor Locks stations (3.6 mi) • Enfield Station area into Springfield (7.1 mi)
There are 54 at-grade crossings, of which 36 grade crossings are equipped with active warning devices, and 10 Grade Crossings without active warning devices. At-Grade crossings can have various levels of treatments depending upon such factors as traffic volumes, roadway speeds, and whether the roadway being crossed is a public highway or private property access The track structure is predominately 119 LB RE continuous welded rail on wood ties fastened by two cut spikes. Double shoulder plates are secured with two spikes. The track is anchored in accordance with standard plans. An inspection of the line was made on January 6, 2003. As of that date there are two temporary speed restrictions on the line. The first restriction is a 60 mph limit located at milepost 7.1 on track #1. This order has been in effect for several years because of bridge conditions. The second temporary speed restriction is 30 mph located at milepost 43.08 on track #2. This order has also been in effect for several years because of bridge conditions. There are a number of permanent speed restrictions that are related to signal design, bridge design or track geometry. There appear to be several restrictions placed at the request of local communities. Speed restrictions may also have been instituted because of a high concentration of at-grade crossings in a short distance, or because other geometric or structural limitations (curves or bridge loadings) require that trains maintain a slower speed through specific segments. Areas with speed restrictions are pictured in Figure 2-1 and include:
• New Haven (35 mph) • Wallingford (25 mph) • Meriden (25 mph) • Hartford (20 mph) • Windsor Locks (50, 30 mph) • Connecticut River Bridge (35 mph) • Springfield (20, 10 mph)
Final Report New Haven Hartford Springfield Commuter Rail Implementation Study
________________________________________________________________________ Page 2-12
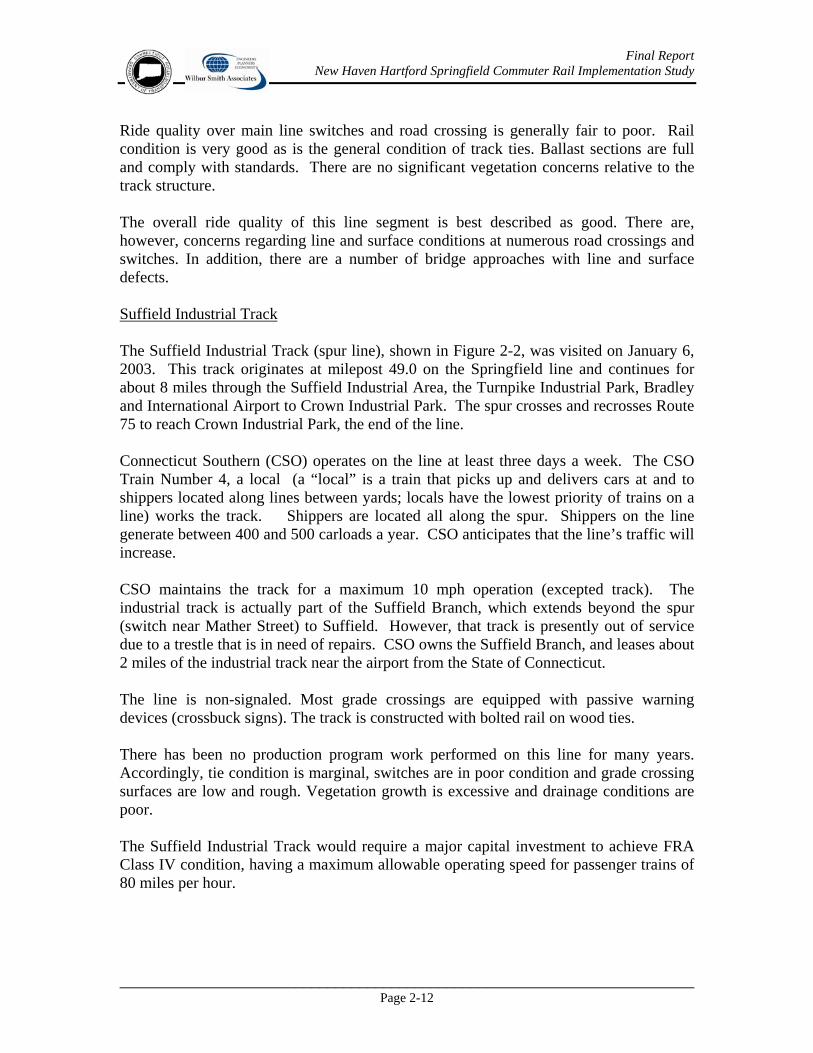
Ride quality over main line switches and road crossing is generally fair to poor. Rail condition is very good as is the general condition of track ties. Ballast sections are full and comply with standards. There are no significant vegetation concerns relative to the track structure. The overall ride quality of this line segment is best described as good. There are, however, concerns regarding line and surface conditions at numerous road crossings and switches. In addition, there are a number of bridge approaches with line and surface defects. Suffield Industrial Track The Suffield Industrial Track (spur line), shown in Figure 2-2, was visited on January 6, 2003. This track originates at milepost 49.0 on the Springfield line and continues for about 8 miles through the Suffield Industrial Area, the Turnpike Industrial Park, Bradley and International Airport to Crown Industrial Park. The spur crosses and recrosses Route 75 to reach Crown Industrial Park, the end of the line. Connecticut Southern (CSO) operates on the line at least three days a week. The CSO Train Number 4, a local (a “local” is a train that picks up and delivers cars at and to shippers located along lines between yards; locals have the lowest priority of trains on a line) works the track. Shippers are located all along the spur. Shippers on the line generate between 400 and 500 carloads a year. CSO anticipates that the line’s traffic will increase. CSO maintains the track for a maximum 10 mph operation (excepted track). The industrial track is actually part of the Suffield Branch, which extends beyond the spur (switch near Mather Street) to Suffield. However, that track is presently out of service due to a trestle that is in need of repairs. CSO owns the Suffield Branch, and leases about 2 miles of the industrial track near the airport from the State of Connecticut. The line is non-signaled. Most grade crossings are equipped with passive warning devices (crossbuck signs). The track is constructed with bolted rail on wood ties. There has been no production program work performed on this line for many years. Accordingly, tie condition is marginal, switches are in poor condition and grade crossing surfaces are low and rough. Vegetation growth is excessive and drainage conditions are poor. The Suffield Industrial Track would require a major capital investment to achieve FRA Class IV condition, having a maximum allowable operating speed for passenger trains of 80 miles per hour.
lBradley
InternationalAirport
§̈¦91140
159
20
140
tu5
SUFFIELD
ENFIELD
EASTWINDSOR
Harvey Ln.
Suffield St.
M
Sout
h St
.Spring St.
Elm St.
Ham
ilton
Rd.
Shoephoester Rd.
Old County Rd.
75
Ella T. Grasso Tpk.
North St.Choice Rd.
Conn
ectic
ut Rive
r
KingsIsland
Stony Brook
Kettl e Brook
WINDSOR LOCKS
New Haven - Hartford - SpringfieldCommuter Rail Feasibility Study
Study Area CorridorBradley Airport Spur
Figure 2-2
0 0.5 1Miles
µ
LegendSecondary Roads
Major Roads
Highways
Rail Line
Final Report New Haven Hartford Springfield Commuter Rail Implementation Study
________________________________________________________________________ Page 2-14
2.6 Existing Communications and Signal Systems Evaluation
Amtrak’s 62-mile Springfield Line operationally begins in New Haven at Mill River interlocking, railroad Mile Post 1.5, and continues north to Springfield, MA, to milepost 61.7. Mill River interlocking is a key communications and signal control point location that comprises the physical junction of the Springfield Line which operates North / South and the Amtrak-owned Shore Line portion of the Northeast Corridor that operates East / West from New Haven to Boston, MA. At Mill River interlocking, trains leaving New Haven bound for points on the Springfield Line are diverted north and trains bound for points on the Shoreline are diverted east. The operational end of the Springfield Line is at the north limits of “Spring” interlocking, milepost 61.7, where it then connects to the CSX-owned Boston and Albany Main Line at Springfield Station.
Unlike the Northeast Corridor from New Haven to Boston and from New Haven to Washington, D.C., the Springfield Line is not electrified through an overhead catenary system. Originally a two-track “main line,” the Springfield Line is now a single-track line with remote controlled passing sidings that allow trains to safely pass each other in different directions, or for one train to pass another traveling in the same direction.
Primary Springfield Line Communications & Signal system elements include:
• Cab Signal System (CSS) and Automatic Block Signal (ABS) train control system with 10 controlled passing sidings; bi-directional or “261” signaling to accommodate train movements in either direction; Springfield Line train dispatchers are located in Amtrak’s Centralized Traffic and Electrification Control (CETC) facility in South Station, Boston, MA.
• 36 grade crossings equipped with active warning devices
• 10 grade crossings without active warning devices
• 6 radio repeater sites for train dispatching, maintenance-of-way, and Amtrak Police use; local passenger station services radio use
• 2 local telephone system exchanges (New Haven and Hartford); leased telephone lines for remote supervision of primary signal control points
• Fiber-optic cable is installed in some sections of the Springfield Line but it is owned and maintained by communications service providers (AT&T, MCI, Sprint) and not by Amtrak
Amtrak maintains primary 480-volt AC and 2200-volt AC power distribution systems that provide lower voltage service feeds to all communications & signal facilities, including grade crossings.
Final Report New Haven Hartford Springfield Commuter Rail Implementation Study
________________________________________________________________________ Page 2-15
2.7 Maintenance Facilities There are two railroad equipment maintenance facilities in the New Haven area, which were reviewed as potential maintenance facilities for diesel-powered Springfield Line commuter rail rolling stock. Both are owned by the Connecticut Department of Transportation (ConnDOT). One is for the maintenance of Shore Line East equipment and the other is for Metro North equipment. The Shore Line East facility is approximately 2 years old. The facility has four tracks inside the shop structure. At any given time, 2 diesel-powered train sets (locomotive and cars) can be serviced inside the structure, while 2 others remain outside the shop. In addition to the track, the facility has three overhead cranes, a drop table, a small machine shop, and a welding area. The car wash machine has been decommissioned at this time. Amtrak currently maintains Shore Line East equipment under contract to ConnDOT. The facility maintains a total of 6 train sets, comprised of 8 locomotives and 22 cab-cars (cars with an operator’s compartment at one end) and coaches, including spares. Amtrak reported that it has no available space at this facility for maintaining additional diesel-powered Springfield Line commuter rail equipment. While the Shore Line East shop operates on a six-day, two-shift schedule, maintenance of additional equipment associated with a potential New Haven – Hartford – Springfield Commuter Rail service could not be accommodated at this facility because of limitations in the number of tracks to store and service additional equipment. ConnDOT recently constructed a storage area to conduct running repairs adjacent to the facility. With these tracks, Shore Line East cars can have their vacuum systems cleaned near the maintenance facility rather than at the New Haven Union Station platform tracks. At the present time, the yard and maintenance facility currently have limited capacity for expanded commuter operations. Attached to the Shore Line East facility is another facility for the maintenance of Metro North commuter equipment. The equipment maintained here are electric powered train sets. As this facility is an electric equipment maintenance shop, ConnDOT does not consider that this facility would be appropriate for maintenance of diesel-powered Springfield Line commuter rail equipment. Plans are being developed to provide additional and improved maintenance facilities in New Haven for both the near and long-term needs of the Shore Line East services. The study team does not anticipate that this will impact the need for a New Haven to Springfield Rail shop.

Final Report New Haven Hartford Springfield Commuter Rail Implementation Study
________________________________________________________________________ Page 2-16
2.8 Amtrak Bridges Evaluation The evaluation of existing conditions of Amtrak bridges in the study corridor is based solely on the review of Amtrak bridge inspection reports. No site visits, inspections, or other field activities were performed. Based on advisement by Amtrak officials, available bridge load rating reports for structures located on the Springfield Line were deemed outdated and to have inconsequential information for the evaluation of each bridge. Therefore, load rating reports were not used in this Existing Condition Assessment. The study team reviewed the Amtrak 2002 bridge and culvert inspection reports for the Springfield Line, from milepost 0.76 to milepost 62.08. Following review, the team selected the 33 railroad bridges having the largest total length and summarized the bridge inspection report information. The furnished bridge and culvert inspection reports included:
• 14 culverts with span lengths from 5 ft to 6 ft • 5 overhead signal bridges • 10 overhead utility bridges • 4 overhead pedestrian/foot bridges • 2 undergrade pedestrian bridges • 69 overhead bridges (highway or foreign railroad) • 60 undergrade bridges (railroad) with total lengths from 7 ft to 1516 ft • 174 culverts with span lengths from 1 ft to 5 ft
During review of all available data, multiple bridge types were omitted. These bridge types include overhead signal bridges, overhead utility bridges, pedestrian/foot bridges, all overhead structures in which Amtrak crosses under the structure, bridges not currently in use, and culverts (span length less than 6 ft). The 33 railroad bridges with the largest total length were then selected for inclusion in the report. These 33 railroad bridges vary from single spans up to 25 spans and have total lengths ranging from 28 feet to 1,541 feet. The 33 railroad bridges consisted of the following types:
• Concrete Arch • Concrete Encased Through Girder • Deck Girder • Concrete Box Beam • Stone Arch • I-Beam • Through Girder • Concrete Encased I-Beam • Concrete Box • Through Truss
Final Report New Haven Hartford Springfield Commuter Rail Implementation Study
________________________________________________________________________ Page 2-17
Bridge inspection reports contain the results of annual field reviews of each bridge by Amtrak staff. The reports contain subjective ratings of substructure and superstructure components based on a rating scale of 1 to 6, with 1 being excellent, 5 being serious and 6 being failed. The 33 bridges were grouped by their overall structural condition. These conditions were based on a comprehensive look at all pertinent (substructure and superstructure) structural items on the Amtrak bridge inspection reports. There were no bridges in excellent condition. Approximately 43% (14 of 33 bridges) of the railroad bridges studied had computed ratings of good condition. Approximately 39% (13 of 33 bridges) of the railroad bridges studied had computed ratings of fair condition. Approximately 15 percent (5 of 33 bridges) of the railroad bridges had computed ratings of poor condition. These bridges are listed in Table 2-6:
Table 2-6 Bridges on Springfield Line Rated as “Poor”
Bridge Number
(Milepost) Location Bridge Type
1.61 Humphrey Street, New Haven Encased Through Girder 26.39 Willow Brook, Berlin Stone Arch 35.51 Capitol Avenue, Hartford* Through Girder 61.71 East Columbus Avenue, Springfield Through Girder 61.98 Dwight Street, Springfield Through Girder
*To be replaced as part of the New Britain – Hartford Busway project. Approximately six percent (2 of 33 bridges) of the railroad bridges had computed ratings of serious condition. These bridges are listed in Table 2-7:
Table 2-7 Bridges on Springfield Line Rated as “Serious”
Bridge Number
(Milepost) Location Bridge Type
1.48 Mill River, New Haven Concrete Arch 36.66 Church Street, Hartford Deck Girder
There were no bridges in a failed condition. The structural condition of bridges rated “Fair”, “Poor” or “Serious” can be attributed mainly to: • The type of structure built – certain types of structures are more susceptible to
deterioration due to exposure of critical structural members to weather. • The age of the structure – there are many structures which have outlived their useful
design life.

Final Report New Haven Hartford Springfield Commuter Rail Implementation Study
________________________________________________________________________ Page 2-18
• The level of maintenance performed on the structure to date. • The presence of highway salt spray. Presently, six of the 33 bridges studied are now in the category of “Poor” or “Serious”. Of the remaining bridges, 13 are currently rated “Fair”. In general, all bridges will continue to deteriorate. Rates of deterioration will depend on current condition and future maintenance activities. It should be noted that this evaluation was limited to the 33 longest bridges on the Springfield Line.
2.9 Connecting Rail Service In addition to the existing Amtrak service between stations in the corridor, connections to other Amtrak rail service areas is available in New Haven and Springfield. From Springfield Union Station, service is available westward to Albany, eastward to Boston, and northward to Vermont. From New Haven Union Station, intercity rail service is available southbound to New York City (and ultimately Washington DC), and northbound to Rhode Island and Boston. Connections with Metro North’s New Haven Line and the Shore Line East commuter rail are also available from New Haven’s Union Station and State Street Station. Amtrak Effective October 28, 2002, southbound Northeast Corridor service on Amtrak stopping at New Haven includes eight Acela Express and nine other trains during Monday through Thursday (ten on Fridays). On weekends, there are six southbound Acela Express trains and eight other trains on Saturdays (nine on Sunday). Northbound Acela Express service includes seven trains on weekdays with nine other trains Monday through Thursday (ten on Friday). Weekend southbound service includes five Acela Express along with 10 other trains. Springfield and Hartford are both served by five southbound Amtrak trains on weekdays, five southbound trains on Saturdays, and six southbound trains on Sundays. Northbound, both cities are served by six trains on weekdays, five trains on Saturdays, and six trains on Sundays. Most of these trains also serve intermediate Amtrak stations in Wallingford, Meriden, Berlin, Windsor and Windsor Locks, although several bypass those towns. Springfield is also served by east-west Amtrak trains between Albany and Boston (Lake Shore Limited service). Two eastbound trains to Boston are offered daily, (at 4:00 PM, 6:55 PM weekdays and 7:55 weekends) and one westbound train is offered daily to Albany (at 12:10 PM).
Final Report New Haven Hartford Springfield Commuter Rail Implementation Study
________________________________________________________________________ Page 2-19
Metro North For Metro North Service, from Union Station, there are 34 weekday trains heading towards Stamford or New York and 38 weekday trains arriving from New York or Stamford. From the State Street Station, weekday service towards New York is limited to two morning trains ending at Stamford (shared with Shore Line East), and four trains arriving at New York’s Grand Central Station. Weekday service from points west is limited to two morning trains arriving at State Street, (one from Bridgeport and one from Grand Central) and two evening trains (one from Bridgeport and one from Stamford). The Bridgeport and Stamford trains are shared with Shore Line East Service. On Saturdays, New Haven Metro North service includes 23 trains, only from Union Station, heading into New York, and 24 trains returning from Union Station. On Sundays, 21 trains serve Union Station into New York, and 22 trains return from New York. Shore Line East Shore Line East service connects New Haven and New London, with several additional trains per day serving Bridgeport and Stamford directly in express service from New Haven (and allowing shared service with Metro North passengers on those trains). There is no Shore Line East service on weekends. The following schedule was effective October 28, 2002. Weekday westbound Shore Line East Service includes seven morning trains between Old Saybrook and New Haven. (Two of those trains also serve New London). Those trains arrive in New Haven between 6:15 AM and 10:00 AM. Service does not resume until the afternoon. Westbound evening trains include five express trains from Old Saybrook directly to New Haven (three of which also serve New London). The non-express trains all serve State Street Station in addition to Union Station. One additional special train is run on Friday afternoons in the summer to Old Saybrook. For eastbound Shore Line East Service, three trains express in the morning from Union Station in New Haven (between 5:05 AM and 8:19 AM) directly to Old Saybrook (one continuing on to New London). Eight trains are provided in the afternoon and evening to Old Saybrook, three of which continue on to New London. One special train to Old Saybrook is provided on Friday afternoons in the summer. After the last eastbound train has left New Haven at 7:48 PM, Shore Line East passengers can also use a CTTransit bus that stops at Shore Line East stations through Old Saybrook, leaving New Haven at 8:42 PM.
Final Report New Haven Hartford Springfield Commuter Rail Implementation Study
________________________________________________________________________ Page 2-20
2.10 Other Transportation Corridor Services The following section highlights the existing transportation network that serves the Springfield Line study area. The infrastructure that is discussed includes roadways, livery service, intercity bus, local bus transit, para-transit services, and ride-sharing services.
2.10.1 Parallel Roadway Traffic Volumes, Speed and Levels of Service I-91 is the primary parallel roadway competing with potential commuter rail service along the Springfield Line. Route 5, which also serves the corridor, primarily provides local access to commercial land uses, residential land uses and town centers. Table 2-8 shows average daily traffic at selected locations along I-91.
Table 2-8
I-91 2004 Average Daily Traffic at Continuous Count Stations
Location Northbound Southbound Wallingford 41,600 43,300 Wethersfield 62,500 75,900 Enfield 52,700 52,000
Source: ConnDOT Traffic Count Locator
2.10.2 Livery Services Bradley International Airport in Windsor Locks, Connecticut provides Central Connecticut and Central/Western Massachusetts with airline service. Nine operating surface transportation (seven limousine) services operate at the airport. These limousine services are listed in Table 2-9.
Table 2-9 Livery Services at Bradley International Airport
Service
(listed Alphabetically) Service Area Service Type
Advantage Limousine, Inc. Passenger Destination Private limousine Bradways Limo Service Western Massachusetts Private limousine Connecticut Limo West to Danbury, South to
Bridgeport Van share
Joshua’s Limousine Service Connecticut, New England Private limousine Lindsey Limousine Passenger Destination Private limousine Thomas Transportation Mass, New Hampshire, Vermont Van share Valley Transporter Passenger Destination Van share
Source: http://www.bradleyairport.com/easy/transportation.shtml.
Final Report New Haven Hartford Springfield Commuter Rail Implementation Study
________________________________________________________________________ Page 2-21
2.10.3 Intercity Bus Operations Intercity bus service is provided within the study corridor, generally using I-91. The major bus stations in the corridor are in New Haven, Hartford, and Springfield; however, stations in Meriden, Enfield and Windsor Locks also are served by some intercity bus service. East-West intercity bus routes also serve all of the major cities in the corridor. Routes on the I-95 corridor serve New Haven; routes on the I-84 corridor serve Hartford; and routes on the I-90 corridor serve Springfield. Greyhound and Peter Pan - Greyhound and Peter Pan coordinate operations, mostly along I-91 within the New Haven - Springfield corridor. Intercity bus passengers may buy tickets from either company and use them for almost all trips between Springfield and New Haven. Peter Pan is the principal service provider to points east of Springfield. The corridor has six intercity bus terminals: New Haven, Meriden, Hartford, Bradley International Airport (Windsor Locks), Enfield, and Springfield. Peter Pan serves Windsor Locks and Enfield exclusively and Greyhound and Peter Pan both serve the other four stations. The combined services offer approximately 20 bus trips daily in each direction on the corridor. As of October 2002, sample fares included $19.00 from Springfield to New Haven or Merdien and $8.00 from Springfield to Hartford. Bus service for Bradley International Airport is limited to trips from Bradley Airport to Hartford and between Bradley Airport and Springfield. Neither Peter Pan nor Greyhound offer bus service to Bradley from Hartford. Private livery services, such as Connecticut Limousine, offer transit services to and from Bradley. Bonanza - Bonanza provides bus service to Hartford and Springfield, but does not offer service in the North-South corridor. These two stations are used as intermediate stops on services to Providence, Albany and New York City that use regional highways such as Interstates 84 and 90 and Route 6. For the most part, services to and from Hartford and Springfield charge passengers about $20 one way. Twenty Bonanza buses serve Hartford and four buses serve Springfield everyday. Arrow - Arrow Line, Inc, a Coach USA company, provides some intercity bus service within the New Haven-Springfield Corridor. Hartford is served by several of Arrow’s various services. Routes that serve Hartford include bus service between Farmington and Foxwoods and commuter service between Willimantic and Hartford and Meriden and Hartford. Connecticut DOT subsidizes the commuter services. CTTransit accepts Arrow monthly bus passes for service within Downtown Hartford. DATTCO - DATTCO, headquartered in New Britain, provides a variety of bus services in Connecticut. Among the different types of services offered by DATTCO, two bus routes make stops in communities within the study corridor. One service, called the S-Route, operates buses between Madison and New Haven on weekdays. DATTCO’s “Commuter Express” provides bus service between Hartford and Old Saybrook, with stops in Old Saybrook, Essex, Chester, Middletown and Hartford. This route is served with three morning and three evening peak direction trips on weekdays.

Final Report New Haven Hartford Springfield Commuter Rail Implementation Study
________________________________________________________________________ Page 2-22
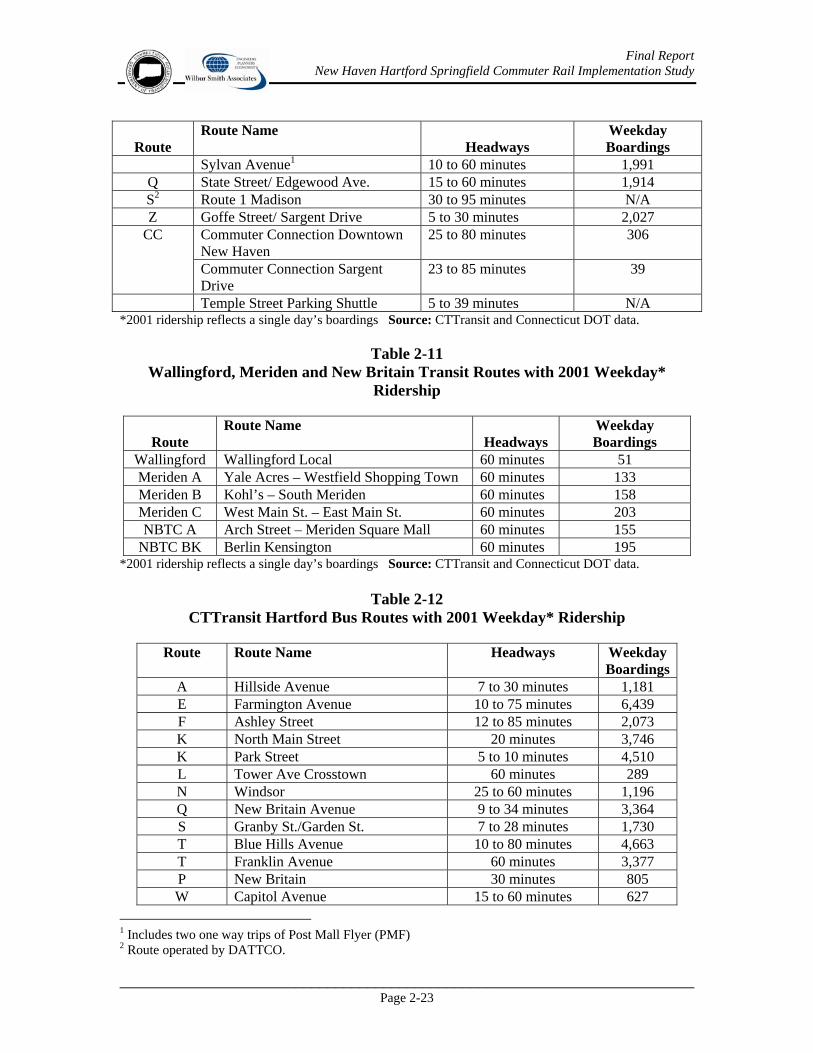
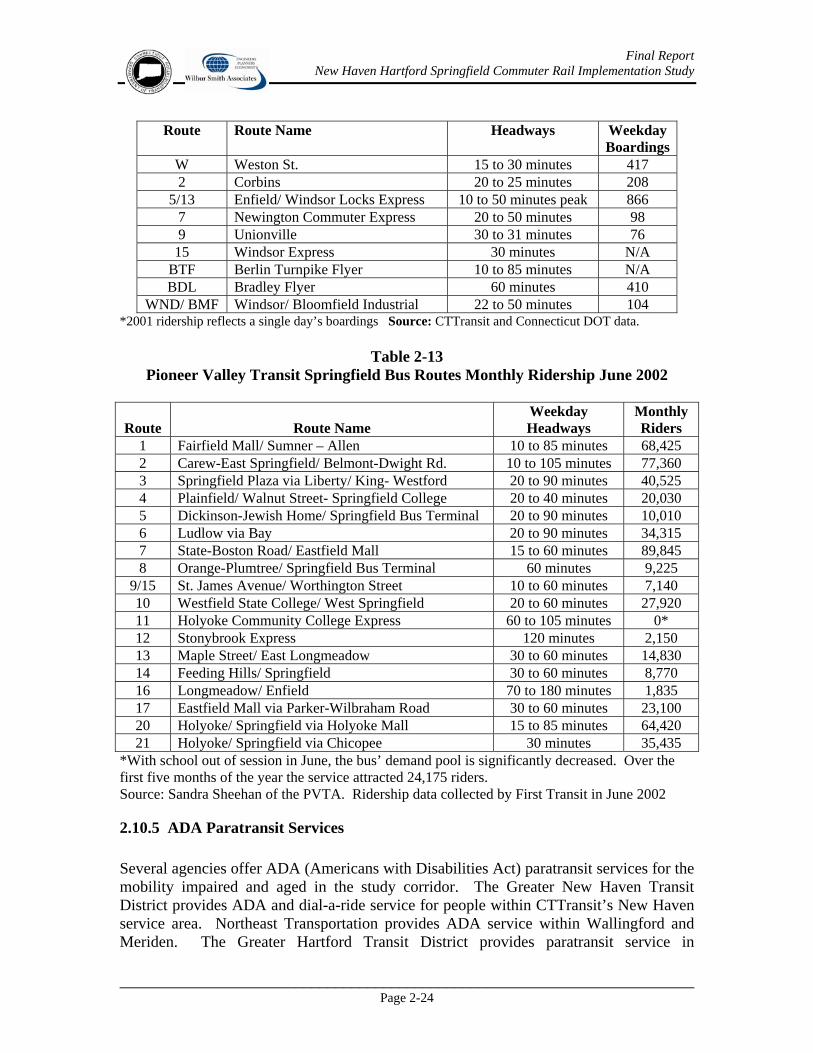
2.10.4 Transit Service and Ridership CTTransit provides local and express bus service in the greater Hartford and New Haven areas. Fifteen routes serve New Haven, with service to the two railroad stations in New Haven and a parking shuttle between New Haven Union Station and the Temple Street garage nearby. The S route serving Madison from downtown New Haven is operated by DATTCO. Hartford is a major hub that is served by a myriad of local and express routes. Several of these routes provide service to the rail corridor. CTTransit serves Wallingford on one intercity route out of New Haven and one local route provided by Northeast Transportation Company (NET). Northeast Transportation (NET) under contract to CTTransit and ConnDOT operates three routes in Meriden, Routes A, B, and C. Meriden’s Amtrak train station is the focal point of the city’s bus network. CTTransit Hartford also provides bus service to Meriden with an express route to Hartford, and the New Britain Transportation Company (NBTC) serves Meriden with one route. Berlin is also served by NBTC on one local route to downtown New Britain. Springfield, Massachusetts is the principal hub for PVTA service. Every bus route in Springfield stops at the intermodal center in Downtown Springfield. The intermodal center allows people to connect to Amtrak service and intercity bus service. Eighteen PVTA routes serve the Springfield area, linking Springfield with Enfield, Connecticut, Longmeadow, East Longmeadow, West Springfield, Agawam, Chicopee, Holyoke and Ludlow, Massachusetts. Table 2-10 to Table 2-13 list the corridor local and express bus routes and daily or monthly ridership.
Table 2-10 CTTransit New Haven Bus Routes with 2001 Weekday* Ridership
Route Route Name
Headways Weekday Boardings
Whalley Avenue 5 to 15 minutes 4,364 B Congress Avenue 5 to 20 minutes 3,083
C North Haven 15 to 60 minutes 1,093 Grand Avenue 10 to 20 minutes 3,491 D Dixwell Avenue 10 to 30 minutes 4,644 West Chapel Street 10 to 30 minutes 2,007 F East Haven 15 to 30 minutes 980
G Shelton Ave/ East Chapel Street 20 to 30 minutes 780 Whitney Avenue 10 to 60 minutes 1,370 J Kimberly Avenue 5 to 35 minutes 2,065
L North Branford 65 minutes 98 M Washington Ave/ State Street 9 to 75 minutes 2,225 O Winchester Avenue 15 to 62 minutes 1,045
Final Report New Haven Hartford Springfield Commuter Rail Implementation Study
________________________________________________________________________ Page 2-23
Route Route Name
Headways Weekday Boardings
Sylvan Avenue1 10 to 60 minutes 1,991 Q State Street/ Edgewood Ave. 15 to 60 minutes 1,914 S2 Route 1 Madison 30 to 95 minutes N/A Z Goffe Street/ Sargent Drive 5 to 30 minutes 2,027
Commuter Connection Downtown New Haven
25 to 80 minutes 306 CC
Commuter Connection Sargent Drive
23 to 85 minutes 39
Temple Street Parking Shuttle 5 to 39 minutes N/A *2001 ridership reflects a single day’s boardings Source: CTTransit and Connecticut DOT data.
Table 2-11 Wallingford, Meriden and New Britain Transit Routes with 2001 Weekday*
Ridership
Route Route Name
Headways Weekday Boardings
Wallingford Wallingford Local 60 minutes 51 Meriden A Yale Acres – Westfield Shopping Town 60 minutes 133 Meriden B Kohl’s – South Meriden 60 minutes 158 Meriden C West Main St. – East Main St. 60 minutes 203 NBTC A Arch Street – Meriden Square Mall 60 minutes 155
NBTC BK Berlin Kensington 60 minutes 195 *2001 ridership reflects a single day’s boardings Source: CTTransit and Connecticut DOT data.
Table 2-12 CTTransit Hartford Bus Routes with 2001 Weekday* Ridership
Route Route Name Headways Weekday
BoardingsA Hillside Avenue 7 to 30 minutes 1,181 E Farmington Avenue 10 to 75 minutes 6,439 F Ashley Street 12 to 85 minutes 2,073 K North Main Street 20 minutes 3,746 K Park Street 5 to 10 minutes 4,510 L Tower Ave Crosstown 60 minutes 289 N Windsor 25 to 60 minutes 1,196 Q New Britain Avenue 9 to 34 minutes 3,364 S Granby St./Garden St. 7 to 28 minutes 1,730 T Blue Hills Avenue 10 to 80 minutes 4,663 T Franklin Avenue 60 minutes 3,377 P New Britain 30 minutes 805 W Capitol Avenue 15 to 60 minutes 627
1 Includes two one way trips of Post Mall Flyer (PMF) 2 Route operated by DATTCO.
Final Report New Haven Hartford Springfield Commuter Rail Implementation Study
________________________________________________________________________ Page 2-24
Route Route Name Headways Weekday Boardings
W Weston St. 15 to 30 minutes 417 2 Corbins 20 to 25 minutes 208
5/13 Enfield/ Windsor Locks Express 10 to 50 minutes peak 866 7 Newington Commuter Express 20 to 50 minutes 98 9 Unionville 30 to 31 minutes 76
15 Windsor Express 30 minutes N/A BTF Berlin Turnpike Flyer 10 to 85 minutes N/A BDL Bradley Flyer 60 minutes 410
WND/ BMF Windsor/ Bloomfield Industrial 22 to 50 minutes 104 *2001 ridership reflects a single day’s boardings Source: CTTransit and Connecticut DOT data.
Table 2-13 Pioneer Valley Transit Springfield Bus Routes Monthly Ridership June 2002
Route
Route Name Weekday Headways
Monthly Riders
1 Fairfield Mall/ Sumner – Allen 10 to 85 minutes 68,425 2 Carew-East Springfield/ Belmont-Dwight Rd. 10 to 105 minutes 77,360 3 Springfield Plaza via Liberty/ King- Westford 20 to 90 minutes 40,525 4 Plainfield/ Walnut Street- Springfield College 20 to 40 minutes 20,030 5 Dickinson-Jewish Home/ Springfield Bus Terminal 20 to 90 minutes 10,010 6 Ludlow via Bay 20 to 90 minutes 34,315 7 State-Boston Road/ Eastfield Mall 15 to 60 minutes 89,845 8 Orange-Plumtree/ Springfield Bus Terminal 60 minutes 9,225
9/15 St. James Avenue/ Worthington Street 10 to 60 minutes 7,140 10 Westfield State College/ West Springfield 20 to 60 minutes 27,920 11 Holyoke Community College Express 60 to 105 minutes 0* 12 Stonybrook Express 120 minutes 2,150 13 Maple Street/ East Longmeadow 30 to 60 minutes 14,830 14 Feeding Hills/ Springfield 30 to 60 minutes 8,770 16 Longmeadow/ Enfield 70 to 180 minutes 1,835 17 Eastfield Mall via Parker-Wilbraham Road 30 to 60 minutes 23,100 20 Holyoke/ Springfield via Holyoke Mall 15 to 85 minutes 64,420 21 Holyoke/ Springfield via Chicopee 30 minutes 35,435
*With school out of session in June, the bus’ demand pool is significantly decreased. Over the first five months of the year the service attracted 24,175 riders. Source: Sandra Sheehan of the PVTA. Ridership data collected by First Transit in June 2002
2.10.5 ADA Paratransit Services Several agencies offer ADA (Americans with Disabilities Act) paratransit services for the mobility impaired and aged in the study corridor. The Greater New Haven Transit District provides ADA and dial-a-ride service for people within CTTransit’s New Haven service area. Northeast Transportation provides ADA service within Wallingford and Meriden. The Greater Hartford Transit District provides paratransit service in

Final Report New Haven Hartford Springfield Commuter Rail Implementation Study
________________________________________________________________________ Page 2-25
CTTransit’s Hartford service area. The PVTA provides paratransit service within greater Springfield. ADA trips can be made to any points within three-quarters of a mile of regular bus service for all four services during normal bus operating hours.
2.10.6 Ridesharing Two rideshare agencies operate in the New Haven - Springfield corridor, including Rideworks in New Haven and the Rideshare Company in Hartford. Massachusetts ridesharing programs are more focused on Boston than on the Springfield area, however some of the Hartford ridesharing options include connections to Springfield.
2.11 Ridership, Revenue and Cost Database The following section is an inventory of how other commuter rail systems perform, and will serve as a baseline for evaluation of service in the study corridor. Data was collected from 15 transit agencies that operate commuter rail service and was assembled, where available, for the years 1999, 2000, and 2001. Data was collected by way of the National Transit Database (NTD), a program sponsored by the Federal Transit Administration (FTA), and by contacting the specific transit agency where necessary. The NTD is a large compilation of data reported by agencies nationwide that operate various modes of transit including commuter rail. More specific information on types of data obtained for purposes of this study is discussed below. The specific information collected from each agency includes the following:
• Total annual passengers – the total number of fare paying passengers boarding a service vehicle in a fiscal year
• Average daily ridership – the average daily number of fare paying passengers boarding commuter rail service vehicles in a fiscal year
• Passenger miles per year – the total distance each fare paying passenger travels on passenger carrying vehicles per fiscal year
• Total annual fare revenue – the total amount of revenue received by a transit agency for a given service each year from fare paying passengers
• Annual revenue train miles – the total number of miles per year each entire commuter train travels with fare paying passengers aboard
• Annual revenue vehicle miles – the total number of miles per year each passenger carrying vehicle in a commuter rail system travels with fare paying passengers aboard
• Annual operating costs – the total amount of money per year required to operate and maintain a transit service

Final Report New Haven Hartford Springfield Commuter Rail Implementation Study
________________________________________________________________________ Page 2-26
2.11.1 Overview of Commuter Rail Systems To compare ridership, service characteristics, and performance for a New Haven-Hartford-Springfield commuter service, information was collected from other agencies that operate commuter rail service. Data was collected from a range of agencies operating a range of commuter rail services from a large network such as Metro North or Long Island Railroad, to smaller systems such as Shore Line East in Connecticut. A summary of the transit agencies surveyed, listed in alphabetical order, is shown in Table 2-14.
Table 2-14
Summary of Commuter Rail Systems Surveyed
Commuter Rail System
Operating Agency Metro Area Served Total Annual
Passengers (2000)
Average Daily
Ridership(2000)
Caltrain Caltrain San Francisco/San Jose, CA
9,821,725 39,290
Long Island Railroad
Metropolitan Transportation Authority
New York/Long Island, NY
105,148,000 355,000
MARC Commuter Rail
Mass Transit Administration, MD Dept. of Transportation
Baltimore,MD /Washington, DC
5,317,006 20,851
MBTA Commuter Rail
Massachusetts Bay Transportation Authority
Boston, MA 36,416,816 129,474
Metra Commuter Rail
Northeast Illinois Commuter Railroad Corporation
Chicago, IL 72,342,624 268,381
Metrolink Southern California Regional Rail Authority
Los Angeles, CA 6,978,588 26,300
Metro North Metropolitan Transportation Authority
New York, NY 71,735,218 249,142
New Jersey Transit New Jersey Transit Corporation
New Jersey 63,894,352 212,037
San Diego Coaster North San Diego County Transit Development Board
San Diego, CA 1,206,839 4,327
SEPTA Southeastern Pennsylvania Transportation Authority
Philadelphia, PA 29,774,426 104,232
Shore Line East Connecticut Dept. of Transportation
New Haven, CT 285,427 1,115
Sounder Commuter Rail
Central Puget Sound Regional Transit Authority
Seattle, WA 100,360 1,120
Trinity Rail Express
Dallas Area Rapid Transit Authority
Dallas/Ft. Worth, TX 667,577 2,369
Tri-Rail Tri-County Commuter Rail Authority
South Florida 2,232,497 7,381
Virginia Rail Express
Virginia Rail Express Washington, DC/Northern VA
2,014,339 8,057
Source: National Transit Database

Final Report New Haven Hartford Springfield Commuter Rail Implementation Study
________________________________________________________________________ Page 2-27
The commuter rail systems inventoried represent a wide range of services from a single rail line, to a network of several lines serving a major metropolitan area. A key statistic that highlights the size of a commuter rail network is ridership. Table 2-14 shows the average daily ridership among commuter rail systems, and this data is shown graphically for selected systems in Figure 2-3.
Figure 2-3 Average Year 2000 Daily Ridership for Selected Commuter Rail Systems
Caltrain
Coaster
LongIsland
Railroad
MARC
MBTA
Metra
Metrolink
MetroNorth
NewJerseyTransit
ShoreLineEast
VA RailExpress
0
50000
100000
150000
200000
250000
300000
350000
400000
Ave
rage
Dai
ly R
ider
ship
Source: National Transit Database As shown in the above figure, the range of daily ridership in systems surveyed varies greatly, from just over 1,000, to over 350,000 passengers per day. The smallest system surveyed was Shore Line East in Connecticut, with a year 2000 average daily ridership of 1,115. The largest system surveyed was Long Island Railroad in New York, with a year 2000 average daily ridership of 355,000. In addition to daily passenger data, annual ridership numbers were obtained. Figure 2-4 shows annual ridership trends for several commuter rail systems from 1999 to 2001. The reason that results are displayed separately for smaller and larger commuter rail systems is for clarity of scale in the chart, and to illustrate smaller trends.

Final Report New Haven Hartford Springfield Commuter Rail Implementation Study
________________________________________________________________________ Page 2-28
Figure 2-4 Annual Ridership per Year
Smaller Rail Systems
-
500,000
1,000,000
1,500,000
2,000,000
2,500,000
3,000,000
1999 2000 2001
Year
Tota
l Ann
ual P
asse
nger
s
Shore Line East Trinity Rail Express Virginia Rail Express Larger Rail Systems
-
20,000,000
40,000,000
60,000,000
80,000,000
100,000,000
120,000,000
1999 2000 2001
Year
Tota
l Ann
ual P
asse
nger
s
NJ Transit Metro North Long Island Railroad Metra Source: National Transit Database As shown above, all of the commuter rail systems had an overall increase in ridership from 1999 to 2001. Between 2000 and 2001, Metra and Long Island Railroad showed a slight decrease. Some systems such as Virginia Rail Express and Trinity Rail Express have shown a fairly substantial rise in ridership from 1999 to 2001. Other systems such as Shore Line East and New Jersey Transit have experienced a more modest increase over the same period.

Final Report New Haven Hartford Springfield Commuter Rail Implementation Study
________________________________________________________________________ Page 2-29
2.11.2 Performance Measures The ridership, revenue, and cost data assembled from the various transit agencies can be evaluated in a manner such that the relationship between cost and revenue shows certain performance measures. These measures include; revenue per passenger mile, operating cost per passenger mile, operating cost per train mile, farebox recovery ratio, and productivity ratio. Revenue per passenger mile is determined by the ratio of total fare revenue per year to total passenger miles per year. An average figure for this performance measure is approximately 12 cents per mile. Operating costs per train mile and per passenger mile are determined by similar ratios. Average costs are approximately $45 per mile and 30 cents per mile respectively. The farebox recovery ratio is given by the ratio of total fare revenue to total operating costs. It is a measurement of how much of a passenger fare goes toward the costs associated with operating a transit system. This ratio is usually found to be between 20% and 40%. Finally, an overall productivity ratio measures annual passenger miles against annual vehicle miles. The result of this productivity ratio yields an average of the number of passengers per vehicle. A summary of performance measures for the commuter rail systems surveyed is found in Table 2-15. As shown in the table, the amount of revenue a commuter rail service can expect per mile from each pare paying passenger can vary from $0.08 on the Tri-Rail system for the 1999 fiscal year to as much as $0.91 for Trinity Rail Express for the same year. On some of the larger systems such as Metro North and Long Island Railroad, revenue per passenger mile was anywhere from $0.15 to $0.17. For the Shore Line East service revenue per passenger mile was $0.13 in the fiscal year 1999, and rose to $0.16 in 2001. The cost of operating commuter rail service per train mile was also found to have a wide range. SEPTA was found to have the lowest cost per train mile at $30.52 in the fiscal year 2001. For the same year, Long Island Railroad cost $103.95 per train mile to operate service. The cost per train mile in 2001 on Shore Line East was $37.94. Cost per passenger mile is an effective way of looking at the relationship between ridership and the cost to operate a commuter rail service. This value was found to be as low as $0.23 in 2001 on the MBTA system, to as high as $1.14 on Shore Line East for the same year. Those same values for Metro North and Long Island Railroad were $0.26 and $0.36 per passenger mile respectively. The farebox recovery ratio was found to have a fairly large variation from one rail system to another. The value was as low as 13% for Shore Line East to as high as 61% for Metro North in 2000. The overall trend shows that the larger commuter rail networks had a higher farebox recovery ratio, meaning that their fares went further toward operating costs. The productivity ratio also showed a significant variance among commuter rail systems. Shore Line East, for example, had a productivity ratio of just over 16 passengers per

Final Report New Haven Hartford Springfield Commuter Rail Implementation Study
________________________________________________________________________ Page 2-30
vehicle in 2000. In the same year, Caltrain had a productivity ratio of over 42 passengers per vehicle.
Table 2-15 Year 2000 Annual Operating Costs for Selected Commuter Rail Systems
Rail System Year Revenue per
Passenger Mile Operating Cost per
Train Mile
Operating Cost per Passenger
Mile
Farebox Recovery
Ratio
Productivity
1999 $0.13 $42.82 $0.25 51% 24.89 2000 $0.13 $44.95 $0.23 58% 48.27
Caltrain
2001 $0.14 $48.62 $0.26 54% 45.41 1999 $0.16 $92.70 $0.32 51% 37.66 2000 $0.15 $95.00 $0.29 51% 41.95
Long Island Railroad
2001 $0.17 $103.95 $0.36 47% 37.05 1999 $0.11 $48.51 $0.29 39% 33.32 2000 $0.12 $48.63 $0.27 44% 35.29
MARC
2001 $0.12 $54.67 $0.28 42% 39.48 1999 $0.10 $46.65 $0.24 41% 32.62 2000 $0.10 $47.86 $0.25 40% 32.75
MBTA
2001 $0.11 $47.53 $0.23 49% 35.72 1999 $0.12 $59.57 $0.25 49% 43.79 2000 $0.12 $62.67 $0.25 48% 43.95
Metra
2001 $0.12 $64.98 $0.26 46% 42.70 1999 $0.12 $45.84 $0.30 39% 37.75 2000 $0.12 $47.19 $0.32 39% 39.54
Metrolink
2001 $0.13 $40.41 $0.27 48% 40.53 1999 $0.17 $79.75 $0.30 57% 39.23 2000 $0.16 $76.37 $0.27 61% 41.57
Metro North
2001 $0.16 $79.28 $0.26 59% 44.22 1999 $0.18 $51.32 $0.31 57% 27.75 2000 $0.18 $52.48 $0.31 57% 29.62
New Jersey Transit
2001 $0.18 $53.42 $0.31 56% 29.94 1999 $0.08 $72.37 $0.44 19% 32.34 2000 $0.09 $54.18 $0.33 28% 31.97
San Diego Coaster
2001 $0.11 $56.90 $0.35 30% 31.62 1999 $0.18 $29.29 $0.36 40% 28.56 2000 $0.19 $30.25 $0.38 41% 28.43
SEPTA
2001 $0.21 $30.52 $0.42 41% 25.77 1999 $0.13 $35.60 $0.99 14% 12.59 2000 $0.14 $46.03 $1.03 13% 16.17
Shore Line East
2001 $0.16 $37.94 $1.14 14% 11.85 1999 $0.91 $49.76 $1.20 76% 20.71 2000 $0.83 $59.57 $1.41 59% 20.37
Trinity Rail Express
2001 $0.47 $42.80 $1.00 47% 21.19 1999 $0.08 $31.30 $0.29 27% 35.94 2000 $0.08 $33.92 $0.31 25% 36.88
Tri-Rail
2001 $0.08 $36.14 $0.29 27% 38.26 1999 $0.16 $66.94 $0.34 46% 40.50 2000 $0.13 $57.93 $0.28 47% 43.76
Virginia Rail Express
2001 $0.14 $59.28 $0.29 49% 43.43