chapter - 3shodhganga.inflibnet.ac.in/bitstream/10603/7062/8/08... · · 2015-12-0465 chapter -...
TRANSCRIPT
65
CHAPTER - III
METHOD AND PROCEDURE
In the preceding chapter, the problem, its statement, related literature
and hypotheses of the study were discussed. This ongoing chapter treats the
method and procedure employed in this study. It includes hypotheses and design
of the study, sampling techniques, description of tools, data collection procedure,
scoring and statistical techniques used for the analysis of the data.
3.1 DESIGN
For carrying out any kind of research, it is important to chalk out a design.
According to Best (2008), ‘All researches involve elements of observation,
description and the analysis of what happens under certain circumstances’. A
systematic procedure is a must to collect the necessary data, which helps to attain
the objectives and to test the hypotheses formulated for the study.
The present study is essentially a descriptive survey coupled with causal-
comparative method and the techniques of bi-variate and multi-variate
correlations.
It is descriptive because it aims to describe the nature and present status of
the phenomenon with the intent of employing data to justify current conditions
and practices or to make more intelligent plans for improving them. According to
Best (2008), ‘A descriptive study describes and interprets what is, describing,
recording, analyzing and interpreting conditions that exist. It involves some kind
of comparison or contrast and attempts to discover relationship between existing
non-manipulated variables. It is concerned with opinions that are held, processes
that are going on, effects that are evident or trends that are developing. It is
primarily concerned with present, although it often considers past events and
influences as they relate to current conditions. It also deals with testing of
hypotheses and elements of generalization’.

66
3.1.1 Dimensions of the Design
In the present study, the independent variables are general mental ability,
anxiety, emotional maturity and social maturity. Academic Achievement is
dependent variable. So, the present study has been carried out in accordance with
the requirements of the descriptive design.
3.2 HYPOTHESES OF THE STUDY
Following hypotheses were framed for the purpose of present study:
1. There exists no significant relationship between academic achievement
and general mental ability of high school students.
2. There exists no significant relationship between academic achievement
and anxiety of high school students.
3. There exists no significant relationship between academic achievement
and emotional maturity of high school students.
4. There exists no significant relationship between academic achievement
and social maturity of high school students.
5. There exists no significant relationship among general mental ability,
anxiety, emotional maturity and social maturity of high school students.
6. There is no difference between rural and urban, boys and girls in relation
to following variables:
(a) General mental ability
(b) Anxiety
(c) Emotional and Social maturity
(d) Academic achievement
7. No Significant differences exist among actualizers, par-actualizers and
non-actualizers on the basis of their anxiety, emotional maturity and
social maturity.
3.3 SAMPLE AND SAMPLING PROCEDURE
It is not possible to collect data from all the members of a population and

67
the investigator resorted to sampling technique. Sampling implies any portion of
a population or universe taken as representative of that population or universe.
In the present study too, the population was very large and scattered over
all the high schools of 17 districts of Punjab. The investigator, therefore, has
employed the multistage random sampling technique in order to select a
representative sample of the entire state of Punjab. Out of the total 17 districts of
Punjab, four districts i.e. Amritsar, Kapurthala, Bathinda and Patiala has been
randomly selected for investigation. Again from each of the four selected
districts, one public senior secondary school affiliated to C.B.S.E., New Delhi
was selected randomly and another Jawahar Navodiya Vidhalaya affiliated to the
same board from the same district was selected. As there was only one Jawahar
Navodiya Vidhalaya in every district of Punjab, so the investigator was not
having any other option. Thus from each district two schools were taken up i.e.
one urban and one rural.
Only class X students studying during the academic year 2005-06 in the
selected schools have been made subjects for the present research project. For
selection of these students from each Jawahar Navodiya Vidhalaya, the
investigator noticed the total strength of boys and girls. They were in the ratio of
3:1 i.e. 75 boys and 25 girls. Thus investigator selected all the girls from each
Jawahar Navodiya Vidhalaya and out of 75 boys, 25 were selected randomly.
This procedure was adopted for selection of students from Jawahar Navodiya
Vidhalayas situated in rural areas of four randomly selected districts of Punjab.
A different procedure was adopted in the selection of students from urban
schools. In four randomly selected co-educational urban schools of each district,
there were minimum 3 and maximum 5 sections of class X. From each section
equal number of boys and girls were selected randomly in respect of the students
included in the sample.
68
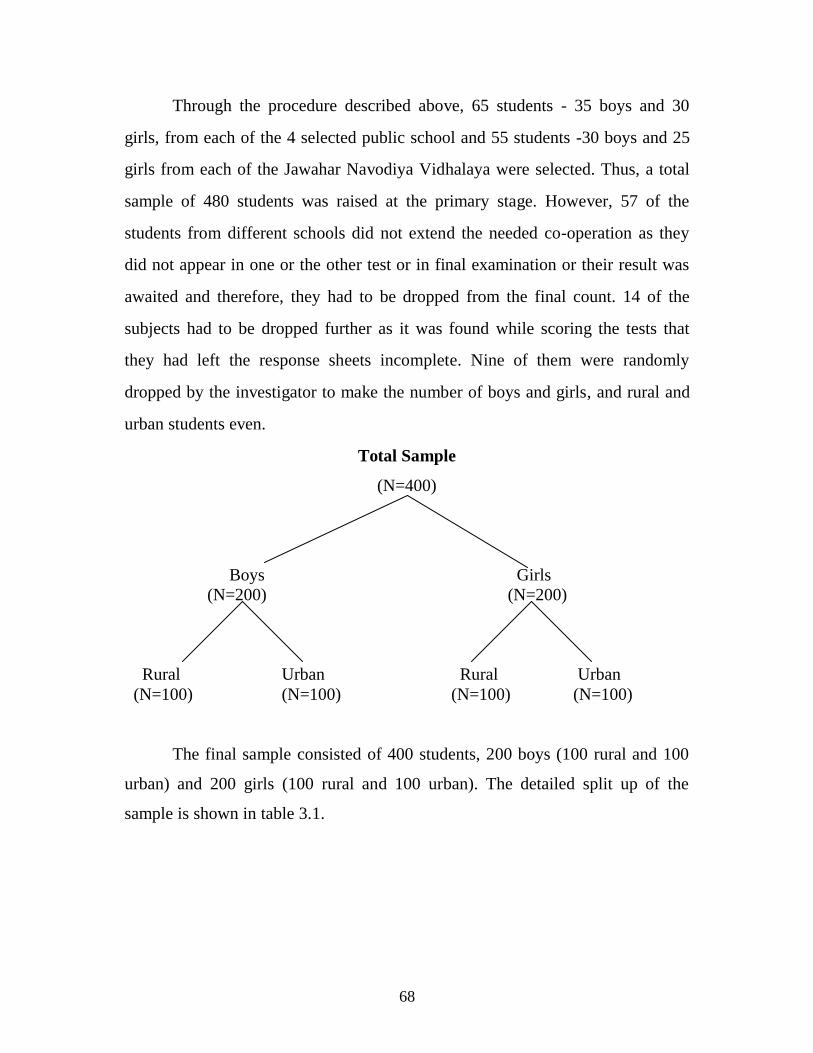
Through the procedure described above, 65 students - 35 boys and 30
girls, from each of the 4 selected public school and 55 students -30 boys and 25
girls from each of the Jawahar Navodiya Vidhalaya were selected. Thus, a total
sample of 480 students was raised at the primary stage. However, 57 of the
students from different schools did not extend the needed co-operation as they
did not appear in one or the other test or in final examination or their result was
awaited and therefore, they had to be dropped from the final count. 14 of the
subjects had to be dropped further as it was found while scoring the tests that
they had left the response sheets incomplete. Nine of them were randomly
dropped by the investigator to make the number of boys and girls, and rural and
urban students even.
Total Sample
(N=400)
Boys Girls
(N=200) (N=200)
Rural Urban Rural Urban
(N=100) (N=100) (N=100) (N=100)
The final sample consisted of 400 students, 200 boys (100 rural and 100
urban) and 200 girls (100 rural and 100 urban). The detailed split up of the
sample is shown in table 3.1.
69
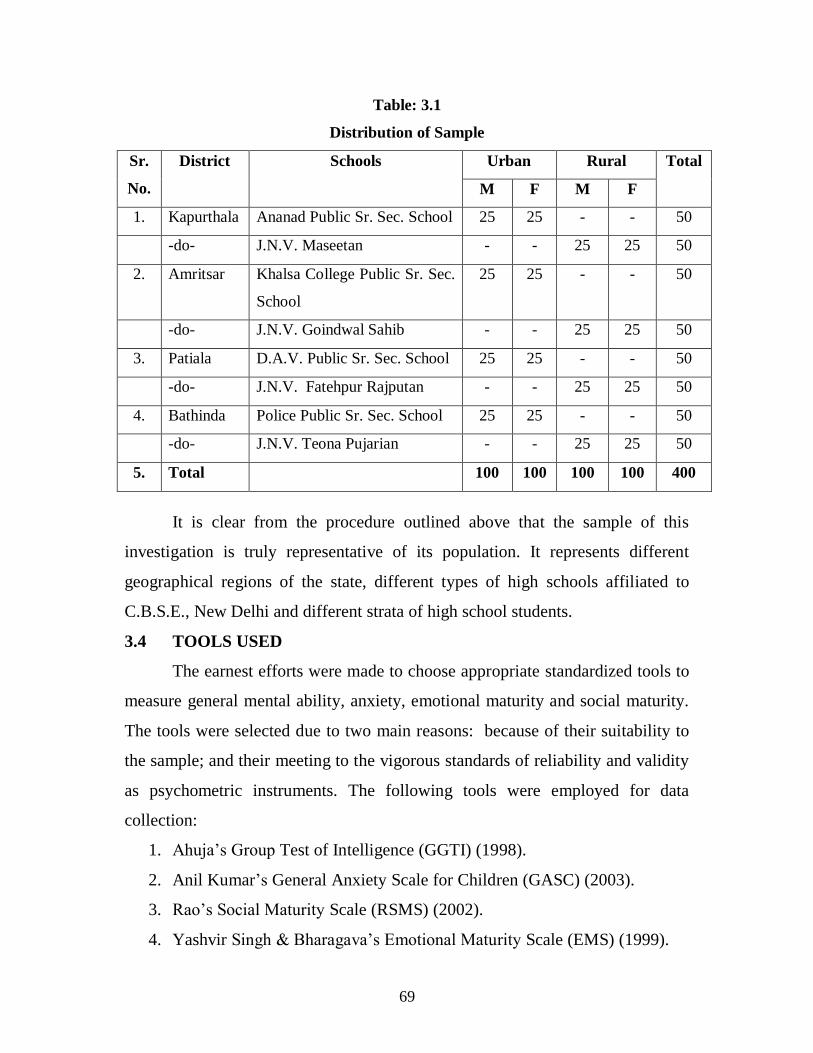
Table: 3.1
Distribution of Sample
Sr.
No.
District Schools Urban Rural Total
M F M F
1. Kapurthala Ananad Public Sr. Sec. School 25 25 - - 50
-do- J.N.V. Maseetan - - 25 25 50
2. Amritsar Khalsa College Public Sr. Sec.
School
25 25 - - 50
-do- J.N.V. Goindwal Sahib - - 25 25 50
3. Patiala D.A.V. Public Sr. Sec. School 25 25 - - 50
-do- J.N.V. Fatehpur Rajputan - - 25 25 50
4. Bathinda Police Public Sr. Sec. School 25 25 - - 50
-do- J.N.V. Teona Pujarian - - 25 25 50
5. Total 100 100 100 100 400
It is clear from the procedure outlined above that the sample of this
investigation is truly representative of its population. It represents different
geographical regions of the state, different types of high schools affiliated to
C.B.S.E., New Delhi and different strata of high school students.
3.4 TOOLS USED
The earnest efforts were made to choose appropriate standardized tools to
measure general mental ability, anxiety, emotional maturity and social maturity.
The tools were selected due to two main reasons: because of their suitability to
the sample; and their meeting to the vigorous standards of reliability and validity
as psychometric instruments. The following tools were employed for data
collection:
1. Ahuja’s Group Test of Intelligence (GGTI) (1998).
2. Anil Kumar’s General Anxiety Scale for Children (GASC) (2003).
3. Rao’s Social Maturity Scale (RSMS) (2002).
4. Yashvir Singh & Bharagava’s Emotional Maturity Scale (EMS) (1999).

70
3.4.1 Ahuja’s Group Test of Intelligence (GGTI) (1998)
The test is meant for measuring the intelligence of pupils studying in
class-group VIII to XI in English Medium Schools. The group test of intelligence
is prepared by Dr. G.C. Ahuja. The test booklet contains eight sub-tests. Test 1 is
an additional sub-test which is meant for practice only. The remaining seven sub-
tests from II to VIII are the tests proper. For each sub-test, one page is devoted to
instructions and practice examples. It serves the purpose of building morale with
the subjects. It enables them to develop confidence and hence, they get adjusted
with the nature of work. The performance of this additional test is not to be taken
into account. This fact (that performance on the first test is immaterial) is not to
be revealed to the pupils. While administering the tests, the value of this
additional test is not to be under–estimated.
Table 3.2
Number of Items and Time-Limits for each Sub-Test
Sub-Test Number of
Items
Time-limit Remarks (If
any)
1. Following Directions 9 4 Minutes Additional Test
2. Classification 20 4 Minutes
3. Analogies 20 4 Minutes
4. Arithmetic Reasoning 6 4 Minutes
5. Vocabulary 40 4 Minutes
6. Comprehension 8 4 Minutes
7. Series 12 4 Minutes
8. Best Answers 20 4 Minutes
Total 126 28 Minutes (Excluding Test 1)

71
The test booklets and answer sheets should be counted in advance. After
the test is over, the test booklets and answer sheets, both used and unused should
again be counted to see that all have been collected.
Directions for taking the test are printed on the test-booklet. They are to
be read silently by the pupils while the examiner reads them aloud.
The test may be administered in regular classroom. Students being tested
should be seated apart. The space provided to them should be so large that
booklets and answer sheets can be used without any inconvenience.
It is advisable for pupils to take the test with pencils. Some extra pencils
should be kept in hand and supplied to the demanding examinee. The time limit
for each sub-test should be strictly adhered to. For this, a stop watch should be
used.
Before the start of the test, the students should be allowed to meet their
physical needs.
Classification of the Deviation Intelligence Quotients (DIQs)
The suggested classification on Revised Standford-Binet Intelligent
Quotients (IQs) has been followed for the present test. Table 3.3 presents the
process of classifying the Deviation Intelligence Quotients (DIQs) into different
categories. Along with it, the standing of the entire sample of 10,132 as per
different categories has also been indicated.

72
Table 3.3
Classification of DIQs
DIQs N Percent Classification
140 and above 36 0.36 Very Superior
120-139 1150 11.35 Superior
110-119 1676 16.54 High Average
90-109 4587 45.27 Normal or Average
80-89 1532 15.12 Low Average
70-79 865 8.54 Borderline Defective
Below 70 286 2.82 Mentally Defective
Total 10132 100.00
Reliability of the Test
Reliability means the extent to which a test is consistent and stable in
what it measures and gives dependable and steady results. Reliability has been
studied by two methods; one which concerns the stability of the measure in terms
of time, and the other involves the internal consistency of the test.
(a) The Test-Retest Method: The retesting was undertaken after an interval
of six months on a sample of 599 pupils (309 boys and 290 girls). The sample
was drawn from four randomly selected English Medium Secondary Schools and
the reliability coefficient by this method was found to be .84+.021 which
represents a high correlation.
(b) The Split-Half Method: To apply this method, a sample of 518 pupils
(303 boys and 215 girls) was taken from four randomly selected English Medium
Secondary Schools. The scores of all these subjects were split into two parts, one
containing odd and the other even items and the coefficient of correlation was
found to be .95+.004. To obtain the reliability coefficient of the whole test,
Spearman-Brown Prophecy Formula was applied and the coefficient of
correlation was found to be .974+.003 which is a very high correlation and
hence, a very dependable relationship.

73
Validity of the Test
Validity concerns the degree to which a test measures what it claims to
measure. The item validity has already been reported. The practical or empirical
validity of the test was studied by the following methods:
(1) Scholastic Marks: To apply this method, first terminal examination marks for
244 pupils (133 boys and 111 girls) were obtained from two English Medium
Secondary Schools. The percentage of total marks obtained in all the subjects
was correlated with the total score obtained on the present test. The coefficient of
correlation was found to be .57+.043. The coefficients of correlation for
individual school subjects were computed. These are as follows:
English .31 (N = 244)
Mathematics .52 (N = 244)
General Science .49 (N = 244)
Social Studies .59 (N = 244)
Hindi .48 (N = 244)
Second Language .20 (N = 244)
(French, Latin, Sanskrit and Persian)
Marathi .35 (N = 189)
Drawing .24 (N = 80)
Needle Work .15 (N = 49)
The annual examination results of the Secondary School Examination
Board, Maharashtra State, Poona, for 90 students (59 boys and 31 girls) studying
in class XI were obtained from two randomly selected English Medium Schools.
The coefficient of correlation was found to be .53+.075.
74
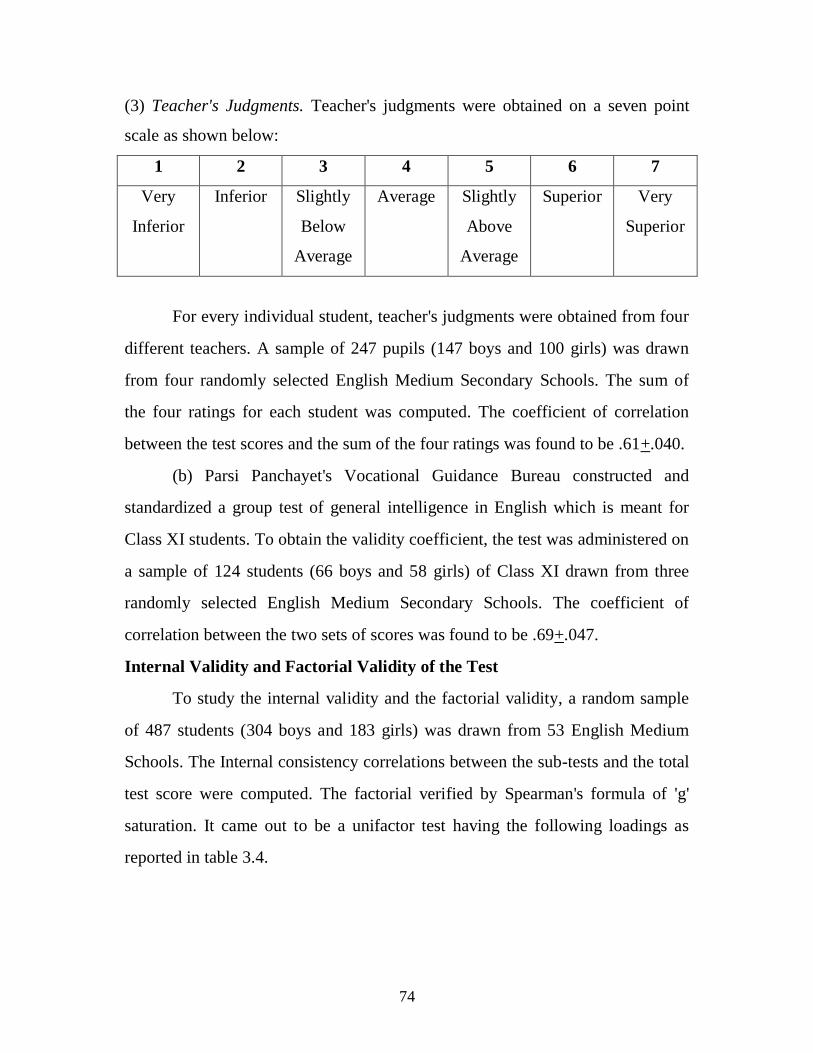
(3) Teacher's Judgments. Teacher's judgments were obtained on a seven point
scale as shown below:
1 2 3 4 5 6 7
Very
Inferior
Inferior Slightly
Below
Average
Average Slightly
Above
Average
Superior Very
Superior
For every individual student, teacher's judgments were obtained from four
different teachers. A sample of 247 pupils (147 boys and 100 girls) was drawn
from four randomly selected English Medium Secondary Schools. The sum of
the four ratings for each student was computed. The coefficient of correlation
between the test scores and the sum of the four ratings was found to be .61+.040.
(b) Parsi Panchayet's Vocational Guidance Bureau constructed and
standardized a group test of general intelligence in English which is meant for
Class XI students. To obtain the validity coefficient, the test was administered on
a sample of 124 students (66 boys and 58 girls) of Class XI drawn from three
randomly selected English Medium Secondary Schools. The coefficient of
correlation between the two sets of scores was found to be .69+.047.
Internal Validity and Factorial Validity of the Test
To study the internal validity and the factorial validity, a random sample
of 487 students (304 boys and 183 girls) was drawn from 53 English Medium
Schools. The Internal consistency correlations between the sub-tests and the total
test score were computed. The factorial verified by Spearman's formula of 'g'
saturation. It came out to be a unifactor test having the following loadings as
reported in table 3.4.

75
Table 3.4
Internal Validity and Factorial Validity
Sub-Test Internal
Consistency
'r' with the
Total Test
Score
First common
factor
Thurstone's
Centroid
Method
'g'
saturations
Spearman's
Formula
Rank
order
of the
Sub-
tests
II Classification .807 .774 .777 3
III Analogies .791 .761 .751 4
IV Arithmetic
Reasoning .601 .656 .646 6
V Vocabulary .904 .830 .828 1
VI Comprehension .712 .732 .727 5
VII Series .550 .545 508 7
VIII Best Answers .839 .816 804 2
The reliability and validity of the test was studied from different
standpoints. The results were obtained by using different methods and they were
confirmed by each other. The degrees of reliability (>.84) and validity
coefficients (>.57) were found to be fairly high. Hence, it is concluded that the
present test is reliable and valid.
3.4.2 Anil Kumar’s General Anxiety Scale for Children (GASC) (2003)
General Anxiety Scale for Children (GASC) (2003) is a widely used and
standardized scale developed by Dr. Anil Kumar and his associates for their
project on 'Anxiety in School Children'. As there is no standardized general
anxiety scale for children in Indian context, the General Anxiety Scale for
children has been adapted for use in Indian culture and conditions. The scale is
helpful to locate the anxiety level of children up to an age of 17 or 18 years. The
scale also categorizes the anxiety level of children into five categories viz., very
low, low, average, high and very high, for the purpose of diagnosing and
removing their problems.

76
The Scale
The scale has been adapted in Hindi language. It has total 45 items related
to varied life situations. These items contain an element of anticipation of
dangerous and painful consequences. The various situations, with which the
items are generally related, are as follows:
(a) Health, physical appearance and injury.
(b) Success or failure in his work.
(c) Afraid from animals and strange things.
(d) Social relations and social approvals.
(e) Worries regarding family members and other relatives.
(f) Worries regarding the future happenings.
(g) Afraid in loneliness.
While adapting the scale items, care was taken to employ simple Hindi words of
general use with children.
Reliability
Coefficient of reliability for this scale was determined by two methods
viz., Split-Half Method and Kudur-Richardson formula 20. The table 3.5 gives
the coefficients of reliability determined by the two methods:
Table 3.5
Reliability Coefficients of the General Anxiety Scale
Sr. No. Method of Reliability Reliability Coefficient
1. Split-Half Method 0.79
2. K-R Formula-20 Method 0.81
The high index of reliability i.e. .90 provides evidence of a high degree of
internal consistency of GASC. The low value of standard error of measurement,
(SEm =2.7538) further confirms that the scale is quite reliable for use on Indian
children.
77
Validity
The scale was validated against the outside criterion of teachers' rating
using five point rating scale (very often, fairly often, sometimes, occasionally
and almost never). The correlations between the teacher's ratings and anxiety
scores on GASC for boys and girls were found to be significant at 0.01 level.
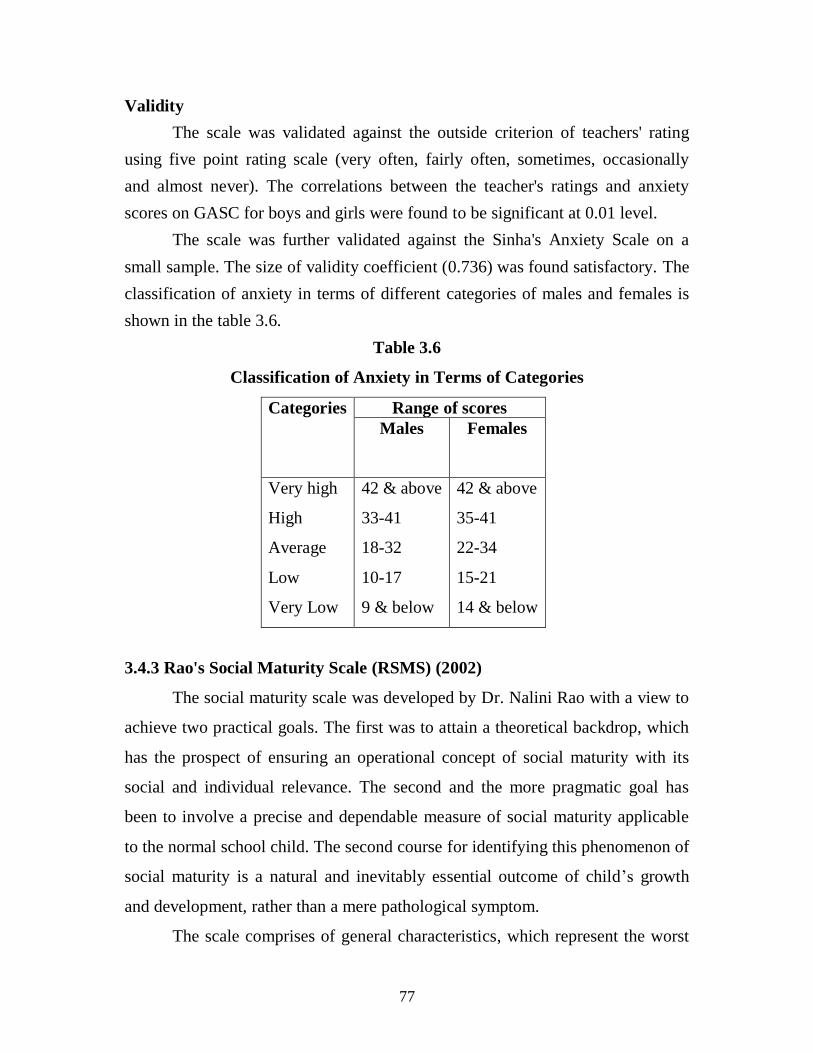
The scale was further validated against the Sinha's Anxiety Scale on a
small sample. The size of validity coefficient (0.736) was found satisfactory. The
classification of anxiety in terms of different categories of males and females is
shown in the table 3.6.
Table 3.6
Classification of Anxiety in Terms of Categories
Categories Range of scores
Males Females
Very high
High
Average
Low
Very Low
42 & above
33-41
18-32
10-17
9 & below
42 & above
35-41
22-34
15-21
14 & below
3.4.3 Rao's Social Maturity Scale (RSMS) (2002)
The social maturity scale was developed by Dr. Nalini Rao with a view to
achieve two practical goals. The first was to attain a theoretical backdrop, which
has the prospect of ensuring an operational concept of social maturity with its
social and individual relevance. The second and the more pragmatic goal has
been to involve a precise and dependable measure of social maturity applicable
to the normal school child. The second course for identifying this phenomenon of
social maturity is a natural and inevitably essential outcome of child’s growth
and development, rather than a mere pathological symptom.
The scale comprises of general characteristics, which represent the worst
78
common types of demands made by all societies on the individuals and at the
same time specific categories, which are culture specific attributes of individuals
that enable them to meet these demands. The three dimensions of social maturity
and its components are:
I. PERSONAL ADEQUACY
a) Work Orientation: Work orientation manifests in the perception of work
related skills and development of proper attitudes towards work in terms
of knowledge of standards of competence in performing tasks, capacity
for experiencing pleasure in work leading to self-sufficiency.
b) Self Direction: Self direction manifests in one's own capacity to act
independently and exercise control over one's actions. This also involves
the initiative an individual takes in directing himself and his actions with a
feeling of security and full faith in one's efforts.
c) Ability to take Stress: An ability to exhibit appropriate emotional
stability and react without embarrassing either himself or the group he is
in. It also involves ability to undertake difficult and challenging tasks with
assurance.
II. INTERPERSONAL ADEQUACY
d) Communication involves an ability to understand, write, communicate
and make clear meaningful speech and gestures. The ability also involves
empathy, which sensitizes the individual to the affective domain and
demands effective communication.
e) Enlightened Trust includes a general belief that it is acceptable to rely or
depend on others when need arises. It involves clear functioning of
enlightened decision about whom, when and how much to trust.
f) Cooperation is an altruistic tendency to join others in their efforts in
order to reach a mutually desirable goal. It involves ability to regard rules
79
and practices more as a reciprocal social agreement than a rigid,
unchangeable law.
III SOCIAL ADEQUACY
g) Social Commitment involves a feeling of oneness with others,
willingness to modify or relinquish personal goals in the interest of
societal goals and also a readiness to invest in long term social goals.
h) Social Tolerance involves a person's willingness to interact with
individuals and groups who differ from him. Sensitivity to the right of
individuals and groups who differ from him, thus accepting the difference
as a means of building out-group loyalties.
i) Openness to Change involves willingness to accept changes in the social
setting and adapt oneself to the demands of these changes.
Reliability
The final form of the 90 items Social Maturity Scale was administered
twice on a sample of one hundred and eighty students over an interval of four to
five weeks. The sample comprised of 198 secondary school subjects from VIII,
IX and X grades.
The means of the scores obtained on the two administrations did not differ
significantly. The scores of all sub-scales of the first administration were
correlated with the scores of all the sub-scale of second administration. The
coefficients of correlation are given in table 3.7.

80
Table 3.7
Coefficients of Correlation Between First and Second Administration of all
Sub-scales of Social Maturity Scale
Sr. No. Sub-Scales r**
1. Work Orientation .91
2. Self Direction .89
3. Ability to take Stress .88
Personal Adequacy .89
4. Communication .78
5. Enlightened Trust .63
6. Cooperation .89
Inter-Personal Adequacy .73
7. Social Commitment .82
8. Social Tolerance .83
9. Openness to change .74
Social Adequacy .75
Total Scores on Social Maturity .79
** All the coefficients of correlation are significant at 0.01 level.
It was found that a tool in the regional language would be more useful
especially when the subjects who answer it are young and more conversant with
the regional language. Simultaneously, the Hindi version of the tool was also
evolved with a view to facilitate the large-scale use over national samples. The
Kannada and the Hindi translations of the tool were administered on samples of
128 students whose medium of instruction was Kannada and 118 students whose
medium of instruction was Hindi. These students responded to the English
version after an interval of 3 to 4 weeks. The correlation coefficient obtained
between the scores on Kannada and English versions was .98 and the correlation
coefficient obtained between the scores on Hindi and English versions was.98.
81
Validity
The most suitable external criterion for validating the Social maturity
Scale was found to be the teacher ratings on the attributes of Social Maturity. In
view of the fact that the teacher has close acquaintance with the children in
schools and that they have more opportunity to observe the students' behaviour
repeatedly and under various conditions across a variety of situations, it makes a
potentially good source of information for validating the Social Maturity
characteristics of students.
A sample of two hundred and eighty-eight students from grades VIII, IX
and X randomly chosen from sixteen schools of Bangalore City, were
administered the Social Maturity Scale. The subjects were equally distributed
over the grades and sexes, and were from schools run by different managements
and from co-education and single sex schools.
The scale seems to be more sensitive to the presence of a trait than to its
absence or lack of it. This is evidenced from the significantly higher mean values
of the group rated mature and the absence of the mean difference between the
groups rated moderately mature and immature. On the basis of the above
observations and findings, the validity of the tool is acceptable.
3.4.4 Yashvir Singh & Bhargava's Emotional Maturity Scale (EMS) (1999)
Emotional maturity scale prepared by Dr. Yashvir Singh and Dr. Mahesh
Bhargava (1999) was used to measure emotional maturity. Emotional maturity
scale deals with interplay of forces with intensities and quantities in terms of
different aspects:
(a) Emotional unstability
(b) Emotional regression
(c) Social maladjustment
(d) Personality disintegration
(e) Lack of independence

82
(a) Emotional Unstability
This is a broad factor representing syndrome of lack of capacity to dispose
off problems, irritability, needs, constant help for one's day to day work,
venerability and temper tantrums. This group has a high correlation (0.75) with
the total score obtained on the scale. Emotional unstability is an independent
factor of emotional immaturity.
(b) Emotional Regression
Emotional regression is also a broad group of factors representing such
syndromes as feeling of inferiority, restlessness, aggressiveness and self-
centeredness. This has emerged as the broadest factor in the scale as revealed by
the factor analysis. It has a high correlation with the total score on all the five
factors of the scale.
(c) Social Maladjustment
Such a person shows lack of social adaptability should hatred, seclusive
but boasting, liar and shirker.
(d) Personality Disintegration
It includes all those symptoms which represent disintegration of
personality like reaction, phobias formation, rationalization, pessimism,
immorality etc. Such a person suffers from inferiority and hence reacts to
environment through aggressiveness, destruction and has a distorted sense of
reality. In brief, such a person shows varied degrees of neuroticism, which could
put as below:
Ad R T
F P E
Where
Vs = Specific emotional vulnerability
Ss= External stresses specially in relation to emotional vulnerability
Ad = Difficulty of adjustment internal and external
F = Flexibility R = Regressive forces
E = Ego strength N = Degree of neuroticism
P = Progressive forces.
VSxSS x
83
(e) Lack of independence
Such a person shows parasitic dependence on others, is egoistic and lacks
'objective interests'. People think of him as an unreliable person.
Reliability of the Scale
The test-retest reliability of the scale was measured by administering it
upon a group of collegiate students (N=150) including male and female students
aged 20-24 years. The time interval between the two testing was of six months.
The product moment 'r' between the two testing was 0.75.
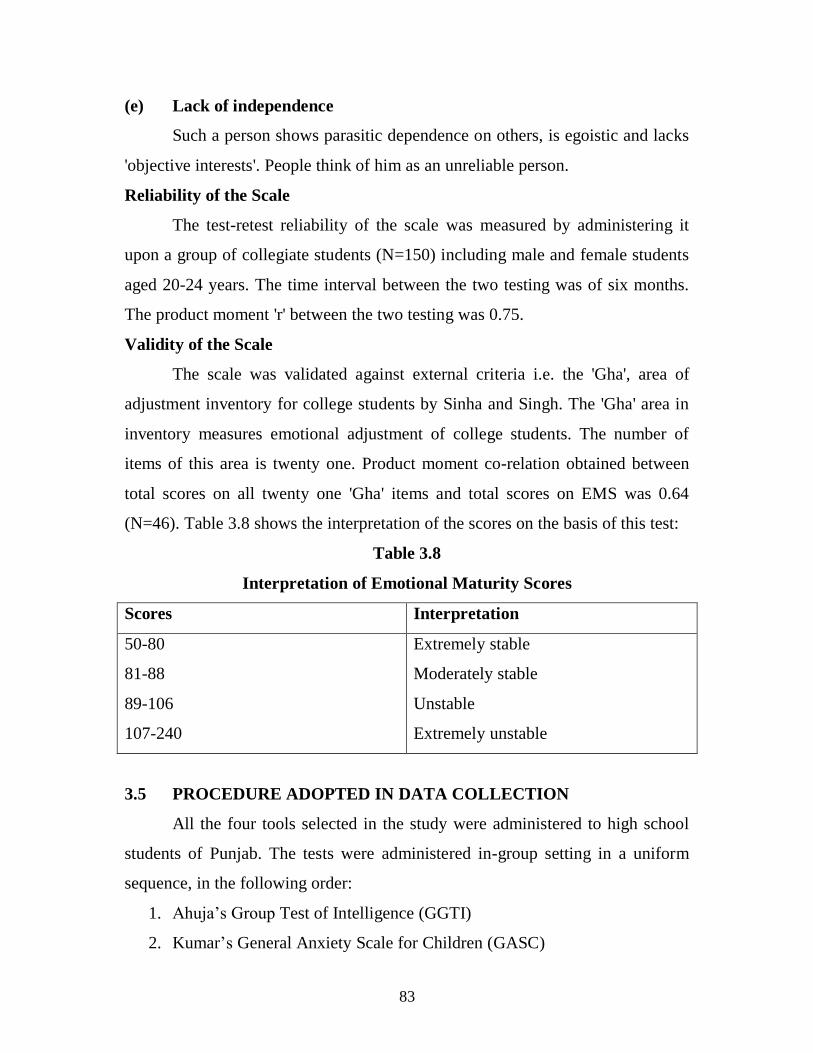
Validity of the Scale
The scale was validated against external criteria i.e. the 'Gha', area of
adjustment inventory for college students by Sinha and Singh. The 'Gha' area in
inventory measures emotional adjustment of college students. The number of
items of this area is twenty one. Product moment co-relation obtained between
total scores on all twenty one 'Gha' items and total scores on EMS was 0.64
(N=46). Table 3.8 shows the interpretation of the scores on the basis of this test:
Table 3.8
Interpretation of Emotional Maturity Scores
Scores Interpretation
50-80
81-88
89-106
107-240
Extremely stable
Moderately stable
Unstable
Extremely unstable
3.5 PROCEDURE ADOPTED IN DATA COLLECTION
All the four tools selected in the study were administered to high school
students of Punjab. The tests were administered in-group setting in a uniform
sequence, in the following order:
1. Ahuja’s Group Test of Intelligence (GGTI)
2. Kumar’s General Anxiety Scale for Children (GASC)

84
3. Yashvir Singh & Bhargava’s Emotional Maturity Scale (EMS)
4. Rao’s Social Maturity Scale (RSMS)
Principals of the school were contacted to seek their cooperation for
collecting data of the study. The testing conditions for all the students were kept
as constant and uniform as possible.
Before starting the testing session, it was ensured that subjects were seated
comfortably in a room where there was no outside disturbance. The help of the
school teachers was also sought in administering the tests. Before the actual tools
were administered, the subjects were acquainted with the purpose of the
investigation. This was done to establish rapport and to make them feel at home.
They were told that the results of the tools would be kept strictly confidential.
Instructions for each tool, as mentioned in the test manual, were read out
to the subjects and they were also requested to go through the instructions printed
at the cover page of the each tool. In case of intelligence test, the separate
instructions were given in the beginning of each sub-test. Through instructions,
subjects were cautioned to give sincere response. They were made to feel that
they would enjoy the activities and have fun in these tests. About 5 minutes rest
was allowed in between the tests. The response sheets were collected after the
allotted time. Care was taken to ensure that all the questions had been answered.
Those answer sheets where the answers were missing, were given to the same
subjects for completion. For the administration of the tests, about three and a half
hours time was spent in each school including a short break of twenty five
minutes for refreshment.
After collecting the data from the students of a particular school, a list of
their final board examination roll numbers was taken from the school office for
seeking their final results. Same procedure for data collection was adopted by the
investigator in other schools.
85
3.6 SCORING
Scoring of response sheets was done by the investigator himself according
to the scoring keys given in the manuals of four tests. A brief description of the
scoring procedure for each test is given below:
3.6.1 Ahuja's Group Test of Intelligence
The scoring of response sheet for Ahuja’s group test of intelligence was
done with the help of scoring stencil keys. The relevant stencil key was put on
each page of the answer sheet. It was so adjusted that the page number was
visible through the holes of the scoring stencil. Then the correctly marked
answers visible through the holes were counted and written on the left margin of
the answer sheet. The same procedure was followed for all the sub-tests except
for test-VII. In that case, the correct answers were affirmative that correspond
with the numbers given on the stencil key. The question numbers that were
answered wrong or were left un-attempted were marked with a red coloured
pencil. Both wrong as well as the un-attempted questions were deducted from the
total number of items contained in the sub-test VII and the balance score was
obtained.
Then, the scores from the different pages of were written in the table
given at the top of the front page of the answer sheet.
The sum total of the scores of the seven sub-tests (Excluding first one) of
the test, gave the total score obtained by a subject, which was considered as his
general mental ability score.
3.6.2 Kumar’s General Anxiety Scale for Children
The 45 items of General Anxiety scale for children (GASC) were scored
on all or none basis by hand scoring. For any response indicated as 'yes'
weightage of one score, whereas zero for 'no' response was given. The sum of all
the 'yes' responses gave the total anxiety score of the subject. The GASC
includes 11 items, which are labeled as 'lie items' on the basis of which a child
receiving a negative score of 6 or more is rejected because it reveals the lying
tendency of the child.

86
3.6.3 Yashvir Singh and Bhargava’s Emotional Maturity Scale
Emotional maturity scale has a total of 48 items and is a self- reporting
five-point scale. Items of the scale are in question form demanding information
for each in any of the five options mentioned below:
"Very much, much, undecided, probably, never"
The items are so stated that if the answer is in positive say very much, a
score of five is given; for much 4, for undecided 3, for probably 2 and for never a
score of 1 is to be awarded. Therefore, higher the score on the scale, greater is
the degree of the emotional immaturity and vice-versa.
3.6.4 Rao’s Social Maturity Scale
Social maturity scale has 90 items under three categories i.e. Personal
adequacy, Interpersonal adequacy and Social adequacy.
Out of these ninety items, 23 items are positively oriented and 67 are
negatively oriented. In first category i.e. personal adequacy there is only one, in
interpersonal adequacy nine and in social adequacy 13 items are positively
oriented and the remaining 67 i.e. 29 in the first category, 21 in the second
category and 17 in the third category are negatively oriented. The scale is self-
reporting four-point scale. Items of the scale are in question form demanding
information for each in any of the four options given below:
"Strongly agree, agree, disagree, and strongly disagree"
Items are so stated that if answer is say strongly agree, a score of 4 is
given, for agree 3, for disagree 2 and for strongly disagree a score if 1 is to be
awarded for positively oriented items and the score is awarded in reverse order
for the negatively oriented items. Moving the template on the scoring blank
forwards right and viewing the same number through the template holes obtains
scores for each of the sub-scales under the three dimensions of social maturity
scale. When No.1 is visible through all the six punched holes, it gives the score
for the first three sub-scales of the first dimension. Similarly, No.'2' and No.'3'
provide scores for the sub-scales of the second and the third dimensions
respectively.
87
The scores in the columns shown through the template are summed up and
entered in the appropriate cell provided on the right side of the scoring blank.
Thus, it is possible to obtain the scores of three dimensions and the total social
maturity score for each observation. Therefore, higher the score on the scale,
greater is the degree of social maturity.
3.6.5 Academic achievement Scores
The investigator had already noted the final examination roll numbers of
the subjects selected in the present study from the school office record. Their
result was noted from the INTERNET by entering the school codes of the
selected schools. The aggregate scores of five papers obtained by the selected
subjects in their annual examination held by C.B.S.E., New Delhi in March, 2006
were taken and treated as academic achievement scores of the students.
3.7 STATISTICAL TECHNIQES USED
The numerical determinants like mean and standard deviation were
worked out to study the general nature of the sample in relation to scores of
different variables taken in the present study i.e., General mental ability , anxiety,
emotional maturity, social maturity and academic achievement. Skewness,
kurtosis and their standard errors were worked out to see the trend of departure of
the sample distribution from the normal probability curve. In order to analyze the
data, obtained on the basis of general mental ability, anxiety, emotional maturity,
social maturity and academic achievement, the raw scores of the whole sample
were converted into T-scores and again their mean, median and standard
deviation were computed. The data were analyzed separately for boys and girls
and the total sample.
Following statistical techniques were used in the present study to
discover and ascertain the bearing of the collected data on the hypotheses and
objectives of this study for the analysis of the data.
The first hypothesis of the study was:
‘There exists no significant relationship between academic achievement and
88
general mental ability of high school students’.
The bearing of the relevant data on the said hypothesis was seen by
working out correlation through the use of Pearson’s Product Moment method of
correlation. The coefficients of correlation had to be computed between the
scores of the subjects on academic achievement with their scores on general
mental ability. The level of significance of each correlation was seen in the light
of the parameters given in the tables of significance of correlations. Moreover,
the dependability of coefficients of correlation in terms of their standard error
and their significance was also checked by calculating the Fisher’s z function.
An attempt was also made to see some measures of accuracy of prediction
of academic achievement by the variable of general mental ability.
The next step here consisted in working out the first, second and third
order partial coefficients of correlation so as to partial out the effect of other
related variables i.e. anxiety, emotional maturity and social maturity.
An effort here was made to find out the contribution of each variable
independently in the academic achievement through the method of multiple
coefficients of correlations. Thus different variables taken in the present study
are added step by step and their values of multiple coefficients of correlation
were computed.
All the above mentioned statistical techniques were employed to find out
and ascertain the bearing of the relevant data on the second, third and fourth
hypotheses. For determining the bearing of relevant data on the fifth hypothesis
of the study, Pearson’s Product Moment coefficients of correlation, dependability
of coefficients of correlation in terms of their standard error, their significance by
calculating the Fisher’s z function and Partial coefficients of correlation were
computed.
The sixth hypothesis of the study was:
‘There is no difference between rural and urban, boys and girls in relation
to the variables of general mental ability, anxiety, emotional maturity, social

89
maturity and academic achievement’.
For ascertaining the bearing of the relevant data (pertaining to the general
mental ability, anxiety, emotional maturity, social maturity and academic
achievement of the subjects) on the said hypothesis of the study, means of the
scores of the two categories of the subjects on their general mental ability,
anxiety, emotional maturity, social maturity and academic achievement were
computed along with the standard deviations of the said means. The t- test was
applied to see whether there was any significant difference between the means.
The level of significance of the computed critical ratio was statistically seen in
the light of statistical parameters for the purpose.
The two categories of the subjects (boys and girls on the basis of gender
and rural and urban on the basis of the locale/region) were compared on all the
five variables i.e. general mental ability, anxiety, emotional maturity, social
maturity and academic achievement. Means of the scores of both categories of
the subjects (boys and girls), (rural and urban) on each variable were computed
along with their respective standard deviations. Then t-test was applied to
ascertain whether or not there was any significant difference between the two
means. The significance of each critical ratio was seen in the light of the set
statistical parameters for the purpose.
The seventh hypothesis of the study was:
‘No significant differences exist among actualizers, par-actualizers and
non-actualizers on the basis of their anxiety, emotional maturity and social
maturity’.
For ascertaining the bearing of the relevant data (pertaining to, anxiety,
emotional maturity and social maturity of the subjects) on the said hypothesis of
the study, actualization of the students was predicted.
For the prediction of actualization, based on the data collected through
intelligence test of 400 students from eight schools (25 students from each of the
school, 4 urban and 4 rural), simple regression equation was used. This was
90
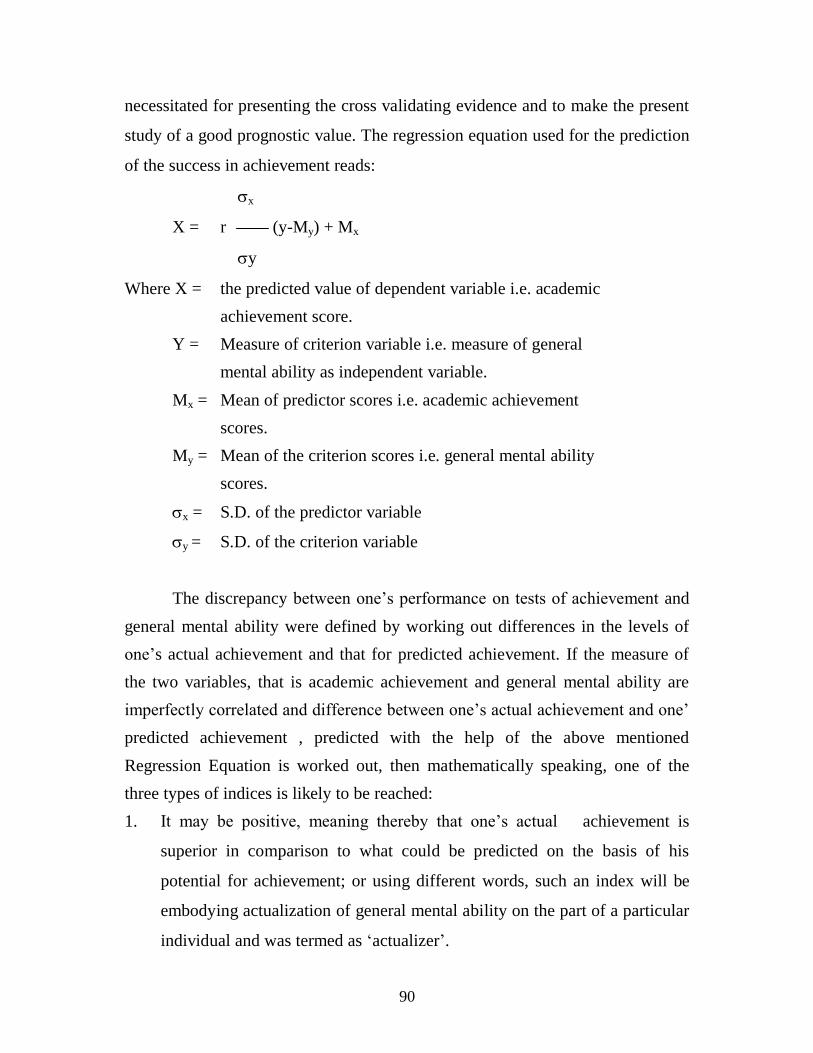
necessitated for presenting the cross validating evidence and to make the present
study of a good prognostic value. The regression equation used for the prediction
of the success in achievement reads:
x
X = r (y-My) + Mx
y
Where X = the predicted value of dependent variable i.e. academic
achievement score.
Y = Measure of criterion variable i.e. measure of general
mental ability as independent variable.
Mx = Mean of predictor scores i.e. academic achievement
scores.
My = Mean of the criterion scores i.e. general mental ability
scores.
x = S.D. of the predictor variable
y = S.D. of the criterion variable
The discrepancy between one’s performance on tests of achievement and
general mental ability were defined by working out differences in the levels of
one’s actual achievement and that for predicted achievement. If the measure of
the two variables, that is academic achievement and general mental ability are
imperfectly correlated and difference between one’s actual achievement and one’
predicted achievement , predicted with the help of the above mentioned
Regression Equation is worked out, then mathematically speaking, one of the
three types of indices is likely to be reached:
1. It may be positive, meaning thereby that one’s actual achievement is
superior in comparison to what could be predicted on the basis of his
potential for achievement; or using different words, such an index will be
embodying actualization of general mental ability on the part of a particular
individual and was termed as ‘actualizer’.

91
2. The index may be zero, showing that the particular individual is neither
‘actualizer’ nor ‘non-actualizer.’ Obviously, such an index is representing
the situation which may be designated as ‘par-actualization’. More
technically speaking, the index of par-actualization is indicative of perfect
commensuration of one’s achievement and the potential for achievement
and was labeled as ‘par-actualizer’.
3. The index may be negative demonstrating thereby that the particular
individual has failed to achieve, what could be predicted on the basis of his
performance on the test of intelligence and the individual may be dubbed as
‘non- actualizer’.
Table 3.9
The number of students falling in the three categories Actualizers,
Par-actualizers and Non-actualizers on the basis of the discrepancy
scores (N=400)
Sr.
No.
Category
Boys Girls Total
Rural Urban Rural Urban
1 Actualizers 43 15 43 24 125
2 Par-actualizers 42 31 40 37 150
3 Non-actualizres 15 54 17 39 125
Through this method, out of 400 students, 125 were labeled as
actualizers, 150 par-actualizers and 125 non-actualizers on the basis of their
general mental ability as shown in table 3.9. After arranging the scores obtained
by students in three categories mentioned above, the corresponding anxiety,
emotional maturity and social maturity scores were written against their
respective serial numbers. Means of the scores of the three categories of the
subjects on their anxiety, emotional maturity and social maturity were computed
along with the standard deviations of the said means. t-test was applied to see the
significance of the differences between actualizers and par-actualizers,
92
actualizers and non-actualizers, par-actualizers and non-actualizers on the basis
of their anxiety, emotional maturity and social maturity scores and also on the
different categories of the sample i.e. boys, girls, rural and urban groups. The
level of significance of the computed critical ratio was statistically seen in the
light of statistical parameters for the purpose.
One of the purposes of the study was to know the differences among
actualizers, par-actualizers and non actualizers on the basis of their anxiety,
emotional maturity and social maturity scores. For this purpose the significance
of the difference between the mean scores of actualizers and par- actualizers,
between actualizers and non-actualizers, between non-actualizers and par-
actualizers collectively and separately for boys, girls, rural and urban groups on
the basis of anxiety, emotional maturity and social maturity were calculated and
shown in different tables.
The results arrived in relation to different hypotheses of the study through
the statistical processing of the relevant data were analyzed and interpreted
bearing in mind the considerations that led to formulations of the seven
hypotheses of the study and the findings of the earlier related studies as described
and reviewed in the second chapter of this work. Subjective predictions were not
allowed to contaminate the process of analyzing and interpreting the results.
Every precaution was taken to arrive at the findings of the study as precisely and
as objectively as possible. If the results were in favour of any given hypothesis,
the possible reasons for the same were given. If the results were not in favour, an
attempt was made to explain the implications and causes of the results as
objectively as is normally expected on the part of an individual who reasonably
claims to be a researcher in the field of Education. Wherever necessary, graphic
representation of the data on different variables was made. The results arrived at
were shown in tabular forms. The data thus analyzed was interpreted to reach at
the findings of the study as described in the next chapter.