chapter · chapter. 4. measurement. concepts 79. conceptualization in practice . 80 ... no matter...
TRANSCRIPT

78
C H A P T E R4
MeasurementConcepts 79
Conceptualization in Practice 80Substance Abuse 80Depression 80Poverty 81
From Concepts to Observations 82Operationalization 83
Scales and Indexes 84Treatment as a Variable 87Gathering Data 87Combining Measurement Operations 88Measurement in Qualitative Research 89
Levels of Measurement 89Nominal Level of Measurement 89Ordinal Level of Measurement 91Interval Level of Measurement 91Ratio Level of Measurement 92The Case of Dichotomies 94Types of Comparisons 94
Measurement Error 95Evaluating Measures 96
Reliability 96Test–Retest Reliability 97
Internal Consistency 97Alternate-Forms Reliability 98Interrater Reliability 98Intrarater Reliability 98
Measurement Validity 99Face Validity 99Content Validity 99Criterion Validity 99Construct Validity 100
Screening and Cut-Off Scores 101Ways to Improve Reliability and Validity
of Existing Measures 102Measurement in a Diverse Society 104Implications for Evidence-Based Practice 105Conclusion 106Key Terms 107Highlights 107Discussion Questions 108Practice Exercises 108Web Exercises 108Developing a Research Proposal 109A Question of Ethics 109
Substance abuse is a socal problem of remarkable proportions. In 2007, 18.7 million Americans age 12 or older were alcohol abusers (Substance Abuse and Mental Health Services Administration, 2008). Alcohol is involved in more than 30% of all fatal traffic crashes (National Highway Traffic Safety Administration, 2010), and more than 1.4 million arrests are made annually for driving under the

Chapter 4 Measurement 79
influence (Federal Bureau of Investigation, 2010). Nearly 4 in 10 college students binge drink (L. D. Johnston, O’Malley, Bachman, & Schulenberg, 2010), and about 1 in 4 could be diagnosed as alcohol abusers or alcohol dependent (Slutske, 2005).
Whether your goal is to learn how society works, deliver useful services, or design effective social policies, at some point, you might decide to read the research literature on that topic. If you are reading literature about substance abuse, you will have to answer three questions: What is meant by substance abuse in this research (conceptualization)? How is substance abuse measured (measurement)? Is the measurement method accurate and valid (reliability and validity)? No matter the topic, we cannot make sense of the results of a study until we know how the concepts were defined and measured, nor are we ready to begin a research project until we have defined our concepts and constructed valid measures of them. It is only when we conclude that a study used valid measures of its key concepts that we can have some hope that its conclusions are valid.
Conceptualization, measurement, and validity are crucial to establish the evidence base of social work prac-tice. When you think of measurement in social work practice, you typically think of the psychosocial assessment whereby you are collecting information about a client system; the assessment often includes key concepts and measures of those concepts. It is critically important that you use accurate methods to assess your clients.
In this chapter, we describe the process of measurement—from taking an abstract concept and translat-ing the concept to the point that we can assign some value to represent that concept. We first address the issue of conceptualization or how you define key terms, using substance abuse and related concepts as examples. We then focus on the characteristics, or levels of measurement, reflected in different measures. In the next sec-tion, we discuss different methods to assess the quality of measures, specifically the techniques used to assess reliability and validity. Finally, we discuss the importance of ensuring the cultural relevance of measures and the implications of measurement for evidence-based practice. By the chapter’s end, you should have a good understanding of measurement and the crucial role it plays for social work practice and social work research.
22 Concepts
Although the drinking statistics sound scary, we need to be clear about what they mean before we march off to a Temperance Society meeting. What, after all, is binge drinking? The definition Lloyd Johnston et al. (2010) used is “heavy drinking,” or more specifically, “five or more drinks in a row at least once in the prior two week period” (p. 23).
Is this what you call binge drinking? This is only one definition of binge drink-ing; other researchers suggest that while the definition is appropriate for men, it should be four drinks for women (Wechsler et al., 2002). Binge drinking is a concept—a mental image that summarizes a set of similar observations, feelings, or ideas. To make that concept useful in research (and even in ordinary discourse), we have to define it.
A challenge social work researchers face is that many of the topics they study involve abstract concepts or ideas that are not easily observable and not just simple objects. Some concepts, such as age or gender, are straightforward, and there is little confusion about their meaning. When we refer to concepts like substance abuse, homelessness, mental health, or poverty, we cannot count on others knowing exactly what we mean. Even the experts may disagree about the meaning of frequently used concepts. That’s okay. The point is not that there can be only one definition of a concept, but that we have to specify clearly what we mean when we use a concept, and we expect others to do the same.
Concept A mental image that summarizes a set of similar observations, feelings, or ideas.
The Practice of Research in Social Work80
Conceptualization in Practice
A beginning step in measurement is to define the concept. If we are to do an adequate job of conceptual-ization, we must do more than just think up some definition, any definition, for our concepts. We have to turn to social theory and prior research to review appropriate definitions. We may need to distinguish
dimensions of the concept. We should understand how the definition we choose fits within the theoretical framework guiding the research and what assumptions underlie this framework.
Researchers start with a nominal definition of the concept; they define the concept in terms of other concepts. For example, you might define child abuse as occurring when either severe physical or emotional harm is inflicted on a child or there is contact of a sexual nature. The nominal definition of child abuse identi-fies the different types of abuse and specifies that the harm must be severe, but the definition does not provide the set of rules a researcher uses to identify the abuse or distinguish between severe and not severe harm. Nominal definitions are like those definitions found in dictionaries: You get an understanding of the word and its dimensions, but you still do not have a set of rules to use to measure the concept.
Substance Abuse
What observations or images should we associate with the concept of substance abuse? Someone leaning against a building with a liquor bottle, barely able to speak coherently? College students drinking heavily at a party? Someone in an Alcoholics Anonymous group drinking one beer? A 10-year-old boy drinking a small glass of wine in an alley? A 10-year-old boy drinking a small glass of wine at the dinner table in France? Do all these images share something in common that we should define as substance abuse for the purposes of a particular research study? Do some of them? Should we take into account cultural differences? Gender differ-ences? Age differences? Social situations? Physical tolerance for alcohol?
Many researchers now use the definition of substance abuse contained in the American Psychiatric Association’s (2004) Diagnostic and Statistical Manual of Mental Disorders (DSM–IV–TR): “a maladaptive pat-tern of substance use manifested by recurrent and significant adverse consequences related to the repeated use of substances . . . must have occurred repeatedly during the same 12-month period or been persistent” (Substance Abuse Features section, para. 1). Although a popular definition, we cannot judge the DSM–IV–TR definition of substance abuse as correct or incorrect. Each researcher has the right to conceptualize as he or she sees fit. However, we can say that the DSM–IV–TR definition of substance abuse is useful, in part, because it has been widely adopted. The definition is stated in clear and precise language that should minimize differ-ences in interpretation and maximize understanding.
This clarity should not prevent us from recognizing that the definition reflects a particular theoretical orientation. DSM–IV–TR applies a medical “disease model” to substance abuse (as well as to mental illness). This theoretical model emphasizes behavioral and biological criteria, instead of the social expectations that are emphasized in a social model of substance abuse. How we conceptualize reflects how we theorize.
Just as we can connect concepts to theory, we can connect them to other concepts. What this means is that the definition of any one concept rests on a shared understanding of the terms used in the definition. So if our audience does not already have a shared understanding of terms such as adequate social functioning, self-care functioning, and repeated use, we must also define these terms before we are finished with the process of defin-ing substance abuse.
Depression
Some concepts have multiple dimensions, bringing together several related concepts under a larger concep-tual umbrella. One such concept is depression. Depression is unlike a normal emotional experience leading
Conceptualization The process of specifying what we mean by a term. In deductive research, conceptualization helps to translate portions of an abstract theory into testable hypotheses involving specific variables. In inductive research, conceptualization is an important part of the process used to make sense of related observations.
Chapter 4 Measurement 81
to sadness because it includes a range of symptoms, such as negative mood (sadness, loneliness, feelings of worthlessness) and somatic conditions (loss of interest in pleasurable activities, eating and sleeping problems, loss of energy, talking less). Depression is a combination of these different dimensions.
But even when there is agreement about the various dimensions that make up depression, there are still different approaches to measure the presence of depression. One approach assumes that the presence of psy-chological symptoms is not enough by itself, but these symptoms vary by intensity or severity (Dohrenwend & Dohrenwend, 1982). In the case of depression, it is not sufficient to look at whether the symptoms are present; rather, they have to be persistent, lasting for some time period. The symptoms must be so intense that they interfere with an individual’s ability to function. So some researchers use scales that measure the intensity of the different items. For example, the Center for Epidemiologic Studies Depression (CES–D) scale asks respon-dents to rate the intensity (or severity) of each of the items; then the items are summed to represent a range on a continuum of intensity of depression.
The second approach to measuring depression is derived from the clinical case identification model used in assessment models such as the DSM–IV–TR and reflected in scales such as the Patient Health Questionnaire (PHQ-9; Kroenke & Spitzer, 2002). In the clinical diagnostic approach, researchers identify the presence of the various dimensions of depression during a specific time period, but they do not assess the intensity of the symptoms. Furthermore, researchers using this method gather additional information to assess whether the responses conform to criteria for a case of depression. Unlike the previous model, this approach identifies sim-ply whether depression is present or absent.
Do these different perspectives really matter? Joy Newmann (1989) found that the relationship between age and depression depended on the type of assessment method. Studies using scales like the CES–D tended to show that highest depression scores occur among the youngest and oldest age groups, whereas stud-ies using the clinical case method have found that the younger and older cohorts were less depressed than middle-age cohorts.
Poverty
Decisions about how to define a concept reflect the theoretical framework that guides the researchers. For example, the concept of poverty has always been somewhat controversial because different conceptualizations of poverty result in different estimates of its prevalence and different social policies for responding to it.
Most of the statistics that you see in the newspaper about the poverty rate reflect a conception of poverty that was formalized by Mollie Orshansky, of the Social Security Administration, in 1965 and subsequently adopted by the federal government and many researchers. She defined poverty in terms of what is called an absolute standard, based on the amount of money required to purchase an emergency diet that is estimated to be nutritionally adequate for about 2 months. The idea is that people are truly poor if they can barely pur-chase the food they need and other essential goods. This poverty threshold is adjusted for household size and composition (number of children and adults), and the minimal amount needed for food is multiplied by three because a 1955 survey indicated that poor families spend about one-third of their incomes on food (Orshansky, 1977). More recently, a governmental working group has developed a supplemental poverty measure that calculates income and poverty thresholds somewhat differently but is still based on minimum need (Garner, 2010).
Other social scientists reject this way of establishing an absolute standard and suggest an alternative method, the basic needs budget approach (Lin & Bernstein, 2008). This approach suggests that we need to establish the market cost of a basket of goods that each of us needs to meet basic needs. The cost of each cat-egory or good is estimated separately. This method also forces us to define what an adequate amount of that particular good is. Like the official poverty line, this definition requires adjustments for family size, but it also requires adjustments for the labor status of the parent, ages of the children, and geographic region of residence.
Some social scientists disagree with absolute standards and have instead urged adoption of a relative pov-erty standard. They identify the poor as those in the lowest 5th or 10th of the income distribution or as those
The Practice of Research in Social Work82
having some fraction of the average income. The idea behind this relative conception is that poverty should be defined in terms of what is normal in a given society at a particular time. Some social scientists prefer yet another conception of poverty. With the subjective approach, poverty is defined as what people think would be the minimal income they need to make ends meet. While some poverty researchers have argued that this approach is inf luenced too much by the different standards that people use to estimate what they “need,” trends of poll responses to asking about the minimum income necessary for a family of four to get along in one’s community tend to follow a path similar to changes in the median income (Blank, 2008).
What are the implications of these different approaches? If you are interested in determining the percent-age of the population that is poor, a relative approach sets the percentage you consider poor based on income only. Basic needs approaches that attempt to specify the actual amount needed to meet basic needs tend to find three times as many poor in comparison to the multiplier approach used to calculate the Official Poverty Line (Lin & Bernstein, 2008).
Which do you think is a more reasonable approach to defining poverty: an absolute standard, a relative standard, or a subjective standard? Which kind of absolute standard: the multiplier approach or the basic needs approach? Our understanding of the concept of poverty is sharpened when we consider the theoretical ramifications of these alternative definitions.
From Concepts to Observations
Identifying the concepts we will study, specifying the dimensions of these concepts, and defining their mean-ing only begins the process of connecting our ideas to concrete observations. If we are to conduct empirical research involving a concept, we must be able to distinguish it in the world around us and determine how it may change over time or differ between persons or locations. Operationalization is the process of connecting concepts to observations. You can think of it as the empirical counterpart of the process of conceptualization. When we conceptualize, we specify what we mean by a term. When we operationalize, we identify the specific set of rules that we will use to indicate that the concept is present or not.
Concepts vary in their level of abstraction, and this in turn affects how readily we can specify the vari-ables pertaining to the concept. We may not think twice before we move from a conceptual definition of age as time elapsed since birth to the variable years since birth. Binge drinking is also a relatively concrete con-cept, but it requires a bit more thought. We may define binge drinking conceptually as episodic drinking and select for our research on binge drinking the variable frequency of five or more drinks in a row. That’s pretty straightforward.
A very abstract concept like social status may have a clear role in social theory, but a variety of meanings in different social settings. Variables that pertain to social status may include level of esteem in a group, extent of influence over others, level of income and education, or number of friends. It is very important to specify what we mean by an abstract concept like social status in a particular study and to choose appropriate variables to represent this meaning.
You have already learned in Chapter 2 that variables are phenomena that vary. Where do variables fit in the continuum from concepts to operational indicators? Think of it this way: Usually, the term variable is used to refer to some specific aspect of a concept that varies and for which we then have to select even more concrete indicators. For example, research on the concept of social support might focus on the variable level of perceived support. We might then select as our indicator the responses to a series of statements about social support, such as Zimet, Dahlem, Zimet, and Farley’s (1988) “Multidimensional Scale of Perceived Social Support”: “There is a special person around when I am in need.” Identifying the variables we will measure is a necessary step on the road to developing our specific measurement procedures.
Not every concept in a particular study is represented by a variable. If we were to study clients’ alcohol abuse at an in-patient treatment unit, there is no variation; rather, all the clients are clients. In this case, client
Chapter 4 Measurement 83
is called a constant; it is always the same and therefore is not a variable. Of course, this does not mean we can-not study gender differences among the clients. In this case, gender is the variable; the client is still a constant.
How do we know what concepts to consider and then which variables to select in a study? It’s very tempt-ing, and all too common, to simply try to “measure everything” by including in a study every variable we can think of that might have something to do with our research question. This haphazard approach will inevitably result in the collection of data that are useless and the failure to collect some data that are important. Instead, a careful researcher examines relevant theories to identify key concepts, reviews prior research to learn how useful different indicators have been, and assesses the resources available for measuring adequately variables in the specific setting to be studied.
22 Operationalization
Once we have defined our concepts in the abstract—that is, we have provided a nominal definition—and we have identified the specific variables we want to measure, we must develop measurement procedures. The goal is to devise an operation that actually measures the concepts we intend to measure—that is, to achieve mea-surement validity. Researchers provide an operational definition, which includes what is measured, how the indicators are measured, and the rules used to assign a value to what is observed and to interpret the value.
Previously, we have provided a nominal definition of alcoholism. An operational definition might include the following content:
The Michigan Alcoholism Screening Test (MAST) is a 24-item instrument that includes a variety of indicators of symptoms such as seeing drinking as a problem, seeking treatment for problem drinking, delirium tremens, severe shaking, hearing voices, complaints from others about drink-ing, memory loss from drinking, job loss due to drinking, social problems from drinking, arrests for drunk driving or for drunken behavior, guilt feelings about drinking, and ability to stop drinking. The scale may be administered orally or may be self-administered. Respondents respond yes or no to each item, and each item is given a weighted score ranging from 0 to 5. There are four items for which the alcoholic response is “no.” The weighted item responses are summed, with a score of 0 to 3 indicating no problem with alcoholism, 4 considered to be suggestive of a problem, and 5 or above an indication of alcoholism.
As you can see from this definition, we are provided with the specific indicators included in the measure, the method(s) for data collection, specific scoring of the information, and the interpretation of scale scores. This detail is often referred to as operationalization.
Exhibit 4.1 represents the operationalization process in three studies. The first researcher defines her concept—income—and chooses one variable—annual earnings—to represent it. This variable is then measured with responses to a single question or an item: What was your total income from all sources in 2010? The second researcher defines her concept—poverty—as having two aspects or dimensions—subjective poverty and absolute poverty. Subjective poverty is measured with responses to a survey question: Would you say you are poor? Absolute poverty is mea-sured by comparing family income to the poverty threshold. The third researcher decides that her concept is defined by a position on three measured variables: income, education, and occupational prestige.
Operationalization The process of specifying the operations that will indicate the value of cases on a variable.
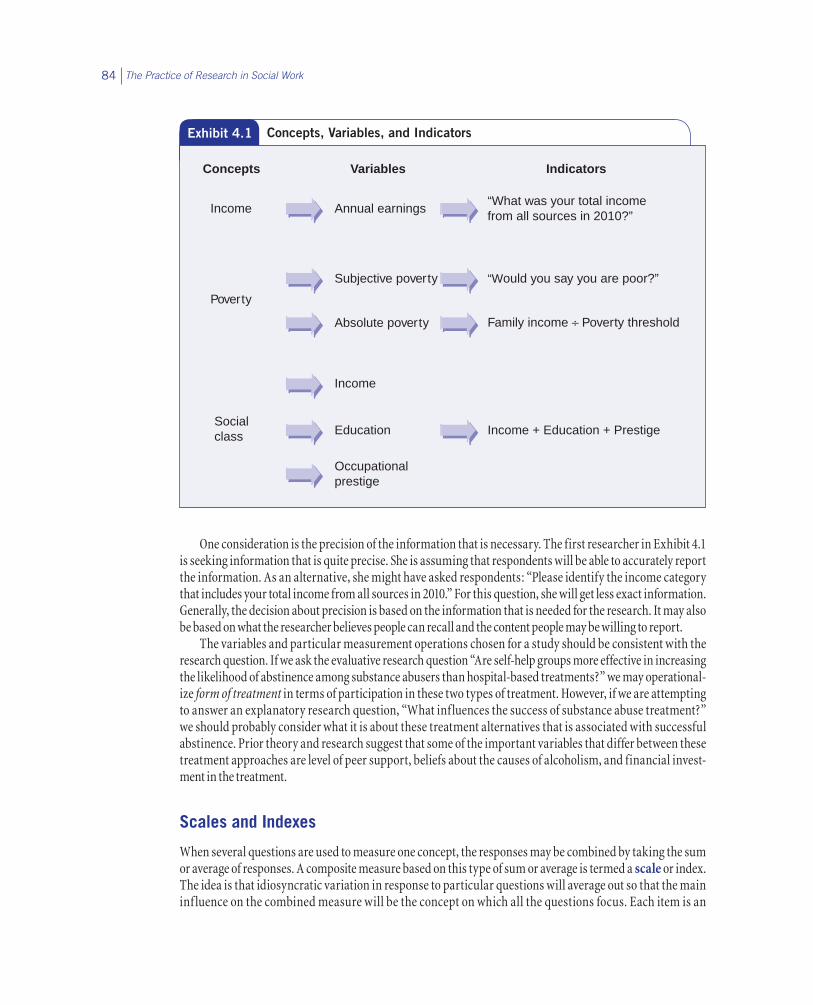
The Practice of Research in Social Work84
One consideration is the precision of the information that is necessary. The first researcher in Exhibit 4.1 is seeking information that is quite precise. She is assuming that respondents will be able to accurately report the information. As an alternative, she might have asked respondents: “Please identify the income category that includes your total income from all sources in 2010.” For this question, she will get less exact information. Generally, the decision about precision is based on the information that is needed for the research. It may also be based on what the researcher believes people can recall and the content people may be willing to report.
The variables and particular measurement operations chosen for a study should be consistent with the research question. If we ask the evaluative research question “Are self-help groups more effective in increasing the likelihood of abstinence among substance abusers than hospital-based treatments?” we may operational-ize form of treatment in terms of participation in these two types of treatment. However, if we are attempting to answer an explanatory research question, “What influences the success of substance abuse treatment?” we should probably consider what it is about these treatment alternatives that is associated with successful abstinence. Prior theory and research suggest that some of the important variables that differ between these treatment approaches are level of peer support, beliefs about the causes of alcoholism, and financial invest-ment in the treatment.
Scales and Indexes
When several questions are used to measure one concept, the responses may be combined by taking the sum or average of responses. A composite measure based on this type of sum or average is termed a scale or index. The idea is that idiosyncratic variation in response to particular questions will average out so that the main inf luence on the combined measure will be the concept on which all the questions focus. Each item is an
Concepts Variables Indicators
Socialclass
Income
Income + Education + PrestigeEducation
Occupationalprestige
Poverty
Absolute poverty Family income ÷ Poverty threshold
Subjective poverty
Income Annual earnings“What was your total incomefrom all sources in 2010?”
“Would you say you are poor?”
Exhibit 4.1 Concepts, Variables, and Indicators
Chapter 4 Measurement 85
indicator of the concept, but the item alone is often not a sufficient measure of the concept. Therefore, the scale is a more complete measure of the concept than any one of the component questions.
Creating a scale is not just a matter of writing a few questions that seem to focus on a concept. Questions that seem to you to measure a common concept might seem to respondents to concern several different issues. The only way to know that a given set of questions does form a scale is to administer the questions to people like those you plan to study. If a common concept is being measured, people’s responses to the different ques-tions should display some consistency.
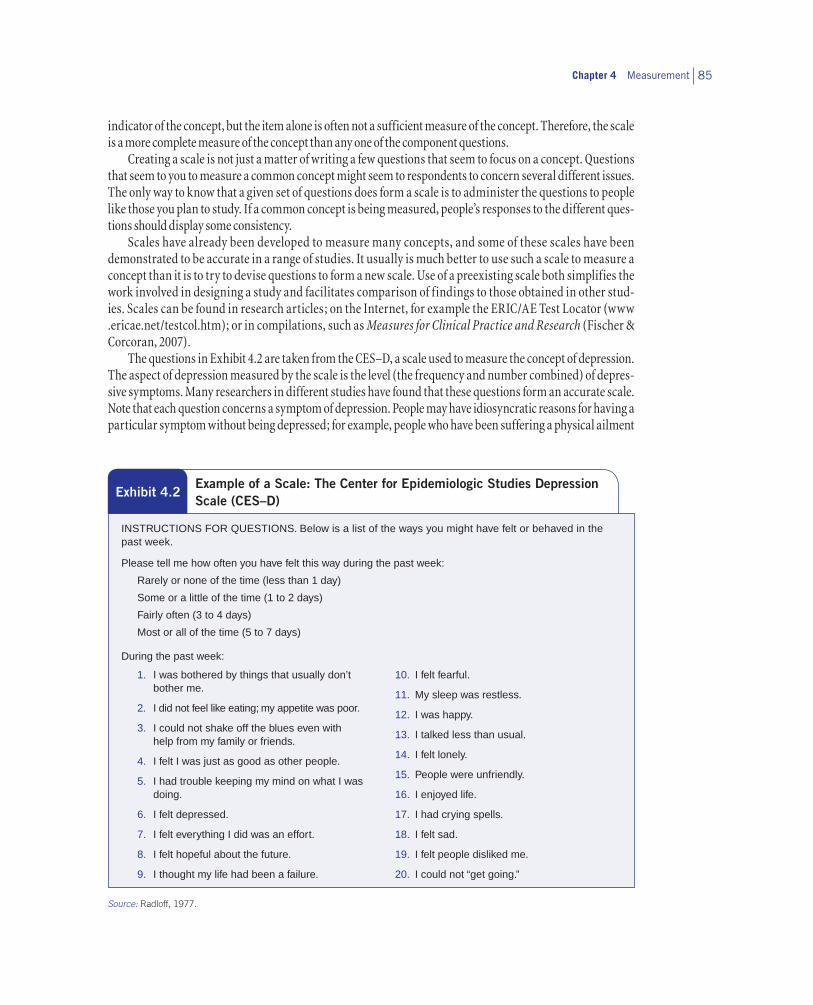
Scales have already been developed to measure many concepts, and some of these scales have been demonstrated to be accurate in a range of studies. It usually is much better to use such a scale to measure a concept than it is to try to devise questions to form a new scale. Use of a preexisting scale both simplifies the work involved in designing a study and facilitates comparison of findings to those obtained in other stud-ies. Scales can be found in research articles; on the Internet, for example the ERIC/AE Test Locator (www .ericae.net/testcol.htm); or in compilations, such as Measures for Clinical Practice and Research (Fischer & Corcoran, 2007).
The questions in Exhibit 4.2 are taken from the CES–D, a scale used to measure the concept of depression. The aspect of depression measured by the scale is the level (the frequency and number combined) of depres-sive symptoms. Many researchers in different studies have found that these questions form an accurate scale. Note that each question concerns a symptom of depression. People may have idiosyncratic reasons for having a particular symptom without being depressed; for example, people who have been suffering a physical ailment
Exhibit 4.2Example of a Scale: The Center for Epidemiologic Studies Depression Scale (CES–D)
INSTRUCTIONS FOR QUESTIONS. Below is a list of the ways you might have felt or behaved in the past week.
Please tell me how often you have felt this way during the past week:
Rarely or none of the time (less than 1 day)
Some or a little of the time (1 to 2 days)
Fairly often (3 to 4 days)
Most or all of the time (5 to 7 days)
During the past week:
1. I was bothered by things that usually don’t bother me.
2. I did not feel like eating; my appetite was poor.
3. I could not shake off the blues even with help from my family or friends.
4. I felt I was just as good as other people.
5. I had trouble keeping my mind on what I was doing.
6. I felt depressed.
7. I felt everything I did was an effort.
8. I felt hopeful about the future.
9. I thought my life had been a failure.
10. I felt fearful.
11. My sleep was restless.
12. I was happy.
13. I talked less than usual.
14. I felt lonely.
15. People were unfriendly.
16. I enjoyed life.
17. I had crying spells.
18. I felt sad.
19. I felt people disliked me.
20. I could not “get going.”
Source: Radloff, 1977.
The Practice of Research in Social Work86
may say that they have a poor appetite. By combining the answers to questions about several symptoms, the scale score reduces the impact of this idiosyncratic variation.
The advantages of using scales rather than single questions to measure important concepts are clear, so surveys and interviews often include sets of multiple-item questions. However, several cau-tions are in order:
Our presupposition that each component question is indeed measuring the same concept may be mistaken. Although we may include multiple questions in a survey to measure one concept, we may find that answers to the questions are not related to one another, so the scale cannot be created. Or we may find that answers to just a few of the questions are not related to the answers given to most of the others. Therefore, we may decide to discard these particular questions before computing the average that makes up the scale. For example, the CES-D item that asks about fearfulness may be related to anxiety rather than to depression.
Combining responses to specific questions can obscure important differences in meaning among the questions. Daniel Rosen’s work on the impact of Problem Solving Therapy on depressive symptoms for older methadone users provides an example (Rosen, June 2011, personal communication). In his study, Rosen noted that total scores on a depression scale were not changing that much but that scores on mood related items were improving while scores on physical-related symptoms were not improving. Using the total scale score obscured an important clinical finding.
The questions in a scale may cluster together in subsets. All the questions may be measuring the intended concept, but we may conclude that the concept actually has several different aspects. A multidimensional scale has then been obtained. This conclusion can in turn help us refine our understanding of the original concept. For example, Schutt, Goldfinger, and Penk (1992) included in a survey of homeless mentally ill people a set of questions to measure their residential preferences. When the researchers designed these questions, they sought to measure the continuum of sentiment ranging from a desire to remain in a shelter, to a desire to live in a group home, to a desire to live in an independent apartment. Their questions ranged from whether people wanted to live with others or by themselves to whether they wanted to have staff in their residence. But statistical analysis indicated that the questions actually formed three subsets, corresponding to three dimen-sions of residential preference: desire for stable housing, desire for living in a group home with other people, and desire to have staff in the home. Identification of these three dimensions gave the researchers a better understanding of the concept of residential preference.
A scale may be designed explicitly to measure multiple conceptual dimensions, but often the same dimen-sions do not reappear in a subsequent study. For example, while Lenore Radloff (1977), the originator of the CES-D scale, and subsequently other researchers found that the scale includes four dimensions, other studies of different population subgroups have found only three dimensions. The researcher must then try to figure out why: Does the new population studied view issues differently than prior populations surveyed with the scale? Were the dimensions found in previous research really just chance associations among the questions making up the larger scale? Have sentiments changed since the earlier studies when the multidimensional scale was developed? Only after a scale has been used in several studies can we begin to have confidence in the answers to the questions on which it is based.
Sometimes particular questions are counted, or weighted, more than others in the calculation of the scale. Some questions may be more central to the concept being measured than others and so may be given greater weight in the scale score. It is difficult to justify this approach without extensive testing, but some well-established scales do involve differential weighting. For example, The MAST asks questions that are assigned different weights. The question “Have you ever been in a hospital because of your drinking?” is given more points (weighted higher) than the question “Do you feel you are a normal drinker?”
Chapter 4 Measurement 87
Treatment as a Variable
Frequently, social work researchers will examine the effectiveness of an intervention or compare two different intervention approaches. When an intervention is compared to no intervention or when two or more inter-ventions are compared, the intervention becomes the independent variable. It is important for the researcher to provide a clear nominal definition of the intervention. For example, it is not enough for the researcher to say that the study is comparing one method to another, such as “traditional” case management to “intensive” case management. Although the general meaning of such an approach may be familiar to you, the researcher must define what each approach involves. Case management may include full support so that the social worker working with the chronically mentally ill provides a variety of services and supports, including rehabilita-tion, social skill building, counseling, links to resources, identification of work and social opportunities, and money management, whereas another social worker may just assess, link the client to other services, and reevaluate periodically.
Nominal definitions of an intervention only provide the characteristics or components of the interven-tion, but fail to fully describe how the intervention was implemented. Researchers provide varying amounts of specificity regarding the actual operationalization of the intervention. For example, Shaun Eack and his col-leagues (Eack, Hogarty, Greenwald, Hogarty, & Keshavan, 2011) operationalized their cognitive enhancement therapy approach by describing the sequence of the intervention (computer-based training and then social cognition therapy groups) and designating the length of computer-based rehabilitation training (3 months, 1 hour per week) and number and length of social cognition therapy groups (45 groups lasting 1.5 hours). They also specified the goals of the different components. This amount of detail provides a much clearer sense of the nature of the intervention, but it would still not be possible to repeat the research or to use the intervention with clients without additional information. Without the actual description of the intervention and how the treatment model was implemented, you cannot adequately evaluate the research or replicate what was done if you want to implement the intervention at your agency.
Gathering Data
Social work researchers and practitioners have many options for operationalizing their concepts. We briefly mention these options here, but go into much greater depth in subsequent chapters.
Measures can be based on a diverse set of activities. One method is to use a direct measure, such as visual or recorded observation or a physical measure such as a pulse rate. Although these methods are particularly useful for gauging behavior, they are typically intrusive. The very act of gathering the information may change people’s behavior, thereby altering the accuracy of the obtained information. If a caseworker goes to a client’s home to observe the client interacting with a child, the nature of the interactions may change because the par-ent knows the caseworker is present. The parent is likely to behave in a manner that is more socially accept-able to the caseworker. Similarly, self-monitoring of behavior may have the same effect. If a smoker is asked to monitor the number of cigarettes smoked in a day, the act of such monitoring may reduce the number of cigarettes smoked.
Data may be gathered by interviews or self-administered scales and questionnaires. These methods appear to be direct in that we gather the information directly from the respondent or client. Yet what we are trying to do is infer behavior, attitudes, emotions, or feelings because we cannot observe these directly. These methods may also be quite intrusive, and the quality of the responses can be affected by the nature of the questions or the characteristics of the person asking the questions, as we discuss in Chapter 9.
There are other sources of information from which measures can be operationalized. Many large data sets have been collected by the federal government, state governments, and nongovernmental sources. Many of these data sets have social indicators that are relevant to social services, such as employment, program

The Practice of Research in Social Work88
participation, income, health, crime, mental health, and the like. A drawback to these data is that you are con-strained by the way those who collected the data operationalized their measures.
Variables can be operationalized using written information in client records. The quality of these records depends on the recording accuracy of the individual staff. As with data collected by other sources, you are con-strained by how variables were operationalized by the staff. Staff may not use common definitions, and these definitions may change over time, leading to inaccuracies in the data.
When we have reason to be skeptical of potential respondents’ answers to questions, when we cannot observe the phenomena of interest directly, and when there are no sources of available data, we can use indirect or unobtrusive measures, which allow us to collect data about individuals or groups without their direct knowledge or participation (Webb, Campbell, Schwartz, & Sechrest, 2000). However, the opportuni-ties for using unobtrusive measures are few, and the information they can provide is often limited to crude counts or estimates.
The physical traces of past behavior are one type of unobtrusive measure that is most useful when the behavior of interest cannot be directly observed (perhaps because it is hidden or occurred in the past) and has not been recorded in a source of available data. To measure the prevalence of drinking in college dorms or fraternity houses, we might count the number of empty bottles of alcoholic beverages in the surrounding dumpsters. Student interest in the college courses they are taking might be measured by counting the number of times that books left on reserve as optional reading are checked out or the number of class handouts left in trash barrels outside a lecture hall.
You can probably see that care must be taken to develop trace measures that are useful for comparative purposes. For instance, comparison of the number of empty bottles in dumpsters outside different dorms could be misleading; you would need to take into account, at the least, the number of residents in the dorms, the time since the last trash collection, and the accessibility of each dumpster to passersby. Counts of usage of books on reserve will be useful only if you take into account how many copies of the books are on reserve for the course, how many students are enrolled in the course, and whether reserve reading is required.
Content analysis, another type of indirect measurement, studies representations of the research topic in such media forms as news articles, TV shows, and radio talk shows. An investigation of what motivates child abuse reporting might include a count of the amount of space devoted to newspaper articles in a sample of issues of the local newspaper. Television stories might be coded to indicate the number of times that newscast-ers reported on the maltreatment of children.
Combining Measurement Operations
The choice of a particular measurement method is often determined by available resources and opportunities, but measurement is improved if this choice also takes into account the particular concept or concepts to be measured. Responses to such questions as “How socially engaged were you at the party?” or “How many days did you use sick leave last year?” are unlikely to provide information as valid, respectively, as direct observa-tion or agency records. However, observations at social gatherings may not answer our questions about why some people do not participate; we may just have to ask people. If no agency is recording the frequency of job loss in a community, we may have to ask direct questions.
Triangulation—the use of two or more different measures of the same variable—can make for even more accurate measurement (Brewer & Hunter, 2005). When we achieve similar results with different mea-sures of the same variable, particularly when the measures are based on such different methods as survey questions and field-based observations, we can be more confident in the validity of each measure. If results diverge with different measures, it may indicate that one or more of these measures are influenced by more measurement error than we can tolerate. Divergence between measures could also indicate that they actually operationalize different concepts.
Chapter 4 Measurement 89
Measurement in Qualitative Research
Qualitative research projects approach measurement in a way that tends to be more inductive. In an induc-tive approach, concepts emerge from the process of thinking about what has been observed, compared with the deductive approach that we have described, in which we develop concepts on the basis of theory and then decide what should be observed to indicate that concept. Instead of deciding in advance which concepts are important for a study, what these concepts mean, and how they should be measured, qualitative researchers begin by recording verbatim what they hear in intensive interviews or what they see during observational sessions. This material is then reviewed to identify important concepts and their meaning for participants. Relevant variables may then be identified and procedures developed for indicating variation between partici-pants and settings or variation over time. As an understanding of the participants and social processes devel-ops, the concepts may be refined and the measures modified. Qualitative research often does not feature the sharp boundaries in quantitative research between developing measures, collecting data with those measures, and evaluating the measures. You learn more about qualitative research in Chapter 9.
22 Levels of Measurement
The final part of operationalization is to assign a value or symbol to represent the observation. Each variable has categories of some sort, and we need to know how to assign a symbol—typically a number—to represent what has been observed or learned. A variable’s categories impart different types of information. We may have a discrete variable, whereby each separate category represents a different status. The variable may be a continuous variable, for which the number represents a quantity that can be described in terms of order, spread between the numbers, and/or relative amounts.
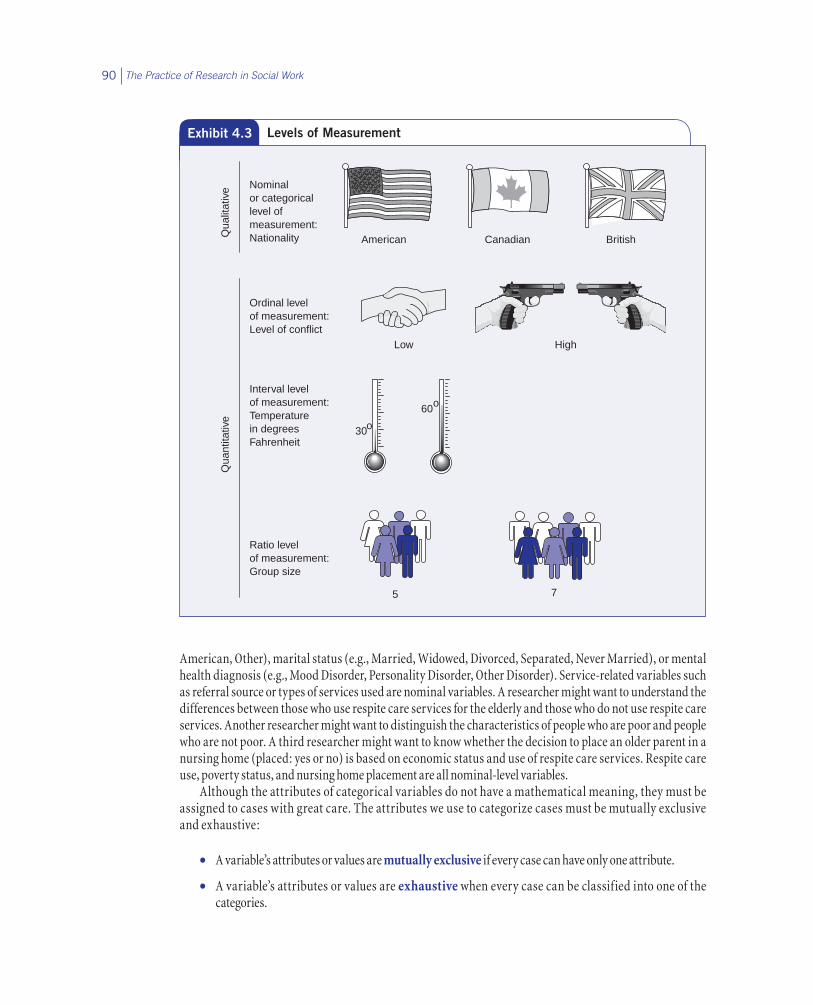
Part of operationalization then is to decide the variable’s level of measurement that will be used in the research. When we know a variable’s level of measurement, we can better understand how cases vary on that variable and so understand more fully what we have measured. Level of measurement also has important implica-tions for the type of statistics that can be used with the variable, as you will learn in Chapter 14. There are four levels of measurement: nominal, ordinal, interval, and ratio. Exhibit 4.3 depicts the differences among these four levels.
Nominal Level of Measurement
The nominal level of measurement identifies variables whose values have no mathematical interpretation; they vary in kind or quality, but not in amount. In fact, it is conventional to refer to the values of nominal vari-ables as attributes instead of values. The variable gender has two attributes (or categories or qualities): male and female. We might indicate male by the value 1 and female by the value 2, but these numbers do not tell us anything about the difference between male and female except that they are different. Female is not one unit more of gender than male, nor is it twice as much gender. The numbers simply represent a category.
Nominal-level variables are commonplace in social work research. Such variables might include client characteristics such as ethnicity (e.g., African American, Hispanic, Asian American, White, Native
Level of measurement The mathematical precision with which the values of a variable can be expressed. The nominal level of measurement, which is qualitative, has no mathematical interpretation; the quantitative levels of measurement—ordinal, interval, and ratio—are progressively more precise mathematically.
The Practice of Research in Social Work90
American, Other), marital status (e.g., Married, Widowed, Divorced, Separated, Never Married), or mental health diagnosis (e.g., Mood Disorder, Personality Disorder, Other Disorder). Service-related variables such as referral source or types of services used are nominal variables. A researcher might want to understand the differences between those who use respite care services for the elderly and those who do not use respite care services. Another researcher might want to distinguish the characteristics of people who are poor and people who are not poor. A third researcher might want to know whether the decision to place an older parent in a nursing home (placed: yes or no) is based on economic status and use of respite care services. Respite care use, poverty status, and nursing home placement are all nominal-level variables.
Although the attributes of categorical variables do not have a mathematical meaning, they must be assigned to cases with great care. The attributes we use to categorize cases must be mutually exclusive and exhaustive:
• A variable’s attributes or values are mutually exclusive if every case can have only one attribute.
• A variable’s attributes or values are exhaustive when every case can be classified into one of the categories.
Qua
litat
ive Nominal
or categoricallevel ofmeasurement:Nationality American Canadian British
Qua
ntita
tive
Low High
Interval levelof measurement:Temperaturein degreesFahrenheit
o30
60o
Ratio levelof measurement:Group size
5 7
Ordinal levelof measurement:Level of conflict
Exhibit 4.3 Levels of Measurement

Chapter 4 Measurement 91
When a variable’s attributes are mutually exclusive and exhaustive, every case corresponds to one and only one attribute.
The only mathematical operation we can perform with nominal-level variables is a count. We can count how many clients last month were females and how many were males. From that count, we can calculate the percentage or proportion of females to males among our clients. If the agency served 150 women and 100 men, then we can say that 60% of the clients were female. But we cannot identify an average gender, nor can we add or subtract or compute any other kind of number.
Ordinal Level of Measurement
The first of the three quantitative levels is the ordinal level of measurement. At this level, the numbers assigned to cases specify only the order of the cases, permitting greater than and less than distinctions. The gaps between the various responses do not have any particular meaning. As with nominal variables, the dif-ferent values of a variable measured at the ordinal level must be mutually exclusive and exhaustive. They must cover the range of observed values and allow each case to be assigned no more than one value.
The properties of variables measured at the ordinal level are illustrated in Exhibit 4.3 by the contrast between the levels of conflict in two groups. The first group, symbolized by two people shaking hands, has a low level of conflict. The second group, symbolized by two people pointing guns at each other, has a high level of conflict. To measure conflict, we would put the groups “in order” by assigning the number 1 to the low-conflict group and the number 2 to the high-conflict group. The numbers thus indicate only the relative position or order of the cases. Although low level of conflict is represented by the number 1, it is not one unit of conflict less than high level of conflict, which is represented by the number 2.
A common ordinal measure used in social service agencies is client satisfaction. Often agencies will ask a client a global question about satisfaction with the services provided by the agency, using a rating system such as 4 = very satisfied, 3 = satisfied, 2 = dissatisfied, and 1 = very dissatisfied. Someone who responds very satisfied, coded as 4, is clearly more satisfied than someone who responds dissatisfied, coded as 2, but the person respond-ing with a 4 is not twice as satisfied as the person responding with a 2. Nor is the person responding very satis-fied (4) two units more satisfied than the person responding dissatisfied (2). We do know that the first person is more satisfied than the second person, and therefore the order has meaning. We can count the number of clients who fall into each category. We can also compute an average satisfaction, but the average is not a quantity of satisfaction; rather, the number summarizes the relative position of the group on the given scale.
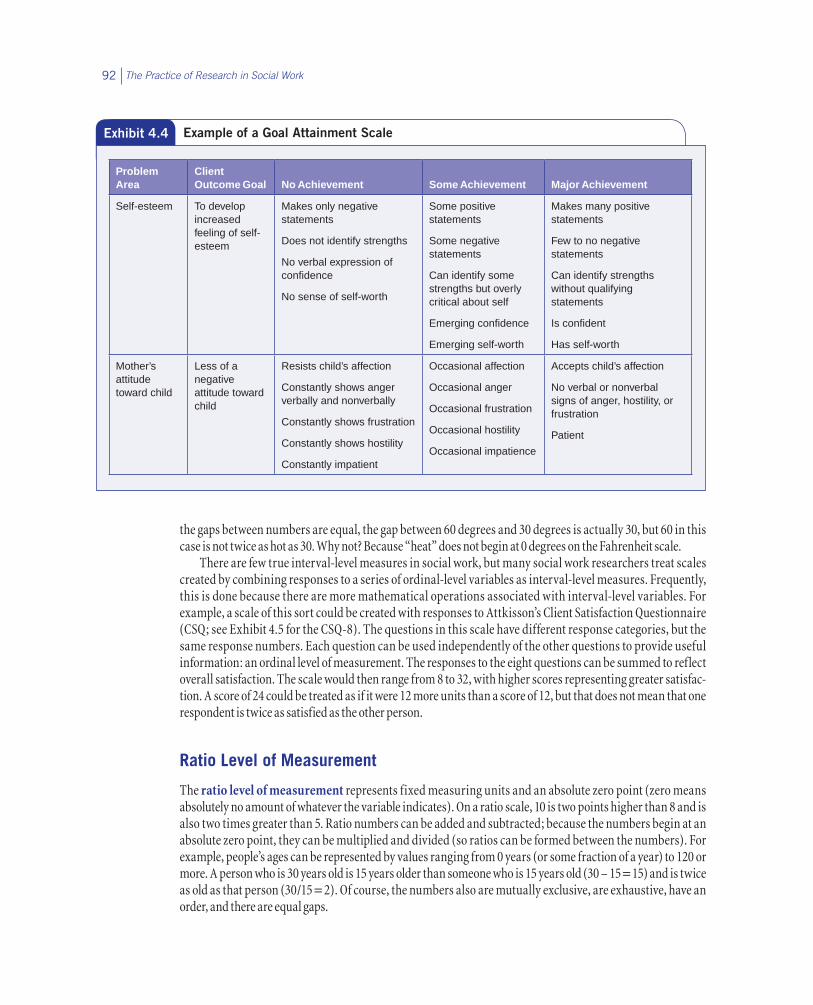
Agencies sometimes use goal attainment scales to measure the progress of a client in achieving a particu-lar goal. These scales are usually developed by describing the worst indicators, the best indicators, and several steps in between. The gap between the steps has no meaning, but the scoring represents the progress of the client. Exhibit 4.4 provides an example of a goal attainment scale to measure self-esteem and mother’s attitude toward children. The social worker evaluates the extent to which there is improvement in self-esteem based on the nature of the verbal and nonverbal responses of the client. There is an order to the levels of achieve-ment, and we can describe how many clients fall into each category, but we cannot calculate the average level of achievement using this scale.
Interval Level of Measurement
The values of a variable measured at the interval level of measurement represent fixed measurement units but have no absolute, or fixed, zero point. An interval level of measurement also has mutually exclusive cat-egories, the categories are exhaustive, and there is an order to the responses. Further, the gaps between the numbers of the scale are meaningful; a one-unit difference is the same at any point in the scale. This level of measurement is represented in Exhibit 4.3 by the difference between two Fahrenheit temperatures. Because
The Practice of Research in Social Work92
the gaps between numbers are equal, the gap between 60 degrees and 30 degrees is actually 30, but 60 in this case is not twice as hot as 30. Why not? Because “heat” does not begin at 0 degrees on the Fahrenheit scale.
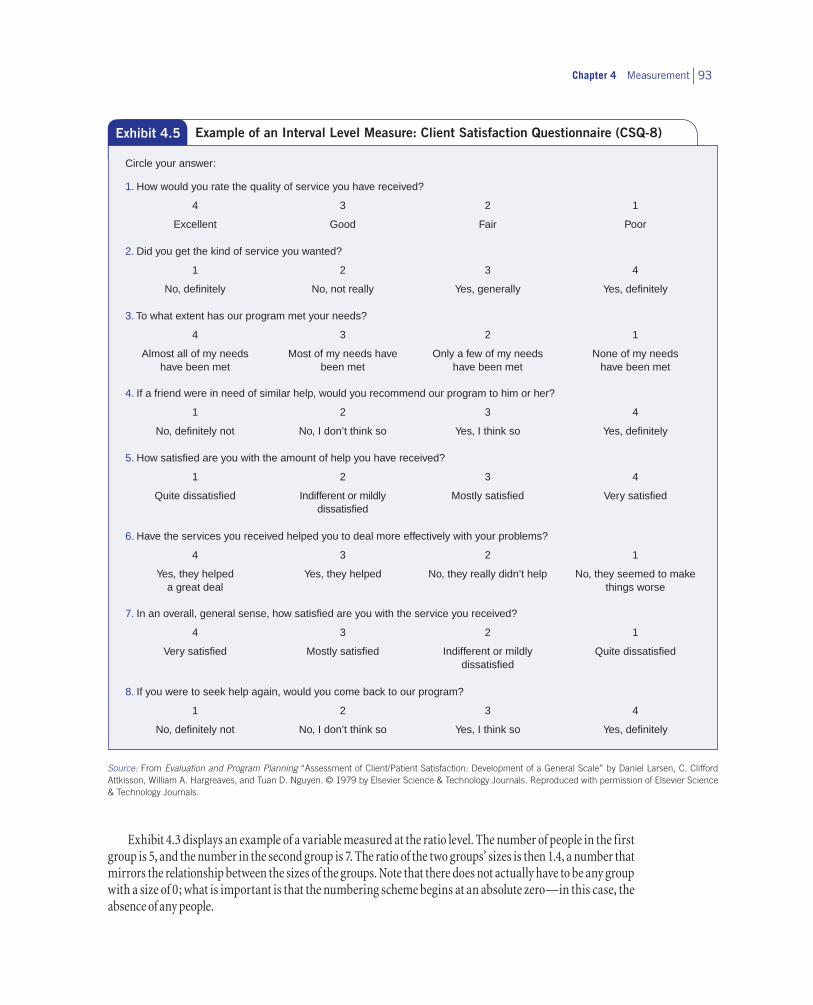
There are few true interval-level measures in social work, but many social work researchers treat scales created by combining responses to a series of ordinal-level variables as interval-level measures. Frequently, this is done because there are more mathematical operations associated with interval-level variables. For example, a scale of this sort could be created with responses to Attkisson’s Client Satisfaction Questionnaire (CSQ; see Exhibit 4.5 for the CSQ-8). The questions in this scale have different response categories, but the same response numbers. Each question can be used independently of the other questions to provide useful information: an ordinal level of measurement. The responses to the eight questions can be summed to reflect overall satisfaction. The scale would then range from 8 to 32, with higher scores representing greater satisfac-tion. A score of 24 could be treated as if it were 12 more units than a score of 12, but that does not mean that one respondent is twice as satisfied as the other person.
Ratio Level of Measurement
The ratio level of measurement represents fixed measuring units and an absolute zero point (zero means absolutely no amount of whatever the variable indicates). On a ratio scale, 10 is two points higher than 8 and is also two times greater than 5. Ratio numbers can be added and subtracted; because the numbers begin at an absolute zero point, they can be multiplied and divided (so ratios can be formed between the numbers). For example, people’s ages can be represented by values ranging from 0 years (or some fraction of a year) to 120 or more. A person who is 30 years old is 15 years older than someone who is 15 years old (30 – 15 = 15) and is twice as old as that person (30/15 = 2). Of course, the numbers also are mutually exclusive, are exhaustive, have an order, and there are equal gaps.
Exhibit 4.4 Example of a Goal Attainment Scale
Problem Area
Client Outcome Goal
No Achievement
Some Achievement
Major Achievement
Self-esteem To develop increased feeling of self-esteem
Makes only negative statements
Does not identify strengths
No verbal expression of confidence
No sense of self-worth
Some positive statements
Some negative statements
Can identify some strengths but overly critical about self
Emerging confidence
Emerging self-worth
Makes many positive statements
Few to no negative statements
Can identify strengths without qualifying statements
Is confident
Has self-worth
Mother’s attitude toward child
Less of a negative attitude toward child
Resists child’s affection
Constantly shows anger verbally and nonverbally
Constantly shows frustration
Constantly shows hostility
Constantly impatient
Occasional affection
Occasional anger
Occasional frustration
Occasional hostility
Occasional impatience
Accepts child’s affection
No verbal or nonverbal signs of anger, hostility, or frustration
Patient
Chapter 4 Measurement 93
Source: From Evaluation and Program Planning “Assessment of Client/Patient Satisfaction: Development of a General Scale” by Daniel Larsen, C. Clifford Attkisson, William A. Hargreaves, and Tuan D. Nguyen. © 1979 by Elsevier Science & Technology Journals. Reproduced with permission of Elsevier Science & Technology Journals.
Exhibit 4.5 Example of an Interval Level Measure: Client Satisfaction Questionnaire (CSQ-8)
1. How would you rate the quality of service you have received?
4 3 2 1
Excellent Good Fair Poor
2. Did you get the kind of service you wanted?
1 2 3 4
No, definitely No, not really Yes, generally Yes, definitely
3. To what extent has our program met your needs?
4 3 2 1
Almost all of my needs have been met
Most of my needs have been met
Only a few of my needs have been met
None of my needs have been met
4. If a friend were in need of similar help, would you recommend our program to him or her?
1 2 3 4
No, definitely not No, I don’t think so Yes, I think so Yes, definitely
5. How satisfied are you with the amount of help you have received?
1 2 3 4
Quite dissatisfied Indifferent or mildly dissatisfied
Mostly satisfied Very satisfied
6. Have the services you received helped you to deal more effectively with your problems?
4 3 2 1
Yes, they helped a great deal
Yes, they helped No, they really didn’t help No, they seemed to make things worse
7. In an overall, general sense, how satisfied are you with the service you received?
4 3 2 1
Very satisfied Mostly satisfied Indifferent or mildly dissatisfied
Quite dissatisfied
8. If you were to seek help again, would you come back to our program?
1 2 3 4
No, definitely not No, I don’t think so Yes, I think so Yes, definitely
Circle your answer:
Exhibit 4.3 displays an example of a variable measured at the ratio level. The number of people in the first group is 5, and the number in the second group is 7. The ratio of the two groups’ sizes is then 1.4, a number that mirrors the relationship between the sizes of the groups. Note that there does not actually have to be any group with a size of 0; what is important is that the numbering scheme begins at an absolute zero—in this case, the absence of any people.

The Practice of Research in Social Work94
Ratio-level variables are common in social work practice and research. We can report to supervisors the number of clients in a program, the time spent providing counseling, or the number of hot meals delivered to homebound elderly. We can describe a community by the number of community development organiza-tions, the number of abandoned buildings, or the number of afterschool programs. In each case, the answer 0 is meaningful, representing the complete absence of the variable.
The Case of Dichotomies
Dichotomies, variables having only two values, are a special case from the standpoint of levels of measure-ment. The values or attributes of a variable such as depression clearly vary in kind or quality, not in amount. Thus, the variable is categorical—measured at the nominal level. Yet in practical terms, we can think of the variable in a slightly different way, as indicating the presence of the attribute depressed or not depressed. Viewed in this way, there is an inherent order: A depressed person has more of the attribute (it is present) than a person who is not depressed (the attribute is not present). We are likely to act given the presence or absence of that attribute. We intervene or refer to treatment of a depressed client, whereas we would not do so with a client who was not depressed. Nonetheless, although in practical terms there is an order, empirically we treat a dichotomous variable as a nominal variable.
Types of Comparisons
Exhibit 4.6 summarizes the types of comparisons that can be made with different levels of measurement, as well as the mathematical operations that are legitimate. All four levels of measurement allow research-ers to assign different values to different cases. All three quantitative measures allow researchers to rank cases in order.
Researchers choose levels of measurement in the process of operationalizing the variables; the level of measurement is not inherent in the variable. Many variables can be measured at different levels with different procedures. For example, the Core Alcohol and Drug Survey (Core Institute, 1994) identifies binge drinking by asking students, “Think back over the last two weeks. How many times have you had five or more drinks at a sitting?” You might be ready to classify this as a ratio-level measure. However, this is a closed-ended question, and students are asked to indicate their answer by checking None, Once, Twice, 3 to 5 times, 6 to 9 times, or 10 or more times. Use of these categories makes the level of measurement ordinal. The distance between any two cases cannot be clearly determined. A student with a response in the 6 to 9 times category could have binged just one more time than a student who responded 3 to 5 times. You just can’t tell.
Exhibit 4.6 Properties of Measurement Levels
Relevant level of measurement
Examples of comparison statements
Appropriate math operations
Nominal
Ordinal
Interval
Ratio
A is equal to (not equal to) B = … o o o o
A is greater than (less than) B > (<) o o o
A is three more than (less than) B + (–) o o
A is twice (half) as large as B × (÷) o

Chapter 4 Measurement 95
It is a good idea to try to measure variables at the highest level of measurement possible if doing so does not distort the meaning of the concept that is to be measured. The more information available, the more ways we have to compare cases. We also have more possibilities for statistical analysis with quantitative than with qualitative variables. Furthermore, you can create ordinal or nominal variables from ratio-level variables, but you cannot go in the reverse direction. For example, you can measure age in years rather than in categories. If you know the actual age, you can combine the ages into categories at a later time. When asking people to respond to age by category, you cannot modify that variable to reflect their actual age.
Be aware, however, that other considerations may preclude measurement at a high level. For example, many people are reluctant to report their exact incomes even in anonymous questionnaires. So asking respon-dents to report their income in categories (e.g., less than $10,000, $10,000–19,999, $20,000–29,999) will result in more responses, and thus more valid data, than asking respondents for their income in dollars.
22 Measurement Error
No matter how carefully we operationalize and design our measures, no measure is perfect, and there will be some error. It might be that the measurement instrument needs to be corrected or reevaluated. Sometimes people are simply inconsistent in the way that they respond to questions. For example, the U.S. Census Bureau’s Survey of Income and Program Participation 1984 Panel included data collected nine times, with 4 months between interviews. Using this data set, Engel (1988) completed a study on poverty and aging. One of the ques-tions dealt with marital status, seemingly an easy question to answer and one that should provide consistent responses. It turned out that a portion of the sample, primarily women, kept moving from divorced to widowed and sometimes back to divorced. On reflection, this made sense because, among members of this cohort of older adults (born between 1900 and 1919), divorce was a less acceptable social status than being a widow.
In gathering data, we get a response from the participant, this response being the reported score. The reported score is not necessarily the true score or the true response because of the imperfections of measure-ment. The true response differs from the reported response because of measurement error, of which there are two types: systematic error and random error.
Systematic error is generally considered to be a predictable error, in that we can predict the direction of the error. Think about weighing yourself on a scale each day. You find that if you put a scale on a particular part of the floor in your house, you will always weigh less (reported score) than you actually do (true score). The placement of the scale creates a systematic or predictable error; in this case, your scale will always underreport your true weight.
There are different forms of systematic error, some of which we detail in later chapters, but each of these forms of systematic error reflects some bias:
• Social desirability. Social desirability bias occurs when respondents wish to appear most favorable in the eyes of the interviewer or researcher. For example, in the 1980s, polling information about elec-tions between African American Democratic candidates and White Republican candidates typically showed larger victory margins anticipated for the Democratic candidate than actually occurred in the election. One factor was the unwillingness of White Democrats to admit they were unwilling to vote for an African American, even of the same political party, as this would have made the respondents appear less favorable in the eyes of the interviewer.
• Acquiescence bias. There is a tendency for some respondents to agree or disagree with every statement, regardless of whether they actually agree.
The Practice of Research in Social Work96
• Leading questions. Leading questions have language that is designed to influence the direction of a respondent’s answer. There are many different ways in which this might be done. You might encounter words that have a negative connotation in society (regardless of the reason). For example, during the 1980s, the use of the words liberal and welfare began to take on negative connotations. So a question like “Do you support the liberal position on . . . ?” is meant to lead people to disagree with the position. Another form of a leading question is to use the names of controversial people in the question. A third way of evoking certain responses is simply to include some responses to a question in the actual ques-tion, but not all the responses.
To avoid systematic error requires careful construction of scales and questions and the testing of these questions with different population groups. We explore these methods in depth in Chapter 9.
Unlike systematic error, random error is unpredictable in terms of its effects. Random error may be due to the way respondents are feeling that particular day. Respondents may be fatigued, bored, or not in a coop-erative mood. In contrast, they may be having a great day. Respondents may also be affected by the conditions of the testing. The lighting may be bad, the room may be noisy, the seating may be cramped, the lack of walls in the cubicle may mean other people can hear, there may be other people in the room, or they may not like the looks of the person gathering the information.
Another form of random error is regression to the mean. This is the tendency of people who score very high on some measure to score less high the next time or the reverse, and for people who score very low to score higher. What might have influenced the high or low score on the first test may not operate in the second test.
Random error might occur when researchers rating behaviors are not adequately trained to do the rating. For example, two people grading an essay test might come up with different grades if they have not discussed the grading criteria beforehand. A field supervisor and a student might assess a client differently given the variation in their years of experience.
As we have already said, the effects of random error cannot be predicted: Some responses overestimate the true score, whereas other responses underestimate the true score. Many researchers believe that if the sample size is sufficiently large, the effects of random error cancel each other out. Nonetheless, we want to use mea-surement scales and questions that are stable to minimize as much as possible the effects of random error.
22 Evaluating Measures
Do the operations to measure our variables provide stable or consistent responses—are they reliable? Do the operations developed to measure our concepts actually do so—are they valid? When we test the effectiveness of two different interventions or when we monitor the progress our client is making, we want the changes we observe to be due to the intervention and not the measurement instrument. We also want to know that the measure we use is really a measure of the outcome and not a measure of some other outcome. We cannot have much confidence in a measure until we have empirically evaluated its reliability and validity.
Reliability
Reliability means that a measurement procedure yields consistent or equivalent scores when the phenom-enon being measured is not changing (or that the measured scores change in direct correspondence to actual changes in the phenomenon). If a measure is reliable, it is affected less by random error or chance variation
Chapter 4 Measurement 97
than if it is unreliable. Reliability is a prerequisite for measurement validity: We cannot really measure a phe-nomenon if the measure we are using gives inconsistent results. In fact, because it usually is easier to assess reliability than validity, you are more likely to see an evaluation of measurement reliability in a research report than an evaluation of measurement validity.
There are four possible indications of unreliability. For example, a test of your knowledge of research methods would be unreliable if every time you took it you received a different score, although your knowledge of research methods had not changed in the interim, not even as a result of taking the test more than once (test–retest reliability). Similarly, a scale composed of questions to measure knowledge of research methods would be unreliable if respondents’ answers to each question were totally independent of their answers to the others (internal consistency). A measure also would be unreliable if slightly different versions of it resulted in markedly different responses (alternate-forms reliability). Finally, an assessment of knowledge of research would be unreliable if ratings of the level of such knowledge (such as grading on a research paper) differ for two observers (interrater reliability).
Test–Retest Reliability
When researchers measure a phenomenon that does not change between two points separated by an interval of time, the degree to which the two measurements are related to each other is the test–retest reliability of the measure. If you take a test of your research methodology knowledge and retake the test 2 months later, the test is performing reliably if you receive a similar score both times—presuming that nothing happened during the 2 months to change your research methodology knowledge. We hope to find a correlation between the two tests of about .7 and prefer even a higher correlation, such as .8.
Of course, if events between the test and the retest have changed the variable being measured, then the dif-ference between the test and retest scores should reflect that change. As the gap in time between the two tests increases, there is a greater likelihood that real change did occur. This also presumes that you were not affected by the conditions of the testing: a testing effect. The circumstances of the testing, such as how you were given the test, or environmental conditions, such as lighting or room temperature, may impact test scores. The test-ing effect may extend to how you felt the first time you took the test; because you did not know what to expect the first time, you may have been very nervous, as opposed to the second time, when you knew what to expect.
Radloff ’s (1977) initial effort to evaluate the test–retest reliability of the CES–D highlights the difficulties that may emerge from the testing and that make interpreting the scores problematic. A probability sample of households was taken in one county; within each household, one person 18 years or older was randomly cho-sen to participate in an interview. Each person was also asked to complete and mail back a CES–D scale either 2, 4, 6, or 8 weeks after the initial interview. Only 419 of the initial 1,089 respondents sent back mail question-naires. The test–retest correlations were moderately high, ranging from .51 at 2 weeks to .59 at 8 weeks. Radloff offered a variety of explanations about the moderate correlations, which included such methodological prob-lems as the bias introduced by nonresponse (maybe those who responded differed from those who did not respond), the problem of using an interview at Time 1 and a self-administered questionnaire for the follow-up (perhaps people responded differently to the interviewer than to the questionnaire), and the effects of being tested twice. Furthermore, she noted that the CES–D was meant to capture depressive symptoms in a 1-week period, and perhaps there had been real changes. This example illustrates how test–retest reliability scores may potentially be affected by real change or by the effect of testing.
Internal Consistency
When researchers use multiple items to measure a single concept, they are concerned with internal consis-tency. For example, if the items composing the CES–D (like those in Exhibit 4.2) reliably measure depression, the answers to the questions should be highly associated with one another. The stronger the association among the individual items and the more items that are included, the higher the reliability of the scale.
The Practice of Research in Social Work98
One method to assess internal consistency is to divide the scale into two parts, or split-half reliability. We might take a 20-item scale, such as the CES–D, and sum the scores of the first 10 items, sum the scores of the second 10 items (items 11–20), and then correlate the scores for each of the participants. If we have internal consistency, we should have a fairly high correlation, such as .8 or .9. This correlation typically gets higher the more items there are in the scale. So what may be considered a fairly high split-half reliability score for a 6-item scale might not be considered a high score for a 20-item scale.
As you can imagine, there are countless ways in which you might split the scale, and in practical terms, it is nearly impossible to split the scale by hand into every possible combination. Fortunately, the speed of com-puters allows us to calculate a score that indeed splits the scale in every combination. A summary score, such as Cronbach’s alpha coefficient, is the average score of all the possible split-half combinations. In Radloff ’s (1977) study, the alpha coefficients of different samples were quite high, ranging from .85 to .90.
Alternate-Forms Reliability
Researchers are testing alternate-forms reliability (or parallel-forms reliability) when they compare sub-jects’ answers to slightly different versions of survey questions (Litwin, 1995). A researcher may reverse the order of the response choices in a scale, modify the question wording in minor ways, or create a set of different questions. The two forms are then administered to the subjects. If the two sets of responses are not too differ-ent, alternate-forms reliability is established.
You might remember taking the SATs or ACTs when you were in high school. When you compared ques-tions with your friends, you found that each of you had taken different tests. The developers had assessed the tests using alternate-forms reliability to ensure that the different forms were equivalent and comparable.
Interrater Reliability
When researchers use more than one observer to rate the same people, events, or places, interrater reliability (or interobserver reliability) is their goal. If observers are using the same instrument to rate the same thing, their ratings should be similar. If they are similar, we can have much more confidence that the ratings reflect the phenomenon being assessed, rather than the orientations of the observers.
Assessing interobserver reliability is most important when the rating task is complex. Consider a com-monly used measure of mental health, the Global Assessment of Functioning Scale (GAF). The rating task seems straightforward, with clear descriptions of the subject characteristics that are supposed to lead to high or low GAF scores. However, the judgments that the rater must make while using this scale are complex. They are affected by a wide range of subject characteristics, attitudes, and behaviors, as well as by the rater’s reac-tions. As a result, interrater agreement is often low on the GAF unless the raters are trained carefully.
Assessments of interrater reliability may be based on the correlation of the rating between two raters. Two raters could evaluate the quality of play between five teenage mothers and their children on a 10-point scale. The correlation would show whether the direction of the raters’ scores was similar as well as how close the agreement was for the relative position for each of the five scores. One rater may judge the five mothers as 1, 2, 3, 4, and 5, whereas the second rater scores the mothers as 6, 7, 8, 9, and 10. The correlation would be quite high—in fact, the correlation would be perfect. But as demonstrated by this example, the agreement about the quality of the interactions was quite different. So an alternative method is to estimate the percentage of exact agreement between the two raters. In this case, the rater agreement is zero.
Intrarater Reliability
Intrarater reliability occurs when a single observer is assessing an individual at two or more points in time. It differs from test–retest reliability in that the ratings are done by the observer as opposed to the subjects. Intrarater reliability is particularly important when you are evaluating a client’s behavior or making
Chapter 4 Measurement 99
judgments about the client’s progress. Although the GAF has been found to have low interobserver reliability, it has been found to have pretty high intraobserver reliability. It turns out that although different raters dis-agree, a single rater tends to provide consistent reports about an individual.
Measurement Validity
In Chapter 1, you learned that measurement validity refers to the extent to which measures indicate what they are intended to measure. More technically, a valid measure of a concept is one that is (a) closely related to other apparently valid measures of the concept, (b) closely related to the known or supposed correlates of that concept, and (c) not related to measures of unrelated concepts (adapted from Brewer & Hunter, 2005). Measurement validity is assessed with four different approaches: face validation, content validation, criterion validation, and construct validation.
Face Validity
Researchers apply the term face validity to the confidence gained from careful inspection of a concept to see whether it is appropriate “on its face.” A measure is face valid if it obviously pertains to the meaning of the concept being measured more than to other concepts (Brewer & Hunter, 2005). For example, a count of how many drinks people consumed in the past week would be a face-valid measure of their alcohol consumption.
Although every measure should be inspected in this way, face validation does not provide any evidence of measurement validity. The question “How much beer or wine did you have to drink last week?” looks valid on its face as a measure of frequency of drinking, but people who drink heavily tend to underreport the amount they drink. So the question would be an invalid measure in a study that includes heavy drinkers.
Content Validity
Content validity establishes that the measure covers the full range of the concept’s meaning. To determine that range of meaning, the researcher may solicit the opinions of experts and review literature that identifies the different aspects or dimensions of the concept.
An example of an alcoholism measure that covers a wide range of meaning is the MAST. The MAST includes 24 questions representing the following subscales: recognition of alcohol problems by self and others; legal, social, and work problems; help seeking; marital and family difficulties; and liver pathology (Skinner & Sheu, 1982). Many experts familiar with the direct consequences of substance abuse agree that these dimen-sions capture the full range of possibilities. Thus, the MAST is believed to be valid from the standpoint of content validity.
In contrast, experts may disagree with the range of content provided in a scale. The CES–D depression scale includes various dimensions of somatic symptoms and negative feelings. Some experts (e.g., Liang, Tran, Krause, & Markides, 1989) have questioned the presence of some items such as “feeling fearful” or “people dislike me,” suggesting that these items are not reflective of the dimensions of depression.
This example illustrates one of the difficulties in relying solely on face or content validity. In the end, they are subjective assessments of validity and, therefore, are weaker forms of validity than the next two types of validity, which are based on empirical assessments.
Criterion Validity
Criterion validity is established when the scores obtained on one measure are similar to scores obtained with a more direct or already validated measure of the same phenomenon (the criterion). A measure of blood-alcohol concentration or a urine test could serve as the criterion for validating a self-report measure of
The Practice of Research in Social Work100
drinking as long as the questions we ask about drinking refer to the same period. A measure of depression could be compared to another accepted self-administered depression scale. SAT or ACT scores could be com-pared to academic success in college. In each of these cases, the measure is being compared to some criterion believed to measure the same construct.
The criterion that researchers select can be measured either at the same time as the variable to be validated or after that time. Concurrent validity exists when a measure yields scores that are closely related to scores on a criterion measured at the same time. A store might validate its test of sales ability by administering the test to sales personnel who are already employed and then comparing their test scores to their sales performance. A measure of walking speed based on mental counting might be validated concurrently with a stop watch. Predictive validity is the ability of a measure to predict scores on a criterion measured in the future. For example, a store might administer a test of sales ability to new sales personnel and then validate the measure by comparing these test scores with the criterion—the subsequent sales performance of the new personnel.
An attempt at criterion validation is well worth the effort because it greatly increases confidence that the measure is measuring what was intended. However, for many concepts of interest to social work researchers, no other variable might reasonably be considered a criterion. If we are measuring feelings, beliefs, or other subjective states, such as feelings of loneliness, what direct indicator could serve as a criterion?
Construct Validity
Measurement validity can also be established by showing that a measure is related to a variety of other mea-sures as specified in a theory. This validation approach, known as construct validity, is commonly used in social research when no clear criterion exists for validation purposes. This theoretical construct validation process relies on using a deductive theory with hypothesized relationships among the constructs (Koeske, 1994). The measure has construct validity (or theoretical construct validity) if it “behaves” as it should relative to the other constructs in the theory. For example, Danette Hann, Kristin Winter, and Paul Jacobsen (1999) compared subject scores on the CES–D to a number of indicators that they felt from previous research and theory should be related to depression: fatigue, anxiety, and global mental health. The researchers found that individuals with higher CES–D scores tended to have more problems in each of these areas, giving us more confidence in the CES–D’s validity as a measure.
A somewhat different approach to construct validation is discriminant validity. In this approach, scores on the measure to be validated are compared to scores on another measure of the same variable and to scores on variables that measure different but related concepts. Discriminant validity is achieved if the measure to be validated is related most strongly to its comparison measure and less so to the measures of other concepts. The CES–D would demonstrate discriminant validity if the scale scores correlated strongest with the Beck Depression Inventory (a validated scale to measure depression) and correlate lower with the Beck Anxiety Inventory (a validated scale to measure anxiety).
Convergent validity is achieved when you can show a relationship between two measures of the same construct that are assessed using different methods (Koeske, 1994). For example, we might compare the CES–D scale scores to clinical judgments made by practitioners who have used a clinical protocol. The CES–D scores should correlate with the scores obtained from the clinical protocol.
Another approach to construct validity is referred to as known-groups validity. In this method, we might have two groups with known characteristics, and we compare our measure across these two groups. We would expect that our measure should score higher with the group that it is related to and lower with the unrelated group. For example, we might give the CES–D to a group of people who have been clinically diagnosed as depressed and to a group that does not have a clinical diagnosis of depression. We would expect the CES–D scores to be higher among those clinically depressed than those who have no clinical diagnosis.
Finally, another method that has become associated with construct validity is factoral validity. This approach relies on factor analysis and, in many ways, is simply an empirical extension of content analysis. This
Chapter 4 Measurement 101
procedure is usually applied when the construct of interest has different dimensions. In the analysis, we look to see whether the items thought to be measuring the same dimension are more highly related to each other than to items measuring other dimensions. The CES–D scale has been hypothesized to have four dimensions: negative affect, positive affect (lack), somatic symptoms, and interpersonal. Several items are associated with each dimension. Therefore, a factor analysis would test whether the items measuring negative affect are more highly related to each other than to items measuring somatic symptoms. Negative affect items such as feel-ing blue, sad, depressed, and the like should have stronger relationships to each other than to items measuring somatic symptoms such as overeating, sleeping too much, or difficulty concentrating. A test of factoral validity would assess the expected internal theoretical relationships of the construct.
The distinction between criterion and construct validation is not always clear. Opinions can differ about whether a particular indicator is indeed a criterion for the concept that is to be measured. Koeske (1994) sug-gests that a key difference is simply that with criterion validity, “the researcher’s primary concern is with the criterion in a practical context, rather than with the theoretical properties of the construct measure” (p. 50). What if you want to validate a question-based measure of the amount of social support that people receive from their friends? Should you just ask people about the social support they have received? Could friends’ reports of the amount of support they provided serve as a criterion? Are verbal accounts of the amount of support provided adequate? What about observations of social support that people receive? Even if you could observe people in the act of counseling or otherwise supporting their friends, can an observer be sure that the interaction is indeed supportive? There isn’t really a criterion here, just related concepts that could be used in a construct validation strategy.
What both construct and criterion validation have in common is the comparison of scores on one measure to scores on other measures that are predicted to be related. It is not so important that researchers agree that a particular comparison measure is a criterion rather than a related construct. But it is very important to think critically about the quality of the comparison measure and whether it actually represents a different view of the same phenomenon.
Screening and Cut-Off Scores
Many scales do not just measure the range or intensity of some phenomenon, but are also used as screening methods to make educated guesses about the presence or absence of some clinical condition. The CES–D has been used not only to measure the level of depressive symptoms, but also to determine whether someone might suffer from depression. Scores on the CES–D scale may range from 0 to 60; people with scores above 16 may be classified as depressed, whereas people below 16 may be classified as not depressed. This score a called a cut-off score and is used to define the presence or absence of a particular condition.
For a variety of reasons, we would like cut-off scores that are as accurate as possible. If not, we risk expend-ing limited resources on what may turn out to be an inaccurate assessment, we risk missing individuals with the condition, and we risk labeling clients with a condition they might not actually have. Therefore, it is important that the validity of a cut-off score be assessed. Typically, this is done by comparing the scale’s clas-sifications to an established clinical evaluation method or to an already-known condition. For example, the MAST cut-off score might be evaluated against a urinalysis. The CES–D cut-off score might be compared with a clinical diagnosis using the DSM–IV–TR.
A summary of the analysis of the validity of a cut-off is presented in Exhibit 4.7. Each cell provides infor-mation about the overall accuracy of the instrument. If the cut-off score provides an accurate assessment, there should be a high proportion of cases being either a true negative (cell a) or a true positive (cell d). A true negative occurs when, based on the scale, the client is assessed as not having a problem and really does not have the problem. A true positive occurs when it is determined from the obtained scale score that the client has a problem and the client really does have the problem based on the clinical evaluation. There should be

The Practice of Research in Social Work102
few cases of mistakes, such as either a false negative (cell b) or a false positive (cell c). A false negative occurs when, based on the scale score, you conclude that the client does not have the problem, but the client really does have the problem. A false positive occurs when you conclude from the scale score that the client does have a significant problem, but in reality that person does not have the problem.
Researchers use different measures to establish the validity of the cut-off scores. Sensitivity describes the true positive cell. It is a proportion based on the number of people who are assessed as having the condi-tion (d) relative to the number of people who actually have the condition, (b + d) or d/(b + d). Specificity describes the true negative cell. It is a proportion based on the number of people assessed as not having a condition (cell a) relative to the number who really do not have the condition (a + c); its mathematical for-mula is a/(a + c). False-negative rates and false-positive rates are similarly calculated. The proportion of false negatives is calculated by comparing the number of false negatives in cell b to the total number who actually have the clinical condition, (b + d) or b/(b + d). The proportion of false positives is calculated by comparing the number of assessed as having the condition (cell c) to the total number who actually do not have the clini-cal condition, (a + c) or c/(a + c).
Ideally, we would like both the sensitivity and specificity of the scale’s cut-off scores to be high so that we make few mistakes. Yet there are tradeoffs. If we really wanted to capture all the true positives, we would have to ease the criteria by reducing the cut-off score. This will increase sensitivity, but will also likely result in more false positives, which means a lower specificity. If we make it more difficult to test positive, for example, by setting a higher cut-off score, we will increase the specificity, but we will get more false negatives, and therefore sensitivity will decline.
Two other types of estimates you will see are the positive predictive value and the negative predictive value. The positive predictive value is the proportion of people who actually have the condition (d) compared to the number who were assessed by the screening tool as having the condition (c + d), that is, d/(c + d). The negative predictive value is the proportion of all those who actually do not have the condition (a) compared to all those who were assessed as having the condition (a + b), that is, a/(a + b). The ability to predict accurately is useful when we decide to use a screening scale to get some sense of how prevalent a particular condition is in the community. So if we wanted to assess how common depression is in the community, we would want high predictive values.
Ways to Improve Reliability and Validity of Existing Measures
A reliable measure is not necessarily a valid measure, as Exhibit 4.8 illustrates. This discrepancy is a common f law of self-report measures of substance abuse. The multiple questions in self-report scales of substance abuse are answered by most respondents in a consistent way, so the scales are reliable. However, a number of respondents will not admit to drinking even though they drink a lot. Their answers to the questions are
Exhibit 4.7 Outcomes of Screening Scale Versus Clinical Assessment
Actual Diagnosis for the Clinical Condition
Screening Scale Result Client does not have clinical condition
Client has clinical condition
Total
Assessed as not having condition True negative (a) False negative (b) a + b
Assessed as having the condition False positive (c) True positive (d) c + d
Total a + c b + d
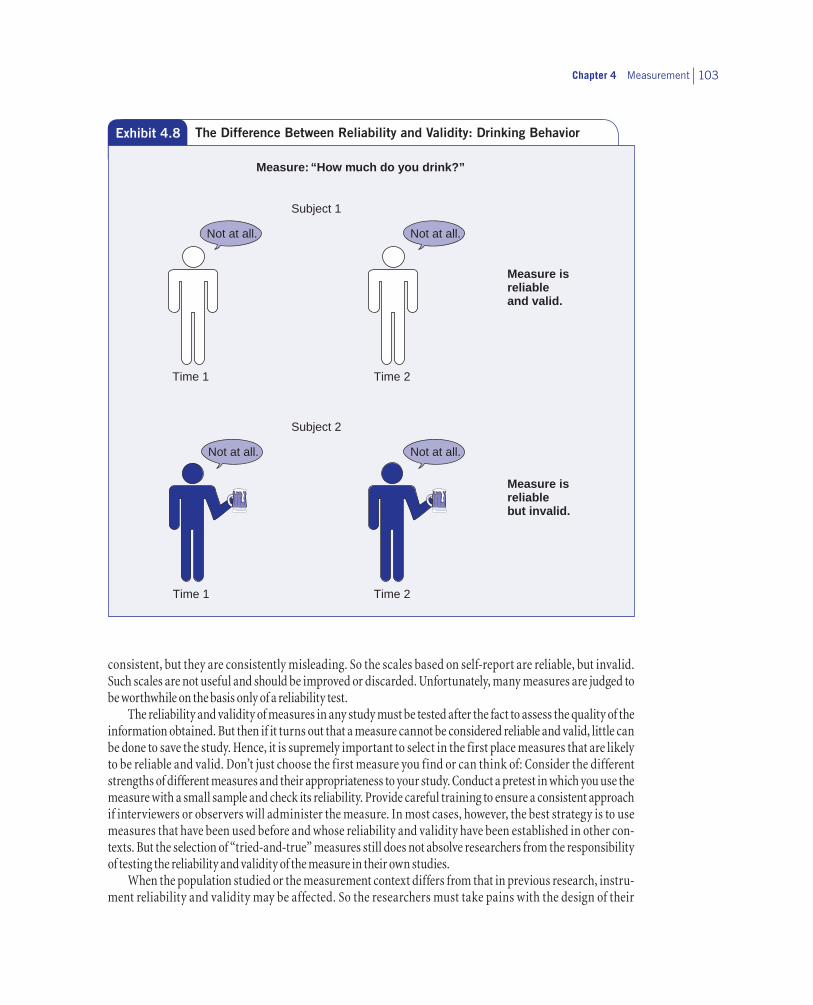
Chapter 4 Measurement 103
consistent, but they are consistently misleading. So the scales based on self-report are reliable, but invalid. Such scales are not useful and should be improved or discarded. Unfortunately, many measures are judged to be worthwhile on the basis only of a reliability test.
The reliability and validity of measures in any study must be tested after the fact to assess the quality of the information obtained. But then if it turns out that a measure cannot be considered reliable and valid, little can be done to save the study. Hence, it is supremely important to select in the first place measures that are likely to be reliable and valid. Don’t just choose the first measure you find or can think of: Consider the different strengths of different measures and their appropriateness to your study. Conduct a pretest in which you use the measure with a small sample and check its reliability. Provide careful training to ensure a consistent approach if interviewers or observers will administer the measure. In most cases, however, the best strategy is to use measures that have been used before and whose reliability and validity have been established in other con-texts. But the selection of “tried-and-true” measures still does not absolve researchers from the responsibility of testing the reliability and validity of the measure in their own studies.
When the population studied or the measurement context differs from that in previous research, instru-ment reliability and validity may be affected. So the researchers must take pains with the design of their
Subject 1
Time 1
Time 2
Subject 2
Time 1
Time 2
Measure isreliableand valid.
Measure isreliablebut invalid.
Not at all. Not at all.
Not at all. Not at all.
Measure: “How much do you drink?”
Exhibit 4.8 The Difference Between Reliability and Validity: Drinking Behavior
The Practice of Research in Social Work104
study. For example, test–retest reliability has proved to be better for several standard measures used to assess substance use among homeless people when the interview was conducted in a protected setting and when the measures focused on factual information and referred to a recent time interval (Drake, McHugo, & Biesanz, 1995). Subjects who were younger, female, recently homeless, and less severely afflicted with psychi-atric problems were also more likely to give reliable answers.
If the research focuses on previously unmeasured concepts, new measures will have to be devised. Researchers can use one of three strategies to improve the likelihood that new question-based measures will be reliable and valid (Fowler, 1995):
1. Engage potential respondents in group discussions about the questions to be included in the survey. This strategy allows researchers to check for consistent understanding of terms and to hear the range of events or experiences that people will report.
2. Conduct cognitive interviews. Ask people a test question, and then probe with follow-up questions about how they understood the question and what their answer meant.
3. Audiotape test interviews during the pretest phase of a survey. The researchers then review these audio-tapes and systematically code them to identify problems in question wording or delivery.
22 Measurement in a Diverse Society
Throughout this chapter, we have suggested that measurement is crucial not just for research, but for every aspect of social work practice. Whether a researcher is examining the prevalence of alcohol abuse in the com-munity or a social worker is assessing substance abuse with a client, it is important to use the best available method. Although it is crucial to have evidence of reliability and validity, it is important that such evidence cut across the different populations served by social workers. Often people of color, women, the poor, and other groups have not been adequately represented in the development or testing of various measurement instruments (S. Witkin, 2001). Just because a measure appears valid does not mean that you can assume cross-population generalizability.
It is reasonable to consider whether the concepts we use have universal meaning or differ across cultures or other groups. C. Harry Hui and Harry C. Triandis (1985) suggest that four components must be evaluated to determine whether a concept differs across cultures:
1. Conceptual equivalence. The concept must have the same meaning, have similar precursors and conse-quences, and relate to other concepts in the same way.
2. Operational equivalence. The concept must be evident in the same way so that the operationalization is equivalent.
3. Item equivalence. Items used must have the same meaning to each culture.
4. Scaler equivalence. The values used on a scale mean the same in intensity or magnitude.
Take, for example, the concept of self-esteem. Bae and Brekke (2003) note that cross-cultural research has found that Asian Americans typically have lower self-esteem scores than other ethnic groups. They hypothesized that Korean Americans would have lower scores on positively worded items than other ethnic groups, but would have similar scores on negatively worded items. They suggested that this response pattern would be
Chapter 4 Measurement 105
due to culture: “Giving high scores on the positive items is intrinsically against their collective culture in which presenting the self in a self-effacing and modest manner is regarded as socially desirable behavior to maintain social harmony” (p. 28). Bae and Brekke did find that overall self-esteem scores were lower among Korean Americans and that it was due to Korean Americans scoring lower on the positively worded items while scoring the same or higher than other ethnic groups on the negatively worded items.
Similar concerns have been noted for scales measuring depression. For example, Joy Newmann (1987) has argued that gender differences in levels of depressive symptoms may reflect differences in the socialization process of males and females. She suggests that some scales ask questions about items such as crying, being lonely, and feeling sad, which are more likely to be responded in the affirmative by women and not by men because men are socialized to not express such feelings. Stephen Cole, Ichiro Kawachi, Susan Maller, and Lisa Berkman (2000) did find that women were much more likely than men to endorse the item “feeling like crying” and suggested that it not be used. Similarly, Debra Ortega and Cheryl Richey (1998) note that people of color may respond differently to questions used in depression scales. Some ethnic groups report feelings of sadness or hopelessness as physical complaints and therefore have high scores on these questions, but low scores on emotion-related items. Different ethnic groups respond differently to “how do you feel” questions and “what do you think” questions. Ortega and Richey also note that some items in depression scales, such as suicidal ideation, are not meaningful to some ethnic groups. The elderly are more likely to endorse some items that also measure physical changes as opposed to changes brought about by depression (Sharp & Lipsky, 2002).
Biased scores can result in practical problems. For example, many scales include cut-off scores to dem-onstrate the presence or absence of a condition. If there is a response bias, the result could be the treatment of a condition that does not exist or not identifying a condition that does exist (Bae & Brekke, 2003). The failure to measure correctly may affect the ability to identify effective interventions. The relationship of different phenomena may be distorted because of measurement bias. Therefore, it is important to assess the samples used for validation and to use measures that have been validated with the population group to whom it will be administered.
22 Implications for Evidence-Based Practice
We hope we have convinced you that there is much that goes into developing and assessing measures. Measurement is an essential ingredient in social work practice, whether it be your assessment of a client or your monitoring and evaluation of your practice. Further, the studies you review depend, in part, on the qual-ity of the measurement; systematic errors can negate the validity of a particular study (M. Johnston, Sherer, & Whyte, 2006). You need to be confident that the evidence presented is due to the intervention and not the instability of the measurement instrument.
What should you consider when you examine the efficacy of a measure for your agency? In the previous sections, we have stressed the importance of measurement reliability and validity. That alone is insufficient because there should be evidence of the appropriateness of the measure for the population with whom it will be used. Therefore, when you review research about the reliability and validity of a measure, you need to look at the samples that were used in the studies. Too often these studies are done without consideration of gender, race, ethnicity, or age. It may be that the samples used in the studies look nothing like the population you are serving. If that is the case, the instrument may not be appropriate for your agency or setting.
The same holds true for scales that can be used for diagnostic purposes; there should be statistical evi-dence that the scale is accurate in its determination of correct (true positives and true negatives) diagnoses with few wrong (false positives and false negatives) diagnoses (Warnick, Weersing, Scahill, & Woolston, 2009).
The Practice of Research in Social Work106
Earlier, we described the CES–D as a commonly used scale with a more or less acceptable cut-off score of 16. On further inspection, researchers found that this score was too low to be useful with the elderly. Some item reports in the CES–D can be due to physical conditions that are common among the elderly. As a result, an appropriate cut-off score for elderly people with physical ailments has been determined to be 20 (Schein & Koenig, 1997). The bottom line is to take nothing for granted about cut-off scores described in the literature.
Of course, there are other practical considerations, including ease of administration, cost, sensitivity, reactivity, and acceptability to staff. Different methods of administration require different amounts of time to complete, as well as skill to gather the data. The measure should be affordable. Many useful measures and scales can be found in the public domain, but many other scales have to be purchased, and sometimes you must also pay for their scoring. The measure you use should be sufficiently sensitive to pick up changes in the outcome and contain a sufficient number of items that you are able to identify changes. To the extent possible, you want nonreactive measures that do not influence the responses that people provide. Finally, the measures have to be accepted by staff as measures that will provide valid information.
All of these were considerations we had to take into account when we were asked by a family service agency’s senior adult unit to recommend a short and simple screen for pathological gambling. The agency uses a 25- to 30-minute psychosocial assessment at intake, screening for a variety of social, economic, health, and mental health concerns, so it did not want something that would add terribly to the length of the assessment. At the same time, the agency wanted something that would be accurate, easy to use, and not offend its older clients. Ultimately, we found a reliable and valid two-item screen that could be added to the intake assessment.
Just as there are systematic reviews of intervention research, you may find systematic reviews of different measurement and screening instruments. For example, Henry O’Connell and his colleagues (2004) recently reviewed self-report alcohol screening instruments for older adults, and Warnick and colleagues (2009) reviewed measures to predict youth mental health.
As you read intervention research or other types of research studies or you develop a research proposal, there are important questions for you to consider. You should identify the major concepts in the study and assess whether the measure is clearly defined. Next, you should examine how the concepts are operationalized. Is the operational definition sufficient to capture the various dimensions of the concept? When scales are used, is there evidence of reliability and validity as well as the scale’s appropriateness for the specific study population? Our confidence in the measure is enhanced when the author reports methods used to enhance reliability of the measure, such as the specific training in collecting the information, or using multiple measures.
22 Conclusion
Remember always that measurement validity is a necessary foundation for social work research. Gathering data without careful conceptualization or conscientious efforts to operationalize key concepts often is a wasted effort. The difficulties of achieving valid measurement vary with the concept being operationalized and the circumstances of the particular study.
Planning ahead is the key to achieving valid measurement in your own research; careful evaluation is the key to sound decisions about the validity of measures in others’ research. Statistical tests can help to determine whether a given measure is valid after data have been collected, but if it appears after the fact that a measure is invalid, little can be done to correct the situation. If you cannot tell how key concepts were operationalized when you read a research report, don’t trust the findings. If a researcher does not indicate the results of tests used to establish the reliability and validity of key measures, remain skeptical.

Chapter 4 Measurement 107
Key Terms
Alternate-forms reliabilityConceptConceptualizationConcurrent validityConstantConstruct validityContent validityContinuous variableConvergent validityCriterion validityCronbach’s alpha coefficientCut-off scoreDirect measureDiscrete variableDiscriminant validityExhaustiveFace validity
Factoral validityFalse negativeFalse positiveInternal consistencyInterrater reliabilityInterval level of measurementIntrarater reliabilityKnown-groups validityLevel of measurementMultidimensional scaleMutually exclusiveNegative predictive valueNominal definitionNominal level of measurementOperational definitionOperationalizationOrdinal level of measurement
Positive predictive valuePredictive validityRandom errorRatio level of measurementReliabilityScaleSensitivitySpecificitySplit-half reliabilitySystematic errorTest–retest reliabilityTesting effectTriangulationTrue negativeTrue positiveUnobtrusive measures
Highlights
• Conceptualization plays a critical role in research. In deductive research, conceptualization guides the operationalization of specific variables; in inductive research, it guides efforts to make sense of related observations.
• Concepts may refer to either constant or variable phenomena. Concepts that refer to variable phenomena may be similar to the actual variables used in a study, or they may be much more abstract.
• Concepts should have a nominal definition and an operational definition. A nominal definition defines the concept in terms of other concepts, whereas the operational definition provides the specific rules by which you measure the concept.
• The intervention is often a variable requiring an operational defi-nition that describes the intervention in detail.
• Scales measure a concept by combining answers to several ques-tions and thereby reducing idiosyncratic variation. Several issues should be explored with every intended scale: Does each ques-tion actually measure the same concept? Does combining items in a scale obscure important relationships between individual questions and other variables? Is the scale multidimensional?
• Level of measurement indicates the type of information obtained about a variable and the type of statistics that can be used to describe its variation. The four levels of measure-ment can be ordered by complexity of the mathematical operations they permit: nominal (least complex), ordinal, interval, and ratio (most complex). The measurement level of a variable is determined by how the variable is operationalized. Dichotomies, a special case, may be treated as measured at the nominal level.
• Measures are not perfect, and there may be two types of mea-surement error. Systematic error refers to predictable error and should be minimized. Random error is unpredictable in terms of effect on measurement.
• Measurement reliability is a prerequisite for measurement validity, although reliable measures are not necessarily valid. Reliability can be assessed through a test–retest procedure, in terms of interitem consistency, through a comparison of responses to alternate forms of the test, or in terms of consis-tency among observers and in one observer over time.
• The validity of measures should always be tested. There are four basic approaches: face validation, content validation, criterion

The Practice of Research in Social Work108
validation (either predictive or concurrent), and construct validation. Criterion validation provides strong evidence of measurement validity, but there often is no criterion to use in validating social science measures.
• Some scales are used to screen for the presence or absence of a clinical condition and, therefore, use cut-off scores. The
accuracy of cut-off scores is assessed using measures of sensi-tivity and specificity.
• In reviewing studies of measurement reliability and validity, it is important to look at the samples to ensure that there is evidence of reliability and validity for different population subgroups.
Discussion Questions
1. Describe the relationship between a nominal definition and an operational definition of a concept. How are these two types of definitions related?
2. Describe the elements of an operational definition. What information about the measurement process is provided in an operational definition? What are the various options for opera-tionalizing concepts and gathering data? Describe the pros and
cons for using direct and indirect measures for research on child abuse and neglect.
3. What are the relative merits of the different forms of measure-ment reliability and validity?
4. Why is it important that the reliability and validity of any scale be evaluated with different populations?
Practice Exercises
1. Provide nominal and operational definitions for any of the fol-lowing concepts: self-esteem, school stress, child abuse, and alcohol abuse.
2. Write down two observable behaviors that you believe would provide feasible measures of the concept you have chosen.
3. Develop a scale by generating some questions that could serve as indicators for the concept you have chosen.
4. Outline a plan to assess the validity and reliability of the behav-ior measures and the scale.
5. Find a research study that uses a scale to measure some con-cept. How does the author justify the reliability and validity of the scale? Does the author convince you that the scale can be applied to the sample in the study?
6. In the study chosen in Exercise 5, what are the variables? What is the level of measurement for each variable?
Web Exercises
1. How would you define alcoholism? Write a brief definition. Based on this conceptualization, describe a method of mea-surement that would be valid for a study of alcoholism (as you define it). Now search online for various definitions of alcoholism. How similar or different is your definition? Your measure?
2. What is the definition of alcoholism used by the National Council on Alcoholism and Drug Dependence (NCADD)? How
is alcoholism conceptualized? Based on this conceptualization, give an example of one method that would be a valid measure-ment in a study of alcoholism.
3. Now look at some of the other related links accessible from the NCADD websites. What are some of the different con-ceptualizations of alcoholism that you find? How does the chosen conceptualization affect one’s choice of methods of measurement?
Chapter 4 Measurement 109
4. Compare two different measures of substance abuse. A site maintained by the University of New Mexico’s Center on Alcoholism, Substance Abuse, and Addictions (http://casaa .unm.edu/inst.html) provides a number of measures. Pick two of them. What concept of substance abuse is reflected in each
measure? Is either measure multidimensional? What do you think the relative advantages of each measure might be? What evidence is provided about their reliability and validity, or, if that information is not available, how might you go about testing these?
To complete the web exercises, please access the study site at www.sagepub.com/engelprsw3e, where you will find the exercises with accompanying links. You’ll also find other useful study materials, such as self-quizzes and eFlashcards for each chapter, along with a group of carefully selected articles from research journals that illustrate the major concepts and techniques presented in the book.
STUDENT STUDY SITE
Developing a Research Proposal
1. At this point, you can begin the process of conceptualization and operationalization.
2. Identify the concepts used in the study. Provide a nominal defi-nition for each concept. When possible, this definition should come from the existing literature—either a book you have read for a course or a research article.
3. How will the concepts be operationalized? Identify the vari-ables you will use to study the research question. Which of
these are independent or dependent variables? What is the level of measurement for each variable? How will these variables be coded?
4. Develop measurement procedures, or identify existing instru-ments that might be used. If you are using a new measure, what procedures will you use to determine the reliability and validity of the measure? If you are using an existing instrument, report the evidence for the instrument’s reliability and validity.
A Question of Ethics
1. The ethical guidelines for social work research require that subjects give their “informed consent” prior to participating in an interview. How informed do you think subjects have to be?
If you are interviewing people for a research project in order to learn about substance abuse and you learn that a person is abusing drugs or alcohol, what should you do?