chapter 01booksite.mkp.com/9780123838728/figures/pdf/chapter_01.pdf · chapter 01 authors: john...
TRANSCRIPT

Copyright © 2011, Elsevier Inc. All rights Reserved. 1
Chapter 01
Authors: John Hennessy & David Patterson

Copyright © 2011, Elsevier Inc. All rights Reserved. 2
Figure 1.1 Growth in processor performance since the late 1970s. This chart plots performance relative to the VAX 11/780 as measured by the SPEC benchmarks (see Section 1.8). Prior to the mid-1980s, processor performance growth was largely technology driven and averaged about 25% per year. The increase in growth to about 52% since then is attributable to more advanced architectural and organizational ideas. By 2003, this growth led to a difference in performance of about a factor of 25 versus if we had continued at the 25% rate. Performance for floating-point-oriented calculations has increased even faster. Since 2003, the limits of power and available instruction-level parallelism have slowed uniprocessor performance, to no more than 22% per year, or about 5 times slower than had we continued at 52% per year. (The fastest SPEC performance since 2007 has had automatic parallelization turned on with increasing number of cores per chip each year, so uniprocessor speed is harder to gauge. These results are limited to single-socket systems to reduce the impact of automatic parallelization.) Figure 1.11 on page 24 shows the improvement in clock rates for these same three eras. Since SPEC has changed over the years, performance of newer machines is estimated by a scaling factor that relates the performance for two different versions of SPEC (e.g., SPEC89, SPEC92, SPEC95, SPEC2000, and SPEC2006).

Copyright © 2011, Elsevier Inc. All rights Reserved. 3
Figure 1.6 MIPS64 instruction set architecture formats. All instructions are 32 bits long. The R format is for integer register-to-register operations, such as DADDU, DSUBU, and so on. The I format is for data transfers, branches, and immediate instructions, such as LD, SD, BEQZ, and DADDIs. The J format is for jumps, the FR format for floating-point operations, and the FI format for floating-point branches.

Copyright © 2011, Elsevier Inc. All rights Reserved. 4
Figure 1.9 Log–log plot of bandwidth and latency milestones from Figure 1.10 relative to the first milestone.Note that latency improved 6X to 80X while bandwidth improved about 300X to 25,000X. Updated fromPatterson [2004].

Copyright © 2011, Elsevier Inc. All rights Reserved. 5
Figure 1.11 Growth in clock rate of microprocessors in Figure 1.1. Between 1978 and 1986, the clock rate improved less than 15% peryear while performance improved by 25% per year. During the “renaissance period” of 52% performance improvement per year between1986 and 2003, clock rates shot up almost 40% per year. Since then, the clock rate has been nearly flat, growing at less than 1% per year,while single processor performance improved at less than 22% per year.
Copyright © 2011, Elsevier Inc. All rights Reserved. 6
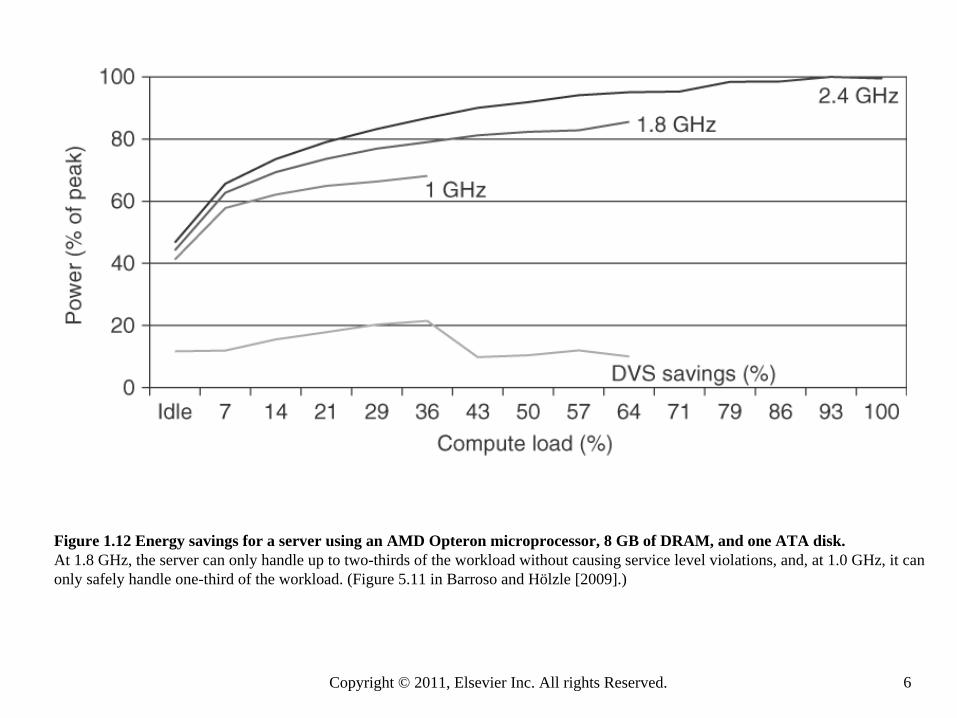
Figure 1.12 Energy savings for a server using an AMD Opteron microprocessor, 8 GB of DRAM, and one ATA disk. At 1.8 GHz, the server can only handle up to two-thirds of the workload without causing service level violations, and, at 1.0 GHz, it canonly safely handle one-third of the workload. (Figure 5.11 in Barroso and Hölzle [2009].)

Copyright © 2011, Elsevier Inc. All rights Reserved. 7
Figure 1.13 Photograph of an Intel Core i7 microprocessor die, which is evaluated in Chapters 2 through 5. The dimensions are 18.9 mm by 13.6 mm (257 mm2) in a 45 nm process. (Courtesy Intel.)
Copyright © 2011, Elsevier Inc. All rights Reserved. 8
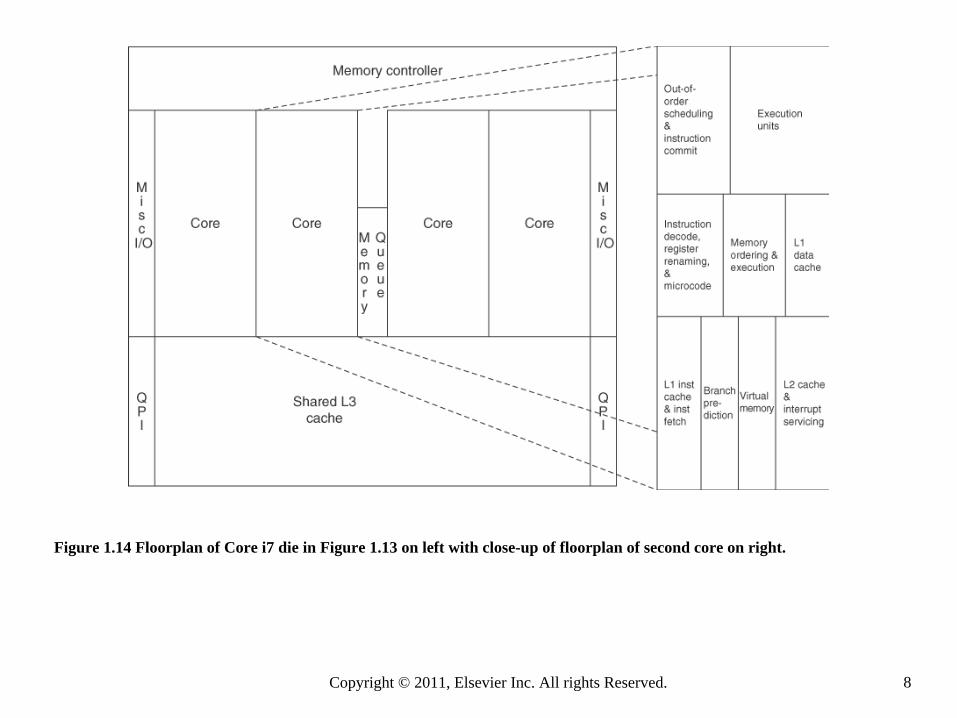
Figure 1.14 Floorplan of Core i7 die in Figure 1.13 on left with close-up of floorplan of second core on right.

Copyright © 2011, Elsevier Inc. All rights Reserved. 9
Figure 1.15 This 300 mm wafer contains 280 full Sandy Bridge dies, each 20.7 by 10.5 mm in a 32 nm process. (Sandy Bridge is Intel’s successor to Nehalem used in the Core i7.) At 216 mm2, the formula for dies per wafer estimates 282. (Courtesy Intel.)

Copyright © 2011, Elsevier Inc. All rights Reserved. 10
Figure 1.16 SPEC2006 programs and the evolution of the SPEC benchmarks over time, with integer programs above the line and floating-point programs below the line. Of the 12 SPEC2006 integer programs, 9 are written in C, and the rest in C++. For the floating- point programs, the split is 6 in Fortran, 4 in C++, 3 in C, and 4 in mixed C and Fortran. The figure shows all 70 of the programs in the 1989, 1992, 1995, 2000, and 2006 releases. The benchmark descriptions on the left are for SPEC2006 only and do not apply to earlier versions. Programs in the same row from different generations of SPEC are generally not related; for example, fpppp is not a CFD code like bwaves. Gcc is the senior citizen of the group. Only 3 integer programs and 3 floating-point programs survived three or more generations. Note that all the floating-point programs are new for SPEC2006. Although a few are carried over from generation to generation, the version of the program changes and either the input or the size of the benchmark is often changed to increase its running time and to avoid perturbation in measurement or domination of the execution time by some factor other than CPU time.

Copyright © 2011, Elsevier Inc. All rights Reserved. 11
Figure 1.19 Power-performance of the three servers in Figure 1.18. Ssj_ops/watt values are on the left axis, with the three columns associated with it, and watts are on the right axis, with the three lines associated with it. The horizontal axis shows the target workload, as it varies from 100% to Active Idle. The Intel-based R715 has the best ssj_ops/watt at each workload level, and it also consumes the lowest power at each level.

Copyright © 2011, Elsevier Inc. All rights Reserved. 12
Figure 1.20 Percentage of peak performance for four programs on four multiprocessors scaled to 64 processors. The Earth Simulator and X1 are vector processors (see Chapter 4 and Appendix G). Not only did they deliver a higher fraction of peak performance, but they also had the highest peak performance and the lowest clock rates. Except for the Paratec program, the Power 4 and Itanium 2 systems delivered between 5% and 10% of their peak. From Oliker et al. [2004].